Analysis of Crowdfunding Disclosures
![]()
![]()
This notebook illustrates how to perform exploratory data analysis on crowdfunding offering disclosures filed in SEC Form C. Since 2016, these disclosures have been presented in XML format by companies. Utilizing our Form C Crowdfunding API, we convert the data to a standardized JSON format, making it available for detailed analysis.
Our analysis will focus on several key areas:
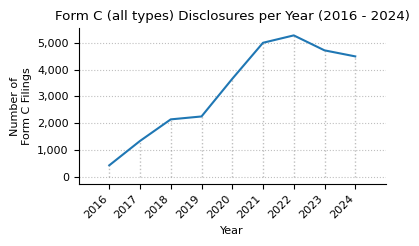
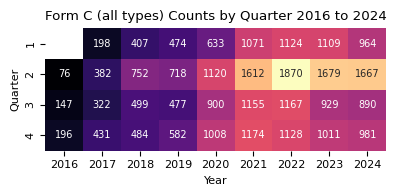
- Number of Form C disclosures made for the years from 2016 to 2024, per quarter, month and at what time of the day (pre-market, regular market, after-market)
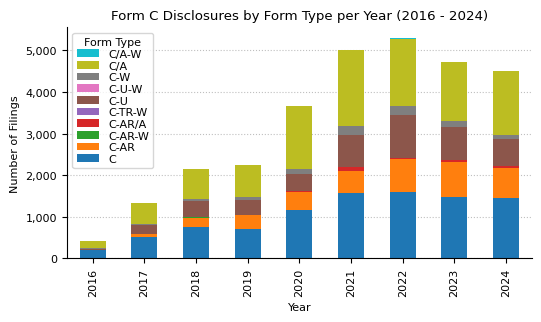
- Distribution of disclosures across structured data fields, such as the proportion of disclosures by form type
- Offering amounts by number of filings and in time
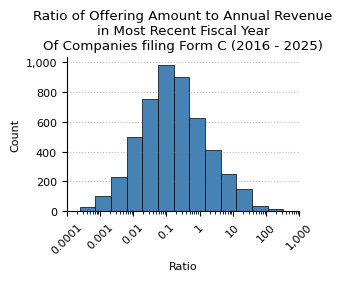
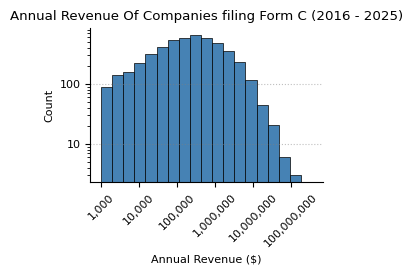
- Annual Revenue of companies and ratio of offering amount to revenue
Quick Start
To quickly retrieve data for a specific company, modify the following example as needed. For more detail, see Form C Crowdfunding API and sec-api-python package readme.
%pip install sec_api # use %pip for reliable install in current environment
# NOTE: Replace with your own API key
API_KEY_SEC_API = "YOUR_API_KEY"
from sec_api import FormCApi
import json

formCApi = FormCApi(api_key=API_KEY_SEC_API)

search_params = {
    "query": "cik:1277575",
    "from": "0",
    "size": "1",
    "sort": [{"filedAt": {"order": "desc"}}],
}

# get C filing metadata: issuer background, offering details,
# financial information, and more
response = formCApi.get_data(search_params)
form_c_filing = response["data"]

print(json.dumps(form_c_filing, indent=2))
[
  {
    "id": "a515ea985770a6566b42de0fe6e6411d",
    "accessionNo": "0001818274-25-000005",
    "fileNo": "020-34763",
    "formType": "C/A",
    "filedAt": "2025-01-31T17:04:04-05:00",
    "cik": "1277575",
    "ticker": "SCGX",
    "companyName": "SAXON CAPITAL GROUP INC",
    "issuerInformation": {
      "isAmendment": false,
      "natureOfAmendment": "The issuer is extending their offering till April 1, 2025.",
      "issuerInfo": {
        "nameOfIssuer": "SAXON CAPITAL GROUP INC",
        "legalStatus": {
          "legalStatusForm": "Corporation",
          "jurisdictionOrganization": "NV",
          "dateIncorporation": "11-12-2003"
        },
        "issuerAddress": {
          "street1": "7740 E GRAY RD",
          "street2": "#103",
          "city": "SCOTTSDALE",
          "stateOrCountry": "AZ",
          "zipCode": "85260"
        },
        "issuerWebsite": "https://energyglasssolar.com/"
      },
      "isCoIssuer": false,
      "companyName": "PicMii Crowdfunding LLC",
      "commissionCik": "0001817013",
      "commissionFileNumber": "007-00246",
      "crdNumber": "310171"
    },
    "offeringInformation": {
      "compensationAmount": "PicMii is a FINRA/SEC registered funding portal and will receive cash compensation equal to 4.9% of the value of the securities sold through Regulation CF and a $2,500 upfront fee and reimbursement for escrow expenses.",
      "financialInterest": "None.",
      "securityOfferedType": "Common Stock",
      "noOfSecurityOffered": 4000,
      "price": 2.5,
      "priceDeterminationMethod": "At issuer's discretion.",
      "offeringAmount": 10000,
      "overSubscriptionAccepted": true,
      "overSubscriptionAllocationType": "Other",
      "descOverSubscription": "At issuer's discretion.",
      "maximumOfferingAmount": 124000,
      "deadlineDate": "04-01-2025"
    },
    "annualReportDisclosureRequirements": {
      "currentEmployees": 10,
      "totalAssetMostRecentFiscalYear": 688311,
      "totalAssetPriorFiscalYear": 350459,
      "cashEquiMostRecentFiscalYear": 348575,
      "cashEquiPriorFiscalYear": 282926,
      "actReceivedMostRecentFiscalYear": 0,
      "actReceivedPriorFiscalYear": 0,
      "shortTermDebtMostRecentFiscalYear": 5227,
      "shortTermDebtPriorFiscalYear": 4600,
      "longTermDebtMostRecentFiscalYear": 0,
      "longTermDebtPriorFiscalYear": 0,
      "revenueMostRecentFiscalYear": 0,
      "revenuePriorFiscalYear": 0,
      "costGoodsSoldMostRecentFiscalYear": 0,
      "costGoodsSoldPriorFiscalYear": 0,
      "taxPaidMostRecentFiscalYear": 0,
      "taxPaidPriorFiscalYear": 0,
      "netIncomeMostRecentFiscalYear": -839854,
      "netIncomePriorFiscalYear": -566888,
      "issueJurisdictionSecuritiesOffering": [
        "AL",
        "AK",
        "AZ",
        "AR",
        "CA",
        "CO",
        "CT",
        "DE",
        "DC",
        "FL",
        "GA",
        "HI",
        "ID",
        "IL",
        "IN",
        "IA",
        "KS",
        "KY",
        "LA",
        "ME",
        "MD",
        "MA",
        "MI",
        "MN",
        "MS",
        "MO",
        "MT",
        "NE",
        "NV",
        "NH",
        "NJ",
        "NM",
        "NY",
        "NC",
        "ND",
        "OH",
        "OK",
        "OR",
        "PA",
        "PR",
        "RI",
        "SC",
        "SD",
        "TN",
        "TX",
        "UT",
        "VT",
        "VA",
        "WA",
        "WV",
        "WI",
        "WY",
        "A0",
        "A1",
        "A2",
        "A3",
        "A4",
        "A5",
        "A6",
        "A7",
        "A8",
        "A9",
        "B0",
        "Z4"
      ]
    },
    "signatureInfo": {
      "issuerSignature": {
        "issuer": "SAXON CAPITAL GROUP INC",
        "issuerSignature": "Clifford Paul",
        "issuerTitle": "CEO"
      },
      "signaturePersons": [
        {
          "personSignature": "Clifford Paul",
          "personTitle": "CEO",
          "signatureDate": "01-31-2025"
        }
      ]
    }
  }
]
Download Dataset
To load and prepare the dataset of over 30,000 proxy voting record disclosures from Form C in since 2016, we utilize the Form C Proxy Voting Records API. The following code handles data loading and preparation by executing multiple download processes in parallel, significantly reducing downloading time.
Once downloaded, all data objects are saved in JSONL format to ./form-c-dataset.jsonl, which will serve as the dataset for the first part of the analysis.
Downloading the data may take several minutes.
import sys
import time
import random

# from multiprocessing import Pool # use in .py files only
from concurrent.futures import ThreadPoolExecutor

YEARS = range(2025, 2015, -1)  # from 2025 to 2016
TEMP_FILE_TEMPLATE = "./temp_file_form_c_{}.jsonl"
TARGET_FILE = "./form-c-dataset.jsonl"


def process_year(year):
    backoff_time = random.randint(10, 800) / 1000
    print(f"Starting year {year} with backoff time {backoff_time:,}s")
    sys.stdout.flush()
    time.sleep(backoff_time)

    tmp_filename = TEMP_FILE_TEMPLATE.format(year)
    tmp_file = open(tmp_filename, "a")

    for month in range(12, 0, -1):
        search_from = 0
        month_counter = 0

        while True:
            query = f"filedAt:[{year}-{month:02d}-01 TO {year}-{month:02d}-31]"
            searchRequest = {
                "query": query,
                "from": search_from,
                "size": "50",
                "sort": [{"filedAt": {"order": "desc"}}],
            }

            response = None
            try:
                response = formCApi.get_data(searchRequest)
            except Exception as e:
                print(f"{year}-{month:02d} error: {e}")
                sys.stdout.flush()
                continue

            if response == None or len(response["data"]) == 0:
                break

            search_from += 50
            month_counter += len(response["data"])
            jsonl_data = "\n".join([json.dumps(entry) for entry in response["data"]])
            tmp_file.write(jsonl_data + "\n")

        print(f"Finished loading {month_counter} Form C for {year}-{month:02d}")
        sys.stdout.flush()

    tmp_file.close()

    return year


if not os.path.exists(TARGET_FILE):
    with ThreadPoolExecutor(max_workers=4) as pool:
        processed_years = list(pool.map(process_year, YEARS))
    print("Finished processing all years.", processed_years)

    # merge the temporary files into one final file
    with open(TARGET_FILE, "a") as outfile:
        for year in YEARS:
            temp_file = TEMP_FILE_TEMPLATE.format(year)
            if os.path.exists(temp_file):
                with open(temp_file, "r") as infile:
                    outfile.write(infile.read())
else:
    print("File already exists. Skipping download.")
File already exists. Skipping download.
# install all dependencies required for the notebook
%pip install -r requirements.txt
import pandas as pd
import numpy as np
import matplotlib.pyplot as plt
import matplotlib.style as style
import matplotlib.ticker as mtick
import seaborn as sns

style.use("default")

params = {
    "axes.labelsize": 8,
    "font.size": 8,
    "legend.fontsize": 8,
    "xtick.labelsize": 8,
    "ytick.labelsize": 8,
    "font.family": "sans-serif",
    "axes.spines.top": False,
    "axes.spines.right": False,
    "grid.color": "grey",
    "axes.grid": True,
    "axes.grid.axis": "y",
    "grid.alpha": 0.5,
    "grid.linestyle": ":",
}

plt.rcParams.update(params)
TARGET_FILE = "form-c-dataset.jsonl"
structured_data = pd.read_json(TARGET_FILE, lines=True)
structured_data = pd.json_normalize(structured_data.to_dict(orient="records"))

structured_data["filedAt"] = pd.to_datetime(structured_data["filedAt"], utc=True)
structured_data["filedAt"] = structured_data["filedAt"].dt.tz_convert("US/Eastern")
structured_data = structured_data.sort_values("filedAt", ascending=True).reset_index(
    drop=True
)
structured_data.drop_duplicates("accessionNo", keep="first", inplace=True)
structured_data["year"] = structured_data["filedAt"].dt.year
structured_data["month"] = structured_data["filedAt"].dt.month
structured_data["qtr"] = structured_data["month"].apply(lambda x: (x - 1) // 3 + 1)
structured_data["dayOfWeek"] = structured_data["filedAt"].dt.day_name()
# filedAtClass: preMarket (4:00AM-9:30AM), regularMarket (9:30AM-4:00PM), afterMarket (4:00PM-8:00PM)
structured_data["filedAtClass"] = structured_data["filedAt"].apply(
    lambda x: (
        "preMarket"
        if x.hour < 9 or (x.hour == 9 and x.minute < 30)
        else (
            "regularMarket"
            if x.hour < 16
            else "afterMarket" if x.hour < 20 else "other"
        )
    )
)

structured_data.head()

unique_years = structured_data["year"].nunique()
unique_companies = structured_data["cik"].nunique()
unique_filings = structured_data["accessionNo"].nunique()
min_year = structured_data["year"].min()
max_year = structured_data["year"].max()
max_year_full = max_year - 1  # to avoid incomplete data for the current year
print("Loaded dataframe with main documents of Form C Crowdfunding filings")
print(f"Number of filings: {unique_filings:,}")
print(f"Number of records: {len(structured_data):,}")
print(f"Number of years: {unique_years:,} ({min_year}-{max_year})")
print(f"Number of unique companies: {unique_companies:,}")

# structured_data.head()
Loaded dataframe with main documents of Form C Crowdfunding filings
Number of filings: 29,870
Number of records: 29,870
Number of years: 10 (2016-2025)
Number of unique companies: 8,041
structured_data.info()
<class 'pandas.core.frame.DataFrame'>
RangeIndex: 29870 entries, 0 to 29869
Data columns (total 73 columns):
 #   Column                                                                  Non-Null Count  Dtype
---  ------                                                                  --------------  -----
 0   id                                                                      29870 non-null  object
 1   accessionNo                                                             29870 non-null  object
 2   fileNo                                                                  29870 non-null  object
 3   formType                                                                29870 non-null  object
 4   filedAt                                                                 29870 non-null  datetime64[ns, US/Eastern]
 5   cik                                                                     29870 non-null  int64
 6   ticker                                                                  29870 non-null  object
 7   companyName                                                             29870 non-null  object
 8   periodOfReport                                                          4179 non-null   object
 9   issuerInformation.isAmendment                                           10190 non-null  object
 10  issuerInformation.natureOfAmendment                                     10262 non-null  object
 11  issuerInformation.issuerInfo.nameOfIssuer                               29870 non-null  object
 12  issuerInformation.issuerInfo.legalStatus.legalStatusForm                28808 non-null  object
 13  issuerInformation.issuerInfo.legalStatus.jurisdictionOrganization       28808 non-null  object
 14  issuerInformation.issuerInfo.legalStatus.dateIncorporation              28808 non-null  object
 15  issuerInformation.issuerInfo.issuerAddress.street1                      28808 non-null  object
 16  issuerInformation.issuerInfo.issuerAddress.street2                      9087 non-null   object
 17  issuerInformation.issuerInfo.issuerAddress.city                         28808 non-null  object
 18  issuerInformation.issuerInfo.issuerAddress.stateOrCountry               28808 non-null  object
 19  issuerInformation.issuerInfo.issuerAddress.zipCode                      28808 non-null  object
 20  issuerInformation.issuerInfo.issuerWebsite                              28808 non-null  object
 21  issuerInformation.isCoIssuer                                            18442 non-null  object
 22  issuerInformation.coIssuers                                             2265 non-null   object
 23  issuerInformation.companyName                                           24623 non-null  object
 24  issuerInformation.commissionCik                                         24623 non-null  object
 25  issuerInformation.commissionFileNumber                                  24623 non-null  object
 26  issuerInformation.crdNumber                                             15841 non-null  object
 27  offeringInformation.compensationAmount                                  24529 non-null  object
 28  offeringInformation.financialInterest                                   24109 non-null  object
 29  offeringInformation.securityOfferedType                                 24530 non-null  object
 30  offeringInformation.securityOfferedOtherDesc                            10479 non-null  object
 31  offeringInformation.noOfSecurityOffered                                 19373 non-null  float64
 32  offeringInformation.price                                               23458 non-null  float64
 33  offeringInformation.priceDeterminationMethod                            20883 non-null  object
 34  offeringInformation.offeringAmount                                      24530 non-null  float64
 35  offeringInformation.overSubscriptionAccepted                            24530 non-null  object
 36  offeringInformation.overSubscriptionAllocationType                      24174 non-null  object
 37  offeringInformation.descOverSubscription                                13696 non-null  object
 38  offeringInformation.maximumOfferingAmount                               24174 non-null  float64
 39  offeringInformation.deadlineDate                                        24530 non-null  object
 40  annualReportDisclosureRequirements.currentEmployees                     28715 non-null  float64
 41  annualReportDisclosureRequirements.totalAssetMostRecentFiscalYear       28715 non-null  float64
 42  annualReportDisclosureRequirements.totalAssetPriorFiscalYear            28715 non-null  float64
 43  annualReportDisclosureRequirements.cashEquiMostRecentFiscalYear         28715 non-null  float64
 44  annualReportDisclosureRequirements.cashEquiPriorFiscalYear              28715 non-null  float64
 45  annualReportDisclosureRequirements.actReceivedMostRecentFiscalYear      28715 non-null  float64
 46  annualReportDisclosureRequirements.actReceivedPriorFiscalYear           28715 non-null  float64
 47  annualReportDisclosureRequirements.shortTermDebtMostRecentFiscalYear    28715 non-null  float64
 48  annualReportDisclosureRequirements.shortTermDebtPriorFiscalYear         28715 non-null  float64
 49  annualReportDisclosureRequirements.longTermDebtMostRecentFiscalYear     28715 non-null  float64
 50  annualReportDisclosureRequirements.longTermDebtPriorFiscalYear          28715 non-null  float64
 51  annualReportDisclosureRequirements.revenueMostRecentFiscalYear          28715 non-null  float64
 52  annualReportDisclosureRequirements.revenuePriorFiscalYear               28715 non-null  float64
 53  annualReportDisclosureRequirements.costGoodsSoldMostRecentFiscalYear    28715 non-null  float64
 54  annualReportDisclosureRequirements.costGoodsSoldPriorFiscalYear         28715 non-null  float64
 55  annualReportDisclosureRequirements.taxPaidMostRecentFiscalYear          28715 non-null  float64
 56  annualReportDisclosureRequirements.taxPaidPriorFiscalYear               28715 non-null  float64
 57  annualReportDisclosureRequirements.netIncomeMostRecentFiscalYear        28715 non-null  float64
 58  annualReportDisclosureRequirements.netIncomePriorFiscalYear             28715 non-null  float64
 59  annualReportDisclosureRequirements.issueJurisdictionSecuritiesOffering  24528 non-null  object
 60  signatureInfo.issuerSignature.issuer                                    29870 non-null  object
 61  signatureInfo.issuerSignature.issuerSignature                           29870 non-null  object
 62  signatureInfo.issuerSignature.issuerTitle                               29870 non-null  object
 63  signatureInfo.signaturePersons                                          29870 non-null  object
 64  issuerInformation.progressUpdate                                        4731 non-null   object
 65  offeringInformation                                                     0 non-null      float64
 66  annualReportDisclosureRequirements                                      0 non-null      float64
 67  issuerInformation.issuerInfo.legalStatus.legalStatusOtherDesc           373 non-null    object
 68  year                                                                    29870 non-null  int32
 69  month                                                                   29870 non-null  int32
 70  qtr                                                                     29870 non-null  int64
 71  dayOfWeek                                                               29870 non-null  object
 72  filedAtClass                                                            29870 non-null  object
dtypes: datetime64[ns, US/Eastern](1), float64(25), int32(2), int64(2), object(43)
memory usage: 16.4+ MB
structured_data_full_years = structured_data[
    structured_data["year"].between(min_year, max_year - 1)
]
def plot_timeseries(ts, title):
    fig, ax = plt.subplots(figsize=(4, 2.5))
    ts["count"].plot(ax=ax, legend=False)
    ax.set_title(title)
    ax.set_xlabel("Year")
    ax.set_ylabel("Number of\nForm C Filings")
    ax.set_xticks(np.arange(min_year, max_year, 1))
    ax.yaxis.set_major_formatter(mtick.StrMethodFormatter("{x:,.0f}"))
    ax.set_xlim(min_year - 1, max_year)
    ax.grid(axis="x")
    ax.set_axisbelow(True)
    plt.xticks(rotation=45, ha="right")

    for year in range(min_year, max_year, 1):
        year_y_max = ts.loc[year, "count"]
        ax.vlines(year, 0, year_y_max, linestyles=":", colors="grey", alpha=0.5, lw=1)

    plt.tight_layout()
    plt.show()


form_c_counts = (
    structured_data_full_years.drop_duplicates(subset=["accessionNo"])
    .groupby(["year"])
    .size()
    .to_frame(name="count")
)

plot_timeseries(
    form_c_counts,
    title=f"Form C (all types) Disclosures per Year ({min_year} - {max_year_full})",
)
count_formType = (
    structured_data_full_years.drop_duplicates(subset=["accessionNo"])
    .groupby(["formType"])
    .size()
    .sort_values(ascending=False)
    .to_frame(name="Count")
).rename_axis("Submission Type")
count_formType["Pct"] = (
    count_formType["Count"].astype(int) / count_formType["Count"].astype(int).sum()
).map("{:.0%}".format)
count_formType["Count"] = count_formType["Count"].map(lambda x: f"{x:,}")

print(f"Form C Disclosures by Submission Type ({min_year} - {max_year_full})")
count_formType
Form C Disclosures by Submission Type (2016 - 2024)
| Count | Pct | |
|---|---|---|
| Submission Type | ||
| C/A | 10,065 | 34% |
| C | 9,461 | 32% |
| C-U | 4,593 | 16% |
| C-AR | 3,911 | 13% |
| C-W | 979 | 3% |
| C-AR/A | 251 | 1% |
| C/A-W | 28 | 0% |
| C-U-W | 22 | 0% |
| C-TR-W | 18 | 0% |
| C-AR-W | 9 | 0% |
form_c_counts_by_type = (
    structured_data_full_years.drop_duplicates(subset=["accessionNo"])
    .groupby(["year", "formType"])
    .size()
    .to_frame(name="count")
    .unstack(fill_value=0)
)

form_c_counts_by_type.loc["Total"] = form_c_counts_by_type.sum()
form_c_counts_by_type["Total"] = form_c_counts_by_type.sum(axis=1)


print(f"Form C counts from {min_year} to {max_year_full}.")
form_c_counts_by_type
Form C counts from 2016 to 2024.
| count | Total | ||||||||||
|---|---|---|---|---|---|---|---|---|---|---|---|
| formType | C | C-AR | C-AR-W | C-AR/A | C-TR-W | C-U | C-U-W | C-W | C/A | C/A-W | |
| year | |||||||||||
| 2016 | 192 | 0 | 0 | 0 | 0 | 35 | 0 | 15 | 173 | 4 | 419 |
| 2017 | 524 | 59 | 0 | 9 | 0 | 198 | 1 | 45 | 494 | 3 | 1333 |
| 2018 | 763 | 218 | 3 | 16 | 1 | 366 | 2 | 54 | 718 | 1 | 2142 |
| 2019 | 717 | 324 | 1 | 11 | 0 | 345 | 1 | 67 | 785 | 0 | 2251 |
| 2020 | 1164 | 436 | 1 | 14 | 1 | 402 | 2 | 135 | 1504 | 2 | 3661 |
| 2021 | 1582 | 513 | 0 | 101 | 2 | 772 | 3 | 198 | 1834 | 7 | 5012 |
| 2022 | 1601 | 784 | 1 | 28 | 2 | 1030 | 10 | 218 | 1609 | 6 | 5289 |
| 2023 | 1479 | 842 | 3 | 35 | 5 | 799 | 0 | 139 | 1425 | 1 | 4728 |
| 2024 | 1439 | 735 | 0 | 37 | 7 | 646 | 3 | 108 | 1523 | 4 | 4502 |
| Total | 9461 | 3911 | 9 | 251 | 18 | 4593 | 22 | 979 | 10065 | 28 | 29337 |
fig, ax = plt.subplots(figsize=(6, 3))
form_c_counts_by_type["count"].drop("Total").plot(kind="bar", stacked=True, ax=ax)
ax.set_xlabel("Year")
ax.set_ylabel("Number of Filings")
ax.yaxis.set_major_formatter(mtick.StrMethodFormatter("{x:,.0f}"))
ax.grid(axis="x")
ax.set_axisbelow(True)
handles, labels = ax.get_legend_handles_labels()
ax.legend(
    list(reversed(handles)),
    list(reversed(labels)),
    title="Form Type",
    labelspacing=0.15,
)
ax.set_title(f"Form C Disclosures by Form Type per Year ({min_year} - {max_year_full})")
plt.show()
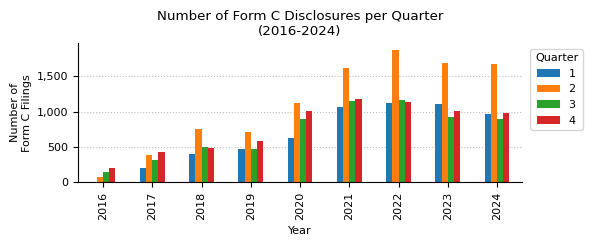
counts_qtr_yr_piv = (
    structured_data_full_years.groupby(["year", "qtr"]).size().unstack().fillna(0)
).astype(int)

print(f"Form C (all types) counts by quarter from {min_year} to {max_year_full}.")
counts_qtr_yr_piv.T
Form C (all types) counts by quarter from 2016 to 2024.
| year | 2016 | 2017 | 2018 | 2019 | 2020 | 2021 | 2022 | 2023 | 2024 |
|---|---|---|---|---|---|---|---|---|---|
| qtr | |||||||||
| 1 | 0 | 198 | 407 | 474 | 633 | 1071 | 1124 | 1109 | 964 |
| 2 | 76 | 382 | 752 | 718 | 1120 | 1612 | 1870 | 1679 | 1667 |
| 3 | 147 | 322 | 499 | 477 | 900 | 1155 | 1167 | 929 | 890 |
| 4 | 196 | 431 | 484 | 582 | 1008 | 1174 | 1128 | 1011 | 981 |
plt.figure(figsize=(4, 2))
sns.heatmap(
    counts_qtr_yr_piv.T,
    annot=True,  # Display the cell values
    fmt="d",  # Integer formatting
    cmap="magma",  # Color map
    cbar_kws={"label": "Count"},  # Colorbar label
    mask=counts_qtr_yr_piv.T == 0,  # Mask the cells with value 0
    cbar=False,
    annot_kws={"fontsize": 7},
)
plt.grid(False)
plt.title(f"Form C (all types) Counts by Quarter {min_year} to {max_year_full}")
plt.xlabel("Year")
plt.ylabel("Quarter")
plt.tight_layout()
plt.show()
counts_qtr_yr = counts_qtr_yr_piv.stack().reset_index(name="count")

fig, ax = plt.subplots(figsize=(6, 2.5))
counts_qtr_yr_piv.plot(kind="bar", ax=ax, legend=True)
ax.legend(title="Quarter", loc="upper right", bbox_to_anchor=(1.15, 1))
ax.set_title(f"Number of Form C Disclosures per Quarter\n({min_year}-{max_year_full})")
ax.set_xlabel("Year")
ax.set_ylabel("Number of\nForm C Filings")
ax.yaxis.set_major_formatter(mtick.StrMethodFormatter("{x:,.0f}"))
ax.grid(axis="x")
ax.set_axisbelow(True)
plt.tight_layout()
plt.show()
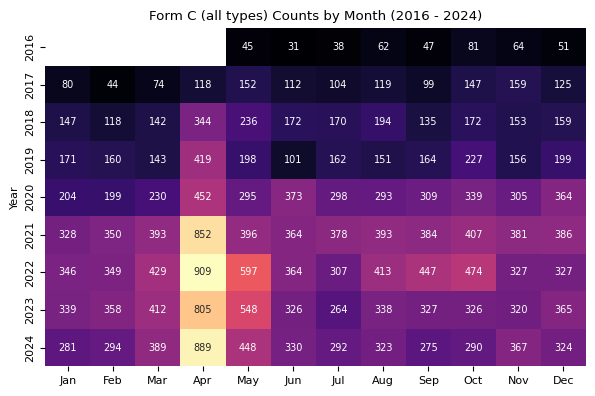
counts_month_yr_piv = (
    structured_data_full_years.groupby(["year", "month"]).size().unstack().fillna(0)
).astype(int)

plt.figure(figsize=(6, 4))
sns.heatmap(
    counts_month_yr_piv,
    annot=True,
    fmt="d",
    cmap="magma",
    cbar_kws={"label": "Count"},
    mask=counts_month_yr_piv == 0,
    cbar=False,
    annot_kws={"size": 7},
)
# convert x-labels to month names: 1 => Jan, 2 => Feb, etc.
plt.xticks(
    ticks=np.arange(0.5, 12.5, 1),
    labels=[pd.to_datetime(str(i), format="%m").strftime("%b") for i in range(1, 13)],
)
plt.grid(False)
plt.title(f"Form C (all types) Counts by Month ({min_year} - {max_year_full})")
plt.xlabel("")
plt.ylabel("Year")
plt.tight_layout()
plt.show()
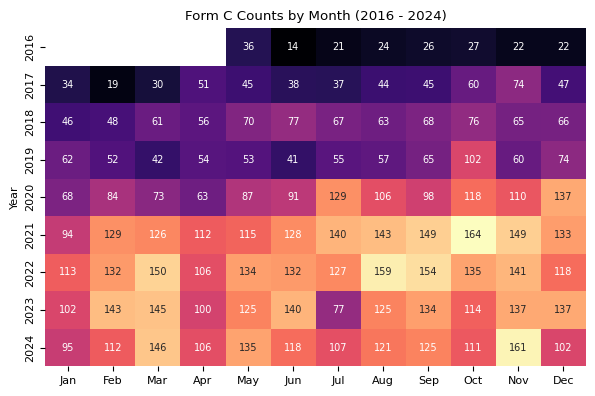
counts_c_only_month_yr_piv = (
    structured_data_full_years[structured_data_full_years["formType"] == "C"]
    .groupby(["year", "month"])
    .size()
    .unstack()
    .fillna(0)
).astype(int)

plt.figure(figsize=(6, 4))
sns.heatmap(
    counts_c_only_month_yr_piv,
    annot=True,
    fmt="d",
    cmap="magma",
    cbar_kws={"label": "Count"},
    mask=counts_c_only_month_yr_piv == 0,
    cbar=False,
    annot_kws={"size": 7},
)
# convert x-labels to month names: 1 => Jan, 2 => Feb, etc.
plt.xticks(
    ticks=np.arange(0.5, 12.5, 1),
    labels=[pd.to_datetime(str(i), format="%m").strftime("%b") for i in range(1, 13)],
)
plt.grid(False)
plt.title(f"Form C Counts by Month ({min_year} - {max_year_full})")
plt.xlabel("")
plt.ylabel("Year")
plt.tight_layout()
plt.show()
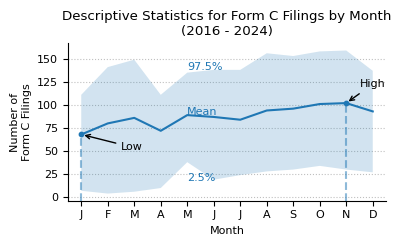
print(
    f"Descriptive statistics for Form C counts by month from {min_year} to {max_year_full}."
)
month_stats = (
    counts_c_only_month_yr_piv.loc[2004:]
    .describe(percentiles=[0.025, 0.975])
    .round(0)
    .astype(int)
)
month_stats
Descriptive statistics for Form C counts by month from 2016 to 2024.
| month | 1 | 2 | 3 | 4 | 5 | 6 | 7 | 8 | 9 | 10 | 11 | 12 |
|---|---|---|---|---|---|---|---|---|---|---|---|---|
| count | 9 | 9 | 9 | 9 | 9 | 9 | 9 | 9 | 9 | 9 | 9 | 9 |
| mean | 68 | 80 | 86 | 72 | 89 | 87 | 84 | 94 | 96 | 101 | 102 | 93 |
| std | 37 | 52 | 57 | 37 | 40 | 47 | 43 | 48 | 47 | 41 | 48 | 42 |
| min | 0 | 0 | 0 | 0 | 36 | 14 | 21 | 24 | 26 | 27 | 22 | 22 |
| 2.5% | 7 | 4 | 6 | 10 | 38 | 19 | 24 | 28 | 30 | 34 | 30 | 27 |
| 50% | 68 | 84 | 73 | 63 | 87 | 91 | 77 | 106 | 98 | 111 | 110 | 102 |
| 97.5% | 111 | 141 | 149 | 111 | 135 | 138 | 138 | 156 | 153 | 158 | 159 | 137 |
| max | 113 | 143 | 150 | 112 | 135 | 140 | 140 | 159 | 154 | 164 | 161 | 137 |
def plot_box_plot_as_line(
    data: pd.DataFrame,
    x_months=True,
    title="",
    x_label="",
    x_pos_mean_label=2,
    pos_labels=None,
    pos_high_low=None,
    y_label="",
    y_formatter=lambda x, p: "{:.0f}".format(int(x) / 1000),
    show_high_low_labels=True,
    show_inline_labels=True,
    show_bands=True,
    figsize=(4, 2.5),
    line_source="mean",
):
    fig, ax = plt.subplots(figsize=figsize)

    line_to_plot = data[line_source]
    lower_label = "2.5%"
    upper_label = "97.5%"
    lower = data[lower_label]
    upper = data[upper_label]

    line_to_plot.plot(ax=ax)

    if show_bands:
        ax.fill_between(line_to_plot.index, lower, upper, alpha=0.2)

    if x_months:
        ax.set_xlim(0.5, 12.5)
        ax.set_xticks(range(1, 13))
        ax.set_xticklabels(["J", "F", "M", "A", "M", "J", "J", "A", "S", "O", "N", "D"])

    ax.yaxis.set_major_formatter(mtick.FuncFormatter(y_formatter))
    ax.set_ylabel(y_label)
    ax.set_xlabel(x_label)
    ax.set_title(title)

    ymin, ymax = ax.get_ylim()
    y_scale = ymax - ymin

    max_x = int(line_to_plot.idxmax())
    max_y = line_to_plot.max()
    min_x = int(line_to_plot.idxmin())
    min_y = line_to_plot.min()

    ax.axvline(
        max_x,
        ymin=0,
        ymax=((max_y - ymin) / (ymax - ymin)),
        linestyle="dashed",
        color="tab:blue",
        alpha=0.5,
    )
    ax.scatter(max_x, max_y, color="tab:blue", s=10)
    ax.axvline(
        min_x,
        ymin=0,
        ymax=((min_y - ymin) / (ymax - ymin)),
        linestyle="dashed",
        color="tab:blue",
        alpha=0.5,
    )
    ax.scatter(min_x, min_y, color="tab:blue", s=10)

    x_pos_mean_label_int = int(x_pos_mean_label)
    if show_inline_labels:
        mean_x = x_pos_mean_label
        mean_y = line_to_plot.iloc[x_pos_mean_label_int] * 1.02
        upper_x = x_pos_mean_label
        upper_y = upper.iloc[x_pos_mean_label_int]
        lower_x = x_pos_mean_label
        lower_y = lower.iloc[x_pos_mean_label_int] * 0.95

        if pos_labels:
            mean_x = pos_labels["mean"]["x"]
            mean_y = pos_labels["mean"]["y"]
            upper_x = pos_labels["upper"]["x"]
            upper_y = pos_labels["upper"]["y"]
            lower_x = pos_labels["lower"]["x"]
            lower_y = pos_labels["lower"]["y"]

        ax.text(mean_x, mean_y, "Mean", color="tab:blue", fontsize=8)
        ax.text(upper_x, upper_y, upper_label, color="tab:blue", fontsize=8)
        ax.text(lower_x, lower_y, lower_label, color="tab:blue", fontsize=8)

    if show_high_low_labels:
        high_x_origin = max_x
        high_y_origin = max_y
        high_x_label = high_x_origin + 0.5
        high_y_label = high_y_origin + 0.1 * y_scale
        if pos_high_low:
            high_x_label = pos_high_low["high"]["x"]
            high_y_label = pos_high_low["high"]["y"]
        ax.annotate(
            "High",
            (high_x_origin, high_y_origin),
            xytext=(high_x_label, high_y_label),
            arrowprops=dict(facecolor="black", arrowstyle="->"),
        )

        low_x_origin = min_x * 1.01
        low_y_origin = min_y
        low_x_label = low_x_origin + 1.5
        low_y_label = low_y_origin - 0.1 * y_scale
        if pos_high_low:
            low_x_label = pos_high_low["low"]["x"]
            low_y_label = pos_high_low["low"]["y"]
        ax.annotate(
            "Low",
            (low_x_origin, low_y_origin),
            xytext=(low_x_label, low_y_label),
            arrowprops=dict(facecolor="black", arrowstyle="->"),
        )

    ax.grid(axis="x")
    ax.set_axisbelow(True)

    plt.tight_layout()
    plt.show()


plot_box_plot_as_line(
    data=month_stats.T,
    title=f"Descriptive Statistics for Form C Filings by Month\n({min_year} - {max_year_full})",
    x_label="Month",
    y_label="Number of\nForm C Filings",
    y_formatter=lambda x, p: "{:.0f}".format(int(x)),
    x_pos_mean_label=5,
)
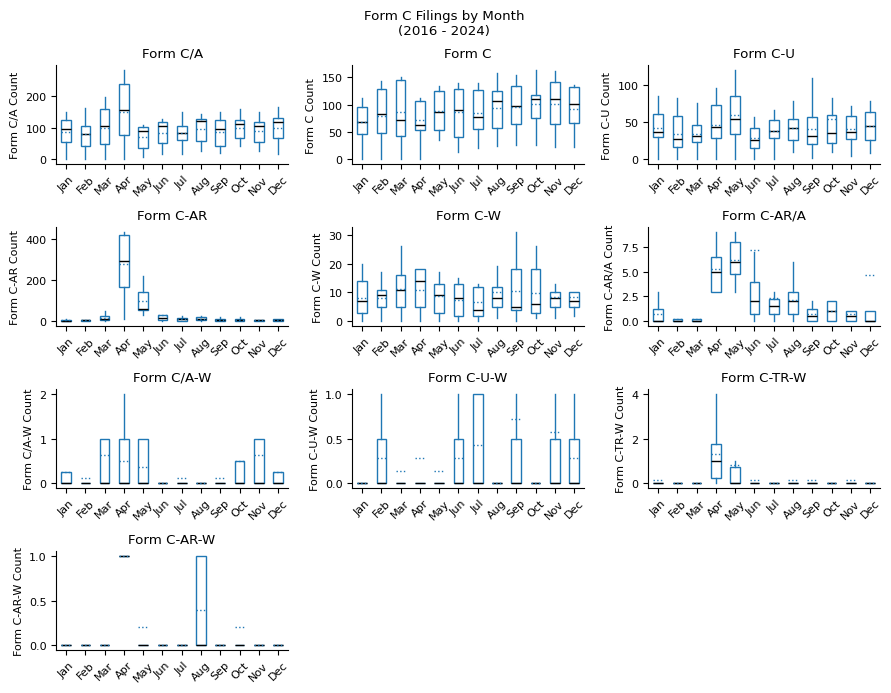
form_types = count_formType.index.tolist()

fig, axes = plt.subplots(4, 3, figsize=(9, 7))

cnt = 0
for formType in form_types:

    data = (
        structured_data_full_years[structured_data_full_years["formType"] == formType]
        .groupby(["year", "month"])
        .size()
        .unstack()
        .fillna(0)
        .reindex(columns=range(1, 13), fill_value=0)  # ensure all month are included
    )

    # if data.sum().sum() < 100:
    #     continue

    ax = axes.flatten()[cnt]
    cnt += 1
    try:
        data.boxplot(
            ax=ax,
            grid=False,
            showfliers=False,
            flierprops=dict(marker="o", markersize=3),
            patch_artist=True,
            boxprops=dict(facecolor="white", color="tab:blue"),
            showmeans=True,
            meanline=True,
            meanprops={"color": "tab:blue", "linestyle": ":"},
            medianprops={"color": "black"},
            capprops={"color": "none"},
        )

        ax.set_title(f"Form {formType}")
        ax.set_xlabel("")
        ax.set_ylabel(f"Form {formType} Count")
        xticklabels = [
            pd.to_datetime(str(x), format="%m").strftime("%b") for x in range(1, 13)
        ]
        ax.set_xticklabels(xticklabels)
        ax.tick_params(axis="x", rotation=45)
    except Exception as e:
        print(f"Error: {e}")

# disable the empty subplots
for i in range(cnt, 12):
    axes.flatten()[i].axis("off")

fig.suptitle(f"Form C Filings by Month\n({min_year} - {max_year_full})")
plt.tight_layout()
plt.show()
counts_per_month_by_formType = (
    structured_data[["year", "month", "accessionNo", "formType"]]
    .groupby(["year", "month", "formType"])
    .count()
    .rename(columns={"accessionNo": "count"})
    .pivot_table(
        index=["year", "month"],  # Rows
        columns="formType",  # Columns
        values="count",  # Values to fill
        fill_value=0,  # Replace NaN with 0
    )
    .astype(int)
    .reset_index()  # Make year and month normal columns
)

counts_per_month_by_formType
| formType | year | month | C | C-AR | C-AR-W | C-AR/A | C-TR-W | C-U | C-U-W | C-W | C/A | C/A-W |
|---|---|---|---|---|---|---|---|---|---|---|---|---|
| 0 | 2016 | 5 | 36 | 0 | 0 | 0 | 0 | 0 | 0 | 0 | 9 | 0 |
| 1 | 2016 | 6 | 14 | 0 | 0 | 0 | 0 | 0 | 0 | 1 | 16 | 0 |
| 2 | 2016 | 7 | 21 | 0 | 0 | 0 | 0 | 0 | 0 | 0 | 17 | 0 |
| 3 | 2016 | 8 | 24 | 0 | 0 | 0 | 0 | 10 | 0 | 2 | 26 | 0 |
| 4 | 2016 | 9 | 26 | 0 | 0 | 0 | 0 | 2 | 0 | 0 | 19 | 0 |
| ... | ... | ... | ... | ... | ... | ... | ... | ... | ... | ... | ... | ... |
| 101 | 2024 | 10 | 111 | 18 | 0 | 2 | 0 | 35 | 0 | 3 | 121 | 0 |
| 102 | 2024 | 11 | 161 | 13 | 0 | 3 | 1 | 69 | 0 | 3 | 116 | 1 |
| 103 | 2024 | 12 | 102 | 11 | 0 | 1 | 0 | 79 | 1 | 7 | 123 | 0 |
| 104 | 2025 | 1 | 101 | 13 | 0 | 0 | 0 | 71 | 0 | 2 | 118 | 0 |
| 105 | 2025 | 2 | 68 | 10 | 0 | 0 | 0 | 67 | 0 | 4 | 79 | 0 |
106 rows × 12 columns
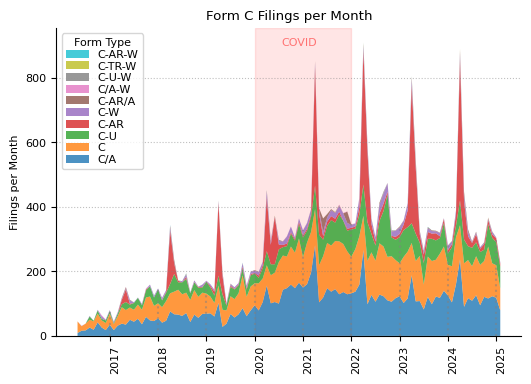
fix, ax = plt.subplots(figsize=(6, 4))

ax.stackplot(
    counts_per_month_by_formType["year"].astype(str)
    + "-"
    + counts_per_month_by_formType["month"].astype(str),
    *[counts_per_month_by_formType[ft] for ft in form_types],
    labels=[f"{ft}" for ft in form_types],
    alpha=0.8,
)
handles, labels = ax.get_legend_handles_labels()
ax.legend(
    list(reversed(handles)),
    list(reversed(labels)),
    title="Form Type",
    labelspacing=0.15,
)

ax.set_title("Form C Filings per Month")
ax.set_ylabel("Filings per Month")
xticks = (
    counts_per_month_by_formType["year"].astype(str)
    + "-"
    + counts_per_month_by_formType["month"].astype(str)
)
ax.set_xticks([i for i, x in enumerate(xticks) if x.endswith("-1")])
ax.set_xticklabels(
    [label.get_text()[:4] for label in ax.get_xticklabels()], rotation=90, ha="left"
)

ax.grid(axis="y", linestyle=":", alpha=0.5)
ax.spines["top"].set_visible(False)
ax.spines["right"].set_visible(False)
# draw vertical lines for each first month of the year, dotted, transparency 0.5,
# with height of the y value for the respective month
for year, month in counts_per_month_by_formType[["year", "month"]].values:
    if month == 1:
        ax.vlines(
            f"{year}-{month}",
            ymin=0,
            ymax=counts_per_month_by_formType[
                (counts_per_month_by_formType["year"] == year)
                & (counts_per_month_by_formType["month"] == month)
            ]
            .drop(columns=["year", "month"])
            .sum(axis=1),
            linestyle=":",
            alpha=0.5,
            color="grey",
        )

ax.axvspan("2020-1", "2022-1", alpha=0.1, color="red", zorder=-100)
ax.text(
    "2020-12",
    ax.get_ylim()[1] - 45,
    "COVID",
    horizontalalignment="center",
    verticalalignment="center",
    color="red",
    alpha=0.5,
)
plt.show()
counts_filedAtClass = (
    structured_data.drop_duplicates(subset=["accessionNo"])
    .groupby(["filedAtClass"])
    .size()
    .sort_values(ascending=False)
    .to_frame(name="Count")
).rename_axis("Publication Time")
counts_filedAtClass["Pct"] = (
    counts_filedAtClass["Count"].astype(int)
    / counts_filedAtClass["Count"].astype(int).sum()
).map("{:.0%}".format)
counts_filedAtClass["Count"] = counts_filedAtClass["Count"].map(lambda x: f"{x:,}")
counts_filedAtClass.index = (
    counts_filedAtClass.index.str.replace("preMarket", "Pre-Market (4:00 - 9:30 AM)")
    .str.replace("marketHours", "Market Hours (9:30 AM - 4:00 PM)")
    .str.replace("afterMarket", "After Market (4:00 - 8:00 PM)")
)
counts_filedAtClass = counts_filedAtClass.reindex(counts_filedAtClass.index[::-1])

print(
    f"Form counts by pre-market, regular market hours,\nand after-market publication time ({min_year} - {max_year_full})."
)
counts_filedAtClass
Form counts by pre-market, regular market hours,
and after-market publication time (2016 - 2024).
| Count | Pct | |
|---|---|---|
| Publication Time | ||
| Pre-Market (4:00 - 9:30 AM) | 1,346 | 5% |
| other | 2,273 | 8% |
| After Market (4:00 - 8:00 PM) | 10,044 | 34% |
| regularMarket | 16,207 | 54% |
counts_dayOfWeek = (
    structured_data.drop_duplicates(subset=["accessionNo"])
    .groupby(["dayOfWeek"])
    .size()
    .to_frame(name="Count")
).rename_axis("Day of the Week")
counts_dayOfWeek["Pct"] = (
    counts_dayOfWeek["Count"].astype(int) / counts_dayOfWeek["Count"].astype(int).sum()
).map("{:.0%}".format)
counts_dayOfWeek["Count"] = counts_dayOfWeek["Count"].map(lambda x: f"{x:,}")

print(f"Form C disclosures by day of the week ({min_year} - {max_year}).")
counts_dayOfWeek.loc[["Monday", "Tuesday", "Wednesday", "Thursday", "Friday"]]
Form C disclosures by day of the week (2016 - 2025).
| Count | Pct | |
|---|---|---|
| Day of the Week | ||
| Monday | 5,788 | 19% |
| Tuesday | 5,926 | 20% |
| Wednesday | 5,399 | 18% |
| Thursday | 5,757 | 19% |
| Friday | 7,000 | 23% |
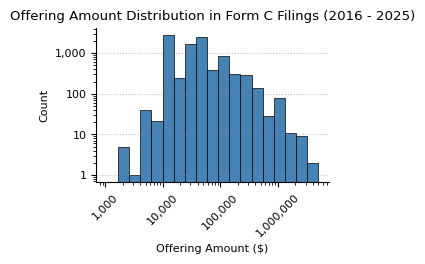
Offering amounts
In this section, we analyze the offering amount in the initial Form C filings.
form_c = structured_data_full_years[structured_data_full_years["formType"] == "C"]
data = form_c["offeringInformation.offeringAmount"]
data = data[data > 1000]

# Define log-spaced bins
bin_edges = np.logspace(np.log10(min(data)), np.log10(max(data)), num=20)

fig, ax = plt.subplots(figsize=(3, 2))
ax.hist(
    data,
    bins=bin_edges,
    color="steelblue",
    edgecolor="black",
    linewidth=0.5,
)
ax.set_yscale("log")
ax.set_xscale("log")
ax.xaxis.set_major_formatter(mtick.StrMethodFormatter("{x:,.0f}"))
ax.yaxis.set_major_formatter(mtick.StrMethodFormatter("{x:,.0f}"))
ax.tick_params(axis="x", rotation=45)
ax.set_title(
    f"Offering Amount Distribution in Form C Filings ({min_year} - {max_year})"
)
ax.set_xlabel("Offering Amount ($)")
ax.set_ylabel("Count")
plt.show()
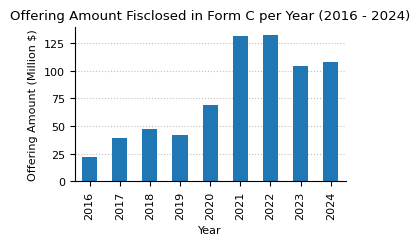
offering_amounts = (
    form_c[["accessionNo", "fileNo", "year", "offeringInformation.offeringAmount"]]
    .drop_duplicates(subset=["accessionNo", "fileNo"])
    .groupby(["year"])
    .sum()["offeringInformation.offeringAmount"]
)

# offering_amounts.loc["Total"] = offering_amounts.sum()

print(f"Offering Amount in Form C filings from {min_year} to {max_year_full}.")
offering_amounts
Offering Amount in Form C filings from 2016 to 2024.
year
2016    2.226972e+07
2017    3.883646e+07
2018    4.759816e+07
2019    4.217072e+07
2020    6.845360e+07
2021    1.312889e+08
2022    1.323496e+08
2023    1.038922e+08
2024    1.076026e+08
Name: offeringInformation.offeringAmount, dtype: float64
fig, ax = plt.subplots(figsize=(3.5, 2))
offering_amounts.apply(lambda x: x / 1e6).plot(kind="bar", stacked=True, ax=ax)
ax.set_xlabel("Year")
ax.set_ylabel("Offering Amount (Million $)")
ax.yaxis.set_major_formatter(mtick.StrMethodFormatter("{x:,.0f}"))
ax.grid(axis="x")
ax.set_axisbelow(True)
ax.set_title(
    f"Offering Amount Fisclosed in Form C per Year ({min_year} - {max_year_full})"
)
plt.show()
data = form_c["annualReportDisclosureRequirements.revenueMostRecentFiscalYear"]
data = data[data > 1000]

# Define log-spaced bins
bin_edges = np.logspace(np.log10(min(data)), np.log10(max(data)), num=20)

fig, ax = plt.subplots(figsize=(3, 2))
ax.hist(
    data,
    bins=bin_edges,
    color="steelblue",
    edgecolor="black",
    linewidth=0.5,
)
ax.set_yscale("log")
ax.set_xscale("log")
ax.xaxis.set_major_formatter(mtick.StrMethodFormatter("{x:,.0f}"))
ax.yaxis.set_major_formatter(mtick.StrMethodFormatter("{x:,.0f}"))
ax.tick_params(axis="x", rotation=45, which="major")
ax.tick_params(axis="x", which="minor", bottom=False)
ax.set_title(f"Annual Revenue Of Companies filing Form C ({min_year} - {max_year})")
ax.set_xlabel("Annual Revenue ($)")
ax.set_ylabel("Count")
plt.show()
ratio_df = form_c[
    (form_c["annualReportDisclosureRequirements.revenueMostRecentFiscalYear"] > 1000)
    & (form_c["annualReportDisclosureRequirements.revenueMostRecentFiscalYear"] > 1000)
]

data = (
    ratio_df["offeringInformation.offeringAmount"]
    / ratio_df["annualReportDisclosureRequirements.revenueMostRecentFiscalYear"]
)

bin_edges = np.logspace(np.log10(min(data)), np.log10(max(data)), num=20)

fig, ax = plt.subplots(figsize=(3, 2))
ax.hist(
    data,
    bins=bin_edges,
    color="steelblue",
    edgecolor="black",
    linewidth=0.5,
)
ax.set_xscale("log")


def dynamic_formatter(x, pos):
    """Formats numbers dynamically: only use necessary decimal places"""
    return f"{x:,.6g}"  # Uses up to 6 significant digits, removing trailing zeros


ax.xaxis.set_major_formatter(mtick.FuncFormatter(dynamic_formatter))
ax.yaxis.set_major_formatter(mtick.StrMethodFormatter("{x:,.0f}"))
ax.tick_params(axis="x", rotation=45)
ax.set_xlim(0.0001, 1000)

ax.set_title(
    f"Ratio of Offering Amount to Annual Revenue"
    "\nin Most Recent Fiscal Year"
    f"\nOf Companies filing Form C ({min_year} - {max_year})"
)
ax.set_xlabel("Ratio")
ax.set_ylabel("Count")
plt.show()