Analysis of Accountant Changes and Disagreement Reports
![]()
![]()
We illustrate how to perform an exploratory data analysis on disclosures informing investors about changes of accountant and potential disagreements with the former accountant of publicly traded companies on U.S. stock exchanges. These changes are disclosed in Form 8-K filings with the SEC, specifically under Item 4.01, titled "Changes in Registrant’s Certifying Accountant." These disclosures are presented in text form by companies. Utilizing our Structured Data API, we extract and structure the relevant information from the text, making it available for detailed analysis.
Our analysis will focus on several key areas:
- Number of Item 4.01 disclosures made each year from 2004 to 2023, per quarter, month and at what time of the day (pre-market, regular market, after-market)
- Distribution of disclosures across structured data fields, such as the proportion of disclosures reporting a going concern
- Number of disagreements and resolution thereof disclosed per year
- Disclosed weaknesses in internal control over financial reporting (ICFR)
- Identification of the reason for the termination of the engagement with the former accountant
- Identification of the types of opinion expressed in the audit reports
Data Loading and Preparation
To load and prepare the data, we will use the Form 8-K Item 4.01 Structured Data API to download all structured data related to Form 8-K filings that include Item 4.01 disclosures. The data spanning the years 2004 to 2024 is saved to a JSONL file ./form-8k-item-4-01-structured-data.jsonl.
import os
import json
import pandas as pd
import numpy as np
import matplotlib.pyplot as plt
import matplotlib.style as style
import matplotlib.ticker as mtick

style.use("default")

params = {
    "axes.labelsize": 8, "font.size": 8, "legend.fontsize": 8,
    "xtick.labelsize": 8, "ytick.labelsize": 8, "font.family": "sans-serif",
    "axes.spines.top": False, "axes.spines.right": False, "grid.color": "grey",
    "axes.grid": True, "axes.grid.axis": "y", "grid.alpha": 0.5, "grid.linestyle": ":",
}

plt.rcParams.update(params)
!pip install sec-api
from sec_api import Form_8K_Item_X_Api

item_X_api = Form_8K_Item_X_Api("YOUR_API_KEY")

YEARS = range(2024, 2003, -1)  # from 2024 to 2004
TARGET_FILE = "./form-8k-item-4-01-structured-data.jsonl"

if not os.path.exists(TARGET_FILE):
    for year in YEARS:
        done = False
        search_from = 0
        year_counter = 0

        while not done:
            searchRequest = {
                "query": f"item4_01:* AND filedAt:[{year}-01-01 TO {year}-12-31]",
                "from": search_from,
                "size": "50",
                "sort": [{"filedAt": {"order": "desc"}}],
            }

            response = item_X_api.get_data(searchRequest)

            if len(response["data"]) == 0:
                break

            search_from += 50
            year_counter += len(response["data"])

            with open(TARGET_FILE, "a") as f:
                for entry in response["data"]:
                    f.write(json.dumps(entry) + "\n")

        print(f"Finished loading {year_counter} Item 4.01 for year {year}")
else:
    print("File already exists, skipping download")
Finished loading 1003 Item 4.01 for year 2024
Finished loading 844 Item 4.01 for year 2023
Finished loading 793 Item 4.01 for year 2022
Finished loading 772 Item 4.01 for year 2021
Finished loading 606 Item 4.01 for year 2020
Finished loading 717 Item 4.01 for year 2019
Finished loading 837 Item 4.01 for year 2018
Finished loading 982 Item 4.01 for year 2017
Finished loading 957 Item 4.01 for year 2016
Finished loading 1216 Item 4.01 for year 2015
Finished loading 1410 Item 4.01 for year 2014
Finished loading 1566 Item 4.01 for year 2013
Finished loading 1173 Item 4.01 for year 2012
Finished loading 1448 Item 4.01 for year 2011
Finished loading 1646 Item 4.01 for year 2010
Finished loading 2102 Item 4.01 for year 2009
Finished loading 1628 Item 4.01 for year 2008
Finished loading 1974 Item 4.01 for year 2007
Finished loading 2175 Item 4.01 for year 2006
Finished loading 2104 Item 4.01 for year 2005
Finished loading 771 Item 4.01 for year 2004
structured_data = pd.read_json(TARGET_FILE, lines=True)

structured_data["filedAt"] = pd.to_datetime(structured_data["filedAt"], utc=True)
structured_data["filedAt"] = structured_data["filedAt"].dt.tz_convert("US/Eastern")
structured_data["year"] = structured_data["filedAt"].dt.year
structured_data["month"] = structured_data["filedAt"].dt.month
structured_data["dayOfWeek"] = structured_data["filedAt"].dt.day_name()
# filedAtClass:
# preMarket (4:00 AM to 9:30 AM),
# regularMarket (9:30 AM to 4:00 PM),
# afterMarket (4:00 PM to 8:00 PM),
# other (8:00 PM to 10:00 PM)
structured_data["filedAtClass"] = structured_data["filedAt"].apply(
    lambda x: (
        "preMarket"
        if x.hour < 9 or (x.hour == 9 and x.minute < 30)
        else (
            "regularMarket"
            if x.hour < 16
            else "afterMarket" if x.hour < 20 else "other"
        )
    )
)
unique_years = structured_data["year"].nunique()
unique_companies = structured_data["cik"].nunique()
print(
    f"Loaded {len(structured_data):,} Item 4.01 structured data records from {YEARS[-1]} to {YEARS[0]}, \ncovering {unique_years} years and {unique_companies:,} unique companies."
)
structured_data.head()
Loaded 26,724 Item 4.01 structured data records from 2004 to 2024,
covering 21 years and 10,495 unique companies.
| id | accessionNo | formType | filedAt | periodOfReport | cik | ticker | companyName | items | item4_01 | item5_02 | item4_02 | year | month | dayOfWeek | filedAtClass | |
|---|---|---|---|---|---|---|---|---|---|---|---|---|---|---|---|---|
| 0 | 4ceff8128ec58ee74c3a30d2682ea462 | 0001599916-24-000323 | 8-K | 2024-12-31 12:22:18-05:00 | 2024-05-03 | 1367408 | OILY | Sino American Oil Co | [Item 4.01: Changes in Registrant's Certifying... | {'keyComponents': 'Sino American Oil Co. dismi... | NaN | NaN | 2024 | 12 | Tuesday | regularMarket |
| 1 | bab09dc10fa2f239ef5e6abcc3971d6c | 0001683168-24-009057 | 8-K | 2024-12-31 08:36:36-05:00 | 2024-12-31 | 1827855 | MCLE | Medicale Corp. | [Item 4.01: Changes in Registrant's Certifying... | {'keyComponents': 'Medicale Corp. dismissed Gr... | NaN | NaN | 2024 | 12 | Tuesday | preMarket |
| 2 | 80d01f5a70c47acac5f31e3c1b222785 | 0001493152-24-052550 | 8-K | 2024-12-30 17:13:59-05:00 | 2024-06-17 | 1850767 | ACUT | Accustem Sciences Inc. | [Item 4.01: Changes in Registrant's Certifying... | {'keyComponents': 'On June 17, 2024, Mercurius... | NaN | NaN | 2024 | 12 | Monday | afterMarket |
| 3 | beb9b44a4b20c882bacffe1cf9f39ac9 | 0001493152-24-052512 | 8-K | 2024-12-30 16:41:43-05:00 | 2024-12-30 | 1643988 | LPTV | Loop Media, Inc. | [Item 4.01: Changes in Registrant's Certifying... | {'keyComponents': 'The Company dismissed Marcu... | NaN | NaN | 2024 | 12 | Monday | afterMarket |
| 4 | 0cf18570d923c6e72e44a4a567704a04 | 0001213900-24-112993 | 8-K | 2024-12-27 13:45:06-05:00 | 2024-12-20 | 2034406 | Tortoise Capital Series Trust | [Item 4.01: Changes in Registrant's Certifying... | {'keyComponents': 'As a result of the Mergers,... | NaN | NaN | 2024 | 12 | Friday | regularMarket |
print(structured_data.info())
<class 'pandas.core.frame.DataFrame'>
RangeIndex: 26724 entries, 0 to 26723
Data columns (total 16 columns):
 #   Column          Non-Null Count  Dtype
---  ------          --------------  -----
 0   id              26724 non-null  object
 1   accessionNo     26724 non-null  object
 2   formType        26724 non-null  object
 3   filedAt         26724 non-null  datetime64[ns, US/Eastern]
 4   periodOfReport  26724 non-null  object
 5   cik             26724 non-null  int64
 6   ticker          20390 non-null  object
 7   companyName     26724 non-null  object
 8   items           26724 non-null  object
 9   item4_01        26724 non-null  object
 10  item5_02        1895 non-null   object
 11  item4_02        263 non-null    object
 12  year            26724 non-null  int32
 13  month           26724 non-null  int32
 14  dayOfWeek       26724 non-null  object
 15  filedAtClass    26724 non-null  object
dtypes: datetime64[ns, US/Eastern](1), int32(2), int64(1), object(12)
memory usage: 3.1+ MB
None
print(json.dumps(structured_data["item4_01"][0], indent=2))
{
  "keyComponents": "Sino American Oil Co. dismissed BF Borgers CPA PC as its independent auditor on May 3, 2024, due to BF Borgers not being permitted to appear or practice before the SEC. Subsequently, the company appointed Michael Gillespie & Associates, PLLC as its new auditor on August 28, 2024.",
  "newAccountantDate": "2024-08-28",
  "engagedNewAccountant": true,
  "formerAccountantDate": "2024-05-03",
  "engagementEndReason": "dismissal",
  "formerAccountantName": "BF Borgers CPA PC",
  "newAccountantName": "Michael Gillespie & Associates, PLLC",
  "reportedDisagreements": false,
  "reportableEventsExist": true,
  "reportableEventsList": [
    "Identified material weaknesses in internal control over financial reporting."
  ],
  "reportedIcfrWeakness": true,
  "opinionType": "unqualified",
  "goingConcern": true,
  "goingConcernDetail": "The reports included an explanatory paragraph relating to the Company\u2019s ability to continue as a going concern.",
  "approvedChange": true
}
item_4_01_counts = (
    structured_data.drop_duplicates(subset=["accessionNo"])
    .groupby(["year"])
    .size()
    .to_frame(name="count")
)

print(f"Item 4.01 counts from {YEARS[-1]} to {YEARS[0]}")
item_4_01_counts.T
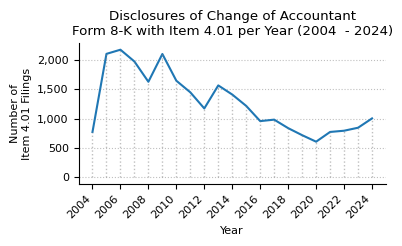
Item 4.01 counts from 2004 to 2024
| year | 2004 | 2005 | 2006 | 2007 | 2008 | 2009 | 2010 | 2011 | 2012 | 2013 | ... | 2015 | 2016 | 2017 | 2018 | 2019 | 2020 | 2021 | 2022 | 2023 | 2024 |
|---|---|---|---|---|---|---|---|---|---|---|---|---|---|---|---|---|---|---|---|---|---|
| count | 771 | 2104 | 2175 | 1974 | 1628 | 2102 | 1646 | 1448 | 1173 | 1566 | ... | 1216 | 957 | 982 | 837 | 717 | 606 | 772 | 793 | 844 | 1003 |
1 rows × 21 columns
def plot_timeseries(ts, title):
    fig, ax = plt.subplots(figsize=(4, 2.5))
    ts["count"].plot(ax=ax, legend=False)
    ax.set_title(title)
    ax.set_xlabel("Year")
    ax.set_ylabel("Number of\nItem 4.01 Filings")
    ax.set_xticks(np.arange(2004, 2025, 2))
    ax.yaxis.set_major_formatter(mtick.StrMethodFormatter("{x:,.0f}"))
    ax.set_xlim(2003, 2025)
    ax.grid(axis="x")
    ax.set_axisbelow(True)
    plt.xticks(rotation=45, ha="right")

    for year in YEARS:
        year_y_max = ts.loc[year, "count"]
        ax.vlines(year, 0, year_y_max, linestyles=":", colors="grey", alpha=0.5, lw=1)

    plt.tight_layout()
    plt.show()


plot_timeseries(
    item_4_01_counts,
    title="Disclosures of Change of Accountant\nForm 8-K with Item 4.01 per Year (2004  - 2024)",
)
structured_data["qtr"] = structured_data["month"].apply(lambda x: (x - 1) // 3 + 1)
counts_qtr_yr_piv = (
structured_data.drop_duplicates(subset=["accessionNo"])
.groupby(["year", "qtr"])
.size()
.unstack()
.fillna(0)
).astype(int)
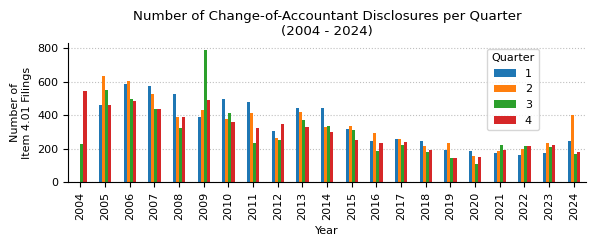
print(f"Item 4.01 counts by quarter from 2004 to 2024.")
counts_qtr_yr_piv.T
Item 4.01 counts by quarter from 2004 to 2024.
| year | 2004 | 2005 | 2006 | 2007 | 2008 | 2009 | 2010 | 2011 | 2012 | 2013 | ... | 2015 | 2016 | 2017 | 2018 | 2019 | 2020 | 2021 | 2022 | 2023 | 2024 |
|---|---|---|---|---|---|---|---|---|---|---|---|---|---|---|---|---|---|---|---|---|---|
| qtr | |||||||||||||||||||||
| 1 | 0 | 462 | 586 | 572 | 529 | 387 | 494 | 478 | 306 | 441 | ... | 315 | 245 | 257 | 244 | 191 | 184 | 172 | 163 | 175 | 246 |
| 2 | 0 | 632 | 606 | 527 | 387 | 433 | 379 | 415 | 267 | 422 | ... | 338 | 292 | 260 | 217 | 232 | 157 | 184 | 198 | 234 | 404 |
| 3 | 227 | 550 | 496 | 439 | 322 | 789 | 413 | 232 | 252 | 371 | ... | 312 | 188 | 223 | 183 | 148 | 111 | 222 | 215 | 211 | 171 |
| 4 | 544 | 460 | 487 | 436 | 390 | 493 | 360 | 323 | 348 | 332 | ... | 251 | 232 | 242 | 193 | 146 | 154 | 194 | 217 | 224 | 182 |
4 rows × 21 columns
counts_qtr_yr = counts_qtr_yr_piv.stack().reset_index(name="count")

fig, ax = plt.subplots(figsize=(6, 2.5))
counts_qtr_yr_piv.plot(kind="bar", ax=ax, legend=True)
ax.legend(title="Quarter", loc="upper right", bbox_to_anchor=(0.92, 1))
ax.set_title("Number of Change-of-Accountant Disclosures per Quarter\n(2004 - 2024)")
ax.set_xlabel("Year")
ax.set_ylabel("Number of\nItem 4.01 Filings")
ax.yaxis.set_major_formatter(mtick.StrMethodFormatter("{x:,.0f}"))
ax.grid(axis="x")
ax.set_axisbelow(True)
plt.tight_layout()
plt.show()
counts_month_yr_piv = (
    structured_data.drop_duplicates(subset=["accessionNo"])
    .groupby(["year", "month"])
    .size()
    .unstack()
    .fillna(0)
).astype(int)

print(f"Item 4.01 counts by month from 2004 to 2024.")
counts_month_yr_piv
Item 4.01 counts by month from 2004 to 2024.
| month | 1 | 2 | 3 | 4 | 5 | 6 | 7 | 8 | 9 | 10 | 11 | 12 |
|---|---|---|---|---|---|---|---|---|---|---|---|---|
| year | ||||||||||||
| 2004 | 0 | 0 | 0 | 0 | 0 | 0 | 0 | 61 | 166 | 211 | 174 | 159 |
| 2005 | 130 | 155 | 177 | 218 | 185 | 229 | 177 | 209 | 164 | 151 | 178 | 131 |
| 2006 | 188 | 155 | 243 | 208 | 202 | 196 | 163 | 166 | 167 | 160 | 155 | 172 |
| 2007 | 175 | 202 | 195 | 201 | 185 | 141 | 157 | 146 | 136 | 172 | 147 | 117 |
| 2008 | 212 | 155 | 162 | 148 | 129 | 110 | 110 | 103 | 109 | 128 | 141 | 121 |
| 2009 | 141 | 94 | 152 | 185 | 140 | 108 | 127 | 329 | 333 | 287 | 105 | 101 |
| 2010 | 190 | 119 | 185 | 160 | 114 | 105 | 112 | 174 | 127 | 131 | 114 | 115 |
| 2011 | 153 | 123 | 202 | 172 | 115 | 128 | 86 | 80 | 66 | 94 | 124 | 105 |
| 2012 | 78 | 91 | 137 | 105 | 85 | 77 | 67 | 112 | 73 | 114 | 123 | 111 |
| 2013 | 155 | 124 | 162 | 165 | 129 | 128 | 144 | 138 | 89 | 107 | 121 | 104 |
| 2014 | 150 | 114 | 180 | 127 | 98 | 105 | 133 | 111 | 94 | 132 | 76 | 90 |
| 2015 | 99 | 102 | 114 | 120 | 99 | 119 | 109 | 115 | 88 | 91 | 80 | 80 |
| 2016 | 86 | 70 | 89 | 109 | 103 | 80 | 69 | 67 | 52 | 63 | 81 | 88 |
| 2017 | 88 | 68 | 101 | 94 | 95 | 71 | 48 | 104 | 71 | 59 | 95 | 88 |
| 2018 | 75 | 68 | 101 | 87 | 67 | 63 | 61 | 63 | 59 | 106 | 32 | 55 |
| 2019 | 60 | 50 | 81 | 101 | 66 | 65 | 67 | 45 | 36 | 53 | 45 | 48 |
| 2020 | 54 | 50 | 80 | 54 | 34 | 69 | 46 | 29 | 36 | 49 | 62 | 43 |
| 2021 | 53 | 45 | 74 | 55 | 40 | 89 | 86 | 63 | 73 | 59 | 56 | 79 |
| 2022 | 40 | 41 | 82 | 55 | 66 | 77 | 63 | 68 | 84 | 94 | 59 | 64 |
| 2023 | 39 | 46 | 90 | 82 | 83 | 69 | 64 | 79 | 68 | 75 | 67 | 82 |
| 2024 | 75 | 63 | 108 | 90 | 214 | 100 | 66 | 67 | 38 | 60 | 66 | 56 |
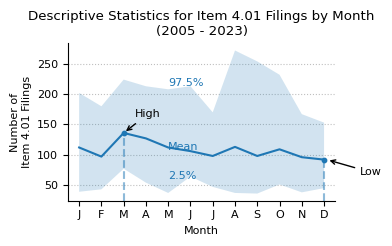
print(f"Descriptive statistics for Item 4.01 counts by month from 2004 to 2024.")
month_stats = (
    counts_month_yr_piv.loc[2005:]
    .describe(percentiles=[0.025, 0.975])
    .round(0)
    .astype(int)
)
month_stats
Descriptive statistics for Item 4.01 counts by month from 2004 to 2024.
| month | 1 | 2 | 3 | 4 | 5 | 6 | 7 | 8 | 9 | 10 | 11 | 12 |
|---|---|---|---|---|---|---|---|---|---|---|---|---|
| count | 20 | 20 | 20 | 20 | 20 | 20 | 20 | 20 | 20 | 20 | 20 | 20 |
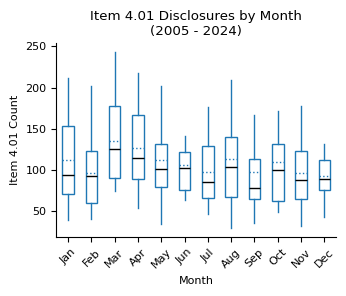
| mean | 112 | 97 | 136 | 127 | 112 | 106 | 98 | 113 | 98 | 109 | 96 | 92 |
| std | 55 | 46 | 50 | 52 | 51 | 43 | 41 | 69 | 67 | 56 | 40 | 32 |
| min | 39 | 41 | 74 | 54 | 34 | 63 | 46 | 29 | 36 | 49 | 32 | 43 |
| 2.5% | 39 | 43 | 77 | 54 | 37 | 64 | 47 | 37 | 36 | 51 | 38 | 45 |
| 50% | 94 | 92 | 126 | 114 | 101 | 102 | 86 | 104 | 78 | 100 | 88 | 89 |
| 97.5% | 202 | 180 | 224 | 213 | 208 | 213 | 170 | 272 | 254 | 232 | 167 | 153 |
| max | 212 | 202 | 243 | 218 | 214 | 229 | 177 | 329 | 333 | 287 | 178 | 172 |
def plot_box_plot_as_line(
    data: pd.DataFrame,
    x_months=True,
    title="",
    x_label="",
    x_pos_mean_label=2,
    pos_labels=None,  # {"mean": {"x": 2, "y": 150}, "upper": {"x": 2, "y": 150}, "lower": {"x": 2, "y": 150}},
    pos_high_low=None,  # {"high": {"x": 2, "y": 150}, "low": {"x": 2, "y": 150}},
    y_label="",
    y_formatter=lambda x, p: "{:.0f}".format(int(x) / 1000),
    show_high_low_labels=True,
    show_inline_labels=True,
    show_bands=True,
    figsize=(4, 2.5),
    line_source="mean",
):
    fig, ax = plt.subplots(figsize=figsize)

    line_to_plot = data[line_source]
    lower_label = "2.5%"
    upper_label = "97.5%"
    lower = data[lower_label]
    upper = data[upper_label]

    line_to_plot.plot(ax=ax)

    if show_bands:
        ax.fill_between(line_to_plot.index, lower, upper, alpha=0.2)

    if x_months:
        ax.set_xlim(0.5, 12.5)
        ax.set_xticks(range(1, 13))
        ax.set_xticklabels(["J", "F", "M", "A", "M", "J", "J", "A", "S", "O", "N", "D"])

    ax.yaxis.set_major_formatter(mtick.FuncFormatter(y_formatter))
    ax.set_ylabel(y_label)
    ax.set_xlabel(x_label)
    ax.set_title(title)

    ymin, ymax = ax.get_ylim()
    y_scale = ymax - ymin

    max_x = int(line_to_plot.idxmax())
    max_y = line_to_plot.max()
    min_x = int(line_to_plot.idxmin())
    min_y = line_to_plot.min()

    ax.axvline(
        max_x,
        ymin=0,
        ymax=((max_y - ymin) / (ymax - ymin)),
        linestyle="dashed",
        color="tab:blue",
        alpha=0.5,
    )
    ax.scatter(max_x, max_y, color="tab:blue", s=10)
    ax.axvline(
        min_x,
        ymin=0,
        ymax=((min_y - ymin) / (ymax - ymin)),
        linestyle="dashed",
        color="tab:blue",
        alpha=0.5,
    )
    ax.scatter(min_x, min_y, color="tab:blue", s=10)

    x_pos_mean_label_int = int(x_pos_mean_label)
    if show_inline_labels:
        mean_x = x_pos_mean_label
        mean_y = line_to_plot.iloc[x_pos_mean_label_int] * 1.02
        upper_x = x_pos_mean_label
        upper_y = upper.iloc[x_pos_mean_label_int]
        lower_x = x_pos_mean_label
        lower_y = lower.iloc[x_pos_mean_label_int] * 0.95

        if pos_labels:
            mean_x = pos_labels["mean"]["x"]
            mean_y = pos_labels["mean"]["y"]
            upper_x = pos_labels["upper"]["x"]
            upper_y = pos_labels["upper"]["y"]
            lower_x = pos_labels["lower"]["x"]
            lower_y = pos_labels["lower"]["y"]

        ax.text(mean_x, mean_y, "Mean", color="tab:blue", fontsize=8)
        ax.text(upper_x, upper_y, upper_label, color="tab:blue", fontsize=8)
        ax.text(lower_x, lower_y, lower_label, color="tab:blue", fontsize=8)

    if show_high_low_labels:
        high_x_origin = max_x
        high_y_origin = max_y
        high_x_label = high_x_origin + 0.5
        high_y_label = high_y_origin + 0.1 * y_scale
        if pos_high_low:
            high_x_label = pos_high_low["high"]["x"]
            high_y_label = pos_high_low["high"]["y"]
        ax.annotate(
            "High",
            (high_x_origin, high_y_origin),
            xytext=(high_x_label, high_y_label),
            arrowprops=dict(facecolor="black", arrowstyle="->"),
        )

        low_x_origin = min_x * 1.01
        low_y_origin = min_y
        low_x_label = low_x_origin + 1.5
        low_y_label = low_y_origin - 0.1 * y_scale
        if pos_high_low:
            low_x_label = pos_high_low["low"]["x"]
            low_y_label = pos_high_low["low"]["y"]
        ax.annotate(
            "Low",
            (low_x_origin, low_y_origin),
            xytext=(low_x_label, low_y_label),
            arrowprops=dict(facecolor="black", arrowstyle="->"),
        )

    ax.grid(axis="x")
    ax.set_axisbelow(True)

    plt.tight_layout()
    plt.show()


plot_box_plot_as_line(
    data=month_stats.T,
    title="Descriptive Statistics for Item 4.01 Filings by Month\n(2005 - 2024)",
    x_label="Month",
    y_label="Number of\nItem 4.01 Filings",
    y_formatter=lambda x, p: "{:.0f}".format(int(x)),
    x_pos_mean_label=5,
)
fig, ax = plt.subplots(figsize=(3.5, 3))

counts_month_yr_piv.loc[2005:].boxplot(
    ax=ax,
    grid=False,
    showfliers=False,
    flierprops=dict(marker="o", markersize=3),
    patch_artist=True,
    boxprops=dict(facecolor="white", color="tab:blue"),
    showmeans=True,
    meanline=True,
    meanprops={"color": "tab:blue", "linestyle": ":"},
    medianprops={"color": "black"},
    capprops={"color": "none"},
)

ax.set_title("Item 4.01 Disclosures by Month\n(2005 - 2024)")
ax.set_xlabel("Month")
ax.set_ylabel("Item 4.01 Count")
xticklabels = [pd.to_datetime(str(x), format="%m").strftime("%b") for x in range(1, 13)]
ax.set_xticklabels(xticklabels)
plt.xticks(rotation=45)
plt.tight_layout()
plt.show()
counts_filedAtClass = (
    structured_data.drop_duplicates(subset=["accessionNo"])
    .groupby(["filedAtClass"])
    .size()
    .sort_values(ascending=False)
    .to_frame(name="Count")
).rename_axis("Publication Time")
counts_filedAtClass["Pct"] = (
    counts_filedAtClass["Count"].astype(int)
    / counts_filedAtClass["Count"].astype(int).sum()
).map("{:.0%}".format)
counts_filedAtClass["Count"] = counts_filedAtClass["Count"].map(lambda x: f"{x:,}")
counts_filedAtClass.index = (
    counts_filedAtClass.index.str.replace("preMarket", "Pre-Market (4:00 - 9:30 AM)")
    .str.replace("regularMarket", "Market Hours (9:30 AM - 4:00 PM)")
    .str.replace("afterMarket", "After Market (4:00 - 8:00 PM)")
)
counts_filedAtClass = counts_filedAtClass.reindex(counts_filedAtClass.index[::-1])

print(
    f"Item 4.01 counts by pre-market, regular market hours,\nand after-market publication time (2004 - 2024)."
)
counts_filedAtClass
Item 4.01 counts by pre-market, regular market hours,
and after-market publication time (2004 - 2024).
| Count | Pct | |
|---|---|---|
| Publication Time | ||
| other | 637 | 2% |
| Pre-Market (4:00 - 9:30 AM) | 1,668 | 6% |
| Market Hours (9:30 AM - 4:00 PM) | 10,647 | 40% |
| After Market (4:00 - 8:00 PM) | 13,772 | 52% |
counts_dayOfWeek = (
    structured_data.drop_duplicates(subset=["accessionNo"])
    .groupby(["dayOfWeek"])
    .size()
    .to_frame(name="Count")
).rename_axis("Day of the Week")
counts_dayOfWeek["Pct"] = (
    counts_dayOfWeek["Count"].astype(int) / counts_dayOfWeek["Count"].astype(int).sum()
).map("{:.0%}".format)
counts_dayOfWeek["Count"] = counts_dayOfWeek["Count"].map(lambda x: f"{x:,}")

print(f"Item 4.01 disclosures by day of the week (2004 - 2024).")
counts_dayOfWeek.loc[["Monday", "Tuesday", "Wednesday", "Thursday", "Friday"]]
Item 4.01 disclosures by day of the week (2004 - 2024).
| Count | Pct | |
|---|---|---|
| Day of the Week | ||
| Monday | 4,830 | 18% |
| Tuesday | 5,285 | 20% |
| Wednesday | 5,363 | 20% |
| Thursday | 5,320 | 20% |
| Friday | 5,926 | 22% |
structured_data["item4_01"].apply(
    lambda x: x["consultedNewAccountant"] if "consultedNewAccountant" in x else None
).value_counts().to_frame().reset_index().rename(columns={"item4_01": "value"})
| value | count | |
|---|---|---|
| 0 | False | 20423 |
| 1 | True | 125 |
bool_variables_to_analyze = [
    "engagedNewAccountant",
    "consultedNewAccountant",
    "reportedDisagreements",
    "resolvedDisagreements",
    "reportableEventsExist",
    "reportedIcfrWeakness",
    "remediatedIcfrWeakness",
    "goingConcern",
    "auditDisclaimer",
    "authorizedInquiry",
    "approvedChange",
]

var_to_label = {
    "engagedNewAccountant": "New Accountant was Engaged",
    "consultedNewAccountant": "Consulted new Accountant Prior to Engagement",
    "reportedDisagreements": "Disagreements Reported",
    "resolvedDisagreements": "Reported Disagreements were Resolved",
    "reportableEventsExist": "Reportable Events exist",
    "reportedIcfrWeakness": "ICFR Weakness Reported",
    "remediatedIcfrWeakness": "Reported ICFR Weakness Remediated",
    "goingConcern": "Report includes Going Concern Statement",
    "auditDisclaimer": "Audit Report includes Disclaimer of Opinion",
    "authorizedInquiry": "Former Accountant Authorized to Respond to Inquiries",
    "approvedChange": "Change Approved by Board or Audit Committee",
}


total_samples = len(structured_data)
# Create a row for the total samples
total_row = pd.DataFrame(
    {
        "Samples": [f"{total_samples:,.0f}"],
        "Pct.": [""],
        "Pct. tot.": [100],
    },
    index=pd.MultiIndex.from_tuples([("Total", "")], names=["Variable", "Value"]),
)


bool_variables_stats = []

for variable in bool_variables_to_analyze:
    variable_stats = (
        structured_data["item4_01"]
        .apply(lambda x: x[variable] if variable in x else None)
        .value_counts()
        .to_frame()
        .reset_index()
        .rename(columns={"item4_01": "value"})
    )
    variable_stats = variable_stats.sort_values(by="value", ascending=False)
    variable_stats["pct"] = (
        variable_stats["count"] / variable_stats["count"].sum() * 100
    ).round(1)
    variable_stats["pct_tot"] = (variable_stats["count"] / total_samples * 100).round(1)
    variable_stats.index = pd.MultiIndex.from_tuples(
        [(variable, row["value"]) for _, row in variable_stats.iterrows()],
    )
    variable_stats.drop(columns="value", inplace=True)

    bool_variables_stats.append(variable_stats)

bool_variables_stats = pd.concat(bool_variables_stats, axis=0)
bool_variables_stats.index.set_names(["Variable", "Value"], inplace=True)
bool_variables_stats.rename(
    index=var_to_label,
    columns={"count": "Samples", "pct": "Pct.", "pct_tot": "Pct. tot."},
    inplace=True,
)
bool_variables_stats["Samples"] = bool_variables_stats["Samples"].apply(
    lambda x: f"{x:,.0f}"
)


bool_variables_stats = pd.concat([total_row, bool_variables_stats])


print(
    f"Number of change-of-accountant filings by \ntheir disclosed characteristics (2004 - 2024):"
)
bool_variables_stats
Number of change-of-accountant filings by
their disclosed characteristics (2004 - 2024):
| Samples | Pct. | Pct. tot. | ||
|---|---|---|---|---|
| Variable | Value | |||
| Total | 26,724 | 100.0 | ||
| New Accountant was Engaged | True | 20,913 | 97.8 | 78.3 |
| False | 476 | 2.2 | 1.8 | |
| Consulted new Accountant Prior to Engagement | True | 125 | 0.6 | 0.5 |
| False | 20,423 | 99.4 | 76.4 | |
| Disagreements Reported | True | 419 | 1.7 | 1.6 |
| False | 23,848 | 98.3 | 89.2 | |
| Reported Disagreements were Resolved | True | 160 | 42.0 | 0.6 |
| False | 221 | 58.0 | 0.8 | |
| Reportable Events exist | True | 2,441 | 13.1 | 9.1 |
| False | 16,192 | 86.9 | 60.6 | |
| ICFR Weakness Reported | True | 3,281 | 64.5 | 12.3 |
| False | 1,805 | 35.5 | 6.8 | |
| Reported ICFR Weakness Remediated | True | 576 | 56.4 | 2.2 |
| False | 445 | 43.6 | 1.7 | |
| Report includes Going Concern Statement | True | 10,562 | 95.2 | 39.5 |
| False | 532 | 4.8 | 2.0 | |
| Audit Report includes Disclaimer of Opinion | True | 58 | 1.7 | 0.2 |
| False | 3,397 | 98.3 | 12.7 | |
| Former Accountant Authorized to Respond to Inquiries | True | 2,501 | 96.6 | 9.4 |
| False | 87 | 3.4 | 0.3 | |
| Change Approved by Board or Audit Committee | True | 19,588 | 98.4 | 73.3 |
| False | 319 | 1.6 | 1.2 |
Now, we count the occurrences when the flags have a value of interest. E.g., "True" for "Disagreements Reported" and "False" for "Change Approved by Board or Audit Committee"
bool_variables_to_analyze_true = [
    "consultedNewAccountant",
    "reportedDisagreements",
    "resolvedDisagreements",
    "reportableEventsExist",
    "reportedIcfrWeakness",
    "remediatedIcfrWeakness",
    "goingConcern",
    "auditDisclaimer",
]
bool_variables_to_analyze_false = ["authorizedInquiry", "approvedChange"]

events_var_labels = {
    "consultedNewAccountant": "Consulted with New Accountant",
    "reportedDisagreements": "Reported Disagreements",
    "resolvedDisagreements": "Reported Disagreements Resolved",
    "reportableEventsExist": "Reportable Events in Filing",
    "reportedIcfrWeakness": "ICFR Weakness Reported",
    "remediatedIcfrWeakness": "Reported ICFR Weakness Remediated",
    "goingConcern": "Report includes Going Concern Statement",
    "auditDisclaimer": "Audit Report includes Disclaimer of Opinion",
    "authorizedInquiry": "Former Accountant Not Authorized to Respond to Inquiries",
    "approvedChange": "Change Not Approved by Board or Audit Committee",
}

item_4_01_exploded = structured_data["item4_01"].apply(pd.Series)
item_4_01_exploded = pd.concat([structured_data, item_4_01_exploded], axis=1)

true_count_year_pivot = pd.pivot_table(
    item_4_01_exploded,
    index="year",
    # values=["goingConcern", "reportedIcfrWeakness"],
    values=bool_variables_to_analyze_true,
    aggfunc=lambda x: (x == True).sum(),
    fill_value=0,
)

false_count_year_pivot = pd.pivot_table(
    item_4_01_exploded,
    index="year",
    values=bool_variables_to_analyze_false,
    aggfunc=lambda x: (x == False).sum(),
    fill_value=0,
)

event_counts_year_pivot = pd.concat(
    [true_count_year_pivot, false_count_year_pivot], axis=1
)
event_counts_year_pivot = event_counts_year_pivot.T
event_counts_year_pivot["total"] = event_counts_year_pivot.sum(axis=1)
event_counts_year_pivot = event_counts_year_pivot.sort_values(
    by="total", ascending=False
)


event_counts_year_pivot.rename(index=events_var_labels, inplace=True)
event_counts_year_pivot
| year | 2004 | 2005 | 2006 | 2007 | 2008 | 2009 | 2010 | 2011 | 2012 | 2013 | ... | 2016 | 2017 | 2018 | 2019 | 2020 | 2021 | 2022 | 2023 | 2024 | total |
|---|---|---|---|---|---|---|---|---|---|---|---|---|---|---|---|---|---|---|---|---|---|
| Report includes Going Concern Statement | 215 | 600 | 694 | 719 | 642 | 973 | 750 | 687 | 540 | 848 | ... | 356 | 360 | 272 | 260 | 182 | 273 | 266 | 314 | 358 | 10562 |
| ICFR Weakness Reported | 61 | 269 | 275 | 219 | 172 | 122 | 111 | 74 | 68 | 117 | ... | 109 | 148 | 125 | 125 | 118 | 182 | 188 | 255 | 239 | 3281 |
| Reportable Events in Filing | 57 | 207 | 206 | 155 | 108 | 115 | 83 | 64 | 53 | 80 | ... | 89 | 94 | 82 | 92 | 85 | 132 | 141 | 175 | 191 | 2441 |
| Reported ICFR Weakness Remediated | 16 | 49 | 77 | 55 | 36 | 25 | 20 | 12 | 7 | 20 | ... | 22 | 25 | 20 | 20 | 23 | 25 | 29 | 25 | 28 | 576 |
| Reported Disagreements | 16 | 46 | 55 | 38 | 11 | 28 | 32 | 28 | 20 | 31 | ... | 7 | 14 | 7 | 14 | 8 | 5 | 5 | 4 | 10 | 419 |
| Change Not Approved by Board or Audit Committee | 26 | 67 | 48 | 32 | 15 | 16 | 9 | 9 | 7 | 12 | ... | 7 | 13 | 10 | 7 | 3 | 5 | 4 | 11 | 10 | 319 |
| Reported Disagreements Resolved | 9 | 25 | 26 | 16 | 6 | 11 | 11 | 0 | 5 | 17 | ... | 0 | 4 | 4 | 5 | 4 | 1 | 0 | 0 | 3 | 160 |
| Consulted with New Accountant | 7 | 9 | 13 | 8 | 22 | 5 | 13 | 4 | 11 | 5 | ... | 2 | 0 | 4 | 2 | 3 | 1 | 2 | 2 | 2 | 125 |
| Former Accountant Not Authorized to Respond to Inquiries | 3 | 4 | 11 | 3 | 6 | 14 | 13 | 6 | 2 | 3 | ... | 0 | 1 | 1 | 0 | 1 | 1 | 5 | 2 | 2 | 87 |
| Audit Report includes Disclaimer of Opinion | 0 | 5 | 16 | 6 | 7 | 2 | 6 | 4 | 4 | 3 | ... | 1 | 1 | 0 | 3 | 0 | 0 | 0 | 0 | 0 | 58 |
10 rows × 22 columns
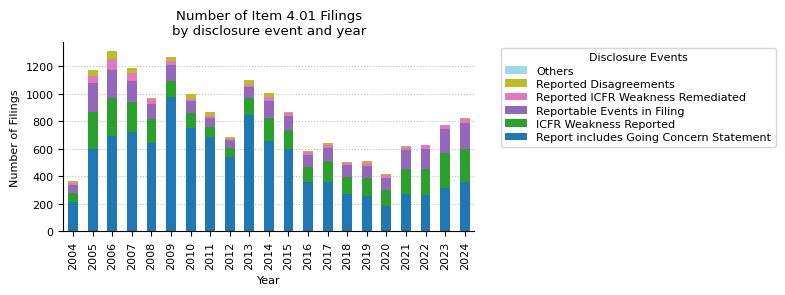
top_5_events = event_counts_year_pivot.head(5)

others = event_counts_year_pivot[
    ~event_counts_year_pivot.index.isin(event_counts_year_pivot.index)
]
others = others.sum().to_frame().T
others.index = ["Others"]

top_5_events = pd.concat([top_5_events, others], axis=0)
fig, ax = plt.subplots(figsize=(8, 3))

top_5_events.drop(columns="total").T.plot(kind="bar", stacked=True, ax=ax, cmap="tab20")

ax.set_title("Number of Item 4.01 Filings\nby disclosure event and year")
ax.set_xlabel("Year")
ax.set_ylabel("Number of Filings")
ax.xaxis.grid(False)
ax.set_axisbelow(True)
handles, labels = ax.get_legend_handles_labels()  # reverse order of legend items

labels = [
    "declination" if label == "declination to stand for reappointment" else label
    for label in labels
]

ax.legend(
    reversed(handles),
    reversed(labels),
    title="Disclosure Events",
    bbox_to_anchor=(1.05, 1),
    labelspacing=0.3,
    fontsize=8,
)

plt.tight_layout()
plt.show()
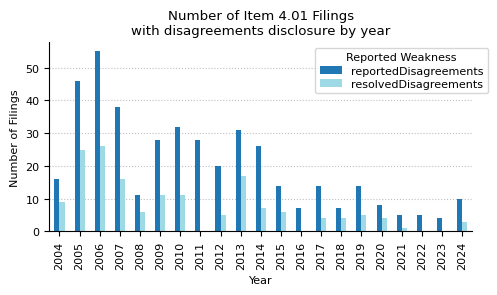
disagreements_year_pivot = pd.pivot_table(
    item_4_01_exploded,
    index="year",
    values=["reportedDisagreements", "resolvedDisagreements"],
    aggfunc=lambda x: (x == True).sum(),
    fill_value=0,
)


disagreements_year_pivot = disagreements_year_pivot.T
disagreements_year_pivot["total"] = disagreements_year_pivot.sum(axis=1)
disagreements_year_pivot = disagreements_year_pivot.sort_values(
    by="total", ascending=False
)
disagreements_year_pivot
| year | 2004 | 2005 | 2006 | 2007 | 2008 | 2009 | 2010 | 2011 | 2012 | 2013 | ... | 2016 | 2017 | 2018 | 2019 | 2020 | 2021 | 2022 | 2023 | 2024 | total |
|---|---|---|---|---|---|---|---|---|---|---|---|---|---|---|---|---|---|---|---|---|---|
| reportedDisagreements | 16 | 46 | 55 | 38 | 11 | 28 | 32 | 28 | 20 | 31 | ... | 7 | 14 | 7 | 14 | 8 | 5 | 5 | 4 | 10 | 419 |
| resolvedDisagreements | 9 | 25 | 26 | 16 | 6 | 11 | 11 | 0 | 5 | 17 | ... | 0 | 4 | 4 | 5 | 4 | 1 | 0 | 0 | 3 | 160 |
2 rows × 22 columns
fig, ax = plt.subplots(figsize=(5, 3))

disagreements_year_pivot.T.drop("total").plot(
    kind="bar", stacked=False, ax=ax, cmap="tab20"
)

ax.set_title("Number of Item 4.01 Filings\nwith disagreements disclosure by year")
ax.set_xlabel("Year")
ax.set_ylabel("Number of Filings")
ax.xaxis.grid(False)
ax.set_axisbelow(True)
handles, labels = ax.get_legend_handles_labels()  # reverse order of legend items

labels = [
    "declination" if label == "declination to stand for reappointment" else label
    for label in labels
]

ax.legend(
    handles,
    labels,
    title="Reported Weakness",
    bbox_to_anchor=(1.05, 1),
    labelspacing=0.3,
    fontsize=8,
)

plt.tight_layout()
plt.show()
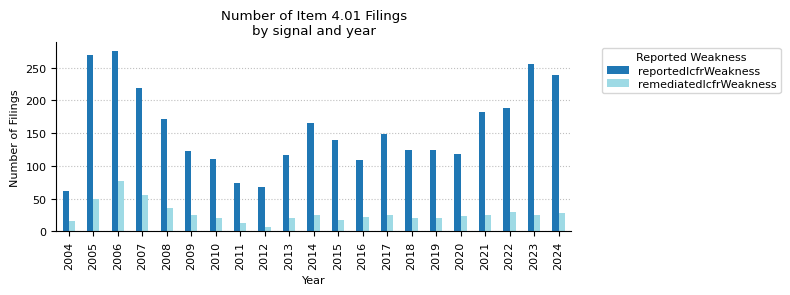
icfr_weaknesses_pivot = pd.pivot_table(
    item_4_01_exploded,
    index="year",
    values=[
        "remediatedIcfrWeakness",
        "reportedIcfrWeakness",
    ],
    aggfunc=lambda x: (x == True).sum(),
    fill_value=0,
)


icfr_weaknesses_pivot = icfr_weaknesses_pivot.T
icfr_weaknesses_pivot["total"] = icfr_weaknesses_pivot.sum(axis=1)
icfr_weaknesses_pivot = icfr_weaknesses_pivot.sort_values(by="total", ascending=False)
icfr_weaknesses_pivot
| year | 2004 | 2005 | 2006 | 2007 | 2008 | 2009 | 2010 | 2011 | 2012 | 2013 | ... | 2016 | 2017 | 2018 | 2019 | 2020 | 2021 | 2022 | 2023 | 2024 | total |
|---|---|---|---|---|---|---|---|---|---|---|---|---|---|---|---|---|---|---|---|---|---|
| reportedIcfrWeakness | 61 | 269 | 275 | 219 | 172 | 122 | 111 | 74 | 68 | 117 | ... | 109 | 148 | 125 | 125 | 118 | 182 | 188 | 255 | 239 | 3281 |
| remediatedIcfrWeakness | 16 | 49 | 77 | 55 | 36 | 25 | 20 | 12 | 7 | 20 | ... | 22 | 25 | 20 | 20 | 23 | 25 | 29 | 25 | 28 | 576 |
2 rows × 22 columns
fig, ax = plt.subplots(figsize=(8, 3))

icfr_weaknesses_pivot.T.drop("total").plot(
    kind="bar", stacked=False, ax=ax, cmap="tab20"
)

ax.set_title("Number of Item 4.01 Filings\nby signal and year")
ax.set_xlabel("Year")
ax.set_ylabel("Number of Filings")
ax.xaxis.grid(False)
ax.set_axisbelow(True)
handles, labels = ax.get_legend_handles_labels()  # reverse order of legend items

labels = [
    "declination" if label == "declination to stand for reappointment" else label
    for label in labels
]

ax.legend(
    handles,
    labels,
    title="Reported Weakness",
    bbox_to_anchor=(1.05, 1),
    labelspacing=0.3,
    fontsize=8,
)

plt.tight_layout()
plt.show()
engagementEndReason = (
    item_4_01_exploded["engagementEndReason"].explode().value_counts().to_frame().head(5)
)
engagementEndReason.index.name = "Audit Opinion Type"
engagementEndReason.columns = ["Count"]
engagementEndReason["Pct."] = (
    engagementEndReason["Count"] / engagementEndReason["Count"].sum() * 100
)
engagementEndReason["Pct."] = engagementEndReason["Pct."].round(1)
engagementEndReason["Count"] = engagementEndReason["Count"].apply(lambda x: f"{x:,.0f}")

print(
    f"Top 4 reason for end of engagement with the former accountant\nif stated in the Item 4.01 filings (2004 - 2024):"
)
engagementEndReason.head(4)
Top 4 reason for end of engagement with the former accountant
if stated in the Item 4.01 filings (2004 - 2024):
| Count | Pct. | |
|---|---|---|
| Audit Opinion Type | ||
| dismissal | 14,941 | 65.5 |
| resignation | 6,082 | 26.6 |
| declination to stand for reappointment | 1,187 | 5.2 |
| dissolution | 609 | 2.7 |
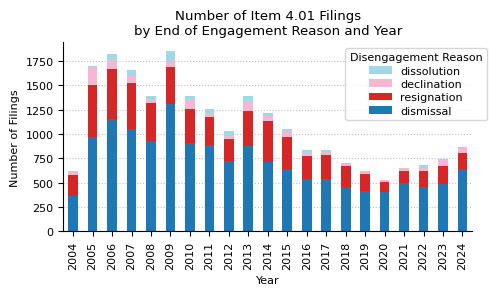
endReason_year = item_4_01_exploded[
    ["engagementEndReason", "year", "accessionNo"]
].explode("engagementEndReason")

endReason_year_pivot = pd.pivot_table(
    endReason_year,
    index="engagementEndReason",
    columns="year",
    values="accessionNo",
    aggfunc="count",
    fill_value=0,
)

endReason_year_pivot["total"] = endReason_year_pivot.sum(axis=1)
endReason_year_pivot = endReason_year_pivot.sort_values(by="total", ascending=False)
# remove artifacts
endReason_year_pivot = endReason_year_pivot[
    endReason_year_pivot["total"] >= 0.001 * endReason_year_pivot["total"].sum()
]

endReason_year_pivot
| year | 2004 | 2005 | 2006 | 2007 | 2008 | 2009 | 2010 | 2011 | 2012 | 2013 | ... | 2016 | 2017 | 2018 | 2019 | 2020 | 2021 | 2022 | 2023 | 2024 | total |
|---|---|---|---|---|---|---|---|---|---|---|---|---|---|---|---|---|---|---|---|---|---|
| engagementEndReason | |||||||||||||||||||||
| dismissal | 364 | 968 | 1150 | 1046 | 925 | 1312 | 912 | 888 | 721 | 877 | ... | 540 | 538 | 455 | 412 | 400 | 496 | 455 | 482 | 643 | 14941 |
| resignation | 214 | 537 | 521 | 473 | 389 | 379 | 347 | 281 | 231 | 359 | ... | 229 | 242 | 215 | 180 | 107 | 123 | 161 | 187 | 166 | 6082 |
| declination to stand for reappointment | 39 | 176 | 100 | 78 | 48 | 50 | 96 | 44 | 30 | 103 | ... | 35 | 34 | 29 | 21 | 16 | 29 | 36 | 59 | 42 | 1187 |
| dissolution | 4 | 19 | 50 | 60 | 28 | 107 | 33 | 47 | 45 | 48 | ... | 30 | 16 | 5 | 4 | 6 | 7 | 29 | 18 | 14 | 609 |
4 rows × 22 columns
fig, ax = plt.subplots(figsize=(5, 3))

endReason_year_pivot.drop(columns="total").T.plot(
    kind="bar", stacked=True, ax=ax, cmap="tab20"
)

ax.set_title("Number of Item 4.01 Filings\nby End of Engagement Reason and Year")
ax.set_xlabel("Year")
ax.set_ylabel("Number of Filings")
ax.xaxis.grid(False)
ax.set_axisbelow(True)
handles, labels = ax.get_legend_handles_labels()  # reverse order of legend items

labels = [
    "declination" if label == "declination to stand for reappointment" else label
    for label in labels
]

ax.legend(
    reversed(handles),
    reversed(labels),
    title="Disengagement Reason",
    bbox_to_anchor=(1.05, 1),
    labelspacing=0.3,
    fontsize=8,
)

plt.tight_layout()
plt.show()
opinionType = item_4_01_exploded["opinionType"].explode().value_counts().to_frame().head(5)
opinionType.index.name = "Audit Opinion Type"
opinionType.columns = ["Count"]
opinionType["Pct."] = opinionType["Count"] / opinionType["Count"].sum() * 100
opinionType["Pct."] = opinionType["Pct."].round(1)
opinionType["Count"] = opinionType["Count"].apply(lambda x: f"{x:,.0f}")

print(
    f"Opinion types of the audit reports if stated in the Item 4.01 filings (2004 - 2024):"
)
opinionType
Opinion types of the audit reports if stated in the Item 4.01 filings (2004 - 2024):
| Count | Pct. | |
|---|---|---|
| Audit Opinion Type | ||
| unqualified | 18,128 | 97.2 |
| qualified | 477 | 2.6 |
| adverse | 38 | 0.2 |
opinionType_year = item_4_01_exploded[["opinionType", "year", "accessionNo"]].explode(
    "opinionType"
)

opinionType_year_pivot = pd.pivot_table(
    opinionType_year,
    index="opinionType",
    columns="year",
    values="accessionNo",
    aggfunc="count",
    fill_value=0,
)

opinionType_year_pivot["total"] = opinionType_year_pivot.sum(axis=1)
opinionType_year_pivot = opinionType_year_pivot.sort_values(by="total", ascending=False)
# remove artifacts
opinionType_year_pivot = opinionType_year_pivot[
    opinionType_year_pivot["total"] >= 0.001 * opinionType_year_pivot["total"].sum()
]

opinionType_year_pivot
| year | 2004 | 2005 | 2006 | 2007 | 2008 | 2009 | 2010 | 2011 | 2012 | 2013 | ... | 2016 | 2017 | 2018 | 2019 | 2020 | 2021 | 2022 | 2023 | 2024 | total |
|---|---|---|---|---|---|---|---|---|---|---|---|---|---|---|---|---|---|---|---|---|---|
| opinionType | |||||||||||||||||||||
| unqualified | 501 | 1348 | 1405 | 1272 | 1103 | 1353 | 1159 | 1003 | 826 | 1112 | ... | 669 | 668 | 548 | 491 | 447 | 580 | 575 | 591 | 672 | 18128 |
| qualified | 13 | 61 | 46 | 39 | 38 | 55 | 42 | 31 | 19 | 25 | ... | 12 | 9 | 8 | 6 | 2 | 6 | 8 | 3 | 15 | 477 |
| adverse | 0 | 4 | 2 | 5 | 0 | 0 | 0 | 2 | 3 | 5 | ... | 0 | 1 | 3 | 4 | 1 | 1 | 2 | 2 | 2 | 38 |
3 rows × 22 columns
fig, ax = plt.subplots(figsize=(5, 3))

opinionType_year_pivot.drop(columns="total").T.plot(
    kind="bar", stacked=True, ax=ax, cmap="tab20"
)

ax.set_title("Number of Item 4.01 Filings\nby End of Engagement Reason and Year")
ax.set_xlabel("Year")
ax.set_ylabel("Number of Filings")
ax.xaxis.grid(False)
ax.set_axisbelow(True)
handles, labels = ax.get_legend_handles_labels()  # reverse order of legend items

labels = [
    "declination" if label == "declination to stand for reappointment" else label
    for label in labels
]

ax.legend(
    reversed(handles),
    reversed(labels),
    title="Auditor",
    bbox_to_anchor=(1.05, 1),
    labelspacing=0.3,
    fontsize=8,
)

plt.tight_layout()
plt.show()
