Analysis of Regulation A Offering Statement Disclosures
![]()
![]()
This notebook demonstrates an exploratory data analysis examining offering statement disclosures filed under Regulation A in SEC Form 1-A, as well as subsequent updates submitted via SEC Forms 1-K and 1-Z.
Since 2015, companies have submitted Part I of these disclosures, containing notification details, in XML format. Leveraging our Regulation A Offering Statement API, we transform these disclosures into a standardized JSON format, facilitating comprehensive and efficient analysis.
Our analysis addresses several critical dimensions:
- Temporal trends in the number of Regulation A disclosures from 2015 to 2024, segmented by quarter, month, and intraday timing (pre-market, regular market hours, after-market).
- Distribution patterns across structured data fields, including the proportion of disclosures categorized by specific form types.
- Analysis of the offered amounts, including their distribution and temporal evolution.
- Progress tracking of offering campaigns over the reported years.
- Final aggregated metrics, including total securities sold and the corresponding completion percentages at campaign conclusion.
- Analysis of fee percentages relative to the amounts raised during offering campaigns.
Quick Start
To quickly retrieve data for a specific company, modify the following example as needed. For more detail, see Regulation A Offering Statement API and sec-api-python package readme.
%pip install sec_api # use %pip for reliable install in current environment
# NOTE: Replace with your own API key
API_KEY_SEC_API = "YOUR_API_KEY"
from sec_api import RegASearchAllApi
import json

searchApi = RegASearchAllApi(api_key=API_KEY_SEC_API)

search_params = {
    "query": "cik:1061040",
    "from": "0",
    "size": "1",
    "sort": [{"filedAt": {"order": "desc"}}],
}

# get C filing metadata: issuer background, offering details,
# financial information, and more
response = searchApi.get_data(search_params)
form_1a_filing = response["data"]

print(json.dumps(form_1a_filing, indent=2))
{
  "id": "d9e400922a251c022bcebf0cc1c2f632",
  "accessionNo": "0001477932-25-001240",
  "fileNo": "024-12580",
  "formType": "1-A",
  "filedAt": "2025-02-25T06:47:00-05:00",
  "cik": "1061040",
  "ticker": "",
  "companyName": "New Generation Consumer Group, Inc.",
  "employeesInfo": [
    {
      "issuerName": "New Generation Consumer Group Inc.",
      "jurisdictionOrganization": "DE",
      "yearIncorporation": "1998",
      "cik": "0001061040",
      "sicCode": 7371,
      "irsNum": "11-3118271",
      "fullTimeEmployees": 1,
      "partTimeEmployees": 0
    }
  ],
  "issuerInfo": {
    "street1": "7950 E. Redfield Rd, Unit 210",
    "city": "Scottsdale",
    "stateOrCountry": "AZ",
    "zipCode": "85260",
    "phoneNumber": "480-755-0591",
    "connectionName": "Eric Newlan",
    "industryGroup": "Other",
    "cashEquivalents": 0,
    "investmentSecurities": 0,
    "accountsReceivable": 0,
    "propertyPlantEquipment": 0,
    "totalAssets": 100000,
    "accountsPayable": 27724,
    "longTermDebt": 0,
    "totalLiabilities": 27724,
    "totalStockholderEquity": 72276,
    "totalLiabilitiesAndEquity": 100000,
    "totalRevenues": 0,
    "costAndExpensesApplToRevenues": 0,
    "depreciationAndAmortization": 0,
    "netIncome": 0,
    "earningsPerShareBasic": 0,
    "earningsPerShareDiluted": 0
  },
  "commonEquity": [
    {
      "commonEquityClassName": "Common Stock",
      "outstandingCommonEquity": 1786672777,
      "commonCusipEquity": "584976302",
      "publiclyTradedCommonEquity": "OTC Pink"
    }
  ],
  "preferredEquity": [
    {
      "preferredEquityClassName": "Series A-2 Preferred Stock",
      "outstandingPreferredEquity": 1000000,
      "preferredCusipEquity": "0000000",
      "publiclyTradedPreferredEquity": "N/A"
    }
  ],
  "debtSecurities": [
    {
      "debtSecuritiesClassName": "None",
      "outstandingDebtSecurities": 0,
      "cusipDebtSecurities": "0000000",
      "publiclyTradedDebtSecurities": "N/A"
    }
  ],
  "issuerEligibility": {
    "certifyIfTrue": true
  },
  "applicationRule262": {
    "certifyIfNotDisqualified": true,
    "certifyIfBadActor": false
  },
  "summaryInfo": {
    "indicateTier1Tier2Offering": "Tier1",
    "financialStatementAuditStatus": "Unaudited",
    "securitiesOfferedTypes": [
      "Equity (common or preferred stock)"
    ],
    "offerDelayedContinuousFlag": true,
    "offeringYearFlag": false,
    "offeringAfterQualifFlag": true,
    "offeringBestEffortsFlag": true,
    "solicitationProposedOfferingFlag": false,
    "resaleSecuritiesAffiliatesFlag": false,
    "securitiesOffered": 2000000000,
    "outstandingSecurities": 1821272777,
    "pricePerSecurity": 0.0005,
    "issuerAggregateOffering": 1000000,
    "securityHolderAggegate": 0,
    "qualificationOfferingAggregate": 0,
    "concurrentOfferingAggregate": 0,
    "totalAggregateOffering": 1000000,
    "underwritersFees": 0,
    "salesCommissionsServiceProviderFees": 0,
    "finderFeesFee": 0,
    "auditorFees": 0,
    "legalServiceProviderName": "Newlan Law Firm, PLLC",
    "legalFees": 7500,
    "promotersFees": 0,
    "blueSkyServiceProviderName": "State Regulators",
    "blueSkyFees": 2500,
    "estimatedNetAmount": 990000
  },
  "juridictionSecuritiesOffered": {
    "jurisdictionsOfSecOfferedNone": true,
    "issueJuridicationSecuritiesOffering": [
      "AK",
      "AL",
      "AR",
      "AZ",
      "CA",
      "CO",
      "CT",
      "DC",
      "DC",
      "DE",
      "FL",
      "GA",
      "HI",
      "IA",
      "ID",
      "IL",
      "IN",
      "KS",
      "KY",
      "LA",
      "MA",
      "MD",
      "ME",
      "MI",
      "MN",
      "MO",
      "MS",
      "MT",
      "NC",
      "ND",
      "NE",
      "NH",
      "NJ",
      "NM",
      "NV",
      "NY",
      "OH",
      "OK",
      "OR",
      "PA",
      "RI",
      "SC",
      "SD",
      "TN",
      "TX",
      "UT",
      "VA",
      "VT",
      "WA",
      "WI",
      "WV",
      "WY",
      "PR"
    ]
  },
  "unregisteredSecurities": {
    "ifUnregsiteredNone": false
  },
  "securitiesIssued": [
    {
      "securitiesIssuerName": "New Generation Consumer Group Inc.",
      "securitiesIssuerTitle": "COMMON",
      "securitiesIssuedTotalAmount": 500000000,
      "securitiesPrincipalHolderAmount": 0,
      "securitiesIssuedAggregateAmount": "$50000; TERMS OF CONTRACTS; DETERMINATION OF BOARD OF DIRECTORS"
    }
  ],
  "unregisteredSecuritiesAct": {
    "securitiesActExcemption": "Section 4(a)(2) of the Securities Act of 1933, as amended"
  }
}
Download Dataset
To load and prepare the dataset of over 10,000 offering statement filings from Forms 1-A, 1-K and 1-Z in since June 2015, we utilize the Search endpoint of the Regulation A Offering Statements API. This endpoint can retrieve the filings of all three subtypes. The following code handles data loading and preparation by executing multiple download processes in parallel, significantly reducing downloading time.
Once downloaded, all data objects are saved in JSONL format to ./reg-a-dataset.jsonl.
Downloading the data may take several minutes.
import sys
import os
import time
import random

# from multiprocessing import Pool # use in .py files only
from concurrent.futures import ThreadPoolExecutor

YEARS = range(2025, 2014, -1)  # from 2025 to 2015
TEMP_FILE_TEMPLATE = "./temp_file_reg_a_{}.jsonl"
TARGET_FILE = "./reg-a-dataset.jsonl"


def process_year(year):
    backoff_time = random.randint(10, 800) / 1000
    print(f"Starting year {year} with backoff time {backoff_time:,}s")
    sys.stdout.flush()
    time.sleep(backoff_time)

    tmp_filename = TEMP_FILE_TEMPLATE.format(year)
    tmp_file = open(tmp_filename, "a")

    for month in range(12, 0, -1):
        search_from = 0
        month_counter = 0

        while True:
            query = f"filedAt:[{year}-{month:02d}-01 TO {year}-{month:02d}-31]"
            searchRequest = {
                "query": query,
                "from": search_from,
                "size": "50",
                "sort": [{"filedAt": {"order": "desc"}}],
            }

            response = None
            try:
                response = searchApi.get_data(searchRequest)
            except Exception as e:
                print(f"{year}-{month:02d} error: {e}")
                sys.stdout.flush()
                continue

            if response == None or len(response["data"]) == 0:
                break

            search_from += 50
            month_counter += len(response["data"])
            jsonl_data = "\n".join([json.dumps(entry) for entry in response["data"]])
            tmp_file.write(jsonl_data + "\n")

        print(f"Finished loading {month_counter} filings for {year}-{month:02d}")
        sys.stdout.flush()

    tmp_file.close()

    return year


if not os.path.exists(TARGET_FILE):
    with ThreadPoolExecutor(max_workers=4) as pool:
        processed_years = list(pool.map(process_year, YEARS))
    print("Finished processing all years.", processed_years)

    # merge the temporary files into one final file
    with open(TARGET_FILE, "a") as outfile:
        for year in YEARS:
            temp_file = TEMP_FILE_TEMPLATE.format(year)
            if os.path.exists(temp_file):
                with open(temp_file, "r") as infile:
                    outfile.write(infile.read())
else:
    print("File already exists. Skipping download.")
File already exists. Skipping download.
# install all dependencies required for the notebook
# %pip install pandas numpy matplotlib seaborn
import pandas as pd
import numpy as np
import matplotlib.pyplot as plt
import matplotlib.style as style
import matplotlib.ticker as mtick
import seaborn as sns

style.use("default")

params = {
    "axes.labelsize": 8,
    "font.size": 8,
    "legend.fontsize": 8,
    "xtick.labelsize": 8,
    "ytick.labelsize": 8,
    "font.family": "sans-serif",
    "axes.spines.top": False,
    "axes.spines.right": False,
    "grid.color": "grey",
    "axes.grid": True,
    "axes.grid.axis": "y",
    "grid.alpha": 0.5,
    "grid.linestyle": ":",
}

plt.rcParams.update(params)

form_name = "Reg A"
form_name_escaped = "reg-a"
TARGET_FILE = "./REG-A-dataset.jsonl"
structured_data = pd.read_json(TARGET_FILE, lines=True)
structured_data = pd.json_normalize(structured_data.to_dict(orient="records"))

structured_data["filedAt"] = pd.to_datetime(structured_data["filedAt"], utc=True)
structured_data["filedAt"] = structured_data["filedAt"].dt.tz_convert("US/Eastern")
structured_data = structured_data.sort_values("filedAt", ascending=True).reset_index(
    drop=True
)
structured_data.drop_duplicates("accessionNo", keep="first", inplace=True)
structured_data["year"] = structured_data["filedAt"].dt.year
structured_data["month"] = structured_data["filedAt"].dt.month
structured_data["qtr"] = structured_data["month"].apply(lambda x: (x - 1) // 3 + 1)
structured_data["dayOfWeek"] = structured_data["filedAt"].dt.day_name()
# filedAtClass: preMarket (4:00AM-9:30AM), regularMarket (9:30AM-4:00PM), afterMarket (4:00PM-8:00PM)
structured_data["filedAtClass"] = structured_data["filedAt"].apply(
    lambda x: (
        "preMarket"
        if x.hour < 9 or (x.hour == 9 and x.minute < 30)
        else (
            "regularMarket"
            if x.hour < 16
            else "afterMarket" if x.hour < 20 else "other"
        )
    )
)

structured_data.head()

unique_years = structured_data["year"].nunique()
unique_companies = structured_data["cik"].nunique()
unique_filings = structured_data["accessionNo"].nunique()
min_year = structured_data["year"].min()
max_year = structured_data["year"].max()
max_year_full = max_year - 1  # to avoid incomplete data for the current year
print("Loaded dataframe with main documents of Regulation A Offering Statement filings")
print(f"Number of filings: {unique_filings:,}")
print(f"Number of records: {len(structured_data):,}")
print(f"Number of years: {unique_years:,} ({min_year}-{max_year})")
print(f"Number of unique companies: {unique_companies:,}")

structured_data.head()
Loaded dataframe with main documents of Regulation A Offering Statement filings
Number of filings: 11,411
Number of records: 11,411
Number of years: 11 (2015-2025)
Number of unique companies: 1,696
| id | accessionNo | fileNo | formType | filedAt | cik | ticker | companyName | employeesInfo | commonEquity | ... | issuerInfo.deposits | issuerInfo.totalInterestIncome | issuerInfo.totalInterestExpenses | issuerInfo.totalInvestments | issuerInfo.policyLiabilitiesAndAccruals | year | month | qtr | dayOfWeek | filedAtClass | |
|---|---|---|---|---|---|---|---|---|---|---|---|---|---|---|---|---|---|---|---|---|---|
| 0 | aa6c5e9327a19e1db80556a577e07dc1 | 0001645471-15-000001 | 024-10455 | 1-A | 2015-06-22 15:19:25-04:00 | 1645471 | Tuscan Gardens Secured Income Fund LLC | [{'issuerName': 'Tuscan Gardens Secured Income... | [{'commonEquityClassName': '0', 'outstandingCo... | ... | NaN | NaN | NaN | NaN | NaN | 2015 | 6 | 2 | Monday | regularMarket | |
| 1 | 747b503117a537e5c7729301c33ddeec | 0001587999-15-000003 | 024-10456 | 1-A | 2015-06-23 09:56:37-04:00 | 1587999 | Southern Tier Region Rural Broadband Company, ... | [{'issuerName': 'Southern Tier Region Rural Br... | [{'commonEquityClassName': 'common voting', 'o... | ... | NaN | NaN | NaN | NaN | NaN | 2015 | 6 | 2 | Tuesday | regularMarket | |
| 2 | 6476f78a7b89dca2c0dc0c456b2be538 | 0001587999-15-000004 | 024-10457 | 1-A | 2015-06-23 10:40:37-04:00 | 1579586 | Finger Lakes Region Rural Broadband Company, Inc. | [{'issuerName': 'Finger Lakes Region Rural Bro... | [{'commonEquityClassName': 'common voting', 'o... | ... | NaN | NaN | NaN | NaN | NaN | 2015 | 6 | 2 | Tuesday | regularMarket | |
| 3 | ff589f8779fddb23498dcada5d0b75ac | 0001587999-15-000005 | 024-10458 | 1-A | 2015-06-23 11:49:12-04:00 | 1640170 | Western Gateway Region Rural Broadband Company... | [{'issuerName': 'Western Gateway Region Rural ... | [{'commonEquityClassName': 'common voting', 'o... | ... | NaN | NaN | NaN | NaN | NaN | 2015 | 6 | 2 | Tuesday | regularMarket | |
| 4 | 4aa98853a21d4de1f9550dbef5cf7643 | 0001587999-15-000007 | 024-10459 | 1-A | 2015-06-23 12:34:20-04:00 | 1644516 | Mid-Hudson Broadband Co | [{'issuerName': 'Mid-Hudson Broadband Co', 'ju... | [{'commonEquityClassName': 'common voting', 'o... | ... | NaN | NaN | NaN | NaN | NaN | 2015 | 6 | 2 | Tuesday | regularMarket |
5 rows × 121 columns
structured_data.info()
<class 'pandas.core.frame.DataFrame'>
Index: 11411 entries, 0 to 11435
Columns: 121 entries, id to filedAtClass
dtypes: datetime64[ns, US/Eastern](1), float64(47), int32(2), int64(2), object(69)
memory usage: 10.5+ MB
for s in structured_data.columns:
    print(f"{s}: {structured_data[s].notna().size} non-nan values")
id: 11411 non-nan values
accessionNo: 11411 non-nan values
fileNo: 11411 non-nan values
formType: 11411 non-nan values
filedAt: 11411 non-nan values
cik: 11411 non-nan values
ticker: 11411 non-nan values
companyName: 11411 non-nan values
employeesInfo: 11411 non-nan values
commonEquity: 11411 non-nan values
preferredEquity: 11411 non-nan values
debtSecurities: 11411 non-nan values
securitiesIssued: 11411 non-nan values
unregisteredSecurities: 11411 non-nan values
periodOfReport: 11411 non-nan values
item1: 11411 non-nan values
item1Info: 11411 non-nan values
item2: 11411 non-nan values
certificationSuspension: 11411 non-nan values
signatureTab: 11411 non-nan values
summaryInfoOffering: 11411 non-nan values
issuerInfo.street1: 11411 non-nan values
issuerInfo.street2: 11411 non-nan values
issuerInfo.city: 11411 non-nan values
issuerInfo.stateOrCountry: 11411 non-nan values
issuerInfo.zipCode: 11411 non-nan values
issuerInfo.phoneNumber: 11411 non-nan values
issuerInfo.connectionName: 11411 non-nan values
issuerInfo.industryGroup: 11411 non-nan values
issuerInfo.cashEquivalents: 11411 non-nan values
issuerInfo.investmentSecurities: 11411 non-nan values
issuerInfo.accountsReceivable: 11411 non-nan values
issuerInfo.propertyPlantEquipment: 11411 non-nan values
issuerInfo.totalAssets: 11411 non-nan values
issuerInfo.accountsPayable: 11411 non-nan values
issuerInfo.longTermDebt: 11411 non-nan values
issuerInfo.totalLiabilities: 11411 non-nan values
issuerInfo.totalStockholderEquity: 11411 non-nan values
issuerInfo.totalLiabilitiesAndEquity: 11411 non-nan values
issuerInfo.totalRevenues: 11411 non-nan values
issuerInfo.costAndExpensesApplToRevenues: 11411 non-nan values
issuerInfo.depreciationAndAmortization: 11411 non-nan values
issuerInfo.netIncome: 11411 non-nan values
issuerInfo.earningsPerShareBasic: 11411 non-nan values
issuerInfo.earningsPerShareDiluted: 11411 non-nan values
issuerInfo.nameAuditor: 11411 non-nan values
issuerEligibility.certifyIfTrue: 11411 non-nan values
applicationRule262.certifyIfNotDisqualified: 11411 non-nan values
summaryInfo.indicateTier1Tier2Offering: 11411 non-nan values
summaryInfo.financialStatementAuditStatus: 11411 non-nan values
summaryInfo.securitiesOfferedTypes: 11411 non-nan values
summaryInfo.offerDelayedContinuousFlag: 11411 non-nan values
summaryInfo.offeringYearFlag: 11411 non-nan values
summaryInfo.offeringAfterQualifFlag: 11411 non-nan values
summaryInfo.offeringBestEffortsFlag: 11411 non-nan values
summaryInfo.solicitationProposedOfferingFlag: 11411 non-nan values
summaryInfo.resaleSecuritiesAffiliatesFlag: 11411 non-nan values
summaryInfo.securitiesOffered: 11411 non-nan values
summaryInfo.outstandingSecurities: 11411 non-nan values
summaryInfo.pricePerSecurity: 11411 non-nan values
summaryInfo.issuerAggregateOffering: 11411 non-nan values
summaryInfo.securityHolderAggegate: 11411 non-nan values
summaryInfo.qualificationOfferingAggregate: 11411 non-nan values
summaryInfo.concurrentOfferingAggregate: 11411 non-nan values
summaryInfo.totalAggregateOffering: 11411 non-nan values
summaryInfo.underwritersServiceProviderName: 11411 non-nan values
summaryInfo.underwritersFees: 11411 non-nan values
summaryInfo.salesCommissionsServiceProviderName: 11411 non-nan values
summaryInfo.salesCommissionsServiceProviderFees: 11411 non-nan values
summaryInfo.findersFeesServiceProviderName: 11411 non-nan values
summaryInfo.finderFeesFee: 11411 non-nan values
summaryInfo.auditorServiceProviderName: 11411 non-nan values
summaryInfo.auditorFees: 11411 non-nan values
summaryInfo.legalServiceProviderName: 11411 non-nan values
summaryInfo.legalFees: 11411 non-nan values
summaryInfo.promotersServiceProviderName: 11411 non-nan values
summaryInfo.promotersFees: 11411 non-nan values
summaryInfo.blueSkyServiceProviderName: 11411 non-nan values
summaryInfo.blueSkyFees: 11411 non-nan values
summaryInfo.estimatedNetAmount: 11411 non-nan values
summaryInfo.clarificationResponses: 11411 non-nan values
juridictionSecuritiesOffered.jurisdictionsOfSecOfferedNone: 11411 non-nan values
juridictionSecuritiesOffered.issueJuridicationSecuritiesOffering: 11411 non-nan values
unregisteredSecuritiesAct.securitiesActExcemption: 11411 non-nan values
unregisteredSecuritiesAct: 11411 non-nan values
applicationRule262.certifyIfBadActor: 11411 non-nan values
juridictionSecuritiesOffered.jurisdictionsOfSecOfferedSame: 11411 non-nan values
unregisteredSecurities.ifUnregsiteredNone: 11411 non-nan values
juridictionSecuritiesOffered.dealersJuridicationSecuritiesOffering: 11411 non-nan values
summaryInfo.brokerDealerCrdNumber: 11411 non-nan values
summaryInfo.securitiesOfferedOtherDesc: 11411 non-nan values
issuerInfo: 11411 non-nan values
issuerEligibility: 11411 non-nan values
applicationRule262: 11411 non-nan values
summaryInfo: 11411 non-nan values
juridictionSecuritiesOffered: 11411 non-nan values
item1.formIndication: 11411 non-nan values
item1.fiscalYearEnd: 11411 non-nan values
item1.street1: 11411 non-nan values
item1.city: 11411 non-nan values
item1.stateOrCountry: 11411 non-nan values
item1.zipCode: 11411 non-nan values
item1.phoneNumber: 11411 non-nan values
item1.issuedSecuritiesTitle: 11411 non-nan values
item2.regArule257: 11411 non-nan values
item1.street2: 11411 non-nan values
item1.issuerName: 11411 non-nan values
item1.phone: 11411 non-nan values
item1.commissionFileNumber: 11411 non-nan values
issuerInfo.loans: 11411 non-nan values
issuerInfo.propertyAndEquipment: 11411 non-nan values
issuerInfo.deposits: 11411 non-nan values
issuerInfo.totalInterestIncome: 11411 non-nan values
issuerInfo.totalInterestExpenses: 11411 non-nan values
issuerInfo.totalInvestments: 11411 non-nan values
issuerInfo.policyLiabilitiesAndAccruals: 11411 non-nan values
year: 11411 non-nan values
month: 11411 non-nan values
qtr: 11411 non-nan values
dayOfWeek: 11411 non-nan values
filedAtClass: 11411 non-nan values
structured_data_full_years = structured_data[
    structured_data["year"].between(min_year, max_year - 1)
]
def plot_timeseries(ts, title):
    fig, ax = plt.subplots(figsize=(4, 2.5))
    ts["count"].plot(ax=ax, legend=False)
    ax.set_title(title)
    ax.set_xlabel("Year")
    ax.set_ylabel(f"Number of\n{form_name} Filings")
    ax.set_xticks(np.arange(min_year, max_year, 1))
    ax.yaxis.set_major_formatter(mtick.StrMethodFormatter("{x:,.0f}"))
    ax.set_xlim(min_year - 1, max_year)
    ax.grid(axis="x")
    ax.set_axisbelow(True)
    plt.xticks(rotation=45, ha="right")

    for year in range(min_year, max_year, 1):
        year_y_max = ts.loc[year, "count"]
        ax.vlines(year, 0, year_y_max, linestyles=":", colors="grey", alpha=0.5, lw=1)

    plt.tight_layout()
    plt.show()


reg_a_filings = (
    structured_data_full_years.drop_duplicates(subset=["accessionNo"])
    .groupby(["year"])
    .size()
    .to_frame(name="count")
)

plot_timeseries(
    reg_a_filings,
    title=f"{form_name} Filings per Year ({min_year} - {max_year_full})",
)

count_formType = (
    structured_data_full_years.drop_duplicates(subset=["accessionNo"])
    .groupby(["formType"])
    .size()
    .sort_values(ascending=False)
    .to_frame(name="Count")
).rename_axis("Submission Type")
count_formType["Pct"] = (
    count_formType["Count"].astype(int) / count_formType["Count"].astype(int).sum()
).map("{:.0%}".format)
count_formType["Count"] = count_formType["Count"].map(lambda x: f"{x:,}")

print(f"{form_name} Disclosures by Submission Type ({min_year} - {max_year_full})")
count_formType
Reg A Disclosures by Submission Type (2015 - 2024)
| Count | Pct | |
|---|---|---|
| Submission Type | ||
| 1-A/A | 4,152 | 37% |
| 1-A POS | 2,242 | 20% |
| 1-A | 2,073 | 18% |
| 1-K | 1,965 | 17% |
| 1-A-W | 428 | 4% |
| 1-Z | 311 | 3% |
| 1-K/A | 103 | 1% |
| 1-Z/A | 9 | 0% |
| 1-Z-W | 6 | 0% |
form_counts_by_type_and_year = (
    structured_data_full_years.drop_duplicates(subset=["accessionNo"])
    .groupby(["year", "formType"])
    .size()
    .to_frame(name="count")
    .unstack(fill_value=0)
)

form_counts_by_type_and_year.loc["Total"] = form_counts_by_type_and_year.sum()
form_counts_by_type_and_year["Total"] = form_counts_by_type_and_year.sum(axis=1)


print(f"{form_name} counts from {min_year} to {max_year_full}.")
form_counts_by_type_and_year
Reg A counts from 2015 to 2024.
| count | Total | |||||||||
|---|---|---|---|---|---|---|---|---|---|---|
| formType | 1-A | 1-A POS | 1-A-W | 1-A/A | 1-K | 1-K/A | 1-Z | 1-Z-W | 1-Z/A | |
| year | ||||||||||
| 2015 | 53 | 3 | 10 | 107 | 0 | 0 | 5 | 0 | 0 | 178 |
| 2016 | 145 | 84 | 31 | 347 | 13 | 1 | 9 | 0 | 2 | 632 |
| 2017 | 125 | 148 | 22 | 353 | 59 | 7 | 24 | 1 | 1 | 740 |
| 2018 | 144 | 196 | 31 | 384 | 87 | 4 | 24 | 1 | 1 | 872 |
| 2019 | 204 | 198 | 41 | 444 | 109 | 9 | 22 | 0 | 0 | 1027 |
| 2020 | 255 | 291 | 45 | 606 | 155 | 11 | 25 | 0 | 0 | 1388 |
| 2021 | 360 | 324 | 55 | 684 | 244 | 7 | 30 | 0 | 4 | 1708 |
| 2022 | 352 | 368 | 56 | 462 | 356 | 33 | 64 | 2 | 0 | 1693 |
| 2023 | 264 | 374 | 64 | 394 | 458 | 20 | 59 | 1 | 0 | 1634 |
| 2024 | 171 | 256 | 73 | 371 | 484 | 11 | 49 | 1 | 1 | 1417 |
| Total | 2073 | 2242 | 428 | 4152 | 1965 | 103 | 311 | 6 | 9 | 11289 |
fig, ax = plt.subplots(figsize=(6, 3))
form_counts_by_type_and_year["count"].drop("Total").plot(
    kind="bar", stacked=True, ax=ax
)
ax.set_xlabel("Year")
ax.set_ylabel("Number of Filings")
ax.yaxis.set_major_formatter(mtick.StrMethodFormatter("{x:,.0f}"))
ax.grid(axis="x")
ax.set_axisbelow(True)
handles, labels = ax.get_legend_handles_labels()
ax.legend(
    list(reversed(handles)),
    list(reversed(labels)),
    title="Form Type",
    labelspacing=0.15,
)
ax.set_title(
    f"{form_name} Filings by Form Type per Year ({min_year} - {max_year_full})"
)
plt.show()

counts_qtr_yr_piv = (
    structured_data_full_years.groupby(["year", "qtr"]).size().unstack().fillna(0)
).astype(int)

print(f"{form_name} counts by quarter from {min_year} to {max_year_full}.")
counts_qtr_yr_piv.T
Reg A counts by quarter from 2015 to 2024.
| year | 2015 | 2016 | 2017 | 2018 | 2019 | 2020 | 2021 | 2022 | 2023 | 2024 |
|---|---|---|---|---|---|---|---|---|---|---|
| qtr | ||||||||||
| 1 | 0 | 137 | 177 | 216 | 182 | 260 | 402 | 323 | 373 | 247 |
| 2 | 12 | 133 | 183 | 251 | 322 | 379 | 523 | 632 | 704 | 686 |
| 3 | 67 | 173 | 185 | 225 | 275 | 359 | 393 | 356 | 301 | 241 |
| 4 | 99 | 189 | 195 | 180 | 248 | 390 | 390 | 382 | 256 | 243 |
plt.figure(figsize=(4, 2))
sns.heatmap(
    counts_qtr_yr_piv.T,
    annot=True,  # Display the cell values
    fmt="d",  # Integer formatting
    cmap="magma",  # Color map
    cbar_kws={"label": "Count"},  # Colorbar label
    mask=counts_qtr_yr_piv.T == 0,  # Mask the cells with value 0
    cbar=False,
    annot_kws={"fontsize": 7},
)
plt.grid(False)
plt.title(f"{form_name} Counts by Quarter {min_year} to {max_year_full}")
plt.xlabel("Year")
plt.ylabel("Quarter")
plt.tight_layout()
plt.show()

form_types = count_formType.index.tolist()

fig, axes = plt.subplots(3, 3, figsize=(9, 7))

cnt = 0
for formType in form_types:
    data = (
        structured_data_full_years[structured_data_full_years["formType"] == formType]
        .groupby(["year", "qtr"])
        .size()
        .unstack()
        .fillna(0)
        .astype(int)
        .reindex(columns=range(1, 5), fill_value=0)  # ensure all month are included
    )

    filing_name = formType
    # if data.sum().sum() < 100:
    #     continue

    ax = axes.flatten()[cnt]

    sns.heatmap(
        data.T,
        ax=ax,
        annot=True,  # Display the cell values
        fmt="d",  # Integer formatting
        cmap="magma",  # Color map
        cbar_kws={"label": "Count"},  # Colorbar label
        mask=data.T == 0,  # Mask the cells with value 0
        cbar=False,
        annot_kws={"fontsize": 7},
    )
    ax.grid(False)
    ax.set_title(f"{filing_name} Counts")
    ax.set_xlabel("Year")
    ax.set_ylabel("Quarter")

    cnt += 1

fig.suptitle(f"Regulation A Filing Counts by Quarter {min_year} to {max_year_full}")
plt.tight_layout()

counts_qtr_yr = counts_qtr_yr_piv.stack().reset_index(name="count")

fig, ax = plt.subplots(figsize=(6, 2.5))
counts_qtr_yr_piv.plot(kind="bar", ax=ax, legend=True)
ax.legend(title="Quarter", loc="upper right", bbox_to_anchor=(1.15, 1))
ax.set_title(f"Number of {form_name} Filings per Quarter\n({min_year}-{max_year_full})")
ax.set_xlabel("Year")
ax.set_ylabel(f"Number of\n{form_name} Filings")
ax.yaxis.set_major_formatter(mtick.StrMethodFormatter("{x:,.0f}"))
ax.grid(axis="x")
ax.set_axisbelow(True)
plt.tight_layout()
plt.show()

counts_month_yr_piv = (
    structured_data_full_years.groupby(["year", "month"]).size().unstack().fillna(0)
).astype(int)

plt.figure(figsize=(6, 4))
sns.heatmap(
    counts_month_yr_piv,
    annot=True,
    fmt="d",
    cmap="magma",
    cbar_kws={"label": "Count"},
    mask=counts_month_yr_piv == 0,
    cbar=False,
    annot_kws={"size": 7},
)
# convert x-labels to month names: 1 => Jan, 2 => Feb, etc.
plt.xticks(
    ticks=np.arange(0.5, 12.5, 1),
    labels=[pd.to_datetime(str(i), format="%m").strftime("%b") for i in range(1, 13)],
)
plt.grid(False)
plt.title(f"{form_name} Counts by Month ({min_year} - {max_year_full})")
plt.xlabel("")
plt.ylabel("Year")
plt.tight_layout()
plt.show()

counts_initial_only_month_yr_piv = (
    structured_data_full_years[structured_data_full_years["formType"] == "1-A"]
    .groupby(["year", "month"])
    .size()
    .unstack()
    .fillna(0)
).astype(int)

plt.figure(figsize=(6, 4))
sns.heatmap(
    counts_initial_only_month_yr_piv,
    annot=True,
    fmt="d",
    cmap="magma",
    cbar_kws={"label": "Count"},
    mask=counts_initial_only_month_yr_piv == 0,
    cbar=False,
    annot_kws={"size": 7},
)
# convert x-labels to month names: 1 => Jan, 2 => Feb, etc.
plt.xticks(
    ticks=np.arange(0.5, 12.5, 1),
    labels=[pd.to_datetime(str(i), format="%m").strftime("%b") for i in range(1, 13)],
)
plt.grid(False)
plt.title(f"Initial Filing Counts (Form 1-A) by Month ({min_year} - {max_year_full})")
plt.xlabel("")
plt.ylabel("Year")
plt.tight_layout()
plt.show()

print(
    f"Descriptive statistics for Form 1-A filing counts by month from {min_year} to {max_year_full}."
)
month_stats = (
    counts_initial_only_month_yr_piv.loc[2004:]
    .describe(percentiles=[0.025, 0.975])
    .round(0)
    .astype(int)
)
month_stats
Descriptive statistics for Form 1-A filing counts by month from 2015 to 2024.
| month | 1 | 2 | 3 | 4 | 5 | 6 | 7 | 8 | 9 | 10 | 11 | 12 |
|---|---|---|---|---|---|---|---|---|---|---|---|---|
| count | 10 | 10 | 10 | 10 | 10 | 10 | 10 | 10 | 10 | 10 | 10 | 10 |
| mean | 16 | 13 | 19 | 14 | 16 | 20 | 17 | 19 | 18 | 18 | 18 | 18 |
| std | 10 | 10 | 11 | 11 | 9 | 7 | 9 | 7 | 11 | 9 | 12 | 9 |
| min | 0 | 0 | 0 | 0 | 0 | 7 | 2 | 9 | 9 | 6 | 6 | 8 |
| 2.5% | 2 | 1 | 2 | 1 | 1 | 9 | 3 | 9 | 9 | 6 | 6 | 8 |
| 50% | 14 | 10 | 18 | 12 | 16 | 18 | 18 | 18 | 16 | 14 | 18 | 16 |
| 97.5% | 32 | 29 | 35 | 32 | 28 | 31 | 29 | 29 | 40 | 33 | 39 | 33 |
| max | 34 | 30 | 36 | 34 | 28 | 32 | 29 | 29 | 43 | 35 | 39 | 33 |
def plot_box_plot_as_line(
    data: pd.DataFrame,
    x_months=True,
    title="",
    x_label="",
    x_pos_mean_label=2,
    pos_labels=None,
    pos_high_low=None,
    y_label="",
    y_formatter=lambda x, p: "{:.0f}".format(int(x) / 1000),
    show_high_low_labels=True,
    show_inline_labels=True,
    show_bands=True,
    figsize=(4, 2.5),
    line_source="mean",
):
    fig, ax = plt.subplots(figsize=figsize)

    line_to_plot = data[line_source]
    lower_label = "2.5%"
    upper_label = "97.5%"
    lower = data[lower_label]
    upper = data[upper_label]

    line_to_plot.plot(ax=ax)

    if show_bands:
        ax.fill_between(line_to_plot.index, lower, upper, alpha=0.2)

    if x_months:
        ax.set_xlim(0.5, 12.5)
        ax.set_xticks(range(1, 13))
        ax.set_xticklabels(["J", "F", "M", "A", "M", "J", "J", "A", "S", "O", "N", "D"])

    ax.yaxis.set_major_formatter(mtick.FuncFormatter(y_formatter))
    ax.set_ylabel(y_label)
    ax.set_xlabel(x_label)
    ax.set_title(title)

    ymin, ymax = ax.get_ylim()
    y_scale = ymax - ymin

    max_x = int(line_to_plot.idxmax())
    max_y = line_to_plot.max()
    min_x = int(line_to_plot.idxmin())
    min_y = line_to_plot.min()

    ax.axvline(
        max_x,
        ymin=0,
        ymax=((max_y - ymin) / (ymax - ymin)),
        linestyle="dashed",
        color="tab:blue",
        alpha=0.5,
    )
    ax.scatter(max_x, max_y, color="tab:blue", s=10)
    ax.axvline(
        min_x,
        ymin=0,
        ymax=((min_y - ymin) / (ymax - ymin)),
        linestyle="dashed",
        color="tab:blue",
        alpha=0.5,
    )
    ax.scatter(min_x, min_y, color="tab:blue", s=10)

    x_pos_mean_label_int = int(x_pos_mean_label)
    if show_inline_labels:
        mean_x = x_pos_mean_label
        mean_y = line_to_plot.iloc[x_pos_mean_label_int] * 1.02
        upper_x = x_pos_mean_label
        upper_y = upper.iloc[x_pos_mean_label_int]
        lower_x = x_pos_mean_label
        lower_y = lower.iloc[x_pos_mean_label_int] * 0.95

        if pos_labels:
            mean_x = pos_labels["mean"]["x"]
            mean_y = pos_labels["mean"]["y"]
            upper_x = pos_labels["upper"]["x"]
            upper_y = pos_labels["upper"]["y"]
            lower_x = pos_labels["lower"]["x"]
            lower_y = pos_labels["lower"]["y"]

        ax.text(mean_x, mean_y, "Mean", color="tab:blue", fontsize=8)
        ax.text(upper_x, upper_y, upper_label, color="tab:blue", fontsize=8)
        ax.text(lower_x, lower_y, lower_label, color="tab:blue", fontsize=8)

    if show_high_low_labels:
        high_x_origin = max_x
        high_y_origin = max_y
        high_x_label = high_x_origin + 0.5
        high_y_label = high_y_origin + 0.1 * y_scale
        if pos_high_low:
            high_x_label = pos_high_low["high"]["x"]
            high_y_label = pos_high_low["high"]["y"]
        ax.annotate(
            "High",
            (high_x_origin, high_y_origin),
            xytext=(high_x_label, high_y_label),
            arrowprops=dict(facecolor="black", arrowstyle="->"),
        )

        low_x_origin = min_x * 1.01
        low_y_origin = min_y
        low_x_label = low_x_origin + 1.5
        low_y_label = low_y_origin - 0.1 * y_scale
        if pos_high_low:
            low_x_label = pos_high_low["low"]["x"]
            low_y_label = pos_high_low["low"]["y"]
        ax.annotate(
            "Low",
            (low_x_origin, low_y_origin),
            xytext=(low_x_label, low_y_label),
            arrowprops=dict(facecolor="black", arrowstyle="->"),
        )

    ax.grid(axis="x")
    ax.set_axisbelow(True)

    plt.tight_layout()
    plt.show()


plot_box_plot_as_line(
    data=month_stats.T,
    title=f"Descriptive Statistics for Form 1-A Filings by Month\n({min_year} - {max_year_full})",
    x_label="Month",
    y_label="Number of\nForm 1-A Filings",
    y_formatter=lambda x, p: "{:.0f}".format(int(x)),
    x_pos_mean_label=5,
)

form_types = count_formType.index.tolist()

fig, axes = plt.subplots(4, 3, figsize=(9, 7))

cnt = 0
for formType in form_types:

    data = (
        structured_data_full_years[structured_data_full_years["formType"] == formType]
        .groupby(["year", "month"])
        .size()
        .unstack()
        .fillna(0)
        .reindex(columns=range(1, 13), fill_value=0)  # ensure all month are included
    )

    # if data.sum().sum() < 100:
    #     continue

    ax = axes.flatten()[cnt]
    cnt += 1
    try:
        data.boxplot(
            ax=ax,
            grid=False,
            showfliers=False,
            flierprops=dict(marker="o", markersize=3),
            patch_artist=True,
            boxprops=dict(facecolor="white", color="tab:blue"),
            showmeans=True,
            meanline=True,
            meanprops={"color": "tab:blue", "linestyle": ":"},
            medianprops={"color": "black"},
            capprops={"color": "none"},
        )

        ax.set_title(f"Form {formType}")
        ax.set_xlabel("")
        ax.set_ylabel(f"Form {formType} Count")
        xticklabels = [
            pd.to_datetime(str(x), format="%m").strftime("%b") for x in range(1, 13)
        ]
        ax.set_xticklabels(xticklabels)
        ax.tick_params(axis="x", rotation=45)
    except Exception as e:
        print(f"Error: {e}")

# disable the empty subplots
for i in range(cnt, 12):
    axes.flatten()[i].axis("off")

fig.suptitle(f"{form_name} Filings by Month\n({min_year} - {max_year_full})")
plt.tight_layout()
plt.show()

counts_per_month_by_formType = (
    structured_data[["year", "month", "accessionNo", "formType"]]
    .groupby(["year", "month", "formType"])
    .count()
    .rename(columns={"accessionNo": "count"})
    .pivot_table(
        index=["year", "month"],  # Rows
        columns="formType",  # Columns
        values="count",  # Values to fill
        fill_value=0,  # Replace NaN with 0
    )
    .astype(int)
    .reset_index()  # Make year and month normal columns
)

counts_per_month_by_formType
| formType | year | month | 1-A | 1-A POS | 1-A-W | 1-A/A | 1-K | 1-K/A | 1-Z | 1-Z-W | 1-Z/A |
|---|---|---|---|---|---|---|---|---|---|---|---|
| 0 | 2015 | 6 | 7 | 0 | 0 | 5 | 0 | 0 | 0 | 0 | 0 |
| 1 | 2015 | 7 | 2 | 0 | 0 | 4 | 0 | 0 | 0 | 0 | 0 |
| 2 | 2015 | 8 | 9 | 0 | 2 | 22 | 0 | 0 | 0 | 0 | 0 |
| 3 | 2015 | 9 | 12 | 0 | 3 | 13 | 0 | 0 | 0 | 0 | 0 |
| 4 | 2015 | 10 | 6 | 1 | 3 | 15 | 0 | 0 | 0 | 0 | 0 |
| ... | ... | ... | ... | ... | ... | ... | ... | ... | ... | ... | ... |
| 112 | 2024 | 10 | 14 | 18 | 6 | 40 | 6 | 0 | 1 | 0 | 1 |
| 113 | 2024 | 11 | 10 | 17 | 4 | 33 | 1 | 0 | 1 | 0 | 0 |
| 114 | 2024 | 12 | 15 | 21 | 4 | 39 | 4 | 1 | 7 | 0 | 0 |
| 115 | 2025 | 1 | 10 | 12 | 5 | 26 | 5 | 2 | 2 | 0 | 0 |
| 116 | 2025 | 2 | 17 | 15 | 3 | 22 | 3 | 0 | 0 | 0 | 0 |
117 rows × 11 columns
fix, ax = plt.subplots(figsize=(6, 4))

ax.stackplot(
    counts_per_month_by_formType["year"].astype(str)
    + "-"
    + counts_per_month_by_formType["month"].astype(str),
    *[counts_per_month_by_formType[ft] for ft in form_types],
    labels=[f"{ft}" for ft in form_types],
    alpha=0.8,
)
handles, labels = ax.get_legend_handles_labels()
ax.legend(
    list(reversed(handles)),
    list(reversed(labels)),
    title="Form Type",
    labelspacing=0.15,
)

ax.set_title(f"{form_name} Filings per Month")
ax.set_ylabel("Filings per Month")
xticks = (
    counts_per_month_by_formType["year"].astype(str)
    + "-"
    + counts_per_month_by_formType["month"].astype(str)
)
ax.set_xticks([i for i, x in enumerate(xticks) if x.endswith("-1")])
ax.set_xticklabels(
    [label.get_text()[:4] for label in ax.get_xticklabels()], rotation=90, ha="left"
)

ax.grid(axis="y", linestyle=":", alpha=0.5)
ax.spines["top"].set_visible(False)
ax.spines["right"].set_visible(False)
# draw vertical lines for each first month of the year, dotted, transparency 0.5,
# with height of the y value for the respective month
for year, month in counts_per_month_by_formType[["year", "month"]].values:
    if month == 1:
        ax.vlines(
            f"{year}-{month}",
            ymin=0,
            ymax=counts_per_month_by_formType[
                (counts_per_month_by_formType["year"] == year)
                & (counts_per_month_by_formType["month"] == month)
            ]
            .drop(columns=["year", "month"])
            .sum(axis=1),
            linestyle=":",
            alpha=0.5,
            color="grey",
        )

ax.axvspan("2020-1", "2022-1", alpha=0.1, color="red", zorder=-100)
ax.text(
    "2020-12",
    ax.get_ylim()[1] - 45,
    "COVID",
    horizontalalignment="center",
    verticalalignment="center",
    color="red",
    alpha=0.5,
)
plt.show()

counts_filedAtClass = (
    (
        structured_data.drop_duplicates(subset=["accessionNo"])
        .groupby(["filedAtClass"])
        .size()
        .sort_values(ascending=False)
        .to_frame(name="Count")
    )
    .rename_axis("Publication Time")
    .sort_values("Count", ascending=True)
)
counts_filedAtClass["Pct"] = (
    counts_filedAtClass["Count"].astype(int)
    / counts_filedAtClass["Count"].astype(int).sum()
).map("{:.0%}".format)
counts_filedAtClass["Count"] = counts_filedAtClass["Count"].map(lambda x: f"{x:,}")
counts_filedAtClass.index = (
    counts_filedAtClass.index.str.replace("preMarket", "Pre-Market (4:00 - 9:30 AM)")
    .str.replace("marketHours", "Market Hours (9:30 AM - 4:00 PM)")
    .str.replace("afterMarket", "After Market (4:00 - 8:00 PM)")
)
counts_filedAtClass = counts_filedAtClass.reindex(counts_filedAtClass.index[::-1])

print(
    f"{form_name} filing counts by pre-market, regular market hours,\n"
    "and after-market publication time ({min_year} - {max_year_full})."
)
counts_filedAtClass
Reg A filing counts by pre-market, regular market hours,
and after-market publication time ({min_year} - {max_year_full}).
| Count | Pct | |
|---|---|---|
| Publication Time | ||
| After Market (4:00 - 8:00 PM) | 4,912 | 43% |
| regularMarket | 4,731 | 41% |
| other | 953 | 8% |
| Pre-Market (4:00 - 9:30 AM) | 815 | 7% |
counts_dayOfWeek = (
    structured_data.drop_duplicates(subset=["accessionNo"])
    .groupby(["dayOfWeek"])
    .size()
    .to_frame(name="Count")
).rename_axis("Day of the Week")
counts_dayOfWeek["Pct"] = (
    counts_dayOfWeek["Count"].astype(int) / counts_dayOfWeek["Count"].astype(int).sum()
).map("{:.0%}".format)
counts_dayOfWeek["Count"] = counts_dayOfWeek["Count"].map(lambda x: f"{x:,}")

print(f"{form_name} filing counts by day of the week ({min_year} - {max_year}).")
counts_dayOfWeek.loc[["Monday", "Tuesday", "Wednesday", "Thursday", "Friday"]]
Reg A filing counts by day of the week (2015 - 2025).
| Count | Pct | |
|---|---|---|
| Day of the Week | ||
| Monday | 2,191 | 19% |
| Tuesday | 2,052 | 18% |
| Wednesday | 2,100 | 18% |
| Thursday | 2,017 | 18% |
| Friday | 3,050 | 27% |
from IPython.display import display


def plot_count_by_category(df, category, title=None, pretty_name=None):
    if pretty_name is None:
        pretty_name = category
    count_formType = (
        df.drop_duplicates(subset=["accessionNo"])
        .groupby([category])
        .size()
        .sort_values(ascending=False)
        .to_frame(name="Count")
    ).rename_axis(pretty_name)
    count_formType["Pct"] = (
        count_formType["Count"].astype(int) / count_formType["Count"].astype(int).sum()
    ).map("{:.0%}".format)
    count_formType["Count"] = count_formType["Count"].map(lambda x: f"{x:,}")

    print(f"{form_name} filing count by {pretty_name} ({min_year} - {max_year_full})")
    display(count_formType)

    counts_by_category_month_year = (
        df.drop_duplicates(subset=["accessionNo"])
        .groupby(["year", category])
        .size()
        .to_frame(name="count")
        .rename_axis(["year", pretty_name])
        .unstack(fill_value=0)
    )

    counts_by_category_month_year.loc["Total"] = counts_by_category_month_year.sum()
    counts_by_category_month_year["Total"] = counts_by_category_month_year.sum(axis=1)

    print(
        f"{form_name} counts by {pretty_name} and year from {min_year} to {max_year_full}."
    )
    display(counts_by_category_month_year)

    fig, ax = plt.subplots(figsize=(6, 3))
    counts_by_category_month_year["count"].drop("Total").plot(
        kind="bar", stacked=True, ax=ax
    )
    ax.set_xlabel("Year")
    ax.set_ylabel("Number of Filings")
    ax.yaxis.set_major_formatter(mtick.StrMethodFormatter("{x:,.0f}"))
    ax.grid(axis="x")
    ax.set_axisbelow(True)
    handles, labels = ax.get_legend_handles_labels()
    ax.legend(
        list(reversed(handles)),
        list(reversed(labels)),
        title=pretty_name,
        labelspacing=0.15,
    )
    ax.set_title(
        f"{form_name} Disclosures by {pretty_name} per Year ({min_year} - {max_year_full})"
    )
    plt.show()


plot_count_by_category(
    structured_data,
    "summaryInfo.indicateTier1Tier2Offering",
    pretty_name="Offering Tier",
)
Reg A filing count by Offering Tier (2015 - 2024)
| Count | Pct | |
|---|---|---|
| Offering Tier | ||
| Tier2 | 6,753 | 79% |
| Tier1 | 1,816 | 21% |
Reg A counts by Offering Tier and year from 2015 to 2024.
| count | Total | ||
|---|---|---|---|
| Offering Tier | Tier1 | Tier2 | |
| year | |||
| 2015 | 82 | 81 | 163 |
| 2016 | 252 | 324 | 576 |
| 2017 | 177 | 449 | 626 |
| 2018 | 188 | 536 | 724 |
| 2019 | 174 | 672 | 846 |
| 2020 | 209 | 943 | 1152 |
| 2021 | 223 | 1145 | 1368 |
| 2022 | 198 | 984 | 1182 |
| 2023 | 161 | 871 | 1032 |
| 2024 | 134 | 664 | 798 |
| 2025 | 18 | 84 | 102 |
| Total | 1816 | 6753 | 8569 |
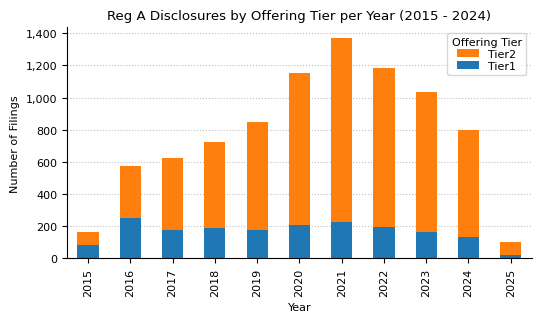
Under Regulation A, Tier 1 allows companies to raise up to $20 million annually without audited financial statements but requires state-by-state compliance, while Tier 2 allows up to $75 million annually with audited financial statements, ongoing SEC reporting, investor limits, and exemption from state securities regulations.
Offering amounts
In this section, we analyze the offering amount in the initial Form 1-A filings.
form_1a = structured_data_full_years[structured_data_full_years["formType"] == "1-A"]
form_1a["securitiesIssued"].info()
<class 'pandas.core.series.Series'>
Index: 2073 entries, 0 to 11310
Series name: securitiesIssued
Non-Null Count  Dtype
--------------  -----
1388 non-null   object
dtypes: object(1)
memory usage: 32.4+ KB
data = form_1a["summaryInfo.totalAggregateOffering"]
data = data[data > 1000]

# Define log-spaced bins
bin_edges = np.logspace(np.log10(min(data)), np.log10(max(data)), num=20)

fig, ax = plt.subplots(figsize=(3, 2))
ax.hist(
    data,
    bins=bin_edges,
    color="steelblue",
    edgecolor="black",
    linewidth=0.5,
)
ax.set_yscale("log")
ax.set_xscale("log")
ax.xaxis.set_major_formatter(mtick.StrMethodFormatter("{x:,.0f}"))
ax.yaxis.set_major_formatter(mtick.StrMethodFormatter("{x:,.0f}"))
ax.tick_params(axis="x", rotation=45)
ax.set_title(
    f"Offering Amount Distribution in Form 1A Filings ({min_year} - {max_year})"
)
ax.set_xlabel("Offering Amount ($)")
ax.set_ylabel("Count")
plt.show()

offering_amounts = (
    form_1a[["accessionNo", "fileNo", "year", "summaryInfo.totalAggregateOffering"]]
    .drop_duplicates(subset=["accessionNo", "fileNo"])
    .groupby(["year"])
    .sum()["summaryInfo.totalAggregateOffering"]
)

# offering_amounts.loc["Total"] = offering_amounts.sum()

print(f"Offering Amount in Form 1A filings from {min_year} to {max_year_full}.")
offering_amounts
Offering Amount in Form 1A filings from 2015 to 2024.
year
2015    1.088415e+09
2016    2.006582e+09
2017    2.827206e+09
2018    2.781807e+09
2019    4.068989e+09
2020    4.498605e+09
2021    7.562768e+09
2022    6.471967e+09
2023    4.821942e+09
2024    4.239667e+09
Name: summaryInfo.totalAggregateOffering, dtype: float64
fig, ax = plt.subplots(figsize=(3.5, 2))
offering_amounts.apply(lambda x: x / 1e6).plot(kind="bar", stacked=True, ax=ax)
ax.set_xlabel("Year")
ax.set_ylabel("Offering Amount (Million $)")
ax.yaxis.set_major_formatter(mtick.StrMethodFormatter("{x:,.0f}"))
ax.grid(axis="x")
ax.set_axisbelow(True)
ax.set_title(
    f"Offering Amount in Form 1A filings per Year ({min_year} - {max_year_full})"
)
plt.show()

Form 1-K Annual Report Dataset
In this section we analyze the selling progress of offered securities by year since initial offering of the securities based on information in the Form 1-K Annual Report filings.
form_1k_df = structured_data_full_years[structured_data_full_years["formType"] == "1-K"]
form_1k_df = form_1k_df.dropna(subset=["summaryInfo"])
form_1k_df = form_1k_df.explode("summaryInfo")
form_1k_df = pd.json_normalize(form_1k_df.to_dict(orient="records"))
selling_progress_data = form_1k_df[
    [
        "accessionNo",
        "fileNo",
        "filedAt",
        "summaryInfo.offeringCommenceDate",
        "summaryInfo.qualifiedSecuritiesSold",
        "summaryInfo.offeringSecuritiesSold",
    ]
].dropna()
# convert the date fields to datetime
selling_progress_data["summaryInfo.offeringCommenceDate"] = pd.to_datetime(
    selling_progress_data["summaryInfo.offeringCommenceDate"], errors="coerce"
).dt.date
selling_progress_data["filedAt"] = pd.to_datetime(
    selling_progress_data["filedAt"], utc=True
)
selling_progress_data["filedAt"] = selling_progress_data["filedAt"].dt.tz_convert(
    "US/Eastern"
)
selling_progress_data["filedAtDate"] = selling_progress_data["filedAt"].dt.date

selling_progress_data["timeOfferedDays"] = (
    selling_progress_data["summaryInfo.offeringCommenceDate"]
    - selling_progress_data["filedAtDate"]
).apply(lambda x: -x.days)

selling_progress_data["percentSold"] = (
    selling_progress_data["summaryInfo.offeringSecuritiesSold"]
    / selling_progress_data["summaryInfo.qualifiedSecuritiesSold"]
)
selling_progress_data
| accessionNo | fileNo | filedAt | summaryInfo.offeringCommenceDate | summaryInfo.qualifiedSecuritiesSold | summaryInfo.offeringSecuritiesSold | filedAtDate | timeOfferedDays | percentSold | |
|---|---|---|---|---|---|---|---|---|---|
| 0 | 0001214659-16-011078 | 24R-00009 | 2016-04-29 11:05:02-04:00 | 2015-11-20 | 3.009600e+07 | 16920576.0 | 2016-04-29 | 161 | 0.562220 |
| 1 | 0001376474-16-000679 | 24R-00013 | 2016-05-06 13:16:15-04:00 | 2016-02-04 | 6.000000e+06 | 0.0 | 2016-05-06 | 92 | 0.000000 |
| 2 | 0001644600-16-000142 | 24R-00007 | 2016-05-20 12:03:45-04:00 | 2016-01-21 | 2.000000e+07 | 0.0 | 2016-05-20 | 120 | 0.000000 |
| 3 | 0001644600-16-000171 | 24R-00022 | 2016-07-27 14:09:16-04:00 | 2016-03-22 | 6.432247e+06 | 1644018.0 | 2016-07-27 | 127 | 0.255590 |
| 4 | 0001477932-16-012593 | 24R-00024 | 2016-09-19 17:53:12-04:00 | 2015-02-03 | 2.500000e+07 | 1400000.0 | 2016-09-19 | 594 | 0.056000 |
| ... | ... | ... | ... | ... | ... | ... | ... | ... | ... |
| 482 | 0001410708-24-000005 | 24R-00915 | 2024-09-13 12:43:16-04:00 | 2023-08-18 | 1.500000e+09 | 0.0 | 2024-09-13 | 392 | 0.000000 |
| 483 | 0001925674-24-000004 | 24R-00957 | 2024-09-13 21:00:42-04:00 | 2023-12-11 | 2.500000e+07 | 4505096.0 | 2024-09-13 | 277 | 0.180204 |
| 484 | 0001096906-24-001940 | 24R-00529 | 2024-09-30 21:52:59-04:00 | 2021-09-27 | 1.221760e+07 | 135260.0 | 2024-09-30 | 1099 | 0.011071 |
| 485 | 0001062993-24-018101 | 24R-00694 | 2024-10-30 12:54:39-04:00 | 2022-07-26 | 5.000000e+06 | 2101819.0 | 2024-10-30 | 827 | 0.420364 |
| 486 | 0001829126-24-008670 | 24R-00889 | 2024-12-31 17:25:50-05:00 | 2023-08-10 | 7.500000e+06 | 3870.0 | 2024-12-31 | 509 | 0.000516 |
484 rows × 9 columns
# scatter plot of the time offered vs the percentage of securities qualified
fig, ax = plt.subplots(figsize=(4, 3))
sns.scatterplot(
    x="timeOfferedDays",
    y="percentSold",
    data=selling_progress_data,
    alpha=0.5,
    ax=ax,
)
ax.set_xlabel("Time Offered (days)")
ax.set_ylabel("Percentage `sold`")
ax.set_title("Time Offered vs Percentage Sold")
ax.set_xlim(0, 2100)
plt.show()

form_1z_df = structured_data_full_years[structured_data_full_years["formType"] == "1-Z"]
form_1z_suminfo = form_1z_df.dropna(subset=["summaryInfoOffering"])
form_1z_suminfo = form_1z_suminfo.explode("summaryInfoOffering")
form_1z_suminfo = pd.json_normalize(form_1z_suminfo.to_dict(orient="records"))
form_1z_suminfo.info()
<class 'pandas.core.frame.DataFrame'>
RangeIndex: 270 entries, 0 to 269
Columns: 144 entries, id to summaryInfoOffering.crdNumberBrokerDealer
dtypes: datetime64[ns, US/Eastern](1), float64(110), int64(4), object(29)
memory usage: 303.9+ KB
aggregated_value_df = form_1z_suminfo[
    [
        "accessionNo",
        "fileNo",
        "filedAt",
        "summaryInfoOffering.offeringCommenceDate",
        "summaryInfoOffering.offeringSecuritiesQualifiedSold",
        "summaryInfoOffering.offeringSecuritiesSold",
        "summaryInfoOffering.pricePerSecurity",
        "summaryInfoOffering.findersFees",
        "summaryInfoOffering.legalFees",
        "summaryInfoOffering.auditorFees",
        "summaryInfoOffering.blueSkyFees",
        "summaryInfoOffering.promotersFees",
        "summaryInfoOffering.salesCommissionsFee",
        "summaryInfoOffering.underwriterFees",
    ]
]
securities_sold = aggregated_value_df["summaryInfoOffering.offeringSecuritiesSold"]
price_per_share = aggregated_value_df["summaryInfoOffering.pricePerSecurity"]
aggregated_value_df = aggregated_value_df.assign(
    aggregatedValue=securities_sold * price_per_share
).dropna(subset=["aggregatedValue"])
aggregated_value_df = aggregated_value_df.loc[
    aggregated_value_df["aggregatedValue"] > 1000
].copy()
aggregated_value_df.head()
| accessionNo | fileNo | filedAt | summaryInfoOffering.offeringCommenceDate | summaryInfoOffering.offeringSecuritiesQualifiedSold | summaryInfoOffering.offeringSecuritiesSold | summaryInfoOffering.pricePerSecurity | summaryInfoOffering.findersFees | summaryInfoOffering.legalFees | summaryInfoOffering.auditorFees | summaryInfoOffering.blueSkyFees | summaryInfoOffering.promotersFees | summaryInfoOffering.salesCommissionsFee | summaryInfoOffering.underwriterFees | aggregatedValue | |
|---|---|---|---|---|---|---|---|---|---|---|---|---|---|---|---|
| 2 | 0001144204-15-065207 | 24R-00003 | 2015-11-13 14:20:10-05:00 | 09-02-2015 | 545000.0 | 505000.0 | 10.00 | NaN | 508000.0 | 30000.0 | 6000.0 | NaN | NaN | NaN | 5050000.0 |
| 3 | 0001389049-15-000003 | 24R-00004 | 2015-11-19 18:03:09-05:00 | 01-30-2015 | 60000.0 | 60000.0 | 25.00 | 0.0 | 0.0 | 0.0 | 0.0 | 0.0 | 0.0 | 0.0 | 1500000.0 |
| 4 | 0001144204-15-073653 | 24R-00003 | 2015-12-31 17:00:02-05:00 | 10-30-2015 | 1453000.0 | 1303000.0 | 10.00 | NaN | 16000.0 | 4000.0 | 3000.0 | NaN | NaN | NaN | 13030000.0 |
| 5 | 0001506275-16-000004 | 24R-00006 | 2016-01-28 15:58:00-05:00 | 12-29-2014 | 4613422.0 | 429000.0 | 1000.00 | 0.0 | 17898.0 | 0.0 | 4396.0 | 0.0 | 0.0 | 0.0 | 429000000.0 |
| 6 | 0001354488-16-007263 | 24R-00014 | 2016-05-06 19:16:18-04:00 | 03-02-2016 | 1023110.0 | 885345.0 | 12.22 | NaN | 150000.0 | 25000.0 | NaN | NaN | NaN | NaN | 10818915.9 |
# convert the date fields to datetime
aggregated_value_df["summaryInfoOffering.offeringCommenceDate"] = pd.to_datetime(
    aggregated_value_df["summaryInfoOffering.offeringCommenceDate"], errors="coerce"
).dt.date
aggregated_value_df["filedAt"] = pd.to_datetime(
    aggregated_value_df["filedAt"], utc=True
)
aggregated_value_df["filedAt"] = aggregated_value_df["filedAt"].dt.tz_convert(
    "US/Eastern"
)
aggregated_value_df["filedAtDate"] = aggregated_value_df["filedAt"].dt.date

aggregated_value_df = aggregated_value_df.dropna(
    subset=["filedAtDate", "summaryInfoOffering.offeringCommenceDate"]
)

aggregated_value_df.loc[:, "timeOfferedDays"] = (
    aggregated_value_df["summaryInfoOffering.offeringCommenceDate"]
    - aggregated_value_df["filedAtDate"]
).apply(lambda x: -x.days)

aggregated_value_df.loc[:, "percentSold"] = (
    100
    * aggregated_value_df["summaryInfoOffering.offeringSecuritiesSold"]
    / aggregated_value_df["summaryInfoOffering.offeringSecuritiesQualifiedSold"]
)

aggregated_value_df.loc[:, "raisedPerYear"] = aggregated_value_df["aggregatedValue"] / (
    aggregated_value_df["timeOfferedDays"] / 365
)

aggregated_value_df = aggregated_value_df.dropna(subset=["raisedPerYear"])
aggregated_value_df
| accessionNo | fileNo | filedAt | summaryInfoOffering.offeringCommenceDate | summaryInfoOffering.offeringSecuritiesQualifiedSold | summaryInfoOffering.offeringSecuritiesSold | summaryInfoOffering.pricePerSecurity | summaryInfoOffering.findersFees | summaryInfoOffering.legalFees | summaryInfoOffering.auditorFees | summaryInfoOffering.blueSkyFees | summaryInfoOffering.promotersFees | summaryInfoOffering.salesCommissionsFee | summaryInfoOffering.underwriterFees | aggregatedValue | filedAtDate | timeOfferedDays | percentSold | raisedPerYear | |
|---|---|---|---|---|---|---|---|---|---|---|---|---|---|---|---|---|---|---|---|
| 2 | 0001144204-15-065207 | 24R-00003 | 2015-11-13 14:20:10-05:00 | 2015-09-02 | 5.450000e+05 | 505000.0 | 10.0000 | NaN | 508000.0 | 30000.0 | 6000.0 | NaN | NaN | NaN | 5.050000e+06 | 2015-11-13 | 72 | 92.660550 | 2.560069e+07 |
| 3 | 0001389049-15-000003 | 24R-00004 | 2015-11-19 18:03:09-05:00 | 2015-01-30 | 6.000000e+04 | 60000.0 | 25.0000 | 0.0 | 0.0 | 0.0 | 0.0 | 0.0 | 0.0 | 0.0 | 1.500000e+06 | 2015-11-19 | 293 | 100.000000 | 1.868601e+06 |
| 4 | 0001144204-15-073653 | 24R-00003 | 2015-12-31 17:00:02-05:00 | 2015-10-30 | 1.453000e+06 | 1303000.0 | 10.0000 | NaN | 16000.0 | 4000.0 | 3000.0 | NaN | NaN | NaN | 1.303000e+07 | 2015-12-31 | 62 | 89.676531 | 7.670887e+07 |
| 5 | 0001506275-16-000004 | 24R-00006 | 2016-01-28 15:58:00-05:00 | 2014-12-29 | 4.613422e+06 | 429000.0 | 1000.0000 | 0.0 | 17898.0 | 0.0 | 4396.0 | 0.0 | 0.0 | 0.0 | 4.290000e+08 | 2016-01-28 | 395 | 9.298954 | 3.964177e+08 |
| 6 | 0001354488-16-007263 | 24R-00014 | 2016-05-06 19:16:18-04:00 | 2016-03-02 | 1.023110e+06 | 885345.0 | 12.2200 | NaN | 150000.0 | 25000.0 | NaN | NaN | NaN | NaN | 1.081892e+07 | 2016-05-06 | 65 | 86.534683 | 6.075237e+07 |
| ... | ... | ... | ... | ... | ... | ... | ... | ... | ... | ... | ... | ... | ... | ... | ... | ... | ... | ... | ... |
| 265 | 0001683168-24-008477 | 24R-00975 | 2024-12-03 15:35:28-05:00 | 2023-08-29 | 1.000000e+08 | 9000000.0 | 0.0100 | NaN | 15000.0 | NaN | 1500.0 | NaN | NaN | NaN | 9.000000e+04 | 2024-12-03 | 462 | 9.000000 | 7.110390e+04 |
| 266 | 0001683168-24-008572 | 24R-00976 | 2024-12-09 15:38:10-05:00 | 2023-08-07 | 2.000000e+09 | 665000000.0 | 0.0002 | NaN | 15000.0 | NaN | 1500.0 | NaN | NaN | NaN | 1.330000e+05 | 2024-12-09 | 490 | 33.250000 | 9.907143e+04 |
| 267 | 0001214659-24-020072 | 24R-00977 | 2024-12-09 16:11:33-05:00 | 2023-09-11 | 1.000000e+07 | 15117666.0 | 0.0053 | NaN | NaN | NaN | NaN | NaN | NaN | NaN | 8.012363e+04 | 2024-12-09 | 455 | 151.176660 | 6.427500e+04 |
| 268 | 0001683168-24-008783 | 24R-00508 | 2024-12-17 14:17:32-05:00 | 2023-09-26 | 2.083333e+07 | 85849.0 | 3.6000 | NaN | 90000.0 | 46500.0 | NaN | NaN | NaN | 3090.0 | 3.090564e+05 | 2024-12-17 | 448 | 0.412075 | 2.517982e+05 |
| 269 | 0001829126-24-008673 | 24R-00889 | 2024-12-31 17:27:40-05:00 | 2023-08-10 | 7.500000e+06 | 3870.0 | 10.0000 | 0.0 | 132500.0 | 40000.0 | 4750.0 | 0.0 | 387.0 | 0.0 | 3.870000e+04 | 2024-12-31 | 509 | 0.051600 | 2.775147e+04 |
195 rows × 19 columns
def plot_histogram(data, title, x_label, y_label, log_scale=True):
    if log_scale:
        bin_edges = np.logspace(np.log10(min(data)), np.log10(max(data)), num=20)
    else:
        bin_edges = 20
    fig, ax = plt.subplots(figsize=(3, 2))
    ax.hist(
        data,
        bins=bin_edges,
        color="steelblue",
        edgecolor="black",
        linewidth=0.5,
    )
    if log_scale:
        ax.set_yscale("log")
        ax.set_xscale("log")
        ax.xaxis.set_major_formatter(mtick.StrMethodFormatter("{x:,.0f}"))
        ax.yaxis.set_major_formatter(mtick.StrMethodFormatter("{x:,.0f}"))
        ax.tick_params(axis="x", rotation=45)
    ax.set_title(title)
    ax.set_xlabel(x_label)
    ax.set_ylabel(y_label)

    return fig, ax


fig, ax = plot_histogram(
    aggregated_value_df["raisedPerYear"],
    "Raised Capital per Year reported in Form 1-Z Filings",
    "Raised Capital per Year ($)",
    "Count",
)

ax.axvline(75_000_000, color="red", linestyle="--", label="Maximum\namount allowed")
ax.legend()
plt.show()

There are some outliers here probably cause by errors in the reporting. The maximum allowed amount to be raised per year under Regulation A is $75 million. Let's exclude all filings which report a higher number and visualize the total amount raised.
aggregated_value_df = aggregated_value_df[
    aggregated_value_df["raisedPerYear"] < 75_000_000
]
fig, ax = plot_histogram(
    aggregated_value_df["aggregatedValue"],
    f"Final aggregated value of securities sold\nin Form 1-Z filings ({min_year} - {max_year_full})",
    "Offering Amount ($)",
    "Count",
)

fig, ax = plot_histogram(
    aggregated_value_df["percentSold"][
        aggregated_value_df["percentSold"].between(0, 100)
    ],
    f"Percentage of securities sold in Form 1-Z filings\n({min_year} - {max_year_full})",
    "Percentage Sold",
    "Count",
    log_scale=False,
)

aggregated_value_df
| accessionNo | fileNo | filedAt | summaryInfoOffering.offeringCommenceDate | summaryInfoOffering.offeringSecuritiesQualifiedSold | summaryInfoOffering.offeringSecuritiesSold | summaryInfoOffering.pricePerSecurity | summaryInfoOffering.findersFees | summaryInfoOffering.legalFees | summaryInfoOffering.auditorFees | summaryInfoOffering.blueSkyFees | summaryInfoOffering.promotersFees | summaryInfoOffering.salesCommissionsFee | summaryInfoOffering.underwriterFees | aggregatedValue | filedAtDate | timeOfferedDays | percentSold | raisedPerYear | |
|---|---|---|---|---|---|---|---|---|---|---|---|---|---|---|---|---|---|---|---|
| 2 | 0001144204-15-065207 | 24R-00003 | 2015-11-13 14:20:10-05:00 | 2015-09-02 | 5.450000e+05 | 5.050000e+05 | 10.0000 | NaN | 508000.0 | 30000.0 | 6000.0 | NaN | NaN | NaN | 5.050000e+06 | 2015-11-13 | 72 | 92.660550 | 2.560069e+07 |
| 3 | 0001389049-15-000003 | 24R-00004 | 2015-11-19 18:03:09-05:00 | 2015-01-30 | 6.000000e+04 | 6.000000e+04 | 25.0000 | 0.0 | 0.0 | 0.0 | 0.0 | 0.0 | 0.0 | 0.0 | 1.500000e+06 | 2015-11-19 | 293 | 100.000000 | 1.868601e+06 |
| 6 | 0001354488-16-007263 | 24R-00014 | 2016-05-06 19:16:18-04:00 | 2016-03-02 | 1.023110e+06 | 8.853450e+05 | 12.2200 | NaN | 150000.0 | 25000.0 | NaN | NaN | NaN | NaN | 1.081892e+07 | 2016-05-06 | 65 | 86.534683 | 6.075237e+07 |
| 7 | 0001621388-16-000004 | 24R-00015 | 2016-05-16 12:17:55-04:00 | 2015-04-01 | 1.000000e+10 | 1.015000e+09 | 0.0100 | 0.0 | 38991.0 | 0.0 | 2050.0 | NaN | 0.0 | 0.0 | 1.015000e+07 | 2016-05-16 | 411 | 10.150000 | 9.013990e+06 |
| 8 | 0001104659-16-131746 | 24R-00020 | 2016-07-08 16:03:16-04:00 | 2015-11-30 | 1.538462e+06 | 1.184726e+06 | 6.5000 | NaN | 113274.0 | 22880.0 | 5000.0 | NaN | NaN | NaN | 7.700719e+06 | 2016-07-08 | 221 | 77.007167 | 1.271838e+07 |
| ... | ... | ... | ... | ... | ... | ... | ... | ... | ... | ... | ... | ... | ... | ... | ... | ... | ... | ... | ... |
| 265 | 0001683168-24-008477 | 24R-00975 | 2024-12-03 15:35:28-05:00 | 2023-08-29 | 1.000000e+08 | 9.000000e+06 | 0.0100 | NaN | 15000.0 | NaN | 1500.0 | NaN | NaN | NaN | 9.000000e+04 | 2024-12-03 | 462 | 9.000000 | 7.110390e+04 |
| 266 | 0001683168-24-008572 | 24R-00976 | 2024-12-09 15:38:10-05:00 | 2023-08-07 | 2.000000e+09 | 6.650000e+08 | 0.0002 | NaN | 15000.0 | NaN | 1500.0 | NaN | NaN | NaN | 1.330000e+05 | 2024-12-09 | 490 | 33.250000 | 9.907143e+04 |
| 267 | 0001214659-24-020072 | 24R-00977 | 2024-12-09 16:11:33-05:00 | 2023-09-11 | 1.000000e+07 | 1.511767e+07 | 0.0053 | NaN | NaN | NaN | NaN | NaN | NaN | NaN | 8.012363e+04 | 2024-12-09 | 455 | 151.176660 | 6.427500e+04 |
| 268 | 0001683168-24-008783 | 24R-00508 | 2024-12-17 14:17:32-05:00 | 2023-09-26 | 2.083333e+07 | 8.584900e+04 | 3.6000 | NaN | 90000.0 | 46500.0 | NaN | NaN | NaN | 3090.0 | 3.090564e+05 | 2024-12-17 | 448 | 0.412075 | 2.517982e+05 |
| 269 | 0001829126-24-008673 | 24R-00889 | 2024-12-31 17:27:40-05:00 | 2023-08-10 | 7.500000e+06 | 3.870000e+03 | 10.0000 | 0.0 | 132500.0 | 40000.0 | 4750.0 | 0.0 | 387.0 | 0.0 | 3.870000e+04 | 2024-12-31 | 509 | 0.051600 | 2.775147e+04 |
169 rows × 19 columns
# calculate the total fees
fees = [
    "findersFees",
    "legalFees",
    "auditorFees",
    "blueSkyFees",
    "promotersFees",
    "salesCommissionsFee",
    "underwriterFees",
]
aggregated_value_df = aggregated_value_df.assign(
    totalFees=aggregated_value_df[[f"summaryInfoOffering.{fee}" for fee in fees]].sum(
        axis=1
    )
)

aggregated_value_df = aggregated_value_df.assign(
    feePercentage=(
        100 * aggregated_value_df["totalFees"] / aggregated_value_df["aggregatedValue"]
    )
)

fig, ax = plot_histogram(
    aggregated_value_df["feePercentage"][
        aggregated_value_df["feePercentage"].between(0, 100)
    ],
    f"Percentage of fees reported in Form 1-Z filings\n({min_year} - {max_year_full})",
    "Percentage of Fees",
    "Count",
    log_scale=False,
)

# scatter plot of the total fees vs the aggregated value
fig, ax = plt.subplots(figsize=(4, 3))
ax.scatter(
    aggregated_value_df["aggregatedValue"],
    aggregated_value_df["feePercentage"],
    alpha=0.5,
)
ax.set_xlabel("Aggregated Value ($)")
ax.set_ylabel("Percentage of Fees")
ax.set_title(
    f"Aggregated Value of Sold Securities vs Total Fees\n"
    f"reported in Form 1-Z filings ({min_year} - {max_year_full})"
)
ax.set_xscale("log")
ax.set_yscale("log")
ax.xaxis.set_major_formatter(mtick.StrMethodFormatter("{x:,.0f}"))
ax.yaxis.set_major_formatter(mtick.StrMethodFormatter("{x:,.0f}"))
ax.tick_params(axis="x", rotation=45)
plt.show()
