Financial analysis of SK hynix, August 2026
SK hynix earns a 76% operating margin and trades at 8.8x trailing operating profit. The price requires about $64bn of free cash flow a year from 2029, roughly 3.5x what the company generated in 2025.
1. The price requires about $64bn of free cash flow a year from 2029. Discounting the modelled 2027 and 2028 free cash flow at 10.5% accounts for only $229bn of the $826bn enterprise value. The residual implies a perpetuity of roughly $64bn growing at 2%, against $18.2bn generated in 2025 and a modelled 2028 base-case peak of $125bn. The whole question is what the business earns once the price spike ends, not what it earns during it.
2. Trailing multiples do not settle it. The stock is on 7.4x reported earnings for the last twelve months, 12.3x on operating profit taxed at 24%, and 24x to 54x on a multi-year average of operating profit that includes the 2023 loss. A trailing multiple on a cyclical at peak earnings locates the cycle, it does not price the asset.
3. The bull case is not HBM. It is conventional DRAM. HBM is 56.4% share and a structurally protected margin, but the earnings increase of the last three quarters came from server DDR5 and enterprise SSD prices inflating because HBM consumed the wafer capacity that would have made them. Gartner puts traditional DRAM average selling price up 198% year on year in Q2 2026. That is a supply-allocation artifact, and it is the single line item most exposed to reversal.
4. The cost structure absorbs a large shock. At Q2 2026 unit economics, operating profit only reaches zero if revenue falls roughly 78% from base-case 2027 levels. That protects the near-term earnings stream. It does not protect the terminal value, which is where the price is concentrated.
5. The board is retiring 3.3% of the equity while raising capex. Announced 19 August 2026: 24.07m shares to be repurchased by 19 November 2026 and cancelled, funded from a $65bn distributable-profit pool, with policy shifted to returning over 50% of cumulative 2025 to 2027 free cash flow. The filing states the reason directly, that the board considers the recent share price undervalued relative to intrinsic value.
6. LTA coverage and 2027 supply are the two unresolved variables. First, whether the long-term agreements now signed with about ten customers (roughly five-year terms, deposits, non-uniform pricing) convert a spot-priced commodity into contracted revenue. Second, whether 2027 to 2028 supply additions (M15X, Yongin Fab 1 and Fab 2, M17, P&T7, plus Samsung and Micron) arrive into demand or into a vacuum. Management declined to disclose LTA coverage as a share of sales, which is the disclosure gap that most limits conviction.
7. The bear case is coherent. Bears argue the entire 2026 print is a price spike, that Chinese suppliers will flood conventional DRAM and NAND by 2028, and that a company earning a 76% operating margin in a commodity is definitionally at a cycle peak. On that view normalised free cash flow settles far below $64bn and the shares are worth less than half of today's price.
8. The Won has appreciated about 11% against the dollar since the IPO priced. Measured in dollars, 2025 revenue grew 40.8% rather than the 46.8% reported in Won, and Q2 2026 revenue grew 47% sequentially rather than 51%. SK hynix discloses that a 10% move in the dollar is worth about $1.9bn of pre-tax profit a year, so the recent move is a headwind to second-half dollar earnings that postdates the guidance given on 29 July.
1. Currency basis
Two conventions are used, and each table says which. Historical statements (sections 2 to 5) are translated at the rates in force in each period: income and cash-flow items at the period average, balance-sheet items at the period-end noon buying rate, both as disclosed in the prospectus exchange-rate table. Valuation, per-share data, forward scenarios and announced future commitments (sections 6, 7, 9 and 11) are translated at the 28 August 2026 spot rate of ₩1,377.57, so that multiples are internally consistent and forecasts are not distorted by a currency view.
| Period | FY2023 | FY2024 | FY2025 | Q1 2026 | Q2 2026 | 1H 2026 | Spot 28 Aug |
|---|---|---|---|---|---|---|---|
| Average rate, ₩ per US$ (flows) | 1,306.8 | 1,363.4 | 1,421.4 | 1,464.4 | 1,500.6 | 1,482.5 | 1,377.6 |
| Period-end rate, ₩ per US$ (balance sheet) | 1,291.0 | 1,477.9 | 1,444.6 | 1,523.5 | 1,548.8 | 1,548.8 | 1,377.6 |
Federal Reserve Bank of New York noon buying rates as tabulated in the 424B4, plus the spot rate on 28 August 2026. Quarterly 2025 rates are not disclosed in the prospectus, so 2025 quarterly and half-year comparatives use the FY2025 average of ₩1,421.4. The prospectus uses a single convenience rate of ₩1,523.5 for all of its own dollar figures, so the FY2025 dollar amounts here differ from the ones printed in the filing; the Q1 2026 amounts match it exactly.
2. Financial performance, 2023 to 1H 2026
The audited record in the prospectus covers three years, which is the maximum a foreign private issuer must present on Form F-1. The 2023 loss year is the useful anchor: it shows what this business looks like at the bottom of a memory cycle, and it is only three years old.
Consolidated income statement, US$bn at period-average rates
| Line item | FY2023 | FY2024 | FY2025 | 1H2026 | Q2 2026 |
|---|---|---|---|---|---|
| Revenue | 25.07 | 48.55 | 68.35 | 88.97 | 52.86 |
| DRAM | 15.89 | 32.81 | 52.70 | n.d. | n.d. |
| NAND flash | 7.39 | 14.14 | 14.56 | n.d. | n.d. |
| Other (foundry, CIS, lease) | 1.79 | 1.60 | 1.09 | n.d. | n.d. |
| Cost of sales | 25.48 | 25.21 | 27.06 | 16.34 | 8.88 |
| Gross profit | (0.41) | 23.34 | 41.29 | 72.63 | 43.98 |
| SG&A | 2.64 | 2.88 | 3.53 | 6.42 | n.d. |
| R&D expense | 2.87 | 3.25 | 4.55 | incl. above | n.d. |
| Operating profit | (5.92) | 17.21 | 33.21 | 66.21 | 40.35 |
| Finance income | 1.73 | 3.56 | 11.52 | 55.93 | n.d. |
| Finance expenses | 4.66 | 4.19 | 8.80 | 4.50 | n.d. |
| Profit before tax | (8.92) | 17.52 | 35.50 | 117.59 | 81.77 |
| Income tax | (1.93) | 3.00 | 5.29 | 27.02 | n.d. |
| Profit for the period | (6.99) | 14.52 | 30.22 | 90.57 | 62.59 |
| Adjusted EBITDA | 4.51 | 26.41 | 42.98 | 71.46 | 43.05 |
| Depreciation and amortisation | 10.42 | 9.20 | 9.77 | 5.28 | 2.73 |
| Gross margin | (1.6%) | 48.1% | 60.4% | 81.6% | 83.2% |
| Operating margin | (23.6%) | 35.5% | 48.6% | 74.4% | 76.3% |
| Net margin | (27.9%) | 29.9% | 44.2% | 101.8% | 118.4% |
| Revenue growth, in US$ | n.a. | +93.7% | +40.8% | +217% | +238% |
| Revenue growth, as reported in Won | n.a. | +102.0% | +46.8% | +231% | +257% |
Margins are currency neutral and equal the reported Won margins. Operating profit for 2023 to 2025 is computed as gross profit less SG&A less R&D, because IFRS as issued by the IASB does not present an operating-profit subtotal; the derived figures reconcile to the operating profit reported in the Korean semi-annual report. Q2 gross profit and cost of sales are derived by subtracting Q1 from the 1H figures. Net margin exceeds 100% in 2026 because of $42.6bn of gains on valuation and disposal of financial instruments, principally the Kioxia stake sold in June 2026, plus $9.4bn of dividend income. n.d. = not disclosed at that frequency.
Balance sheet, US$bn at period-end rates
| 2023 | 2024 | 2025 | Q1 26 | Jun 26 | |
|---|---|---|---|---|---|
| Cash, short-term instruments and short-term investments | 6.9 | 9.6 | 24.2 | 35.7 | 56.8 |
| Trade receivables | 5.1 | 8.8 | 12.6 | 22.2 | 30.9 |
| Inventories | 10.4 | 9.0 | 9.9 | 10.5 | 11.6 |
| Property, plant and equipment | 40.8 | 40.7 | 53.7 | 53.9 | 57.4 |
| Long-term investment assets | 3.2 | 2.7 | 10.1 | 13.6 | 55.1 |
| Total assets | 77.7 | 81.1 | 121.9 | 146.3 | 225.2 |
| Total borrowings | 22.8 | 15.3 | 15.4 | 12.7 | 12.0 |
| Total liabilities | 36.3 | 31.1 | 38.4 | 38.4 | 55.6 |
| Total equity | 41.4 | 50.0 | 83.5 | 107.9 | 169.6 |
| Net cash / (net debt) | (15.9) | (5.8) | 8.8 | 23.0 | 44.8 |
The June 2026 period-end rate of ₩1,548.8 is 12.4% weaker than the 28 August spot rate, so the dollar balance sheet understates today's value of the Won-denominated position by roughly that margin. At spot, June equity is $190.7bn and net cash is $50.4bn; those are the figures used for valuation.
Cash flow and capital expenditure, US$bn at period-average rates
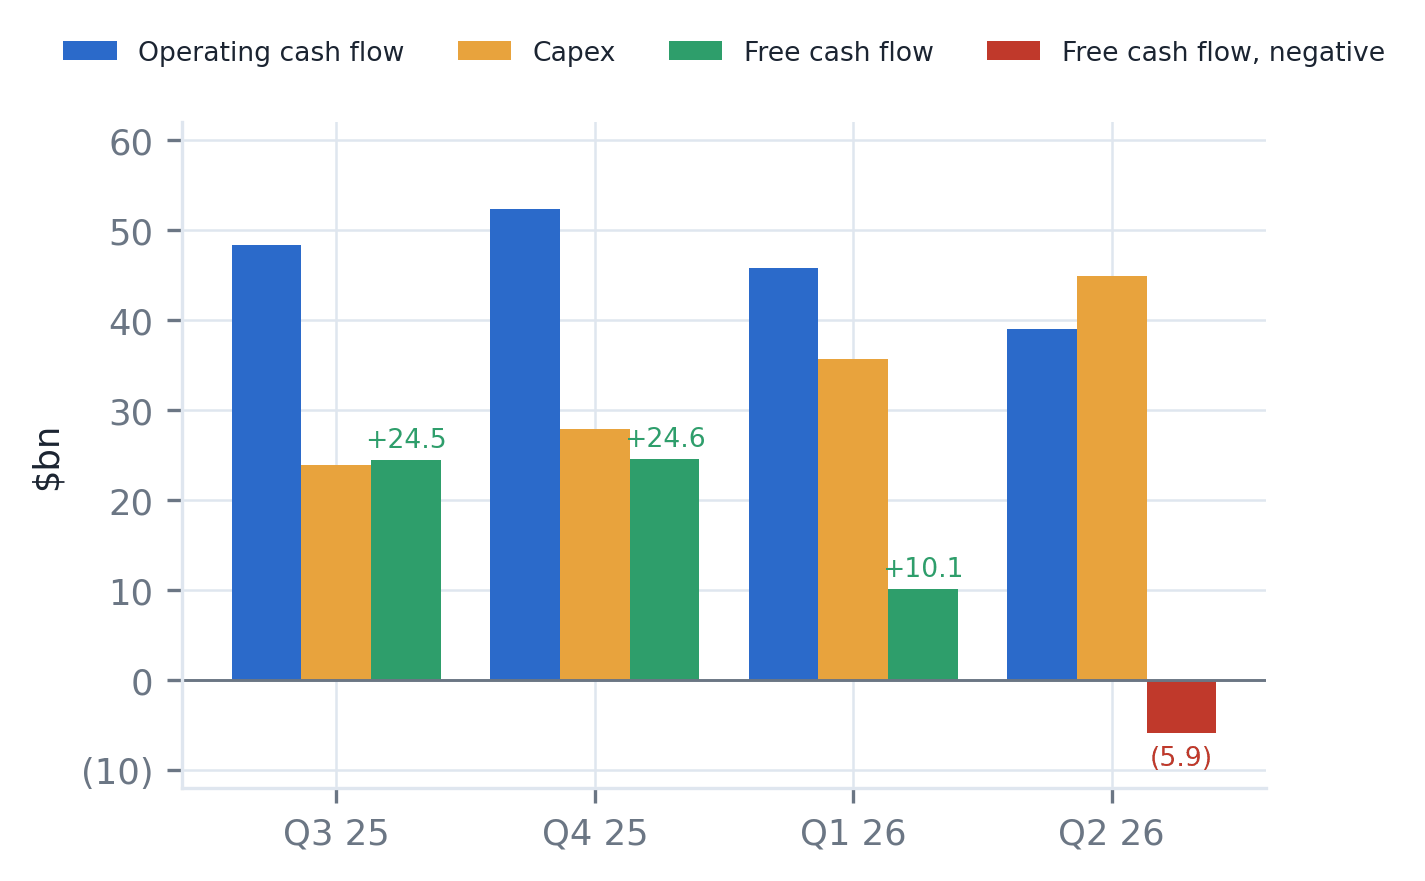
| 2023 | 2024 | 2025 | Q1 26 | 2026E | |
|---|---|---|---|---|---|
| Operating cash flow | 3.27 | 21.85 | 37.55 | 17.98 | not guided |
| Capital expenditure | 6.37 | 11.70 | 19.36 | 5.23 | ~35 |
| Free cash flow | (3.10) | 10.16 | 18.19 | 12.75 | not guided |
| Investing cash flow | (5.61) | (13.21) | (33.81) | (12.04) | not guided |
| Financing cash flow | 4.36 | (6.38) | (1.02) | (2.02) | not guided |
| Capex as % of revenue | 25.4% | 24.1% | 28.3% | 14.6% | ~13.6% |
| Dividends paid | n.d. | 0.61 | 1.18 | 0.18 | 0.36 (1H) |
2026E capex of about $35bn is company guidance, given as "the high ₩40 trillion range" and converted at spot; it was raised on the Q2 call.
The 30 June 2026 balance sheet excludes the ADR proceeds, which settled on 14 July 2026. Adding $26.2bn of net new equity and deducting the $29.0bn buyback authorised on 19 August leaves pro forma net cash of $47.5bn, against $50.4bn at 30 June on the same spot basis, with second-half free cash flow on top. SK hynix financed a 3.3% share retirement almost exactly with the proceeds of its own IPO.
3. Ratio analysis
| Ratio | 2023 | 2024 | 2025 | 1H26 ann. | Read |
|---|---|---|---|---|---|
| Profitability | |||||
| Gross margin | (1.6%) | 48.1% | 60.4% | 81.6% | Peak-cycle, not sustainable |
| Operating margin | (23.6%) | 35.5% | 48.6% | 74.4% | 98 point swing in 30 months |
| EBITDA margin | 18.0% | 54.4% | 62.9% | 80.3% | Fixed-cost leverage |
| Return on equity | (17.1%) | 31.1% | 44.1% | 140.1% | Flattered by the Kioxia gain |
| Return on assets | (9.1%) | 16.5% | 24.4% | 77.0% | Asset base lags earnings |
| R&D as % of revenue | 11.4% | 6.7% | 6.7% | 4.6% | Absolute spend still rising |
| Leverage and liquidity | |||||
| Liabilities to equity | 87.5% | 62.2% | 45.9% | 32.8% | The company's own metric |
| Net borrowing ratio | 38.4% | 11.5% | net cash | net cash | Disclosed as nil when negative |
| Net cash / (debt), US$bn | (15.9) | (5.8) | 8.8 | 44.8 | $61bn swing since 2023 |
| Working capital, US$bn | 7.3 | 11.7 | 22.2 | 43.2 (Q1) | Receivables driven |
| Interest-rate sensitivity, 100bp | $7m | Immaterial | |||
| Efficiency | |||||
| Days sales outstanding | 73.5 | 71.8 | 68.4 | 66.2 | Improving through the boom |
| Days inventory on hand | 147.8 | 141.4 | 135.6 | 135.5 | Flat: cost base, not units |
| Revenue / net PP&E | 0.62x | 1.10x | 1.25x | 2.97x | Price, not asset turns |
| Capacity utilisation | n.d. | n.d. | n.d. | 100% | 181 operating days in 1H26 |
| Per share and valuation, at spot ₩1,377.57 | |||||
| EPS, basic, per common share | n.d. | n.d. | n.d. | $137.59 | 1H26; $13.76 per ADS |
| Dividend per common share | $0.87 | $1.60 | $2.18 | $0.54 | Policy $1.09 a year, 2025 to 2027 |
| Dividend payout ratio | n.m. | 7.7% | 4.9% | 0.4% | The buyback is the real return |
| Trailing 12m P/E | 7.4x | At $1,199.94 per share | |||
| Price / book | 4.6x | On June 2026 equity at spot | |||
Percentages, multiples and days are currency neutral and match the Won-based figures. 1H26 annualised multiplies half-year flow items by two; balance-sheet ratios use the 30 June 2026 position. Return on equity uses average equity for 2024 and 2025 and closing equity elsewhere. Days inventory uses cost of sales. Per-share figures are converted at spot so that price, earnings and dividends share one basis. Each ADS is one tenth of a common share. Trailing 12 month earnings equal FY2025 less 1H2025 plus 1H2026, or $117.7bn at spot, on 728.9m shares outstanding.
What moved: bit volumes and prices, quarter on quarter
| Quarter | DRAM bits | DRAM ASP | NAND bits | NAND ASP |
|---|---|---|---|---|
| 1Q 2025 | High-single% dec. | Flat | High-teen% dec. | Around 20% dec. |
| 2Q 2025 | Mid-20% inc. | Low-single% inc. | Over 70% inc. | High-single% dec. |
| 3Q 2025 | High-single% inc. | Mid-single% inc. | Mid-single% dec. | Low-teen% inc. |
| 4Q 2025 | Low-single% inc. | Mid-20% inc. | Around 10% inc. | Low 30% inc. |
| 1Q 2026 | Flat | Mid-60% inc. | Around 10% dec. | Mid 70% inc. |
| 2Q 2026 | High-single% inc. | ~30% inc. | Mid-10% inc. | Mid-50% inc. |
| 3Q 2026 guide | ~10% inc. | Improving in H2 | Low-single% inc. | not guided |
424B4 MD&A quarterly table through 1Q26; Q2 2026 earnings call and semi-annual report for 2Q26. Average selling prices in this table are disclosed by SK hynix on a US dollar basis, so they are unaffected by the translation convention. The full series back to 1Q 2023 appears in the prospectus.
DRAM bit volumes were flat in Q1 2026 and up high single digit in Q2. Dollar revenue rose 189% and 238% year on year. Price accounts for nearly all of that, and the company states its ASP series is measured in dollars, so it is not a currency effect. Volume is capped by capacity, which is running at 100% utilisation. That makes this a supply-discipline case, not a demand-growth case, and it explains why the market refuses to capitalise these earnings at more than 6x.
4. Sector analysis
Company performance is not readable here without the industry frame. Memory is a three-player DRAM oligopoly and a five-player NAND market in which the marginal wafer is now allocated by a single customer group. The prospectus industry section, sourced to Gartner and IDC, is already denominated in US dollars.
Market size, US$bn, Gartner
| Segment | 2023A | 2024A | 2025A | 2026E | 2027E | CAGR 25-27 |
|---|---|---|---|---|---|---|
| Total semiconductors | n.d. | n.d. | 809 | 1,320 | 1,560 | 38.9% |
| Memory, total | 87 | 155 | 216 | 633 | 748 | 86.0% |
| DRAM, including HBM | 49.9 | 91.6 | 143 | n.d. | 401 | 67.3% |
| of which HBM | n.d. | n.d. | 33 | n.d. | 86 | 60.5% |
| NAND flash | 37.1 | 63.4 | 68 | n.d. | 341 | 123.7% |
| Enterprise share of memory | n.d. | n.d. | 43.1% | n.d. | 51.9% | vs 26.5% in 2020 |
| Semiconductor capital spending | n.d. | n.d. | n.d. | 237 | n.d. | top 20 = 87.6% |
| SK hynix revenue, US$bn | 25.1 | 48.6 | 68.4 | ~257 base | ~330 base | |
| Implied share of memory market | 28.8% | 31.3% | 31.6% | n.m. | n.m. |
2023 to 2025 DRAM and NAND figures come from the 1H26 semi-annual report (Gartner, June 2026). The 2026 and 2027 estimates come from the prospectus industry section (Gartner, 1Q26 update) and use a slightly different 2025 base of $216bn. Both are shown as filed rather than reconciled. Implied share divides SK hynix dollar revenue by the Gartner memory market for the same year and lands within two points of the IDC segment shares, which is a consistency check on the translation.
These forecasts are already stale, and that is a bull point. Gartner's $633bn 2026 memory market was built on a 1Q26 update. Micron alone booked $41.5bn of revenue in the March to May 2026 quarter, a $166bn annual run rate on roughly a fifth of the market. SK hynix ran at $52.9bn in the June quarter, a $212bn run rate. Annualising the two largest merchant suppliers implies a market already running well above the published full-year forecast. The published forecast predates the two quarters that reset the industry run rate.
Competitive structure, Q1 2026, IDC revenue share
| Segment | SK hynix | Rank | Concentration |
|---|---|---|---|
| DRAM, including HBM | 29.1% | #2 | Top 3 above 90%: Samsung, SK hynix, Micron |
| HBM | 56.4% | #1 | First to mass-produce HBM3 and HBM3E |
| NAND flash | 18.5% | #2 | Top 5 above 90%; includes Solidigm |
Peer benchmark, most recent reported quarter
| SK hynix | Micron | Samsung Electronics | |
|---|---|---|---|
| Quarter | Apr to Jun 2026 | Mar to May 2026 | n/a |
| Revenue | $52.9bn | $41.5bn | not an SEC filer |
| Gross margin | 83.2% | 84.6% | n.d. |
| Operating profit | $40.4bn | $33.3bn | n.d. |
| Operating margin | 76.3% | 80.4% | n.d. |
| Net income | $62.6bn, including one-offs | $28.2bn | n.d. |
| DRAM / NAND mix | 77% / 22% | 76% / 24% | n.d. |
| Fiscal year to date capex | $5.2bn, Q1 only | $19.6bn, 9M | n.d. |
| Fiscal year to date operating cash flow | $18.0bn, Q1 only | $45.7bn, 9M | n.d. |
| Equity | $190.7bn at spot | $100.7bn | n.d. |
| Inventory days | 135 | 122 | n.d. |
| Share price, 28 Aug 2026 | $1,199.94; ADR $161.04 | $932.86 | n.d. |
| Market cap | $877bn, Seoul line | ~$1.05tn | n.d. |
| P/E, normalised, Morningstar | 10.3x | 20.7x | 20.6x |
| Price / book, Morningstar | 6.7x | 10.5x | 3.1x |
| Return on equity, normalised, Morningstar | 66.9% | 76.6% | 33.5% |
SK hynix quarterly flows converted at the Q2 2026 average rate of ₩1,500.6; equity and price at spot. Micron figures from the 10-Q for the quarter ended 28 May 2026, accession 0000723125-26-000015; inventory days computed on that quarter's cost of sales. Samsung Electronics does not file with the SEC; its multiples come from Morningstar's comparison table and are not verified against primary filings. Morningstar's SK hynix multiples are computed on the ADR price, which trades at a premium to the Seoul line.
What is driving the shift
- Tiered AI memory. HBM next to the GPU, server DRAM next to the CPU, enterprise SSD underneath. Each tier scales with AI server count, so the three grow together rather than substituting. This is the mechanism behind enterprise memory going from 26.5% of the market in 2020 to a forecast 51.9% in 2027.
- HBM crowds out everything else. HBM consumes far more wafer per bit than conventional DRAM, plus through-silicon-via and packaging capacity. Producers reallocating cleanroom space to HBM created the conventional DRAM shortage. Gartner has traditional DRAM ASP up 45.2% year on year in Q4 2025, then 136.4% and 198.1% in Q1 and Q2 2026.
- NAND joined late and violently. Gartner expects NAND ASP up 111% year on year in Q1 2026, 244% in Q2 and over 250% in both Q3 and Q4. SK hynix NAND ASP rose mid-70% then mid-50% quarter on quarter in the last two quarters.
- HBM carries a real price premium. Gartner puts HBM above five times conventional DRAM per gigabyte in 2025. If conventional DRAM prices normalise faster than HBM, mix shift alone protects a large part of the margin.
- Barriers are capital, not just technology. 2026 industry capital spending of $237bn with 87.6% concentrated in twenty companies. New entrants cannot buy their way in at scale, and incumbents can only add supply on multi-year lead times, which is why the current shortage is slow to clear.
5. What management committed to on the Q2 2026 call
| Item | Statement, 29 July 2026 |
|---|---|
| Q3 DRAM shipments | Approximately +10% quarter on quarter |
| Q3 NAND shipments | Low single-digit % quarter on quarter |
| 2026 market demand growth | DRAM mid-20%, NAND high-10%, contingent on supply constraints easing |
| 2026 capex | Raised to about $35bn, guided as "the high ₩40 trillion range" |
| Long-term agreements | Concluded with about 10 customers including key accounts; roughly 5-year terms; non-uniform pricing; deposit mechanisms; coverage as a share of sales not disclosed |
| HBM4 | Mass-production shipments began Q2 2026; full ramp in H2 2026; yield and quality nearing mature HBM3E levels |
| HBM4E | Samples delivered to a major customer in 1H26; volume production targeted 2027 |
| HBM5 and iHBM | In-package cooling elements, expected to cut thermal resistance by over 30% |
| 2027 HBM pricing | Negotiations with key customers progressing smoothly; terms not disclosed |
| NAND node | 321-layer to reach 50% of domestic capacity by end-2026 |
| Enterprise SSD | Revenue doubled quarter on quarter; Solidigm 30TB-plus revenue more than tripled |
| Shareholder returns | Additional measures under review, to be communicated within the year |
Where management pushed back
- On the AI capex slowdown narrative. Data-centre leasing and more efficient models are framed as monetisation and utilisation of infrastructure already built, not reduced investment. Management said major customers are still requesting more memory supply.
- On oversupply from its own expansion. Capacity is planned against demand visibility secured in customer partnerships, and equipment investment and ramp will be phased. Management does not expect its medium-term plan to cause oversupply "right away." The qualifier leaves 2028 open.
- On HBM competition. The claimed differentiator is not performance alone but yield, quality and the ability to supply volume on time, described as not replicable quickly.
- On the weak DRAM blended ASP in Q2. Attributed to mix, with some high-value shipments slipping into the second half. Management expects both higher bit growth and better mix in H2, so blended ASP should improve.
Capital commitments approved since the IPO, US$bn at spot
| Project | Approved | Amount | Period to |
|---|---|---|---|
| P&T7 advanced packaging, Cheongju, increase | 22 Jul 2026 | 5.1 | Dec 2032 |
| M17 fab, Cheongju, new NAND base | 7 Aug 2026 | 13.9 | Apr 2031 |
| Y2, Yongin Fab 2 phases 1 to 6 | 7 Aug 2026 | 25.6 | Oct 2031 |
| Approved in six weeks | 44.6 | 50.9% of FY25 equity | |
| Prior: Yongin phases 2 to 6 | 25 Feb 2026 | 15.7 | in progress |
| Prior: P&T7 programme total | 22 Apr 2026 | ~13.8 | in progress |
| Prior: Yongin Fab 1 | 26 Jul 2024 | 6.8 | cleanroom opens 1Q27 |
| Prior: M15X, Cheongju | 24 Apr 2024 | 3.8 | Oct 2026 |
| Unrecognised PP&E commitments, 30 Jun 2026 | 39.7 | vs 4.6 at Dec 2025 |
Board-approved future spending is converted at spot because it will be incurred over 2026 to 2032. The 30 June commitments balance is converted at the June period-end rate to stay consistent with the balance sheet; at spot it is $44.6bn. The 50.9% ratio is the company's own disclosure against FY2025 equity and is currency neutral. The long-range plan announced on 29 June 2026 indicates roughly $436bn for the Yongin cluster, $290bn for a new southwestern cluster and $73bn for Cheongju, around $800bn in total over multiple decades. Those are announced intentions, not contracted commitments.
A $40bn contracted capex book and an $800bn indicated build plan are what create the 2028 bear case. The same management that says supply will stay tight approved $44.6bn of new fab investment in six weeks. Both statements can be true only if AI memory demand compounds through 2030. If it does not, the depreciation from this spend lands exactly when prices normalise. That sequence produced the 2023 loss year: capacity added in 2021 and 2022 depreciating into falling prices.
6. Scenario analysis, 2026 to 2028
Revenue is modelled bottom up as DRAM and NAND bit volume multiplied by average selling price, because that is the form in which the company guides and discloses, and because its ASP series is already on a US dollar basis. Cost of sales is split into a cash component that scales with bits and unit cost, and depreciation driven by the capex schedule. A profit-sharing charge of 9% of pre-bonus operating profit is applied, reflecting the incentive programme the MD&A identifies as the main driver of rising cost of sales. Tax is held at 24%, close to the 23.0% effective rate in 1H 2026. All forecast figures are translated at ₩1,377.57 and assume that rate holds.
Core assumptions by scenario
| Driver | Bull | Base | Bear |
|---|---|---|---|
| H2 2026, quarter on quarter, US$ ASP | |||
| Q3 DRAM bits / ASP | +10% / +25% | +10% / +18% | +10% / +8% |
| Q4 DRAM bits / ASP | +10% / +15% | +8% / +10% | +5% / -5% |
| Q3 NAND bits / ASP | +3% / +28% | +3% / +20% | +3% / +8% |
| Q4 NAND bits / ASP | +6% / +18% | +5% / +12% | +3% / -5% |
| 2027, annual | |||
| DRAM bits / ASP | +30% / +20% | +25% / +5% | +20% / -35% |
| NAND bits / ASP | +25% / +15% | +20% / 0% | +15% / -40% |
| 2028, annual | |||
| DRAM bits / ASP | +25% / -5% | +20% / -20% | +15% / -50% |
| NAND bits / ASP | +20% / -5% | +18% / -20% | +12% / -50% |
| Cost and capital | |||
| Cash cost per bit, annual | +4 to +6% | +2 to +4% | 0 to -8% |
| Opex growth | +30% a year | +25% a year | +18% a year |
| Capex 2026 / 27 / 28, $bn | 36 / 52 / 62 | 35 / 45 / 42 | 34 / 36 / 20 |
| D&A 2026 / 27 / 28, $bn | 13 / 20 / 29 | 13 / 19 / 26 | 13 / 18 / 23 |
| USD/KRW | ₩1,377.57 held flat across all three cases | ||
Cash cost per bit rises in the bull and base cases because HBM4 and HBM4E are more wafer- and packaging-intensive per bit than conventional DRAM, and because the mix is shifting toward them. It falls in the bear case on aggressive node migration and cost programmes. Non-operating income is set at $48.6bn in 2026, being the realised Kioxia and financial-instrument gains booked in 1H26 plus a small H2 contribution, and normalises to $1.8bn thereafter, $0.4bn in the bear case.
Scenario outputs, US$bn unless stated
| Case | Metric | 2026E | 2027E | 2028E |
|---|---|---|---|---|
| Bull | Revenue | 272.6 | 416.3 | 489.6 |
| Operating profit | 198.6 | 309.6 | 355.4 | |
| Operating margin | 72.9% | 74.4% | 72.6% | |
| EBITDA | 211.5 | 329.9 | 384.4 | |
| Net income | 187.9 | 236.7 | 271.5 | |
| Free cash flow | 103.0 | 182.1 | 212.5 | |
| EPS per common share | $261.24 | $335.85 | $385.21 | |
| Price paid per $ of that year's earnings | 4.6x | 3.6x | 3.1x | |
| Base | Revenue | 256.8 | 329.6 | 315.4 |
| Operating profit | 184.7 | 234.8 | 206.7 | |
| Operating margin | 71.9% | 71.2% | 65.5% | |
| EBITDA | 197.5 | 254.0 | 232.8 | |
| Net income | 177.3 | 179.8 | 158.5 | |
| Free cash flow | 93.8 | 135.7 | 124.9 | |
| EPS per common share | $246.60 | $255.14 | $224.82 | |
| Price paid per $ of that year's earnings | 4.9x | 4.7x | 5.3x | |
| Bear | Revenue | 229.7 | 174.5 | 100.5 |
| Operating profit | 160.6 | 99.1 | 25.0 | |
| Operating margin | 69.9% | 56.8% | 24.9% | |
| EBITDA | 173.3 | 117.2 | 47.5 | |
| Net income | 159.0 | 75.6 | 19.3 | |
| Free cash flow | 77.5 | 48.3 | 16.1 | |
| EPS per common share | $221.16 | $107.26 | $27.39 | |
| Price paid per $ of that year's earnings | 5.4x | 11.2x | 43.8x |
Shares fall from 728.9m to 704.8m as the $29bn buyback completes and is cancelled by November 2026; 2026 EPS uses a part-year weighted count. 2026 net income includes the one-off financial gains; excluding them, base-case 2026 core EPS is $197.13 per common share, or $19.71 per ADS, a P/E of 6.1x. Free cash flow is EBITDA less cash tax, capex, and a 5% of revenue allowance for working-capital build, which is conservative given receivables have grown faster than sales. Divide per-share figures by ten for the per-ADS equivalent. The last row divides today's price by an undiscounted future-year figure, so it states what a buyer at today's price would have paid per dollar of that year's earnings if the scenario is realised. It is not a valuation; section 11 discounts the cash flows.
Assumption leverage, ranked
- DRAM ASP in 2027 dominates the model. Moving 2027 DRAM ASP from +5% to -25% removes about $84bn of operating profit, roughly a third. Nothing else in the model has that leverage.
- Bit growth matters far less. A ten-point swing in 2027 DRAM bit growth, from 25% to 35%, moves operating profit by about $20bn, a quarter of the ASP effect. When gross margin is 77%, incremental bits are almost pure profit but incremental price is total profit.
- Depreciation is the delayed bill. D&A rises from $9.8bn in 2025 to $26bn by 2028 in the base case, a $16bn annual fixed-cost step arriving on a two-year lag from today's capex decisions.
- Currency is third order. A 10% dollar move is roughly $1.9bn of pre-tax profit, about 1% of base-case 2027 operating profit. It matters more for reported Won earnings than for the dollar investment case.
7. Sensitivity analysis
The grid holds the base-case 2026 exit cost structure and varies only 2027 DRAM ASP and DRAM bit growth. It shows the price paid per dollar of 2027 earnings under each outcome, not a discounted value. NAND moves sympathetically, with bit growth at 0.8x the DRAM rate and ASP at 0.9x the DRAM change. ASP changes are on the company's own US dollar basis, so the grid is unaffected by the translation convention.
Other sensitivities disclosed in the filings
| Exposure | Move | Effect on pre-tax profit |
|---|---|---|
| US dollar | +10% vs Won | +$1,939m |
| US dollar | -10% vs Won | -$1,939m |
| Japanese yen | +10% vs Won | +$269m |
| Chinese yuan | +10% vs Won | -$15m |
| Euro | +10% vs Won | -$34m |
| Interest rates | +100bp | -$7m |
As of 31 March 2026, per the MD&A market-risk disclosure, converted at that date's rate of ₩1,523.5. The dollar has since fallen 10.4% against the Won, from ₩1,538 on 2 July 2026 to ₩1,378 on 28 August 2026. On the disclosed sensitivity that is roughly a $1.9bn annual headwind to pre-tax profit, and it postdates the 29 July guidance.
8. Critical factors, ranked by how much they move the bull case
| # | Factor | Why it drives the upside | What would falsify it |
|---|---|---|---|
| 1 | HBM wafer crowd-out of conventional DRAM | HBM consumes multiples of the wafer, through-silicon-via and packaging capacity per bit. Reallocating cleanroom space to HBM created the server DDR5 and RDIMM shortage, and conventional DRAM is roughly three quarters of revenue. Gartner has traditional DRAM ASP up 198% year on year in Q2 2026. | HBM4 yields improving fast enough to free wafer capacity, or Samsung and Micron adding conventional DRAM capacity faster than HBM demand grows. |
| 2 | Long-term agreements converting spot into contract | About ten customers, roughly five-year terms, deposit mechanisms, pricing structures designed to dampen volatility. If a meaningful share of volume is contracted, the 2028 downside distribution narrows and the multiple should re-rate. | Management declining to disclose LTA share of sales. Until that is quantified, the market is right to discount it. |
| 3 | HBM4 ramp and HBM4E qualification | HBM4 entered mass production in Q2 2026 with yields approaching mature HBM3E. HBM4E samples are with a major customer for 2027 volume. Each generation transition is where share is won or lost, and SK hynix holds 56.4%. | A competitor qualifying HBM4 at a lead customer at scale, or a yield problem on the 2027 ramp. |
| 4 | Enterprise SSD and the NAND re-rating | Enterprise SSD revenue doubled quarter on quarter; Solidigm 30TB-plus revenue more than tripled. NAND is now an AI storage-tier story covering key-value cache offload, AI data lakes and hard-disk replacement, rather than a phone-and-PC story. Gartner forecasts NAND revenue at a 123.7% CAGR to $341bn by 2027. | NAND has the weakest barriers of the three segments and the most Chinese supply risk. A China SAMR condition also limits price increases in China through December 2026. |
| 5 | Capital return at a depressed multiple | A $29bn buyback and cancellation, 3.3% of issued stock, inside three months, funded from a $65bn distributable-profit pool, with policy set at over 50% of cumulative 2025 to 2027 free cash flow. Base-case free cash flow of $94bn in 2026 and $136bn in 2027 supports far more. | Capex escalation absorbing the free cash flow. The $800bn indicated build plan is the competing claim on the same cash. |
| 6 | Structural mix shift to enterprise | Enterprise memory rose from 26.5% of the market in 2020 to 43.1% in 2025 and a forecast 51.9% in 2027. Enterprise demand is contracted, planned and less seasonal than consumer, which should dampen cycle amplitude. | Hyperscaler capex is itself now the cycle. Concentrating demand in six buyers replaces consumer cyclicality with customer concentration. |
9. The ADR anomaly
SK hynix listed 17,790,000 new shares as American Depositary Shares on Nasdaq on 10 July 2026 at $149.00 per ADS, raising $26.507bn gross and roughly $26.2bn net. Management described it on the Q2 call as the largest US IPO ever by a foreign company. Each ADS represents one tenth of a common share.
| Reference | Per ADS | Per common share |
|---|---|---|
| IPO price, 9 July 2026 | $149.00 | $1,490.00 |
| Seoul close, 28 Aug 2026 | $119.99 | $1,199.94 |
| Nasdaq close, 28 Aug 2026 | $161.04 | $1,610.40 |
| ADR premium to the Seoul line | ~34% | |
| ADR 52-week range | $124.80 to $194.80 | |
| Market cap, Seoul line | $877bn | |
| Market cap implied by the ADR | $1,176bn |
The mechanism is disclosed on the Q2 call. ADRs convert freely into Korean common shares, but converting shares into ADRs requires a regulatory filing that can take several weeks and is capped at 17,790,000 shares, the exact size of the offering, which is already fully used. The arbitrage that would close a premium, shorting the ADR and buying Seoul stock to deposit into the programme, is blocked. Management said no decision has been made on raising the ADR ratio.
US investors buying SKHY pay roughly a third more for the same cash flows than investors in Seoul. Third-party data services that compute SK hynix multiples from the ADR price, such as the $1.14tn market cap shown by Morningstar, overstate the market capitalisation by about the same margin. Every valuation figure here uses the Seoul line converted at spot. A decision to lift the conversion cap would be a negative catalyst for the ADR and neutral for the underlying. A dollar investor in the Seoul line carries Won exposure directly; the ADR carries the same exposure plus this premium.
10. Risks
| Risk | Status in the filings | Severity |
|---|---|---|
| Cycle reversal | The company names cyclicality as risk factor one. The 2023 loss of $6.99bn is three years old. | High |
| China export controls | Validated End-User designation revoked effective 31 December 2025, replaced by an annual approval mechanism. The 2026 licence was granted in December 2025. The 2027 licence is not yet secured. The Wuxi and Dalian fabs depend on it. | High |
| Semiconductor tariffs | A 100% semiconductor tariff was threatened in August 2025 and January 2026. The Supreme Court struck down IEEPA tariffs in February 2026; a Section 122 surcharge at 15% replaced them, currently with a semiconductor exception, for 150 days. | Medium |
| Customer concentration | Two customers were 14.8% and 12.4% of Q1 2026 revenue; one was 23.9% of FY2025. | Medium |
| Capex overhang | $39.7bn of contracted commitments at 30 June 2026, up from $4.6bn six months earlier. Depreciation steps up from 2028. | High |
| China NAND pricing condition | A SAMR condition from the Intel NAND deal requires reasonable pricing in China until December 2026; the company states this limits its ability to raise NAND prices there in 2026. | Medium |
| Currency | Disclosed sensitivity: a 10% move in the dollar is $1.9bn of pre-tax profit. The dollar has fallen 10.4% against the Won since 2 July 2026. | Medium |
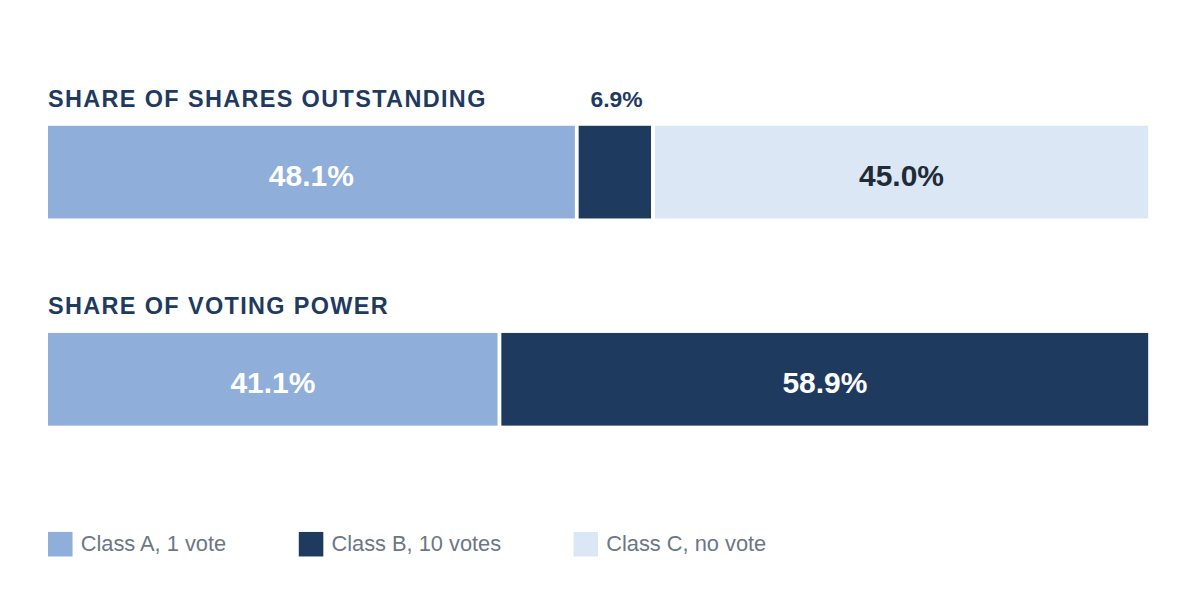
| Governance and control | SK square must hold at least 20% under the Monopoly Regulation and Fair Trade Act, which capped the offering at 2.5% of shares. Foreign private issuer, exempt from several US governance rules. Held 20.50% at 30 June 2026. | Low |
| Earnings quality | $42.6bn of 1H26 finance income is gains on financial instruments from the Kioxia exit, not operations. A $2.68bn derivative loss on exchangeable bonds is non-cash and offset in equity by treasury-share disposal gains. | Medium |
| Unconfirmed corporate actions | Three 6-K clarifications in August 2026 confirm nothing is decided on a roughly $3.6bn Solidigm pre-IPO raise, a roughly $2.9bn sale of a stake in the Chongqing packaging plant, or a Japanese fab. An Intel Ohio acquisition was denied outright. | Low |
| Safety and environmental | 2026 year to date: about $8,800 in fines across three incidents plus seven non-monetary measures including operation-suspension and improvement orders tied to chemical leaks and fires. | Low |
11. Valuation
Today's price and a future year's earnings are different objects. Dividing one by the other measures an entry price, not a value. Two separate questions follow, and they have different answers.
What you pay, at ₩1,377.57
| Share price, KRX 000660, 28 August 2026 | $1,199.94 |
| Equivalent per ADS, one tenth of a share | $119.99 |
| Shares issued, after the ADR offering, before the buyback | 730,492,365 |
| Market capitalisation | $877bn |
| Less net cash at 30 June 2026 | ($50.4bn) |
| Enterprise value | $826bn |
| Buyback authorised, to complete by 19 November 2026 | $29.0bn, 3.3% |
| Dividend, annualised policy | $1.09, 0.09% yield |
Question one: is it cheap on realised performance alone?
| Trailing measure, no forecast | Multiple | Base |
|---|---|---|
| P/E on reported net income, last twelve months | 7.4x | $117.7bn, of which about $43bn is the Kioxia gain |
| P/E on operating profit taxed at 24%, last twelve months | 12.3x | $71.0bn core |
| EV / operating profit, last twelve months | 8.8x | $93.4bn |
| EV / revenue, last twelve months | 6.0x | $137.3bn |
| Price / book, 30 June 2026 equity at spot | 4.6x | $190.7bn |
| EV / average operating profit, 2023 to 2025 | 54x | $15.2bn average; 2023 was a loss |
| EV / average operating profit, 2023 to last twelve months | 24x | $34.8bn average |
The answer inverts depending on the base. On the last twelve months the stock is on 7x to 12x. On any multi-year average of realised operating profit it is on 24x to 54x, because three years ago the company lost $5.9bn at the operating line. A trailing multiple on a cyclical at peak earnings locates the position in the cycle. It does not price the asset.
Last twelve months means July 2025 to June 2026, computed as FY2025 less 1H2025 plus 1H2026, converted at the 28 August spot rate so that price and earnings share one basis. Averages use each year's operating profit converted at the same rate, which removes currency from the comparison.
Question two: is it cheap on anticipated performance?
This one requires the future discounted back. Taking the modelled base-case free cash flow for 2027 and 2028, discounting at 10.5% and treating everything from 2029 as a perpetuity growing at 2%, the two forecast years account for $229bn of the $826bn enterprise value. The remaining $597bn is the terminal value, and it implies a normalised free cash flow of $64bn a year from 2029.
| Path | Discount rate | Perpetuity growth | PV of 2027-28 FCF | Required FCF from 2029 | vs $18.2bn in 2025 |
|---|---|---|---|---|---|
| Base | 8.5% | 2% | $234bn | $47bn | 2.6x |
| Base | 10.5% | 2% | $229bn | $64bn | 3.5x |
| Base | 10.5% | 0% | $229bn | $79bn | 4.4x |
| Base | 12.5% | 2% | $223bn | $83bn | 4.6x |
| Bull | 10.5% | 2% | $344bn | $52bn | 2.8x |
| Bear | 10.5% | 2% | $58bn | $83bn | 4.5x |
Run the other way, holding the base path, a 10.5% discount rate and 2% growth:
| Normalised free cash flow from 2029 | Terminal value | Equity value | Per common share | vs $1,199.94 |
|---|---|---|---|---|
| $18.2bn, the 2025 actual | $214bn | $449bn | $614 | -49% |
| $30bn | $353bn | $559bn | $765 | -36% |
| $45bn | $529bn | $698bn | $956 | -20% |
| $64bn | $752bn | $874bn | $1,197 | 0% |
| $80bn | $941bn | $1,024bn | $1,402 | +17% |
| $100bn | $1,176bn | $1,210bn | $1,657 | +38% |
| $125bn, the 2028 base-case peak | $1,471bn | $1,443bn | $1,976 | +65% |
The 2027 and 2028 estimates move the answer very little, since together they are 28% of enterprise value. What decides it is whether AI memory demand holds free cash flow above roughly $64bn a year once the current price spike ends. On the 2025 base of $18.2bn the shares are worth about half of today's price. At the modelled 2028 peak of $125bn they are worth 65% more.
The 10.5% discount rate is an assumption, built from a Korean risk-free rate, an equity risk premium and a beta above one. None of those three inputs has been verified against a source here, which is why the table spans 8.5% to 12.5%. Cash flows are discounted from 29 August 2026 with 2027 and 2028 treated as arriving mid-year and the terminal value struck at the end of 2028. Nothing beyond 2028 appears in any filing; the perpetuity is a modelling device, not a forecast.
Three numbers
$64bn. The perpetual free cash flow from 2029 that today's price requires at a 10.5% discount rate. That is 3.5x the 2025 outturn and about half the modelled 2028 base-case peak.
28%. The share of enterprise value covered by the discounted 2027 and 2028 free cash flow. Almost three quarters of the price rests on years that no filing describes.
78%. The revenue decline from base-case 2027 that would take operating profit to zero. The cost structure absorbs a severe price shock, which protects the near-term earnings stream but not the terminal value.
What would change this view
- Positive. Disclosure of LTA coverage as a percentage of sales, at any level above roughly a third. That single number converts a spot-priced commodity into a contracted revenue base and narrows the range of plausible normalised free cash flow.
- Positive. Q3 2026 results confirming both the 10% DRAM bit growth guide and improved blended ASP from HBM4 mix, validating the second-half ASP recovery management promised.
- Negative. Failure to obtain the 2027 annual BIS licence for the China fabs. Wuxi and Dalian are not marginal assets.
- Negative. Evidence that HBM4 yields are improving fast enough to release conventional DRAM wafer capacity in 2027, which would unwind the shortage that is generating most of the profit.
- Negative. Capex guidance for 2027 materially above $50bn without a corresponding LTA disclosure.
- Currency. Further Won strength compresses dollar earnings roughly one for one on translation and by about $1.9bn of pre-tax profit for each 10% move on the transaction exposure. A weaker Won does the reverse.
12. Sources and method
Primary sources
- SK hynix Inc., Form 424B4, filed 9 July 2026, accession 0001193125-26-299963. Exchange rates used here come from its Exchange Rates section.
- SK hynix Inc., Forms 6-K, sixteen filings between 15 July and 21 August 2026, including the Q2 preliminary results of 29 July, the semi-annual business report of 18 August and the buyback, cancellation and shareholder-return filings of 19 August.
- SK hynix Q2 FY2026 earnings conference call transcript, 28 July 2026; original recording SK hynix Investor Relations.
- Micron Technology Inc., Form 10-Q for the quarter ended 28 May 2026, accession 0000723125-26-000015. XBRL financial statements, reported in US dollars.
- Market data: KRX close for 000660 and USD/KRW spot, 28 August 2026; Nasdaq close for SKHY and Micron, 28 August 2026. Samsung Electronics multiples from Morningstar comparison data, not verified against primary filings.
- Third-party industry data as cited within the prospectus and semi-annual report: Gartner and IDC, already denominated in US dollars.
Method and limitations
- All company financials are as filed with the SEC in Korean Won, then translated as described in section 1. Percentages, margins, ratios and multiples are currency neutral and match the Won-based figures.
- Operating profit for 2023 to 2025 is derived as gross profit less SG&A less R&D, because IFRS as issued by the IASB does not require an operating-profit subtotal. The derived figures reconcile to the operating profit reported in the Korean semi-annual report for 2024 and 2025.
- Q2 2026 gross profit and cost of sales are derived by subtracting the Q1 2026 interim figures from the 1H 2026 semi-annual figures. Q2 2026 results are provisional; the 6-K states the external auditor's review was not complete.
- Quarterly 2025 exchange rates are not disclosed in the prospectus, so 2025 quarterly and half-year dollar comparatives use the FY2025 average rate.
- Segment revenue is not disclosed quarterly after Q1 2026. The DRAM and NAND split used in the model from Q2 2026 onward is derived from disclosed bit-volume and dollar ASP changes, calibrated so that the modelled Q2 total equals the reported figure exactly.
- Only three years of audited annual financials exist in the public record, because Form F-1 requires three years for a foreign private issuer. A five-year series is not available from SEC sources.
- Scenario outputs are the author's model, not company guidance, and hold USD/KRW flat. Where the company has guided, the guidance is used directly and identified as such.
- The valuation in section 11 discounts modelled 2027 and 2028 free cash flow from 29 August 2026, treating each year as arriving mid-year, and strikes a perpetuity at the end of 2028. The 10.5% discount rate and the 2% perpetuity growth rate are assumptions; neither the risk-free rate, the equity risk premium nor the beta behind them has been verified against a source, which is why the tables span 8.5% to 12.5%.
- Price divided by a future year's earnings, shown in sections 6 and 7, measures the entry price against one modelled year. It is undiscounted and is not a valuation.
- This is analysis of public filings. It is not investment advice.