Equity Research & Market Insights
Company, sector and economic analysis created with our datasets.
Showing 42 of 42 posts
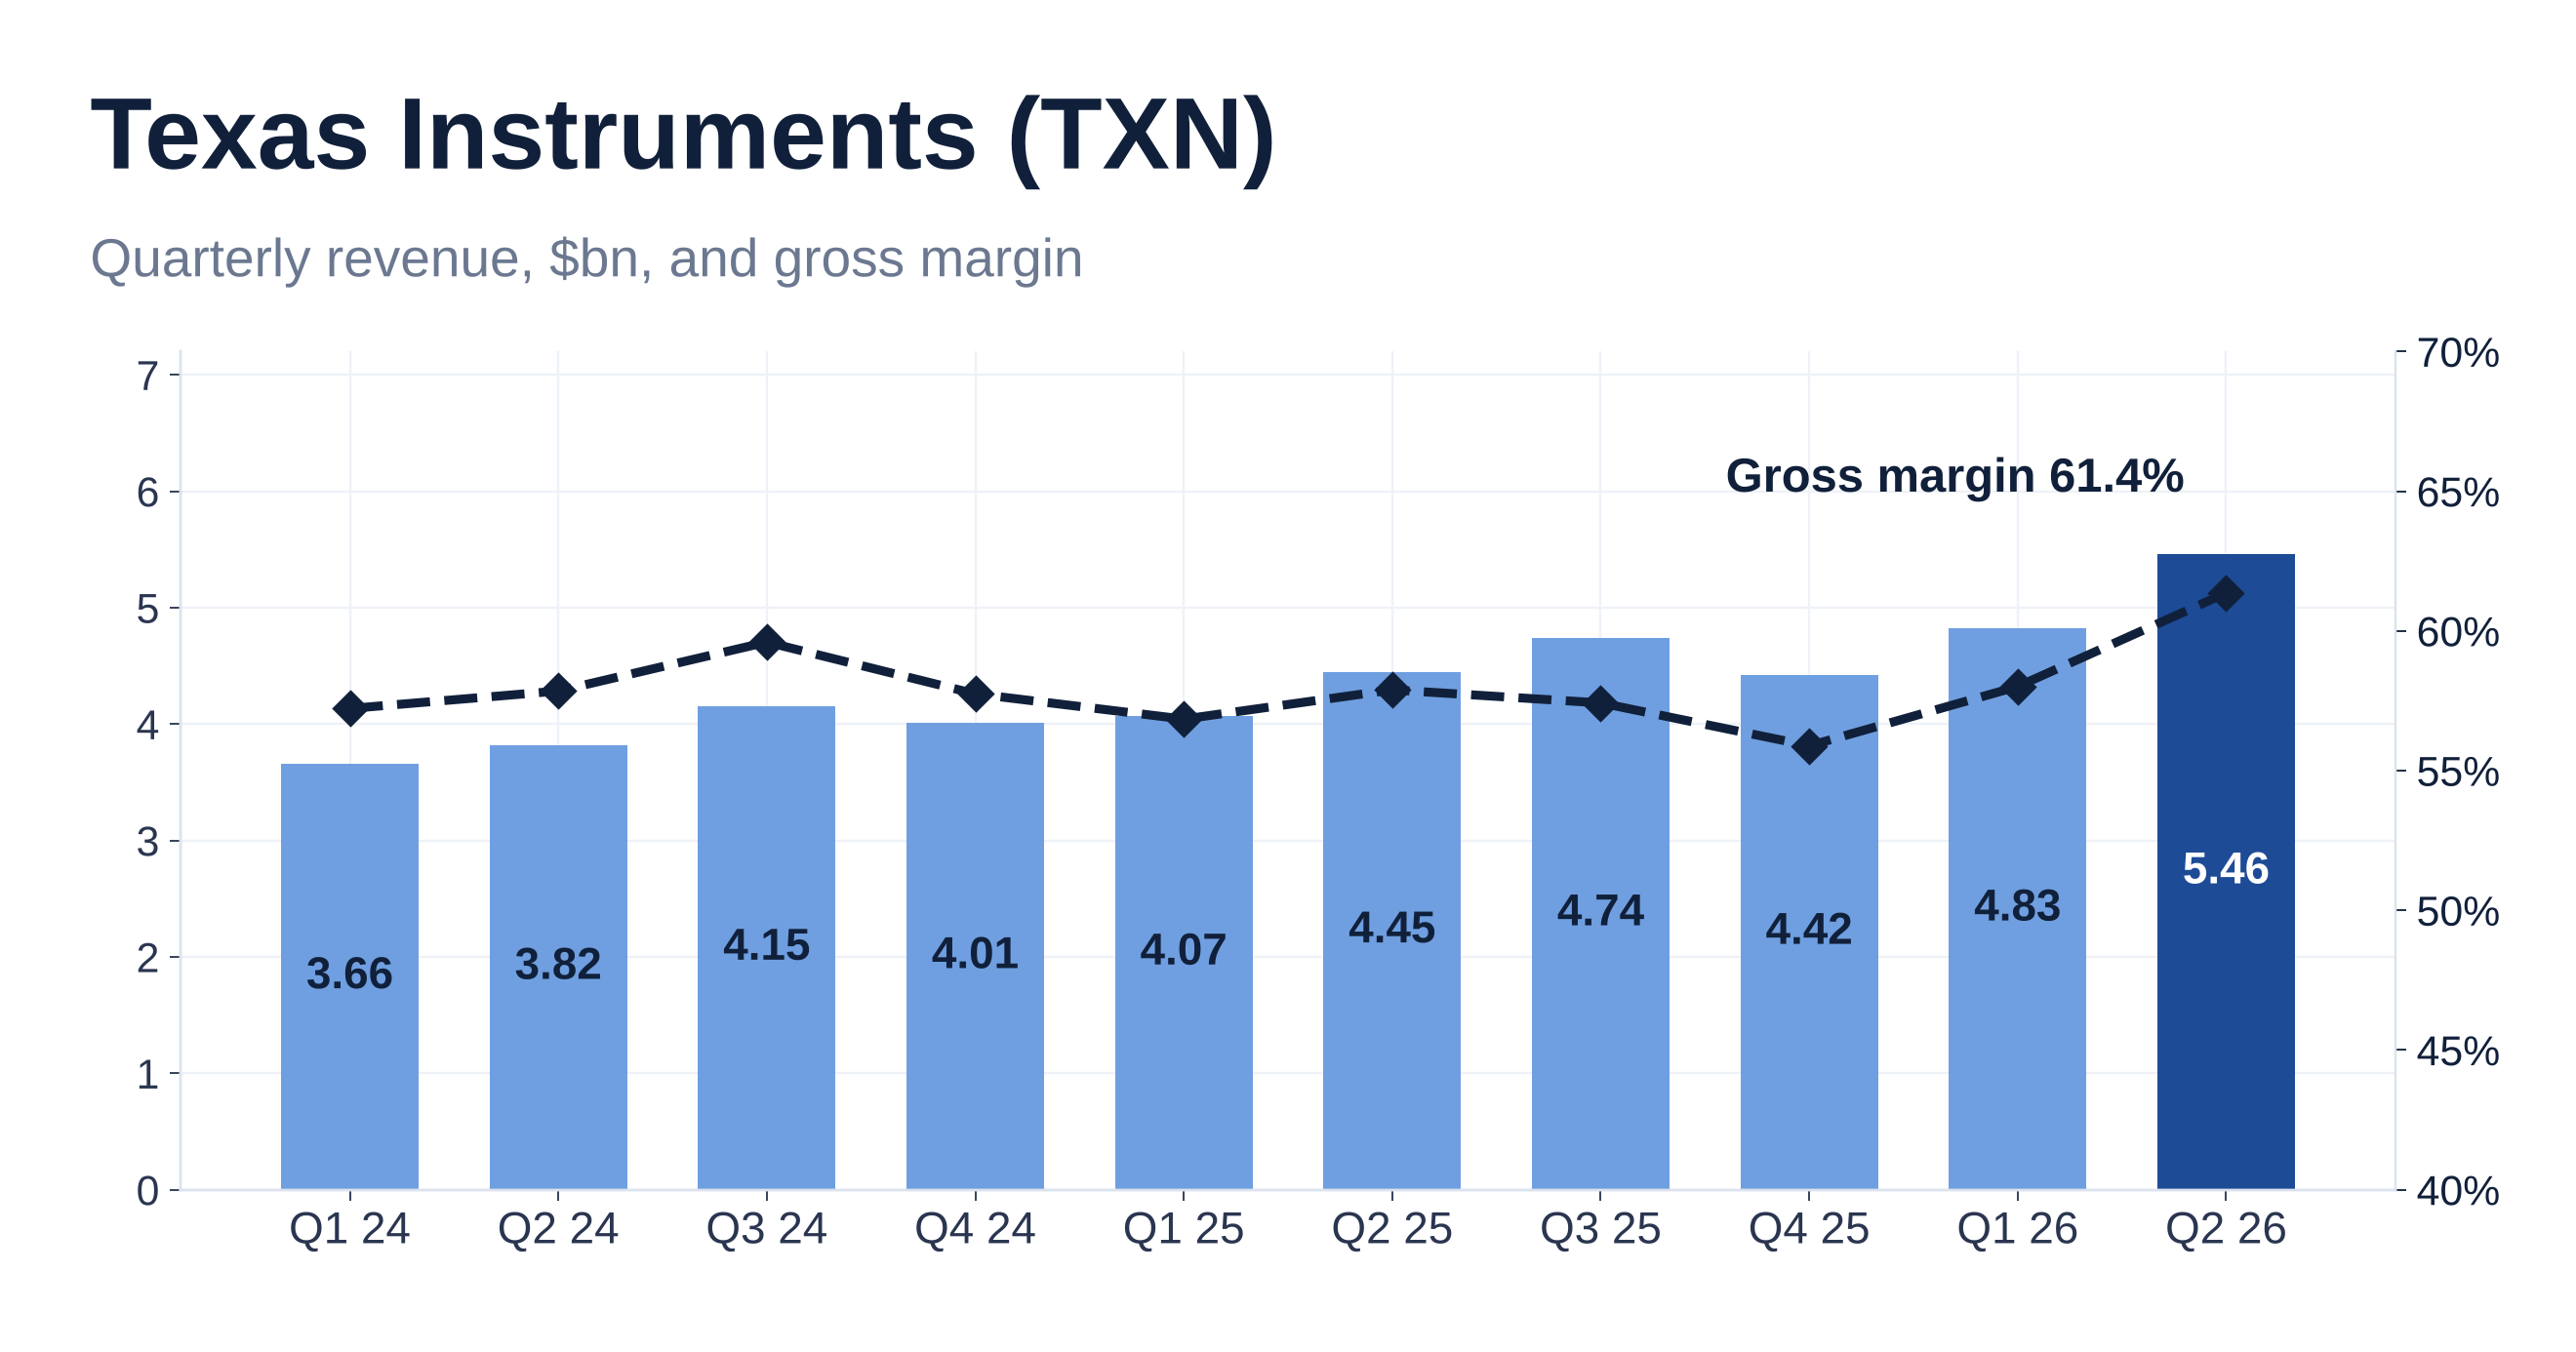
Texas Instruments (TXN) financial and ratio analysis: Q2 2026 filings, sector comparison and scenarios to 2029
Texas Instruments revenue rose 23% to $5.46bn in Q2 2026 and gross margin reached 61.4%. Free cash flow was $6.5bn in four quarters to June 2026, after capital expenditures of $14.4bn in 2023 to 2025. Three scenarios give 2029 EPS of $6.75, $12.32 and $15.03.
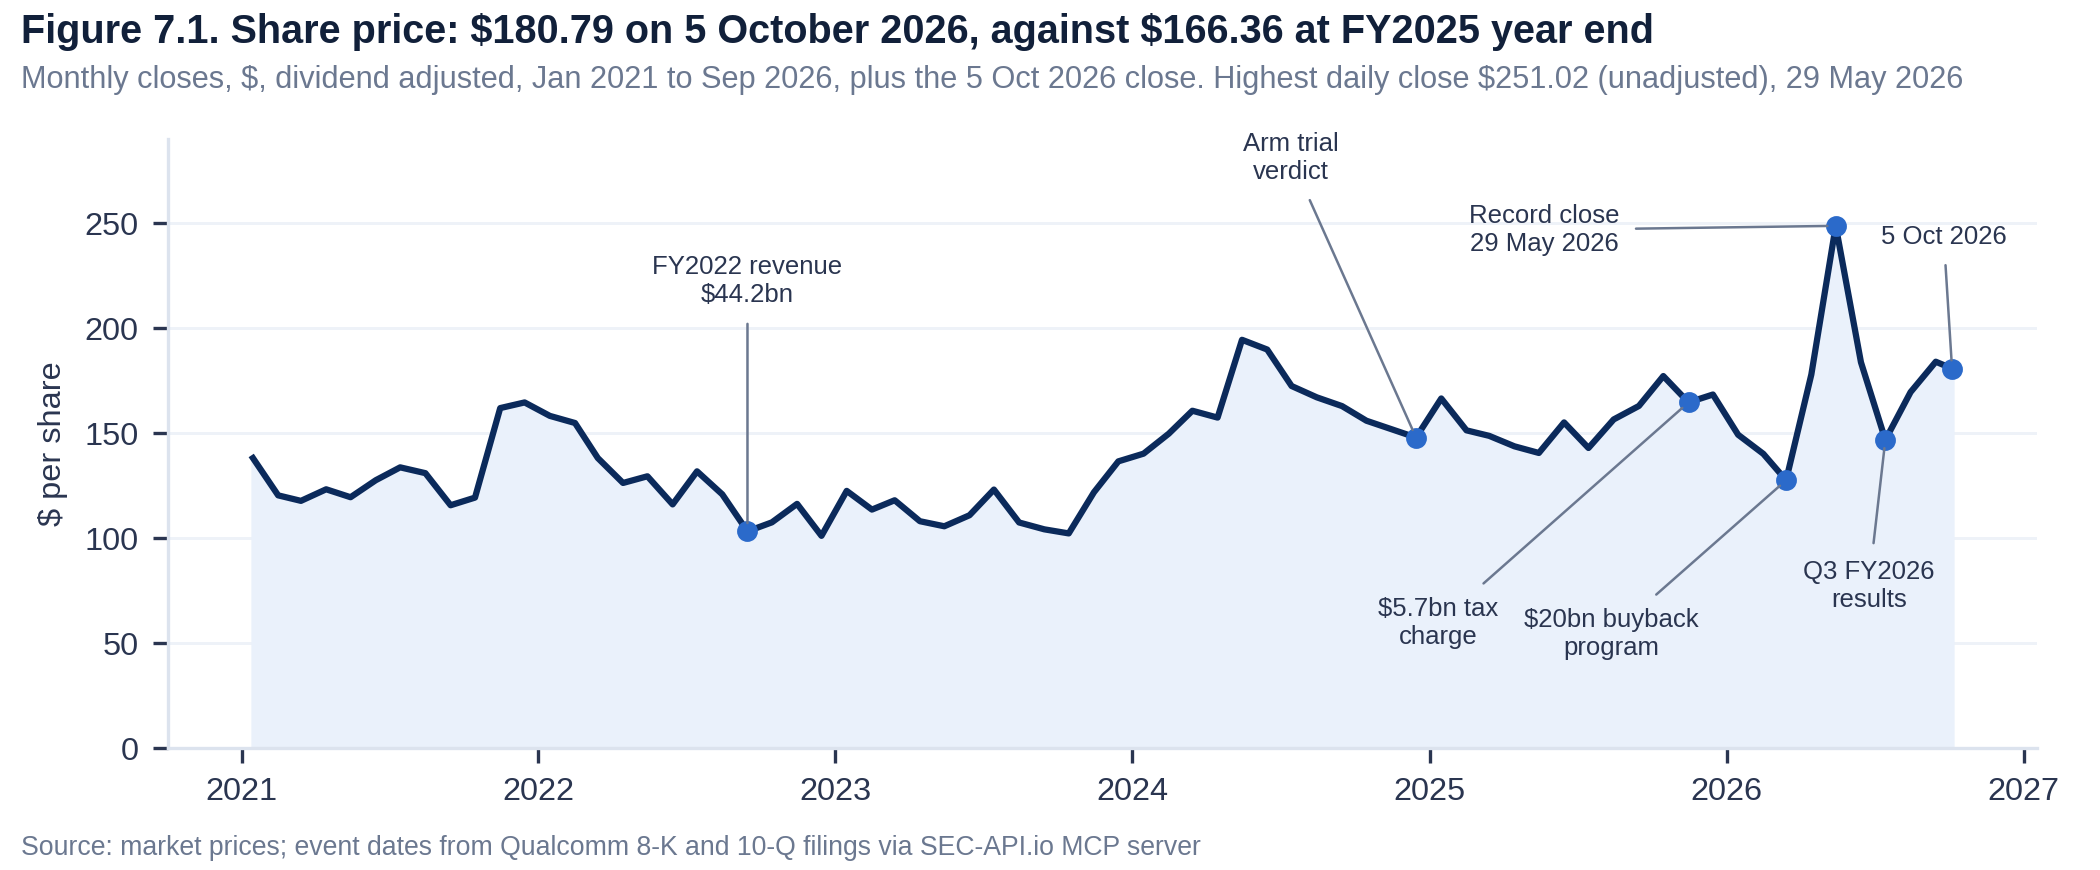
Financial analysis of Qualcomm: Q3 FY2026 handset decline, automotive growth and scenarios to FY2029
Qualcomm's Q3 FY2026 revenue fell 4% to $9.95bn: handset chip revenue fell 20% and automotive revenue rose 61%. At $180.79 the stock trades at 15.9x TTM non GAAP EPS, and scenarios built on the filings give end FY2029 values of $65, $182 and $301 per share.
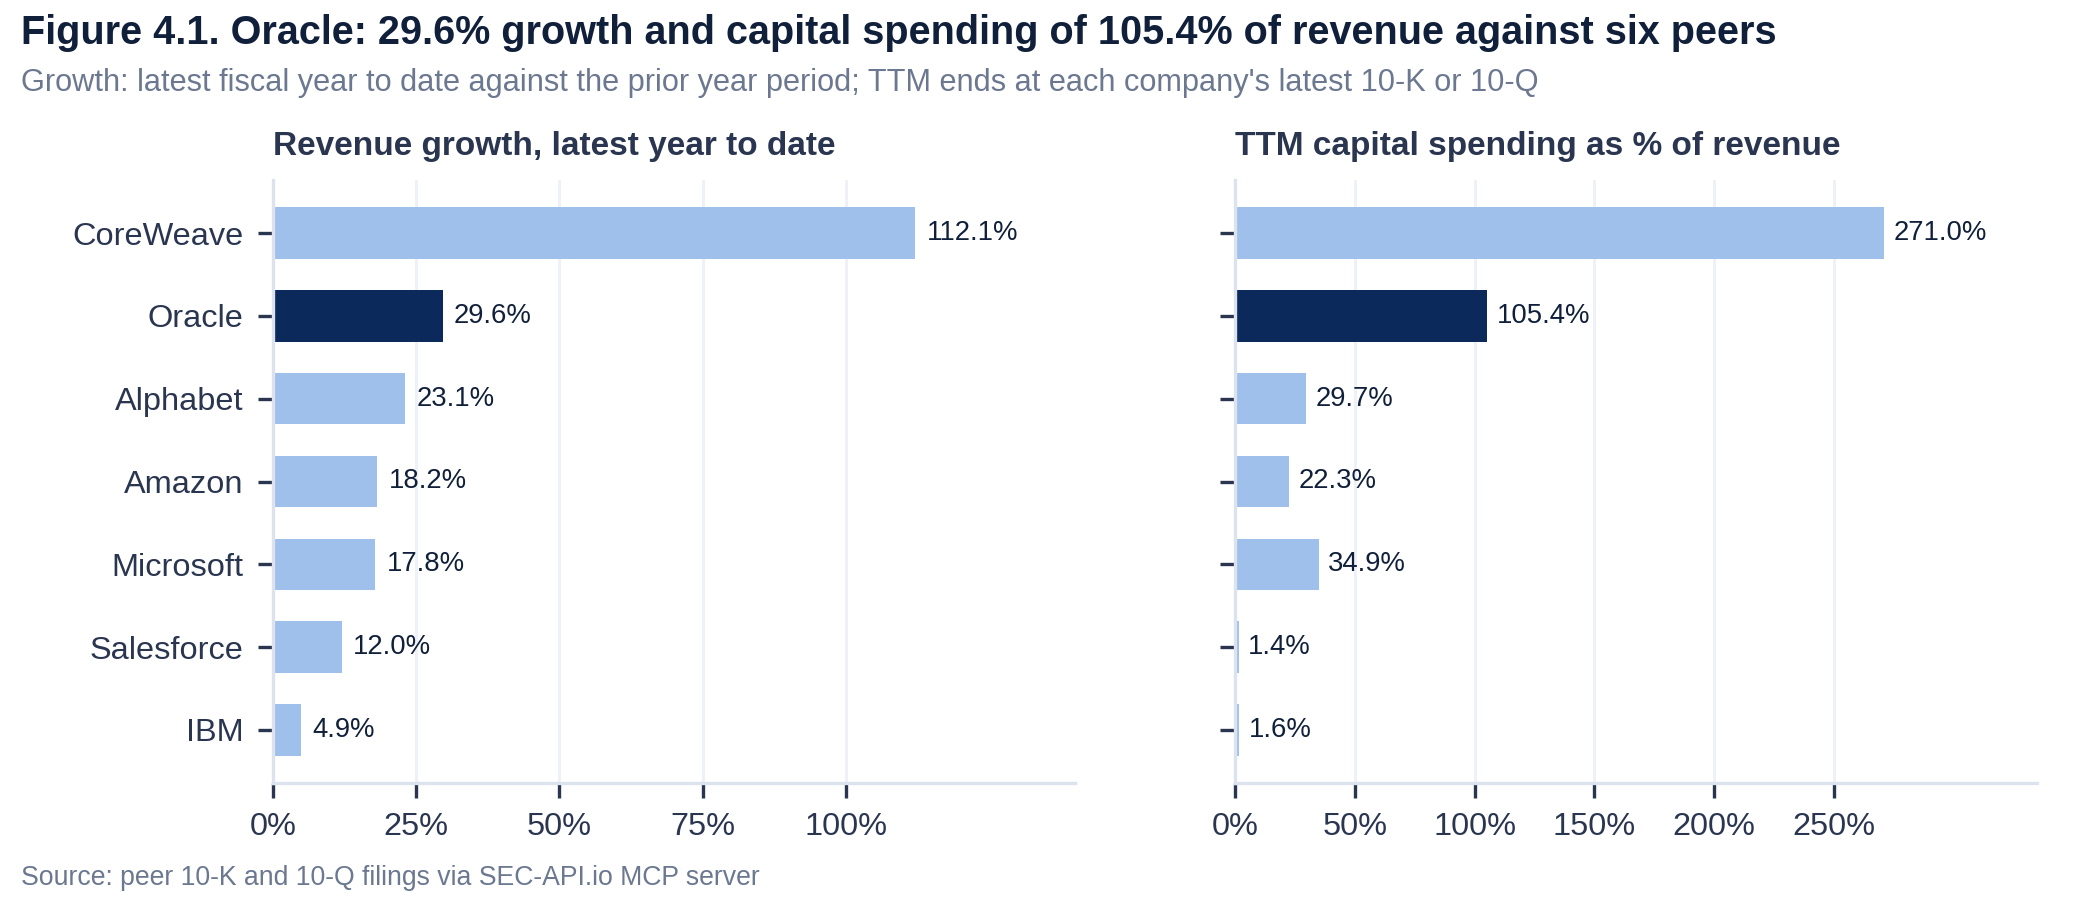
Financial analysis of Oracle: Q1 FY2027 cloud backlog, capital spending and scenarios to FY2030
Oracle's Q1 FY2027 revenue rose 30% to $19.35bn, with cloud infrastructure up 121% and contracted backlog of $664bn, while free cash flow was negative. At $142.48 the stock trades at 17.6x FY2027 non GAAP EPS guidance, and scenarios built on the filings give end FY2030 values of $58, $207 and $409 per share.
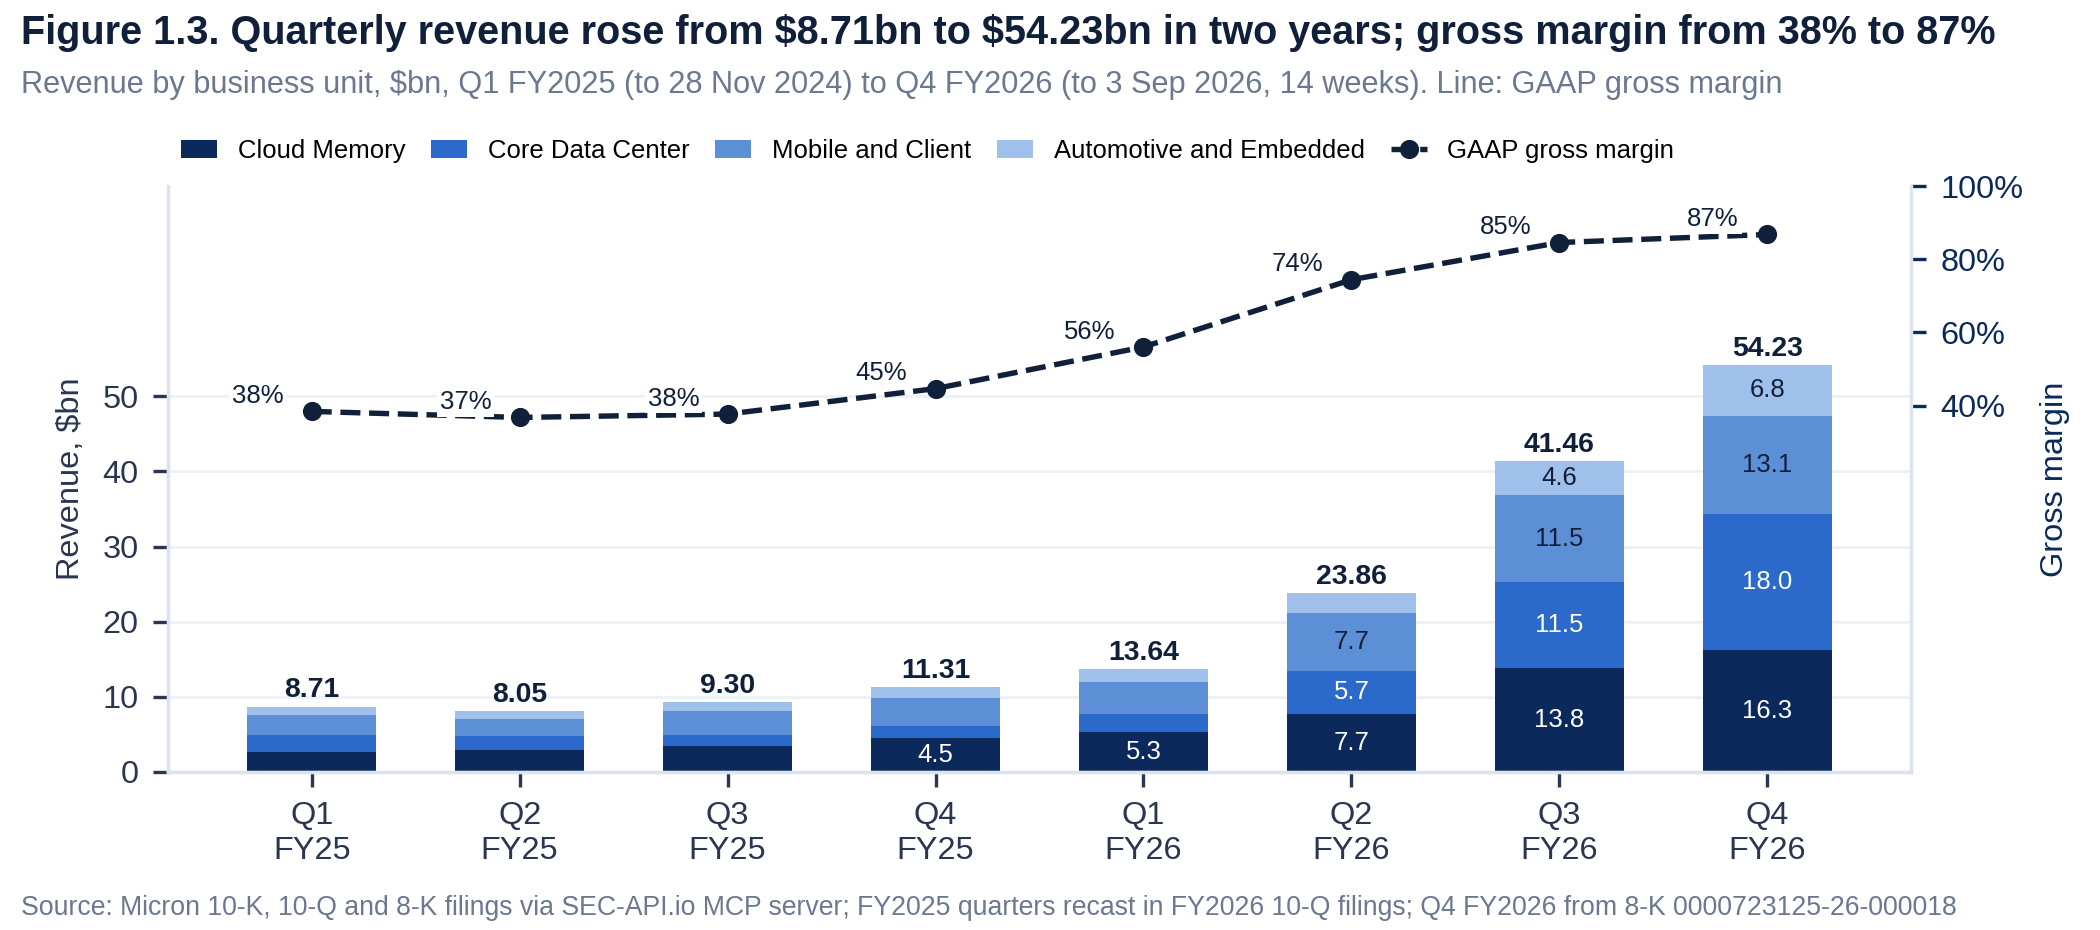
Financial analysis of Micron: Q4 FY2026 memory revenue, pricing and scenarios to FY2029
Micron's Q4 FY2026 revenue rose 379% to $54.23bn with a GAAP gross margin of 86.8%, and FY2026 revenue reached $133.19bn. At $1,063.96 the stock trades at 14.3x FY2026 GAAP EPS, and scenarios built on the filings give end FY2029 values of $298, $1,043 and $2,494 per share.
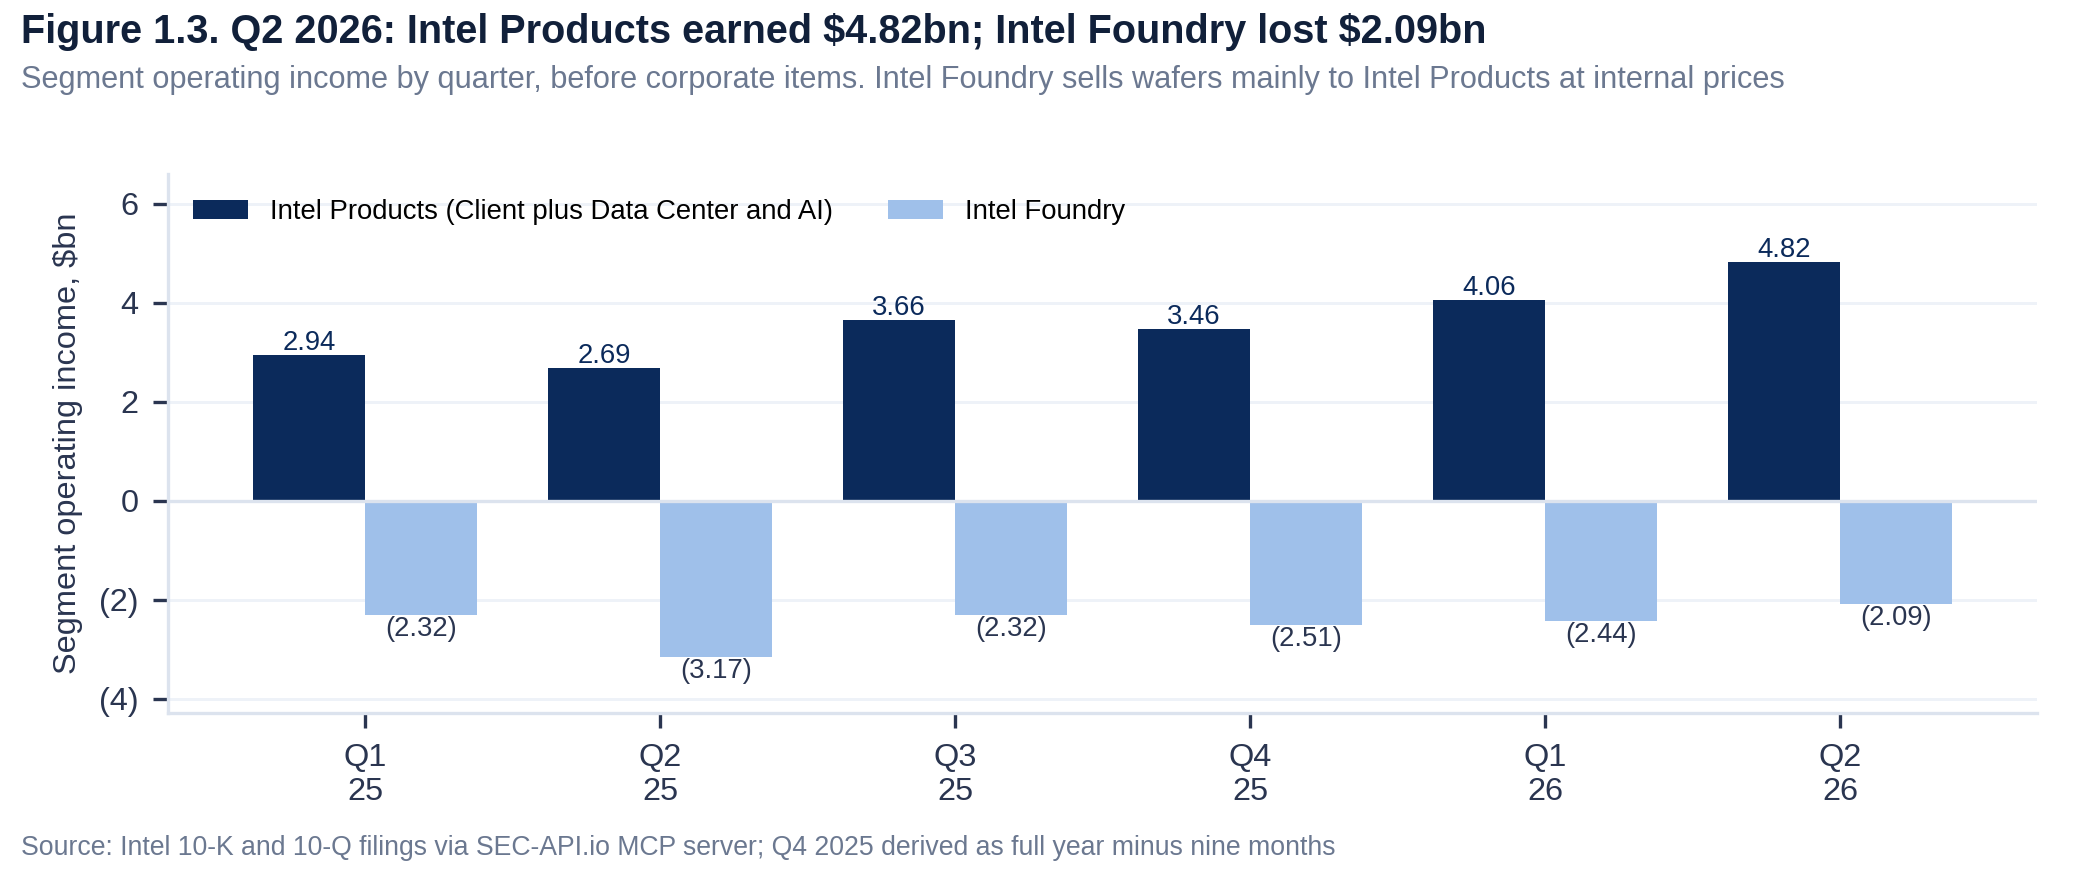
Financial analysis of Intel, Q2 2026 filings and scenarios to 2029
Intel's Q2 2026 revenue rose 25% to $16.13bn, with Data Center and AI up 59%, while Intel Foundry lost $2.09bn. At $120.23 the stock trades at 110x TTM non GAAP EPS, and scenarios built on the filings give end FY2029 values of $4, $68 and $164 per share.
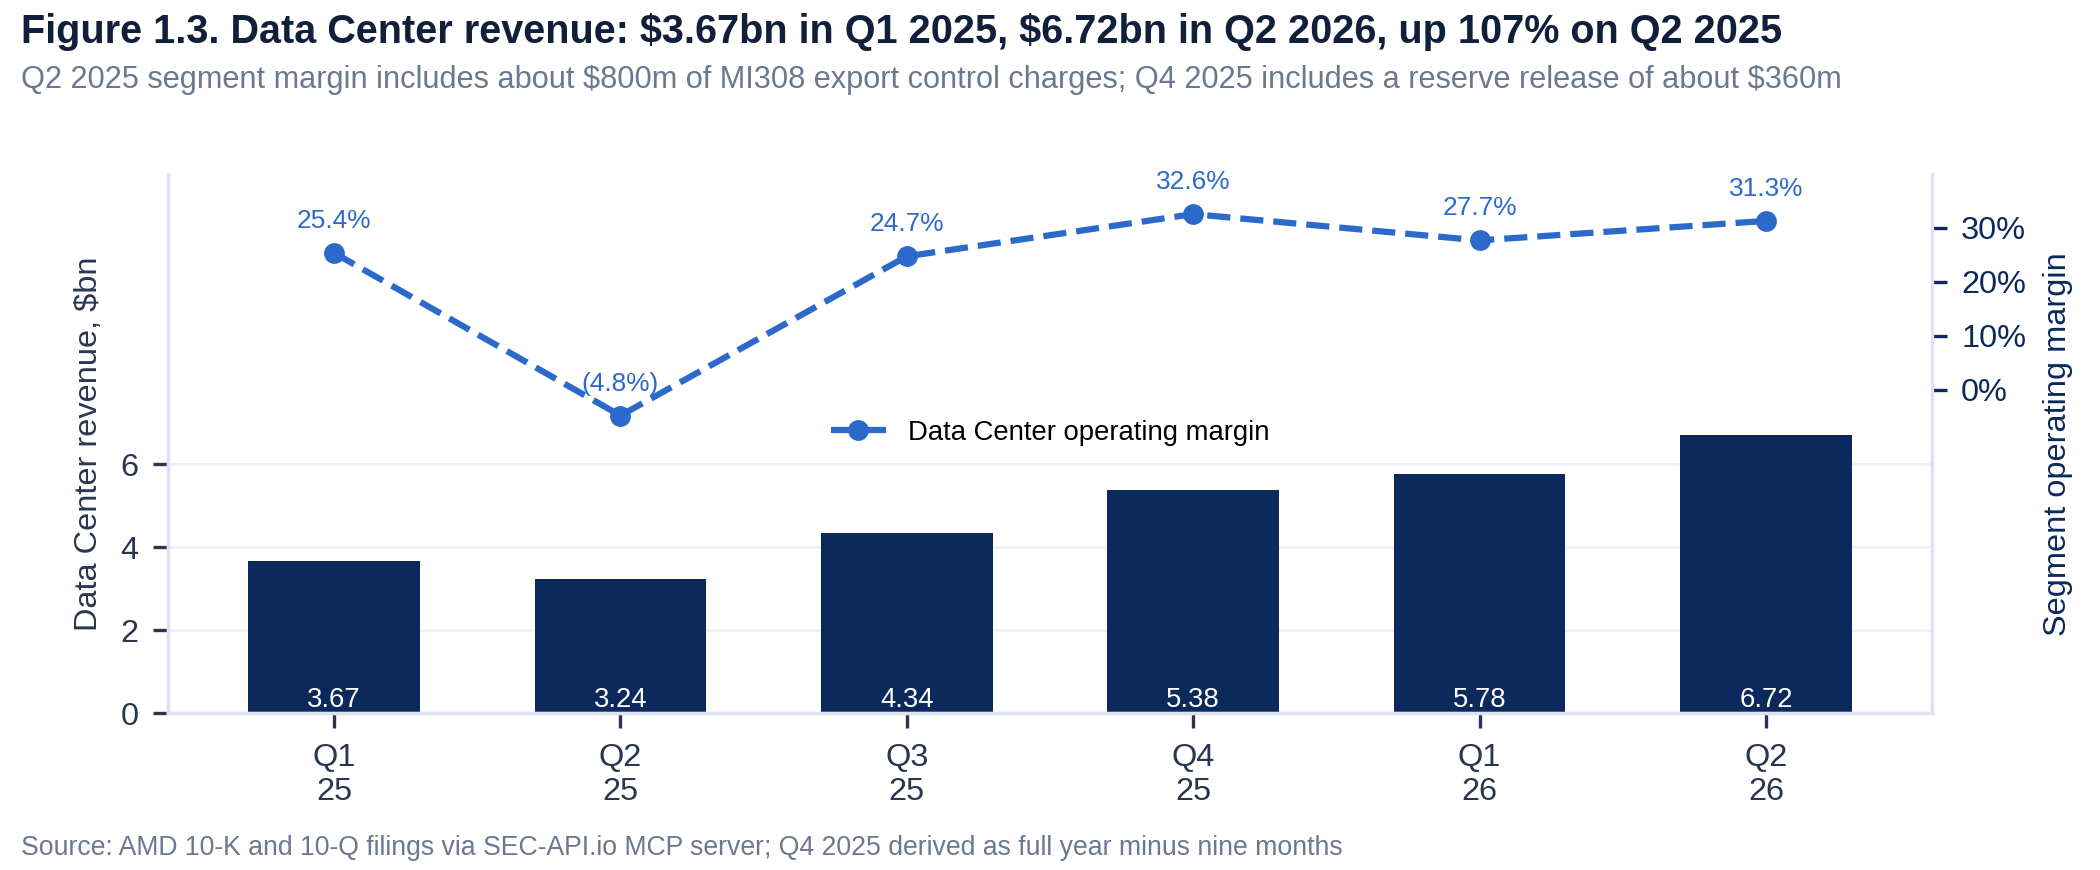
Financial analysis of AMD, Q2 2026 filings and scenarios to 2029
AMD's Q2 2026 revenue rose 50% to $11.54bn, with Data Center revenue up 107% to $6.72bn and Q3 guidance of $13.0bn. At $611.76 the stock trades at 106x TTM non GAAP EPS, and scenarios built on the filings give end FY2029 values of $88, 381 and 709 per share.
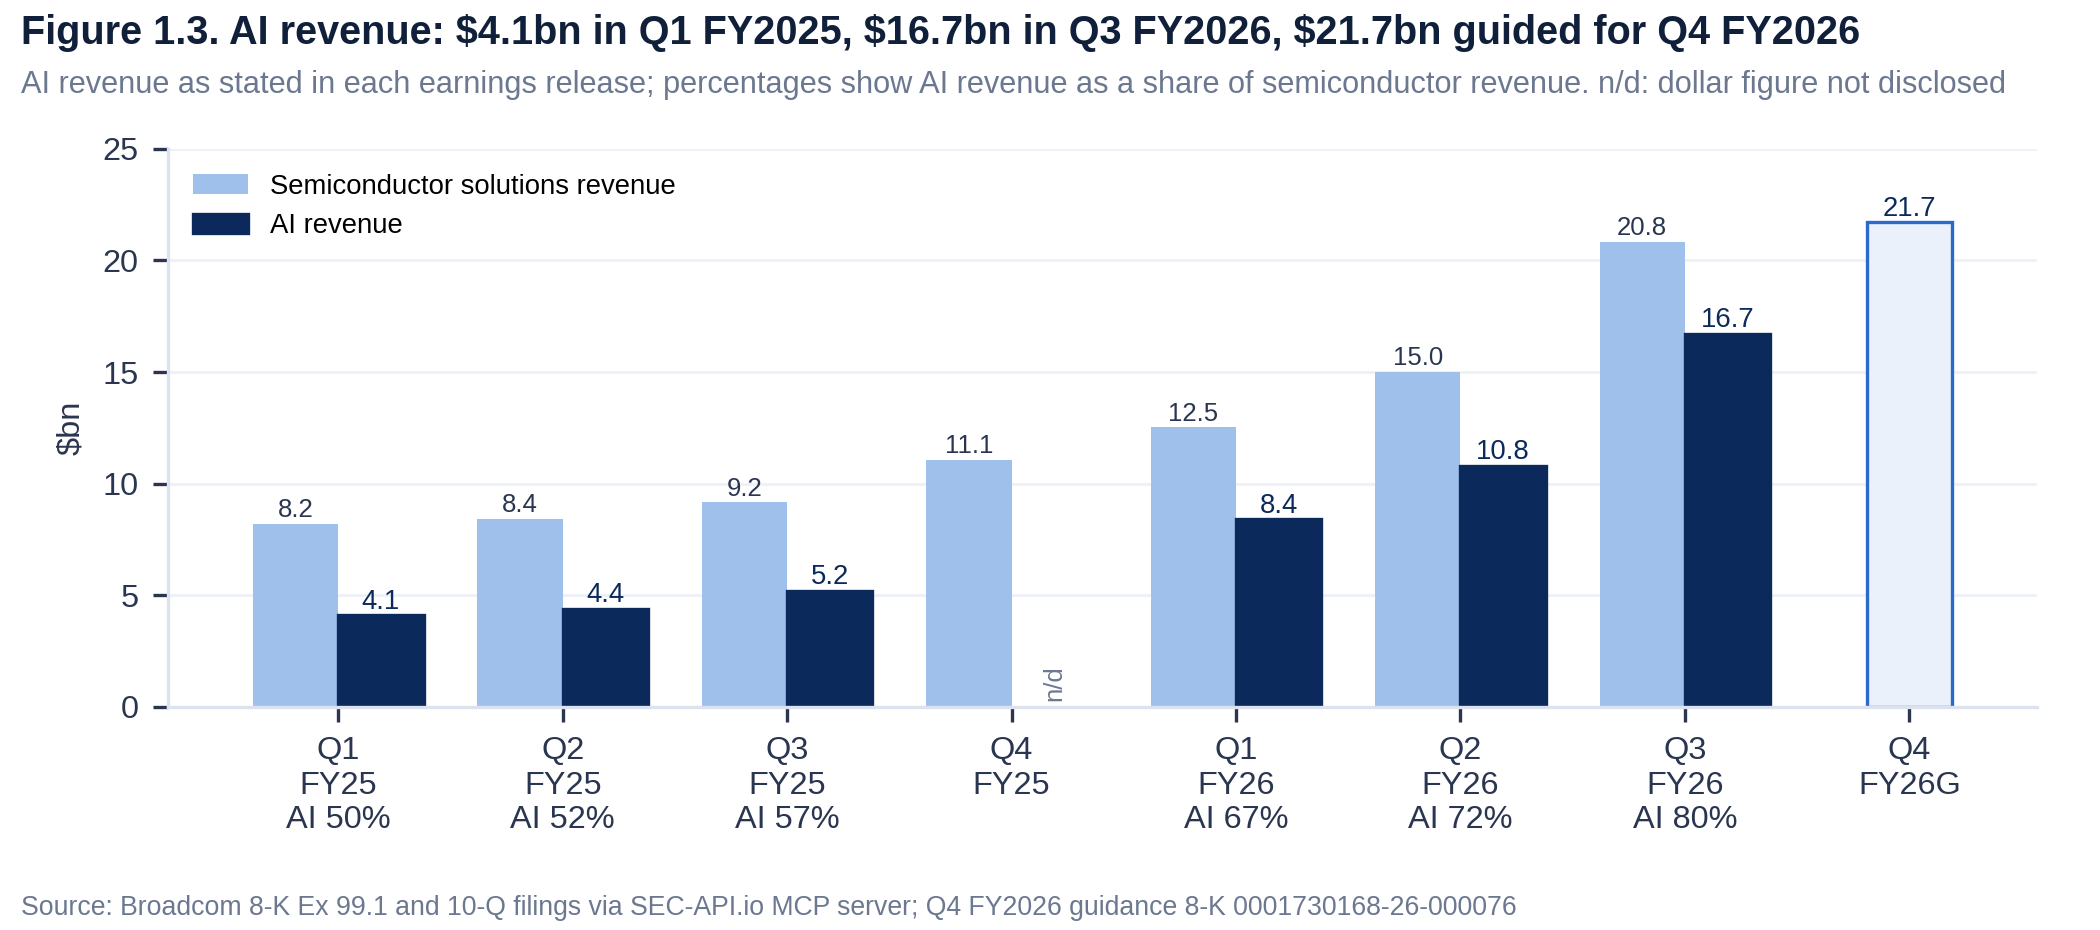
Financial analysis of Broadcom, Q3 FY2026 filings and scenarios to FY2029
Broadcom's Q3 FY2026 revenue rose 86% to $29.59bn, with AI revenue of $16.7bn and Q4 guidance of $34.8bn. At $351.19 the stock trades at 30x FY2026 non GAAP EPS, and scenarios built on the filings give end FY2029 values of $118, 447 and 841 per share.
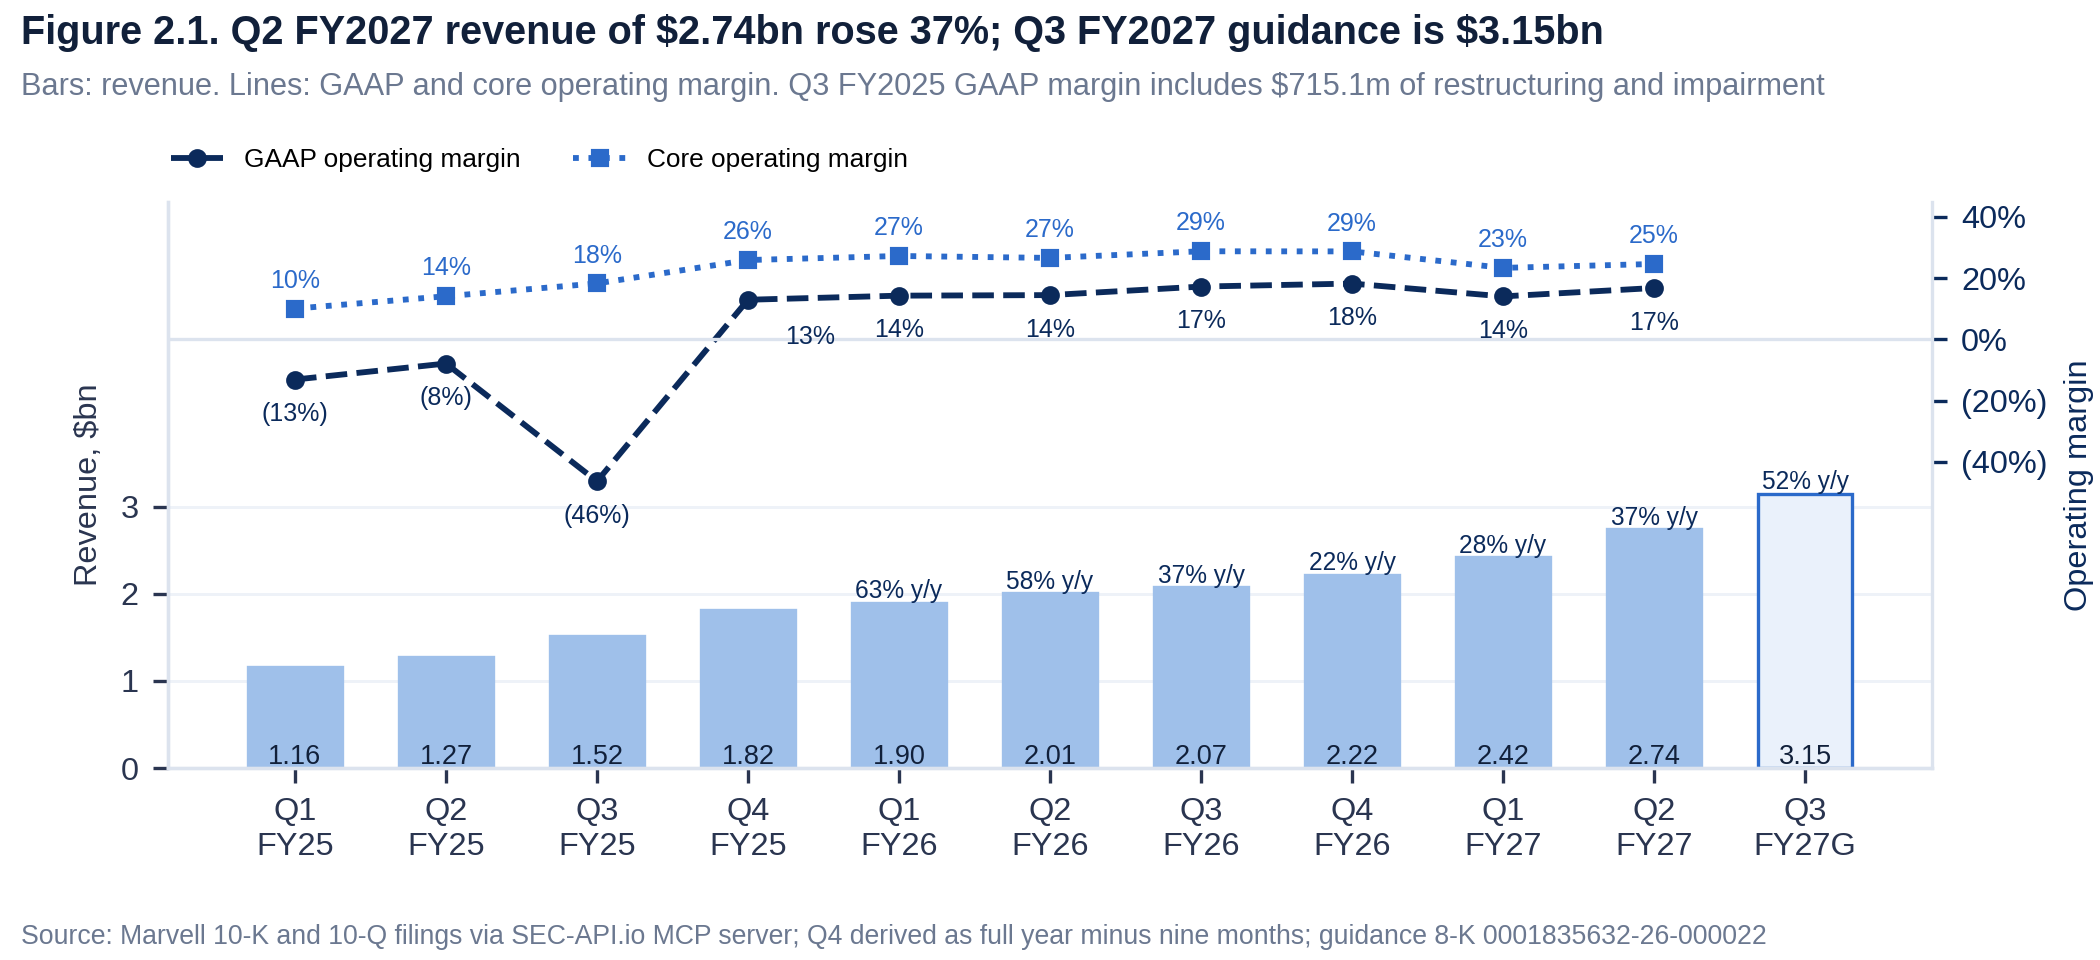
Financial analysis of Marvell Technology, Q2 FY2027 filings and scenarios to FY2030
Marvell's Q2 FY2027 revenue rose 37% to $2.74bn, with data center at 79% of sales and Q3 guidance of $3.15bn. At $264.21 the stock trades at 67x forward non GAAP EPS, and scenarios built on the filings give end FY2030 values of $40, 209 and 435 per share.
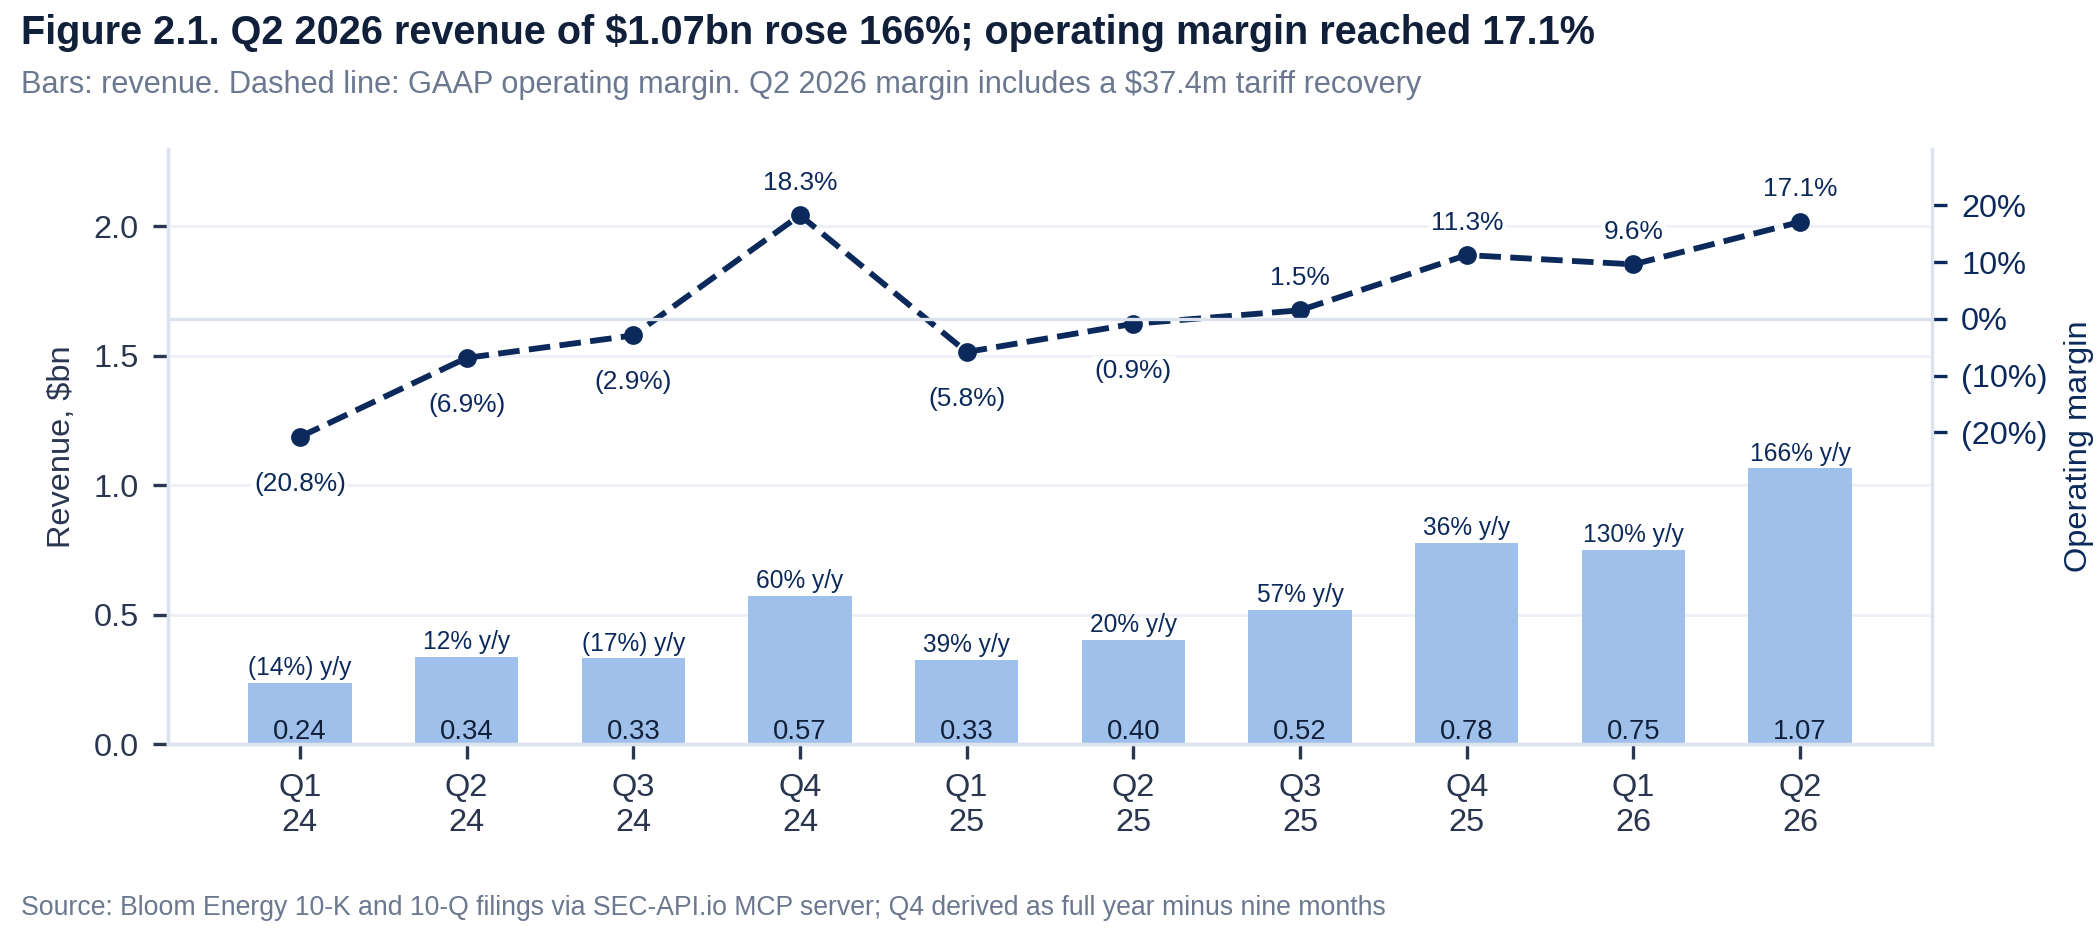
Financial analysis of Bloom Energy, Q2 2026 filings and scenarios to 2029
Bloom Energy's Q2 2026 revenue rose 166% to $1.07bn, and FY2026 guidance of $3.9bn to 4.2bn doubles FY2025 on AI data center demand. At $291.25 the stock trades at 108x the midpoint of 2026 non GAAP EPS guidance, and scenarios built on the filings give end 2029 values of $23, 192 and 527 per share.
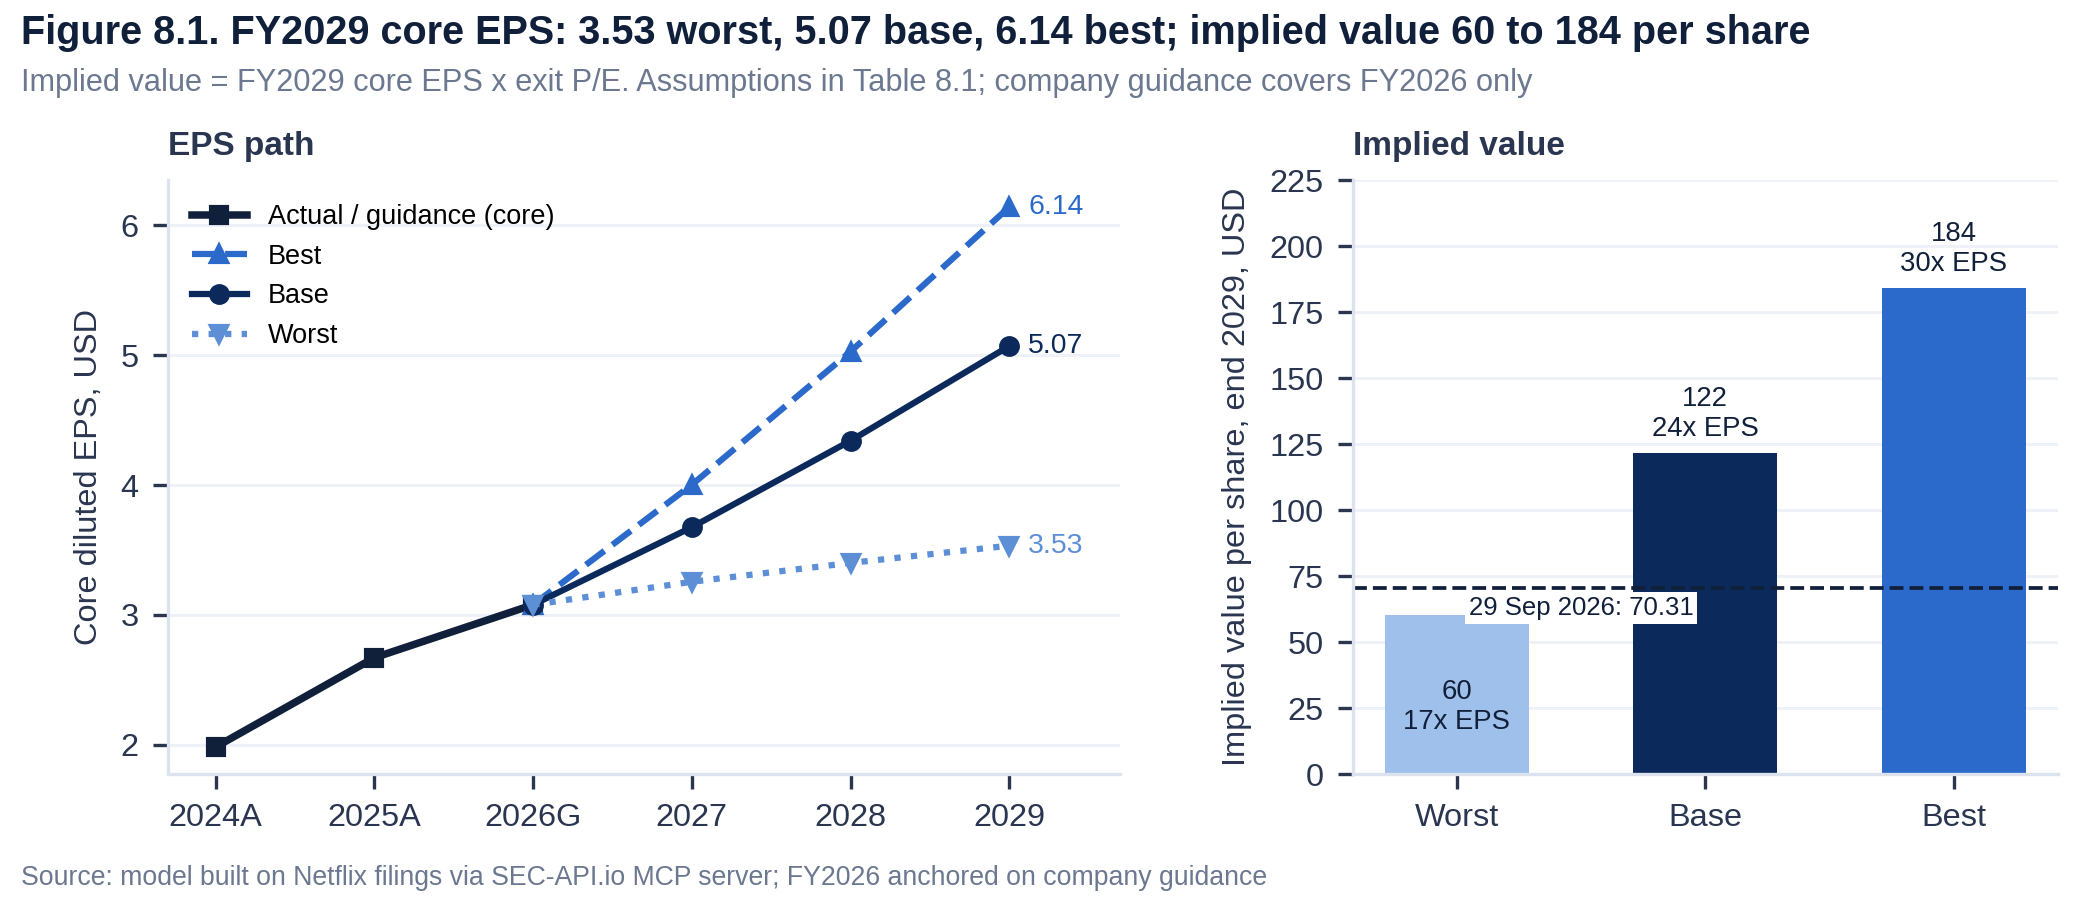
Financial analysis of Netflix, Q2 2026 filings and scenarios to 2029
Netflix guides FY2026 revenue of USD 51.0bn to 51.4bn at a 31.5% operating margin, with Q3 2026 growth guided to 11.7%, the lowest in eleven quarters. At USD 70.31 the stock trades at 22.1x TTM earnings, and scenarios built on the filings give end 2029 values of USD 60, 122 and 184 per share.
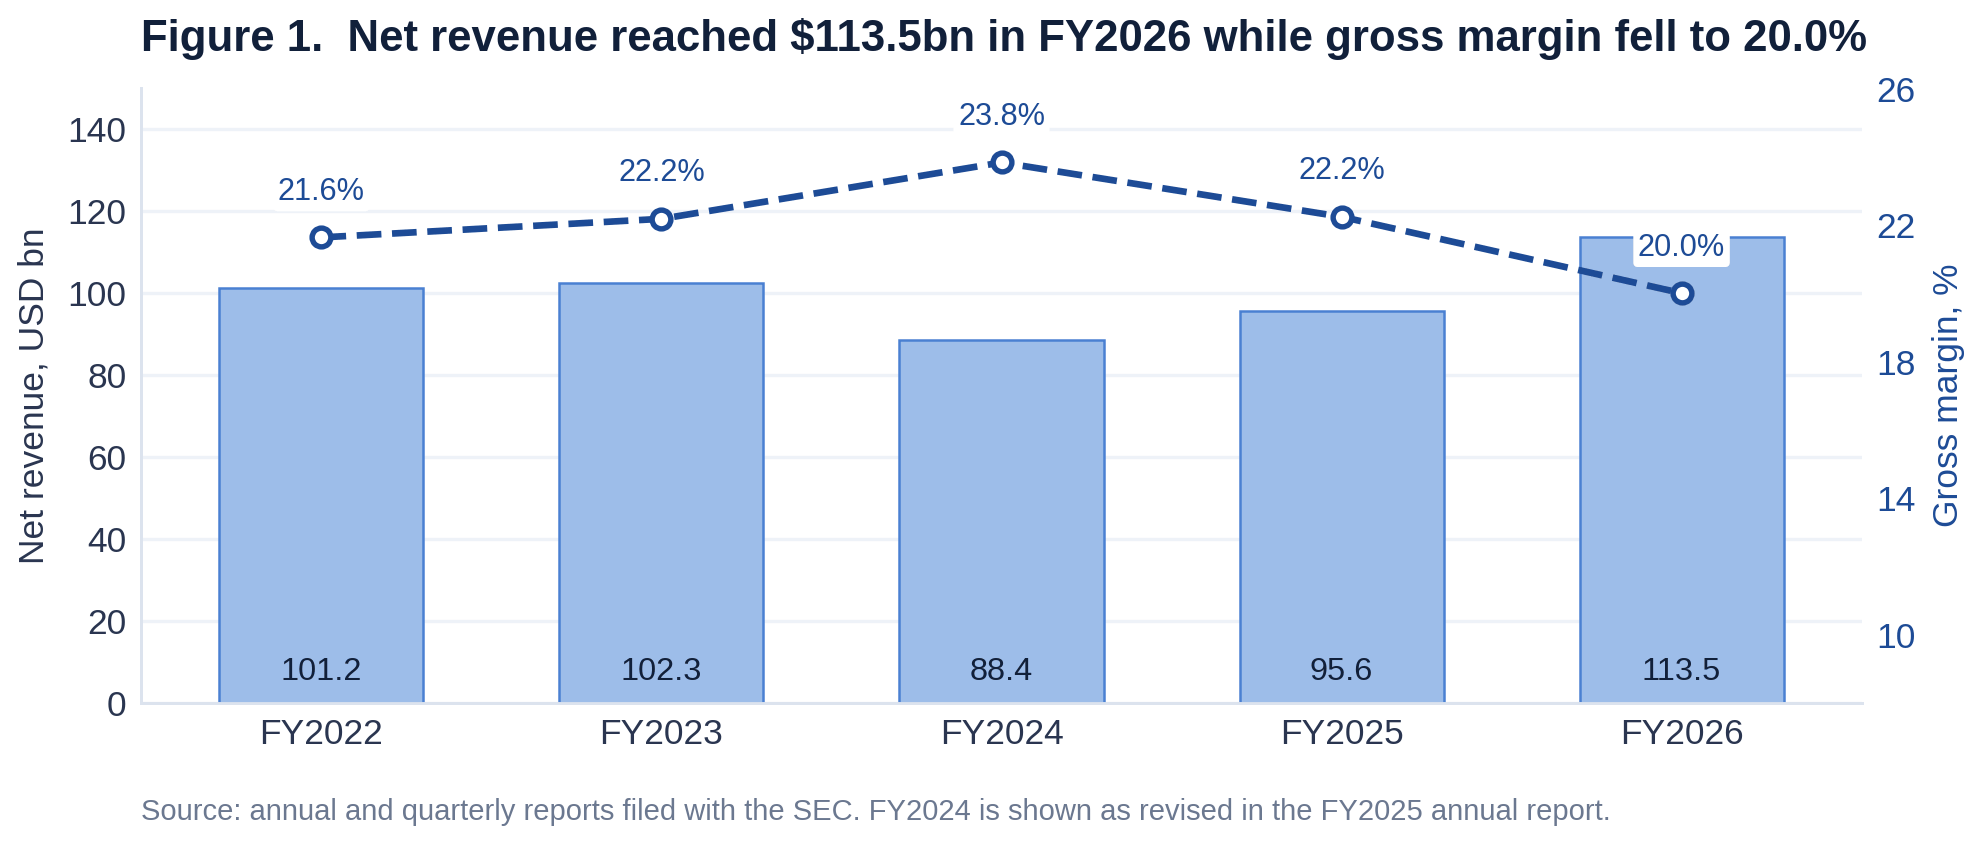
Financial analysis of Dell Technologies, fiscal 2026 and the AI backlog to fiscal 2029
Dell Technologies grew net revenue 18.8% to USD 113.5bn in fiscal 2026 while the gross margin fell 220 basis points to 20.0%, the lowest of the five years covered here, which the annual report attributes to the shift in mix toward AI optimised servers. Operating margin still rose to 7.2% as operating expenses fell to 12.8% of revenue. The AI backlog reached USD 95bn and full year fiscal 2027 revenue guidance has been raised twice to USD 192bn. Three forward cases to fiscal 2029, the fiscal 2024 revision, the annual meeting vote and the ownership record complete the picture.
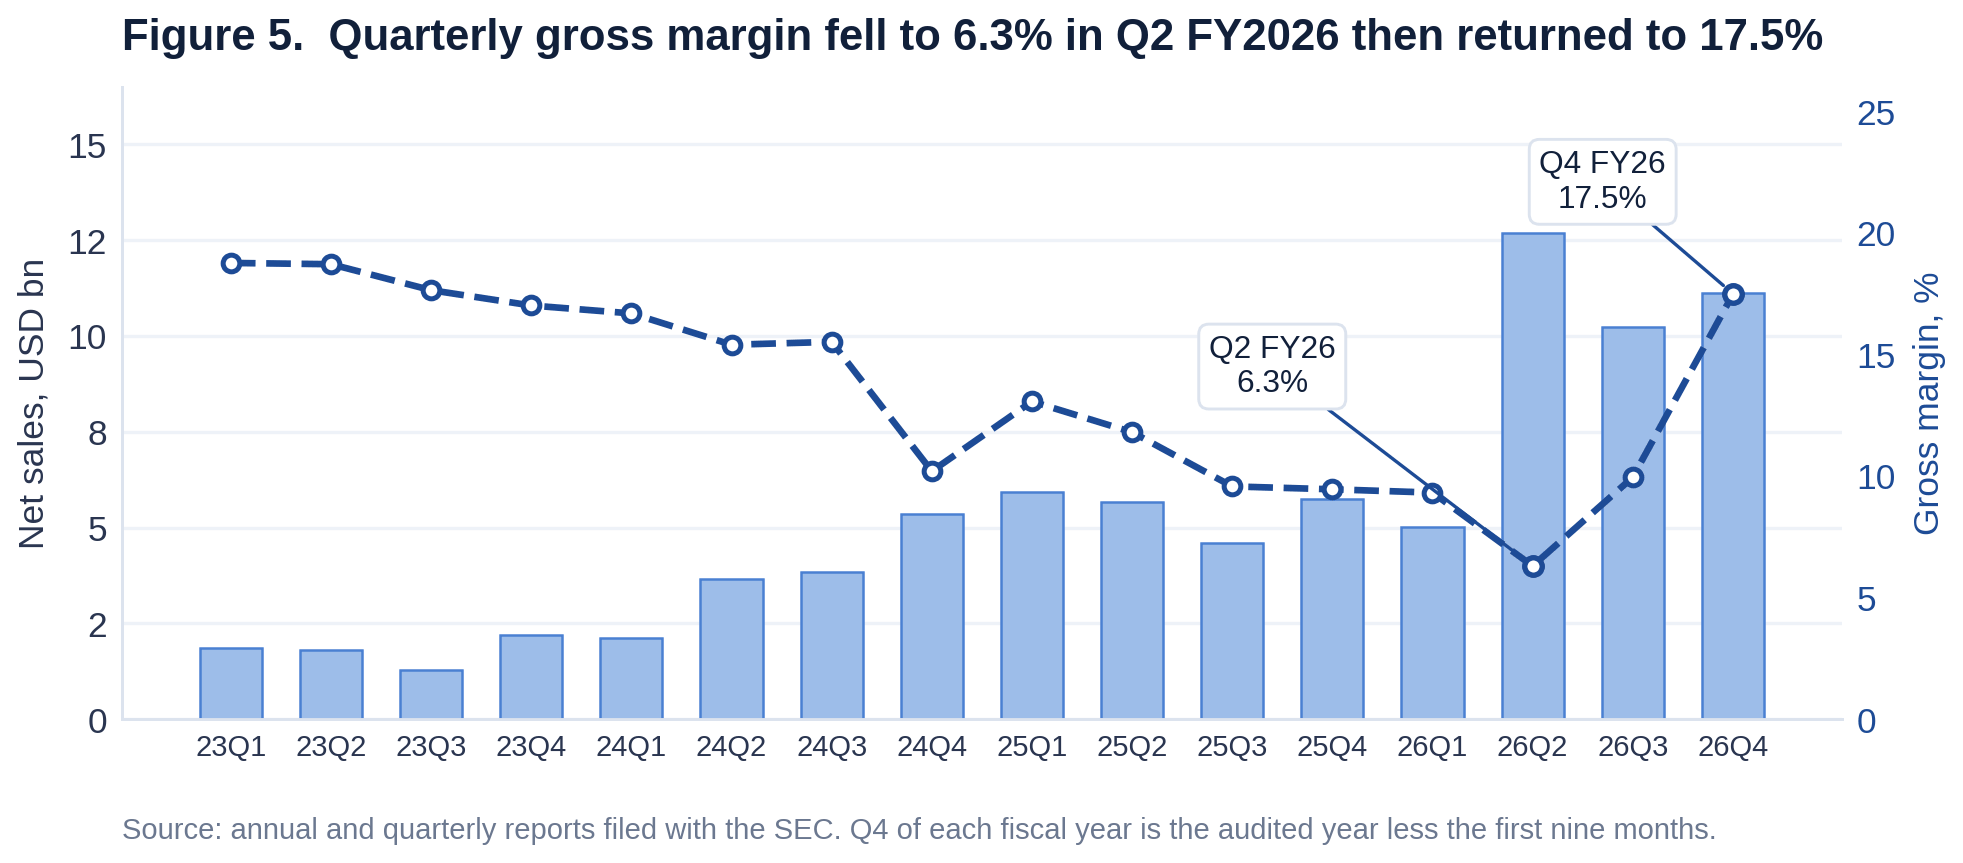
Financial analysis of Super Micro Computer, fiscal 2026
Super Micro Computer earned a 10.8% gross margin on net sales of USD 39.1bn in fiscal 2026, the lowest of the six fiscal years covered here, while operating activities used USD 6,809.9m of cash. The company guides FY2027 net sales to USD 65.0bn to USD 72.0bn, and guides a Q1 gross margin of 10.4% to 10.8% against the 17.5% it reported in Q4 FY2026, a quarter management says benefited from contracts deferred into Q1. Three forward cases to fiscal 2029, the annual meeting vote and the ownership record complete the picture.
C3.ai (AI): Revenue & Business Model Analysis 2026
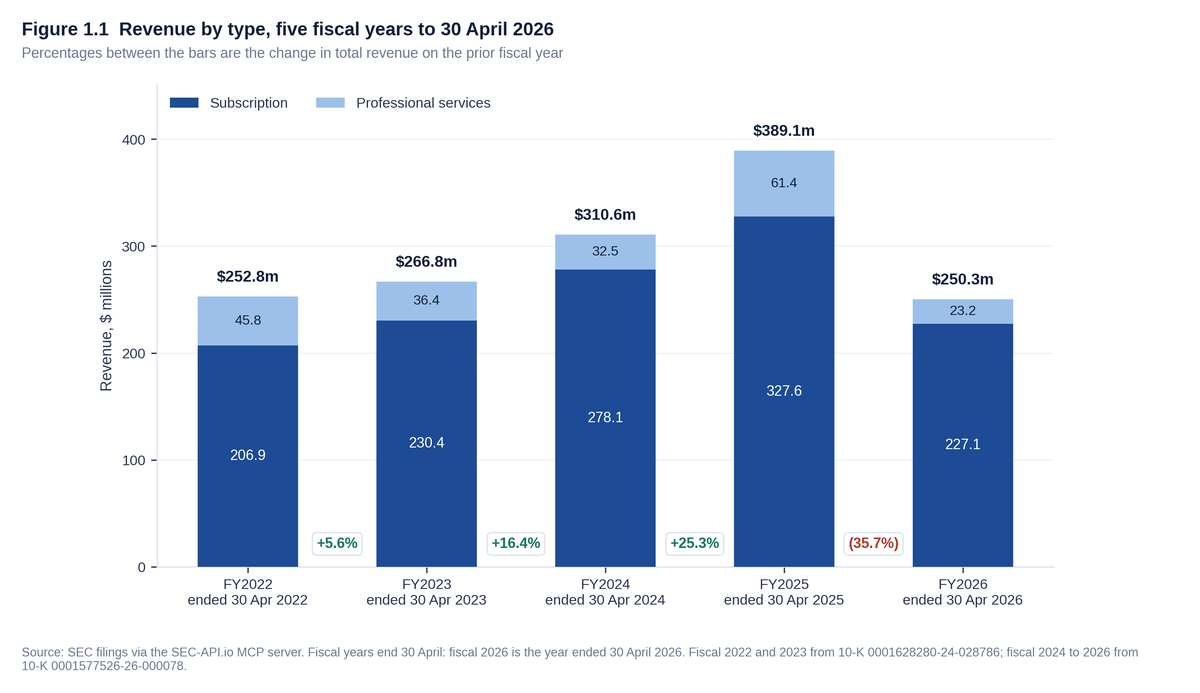
C3.ai, Inc. reported revenue of $250.3m for the fiscal year ended 30 April 2026 against $389.1m for the year ended 30 April 2025, a fall of 35.7%, with gross margin down from 60.6% to 30.9%, the loss from operations widening to $(498.5)m and stock based compensation of $263.7m exceeding revenue. Cash, cash equivalents and marketable securities were $575.4m at 30 April 2026 against $742.7m a year earlier, and revenue for the quarter ended 31 July 2026 was $52.4m against $70.3m, on a Form 8-K with no Form 10-Q behind it at 8 September 2026. Item 1A of the fiscal 2026 Form 10-K carries 63 risk factors against 61, and guidance for the year ending 30 April 2027 is revenue of $210.0m to $240.0m.
Cerebras (CBRS): Voting Structure
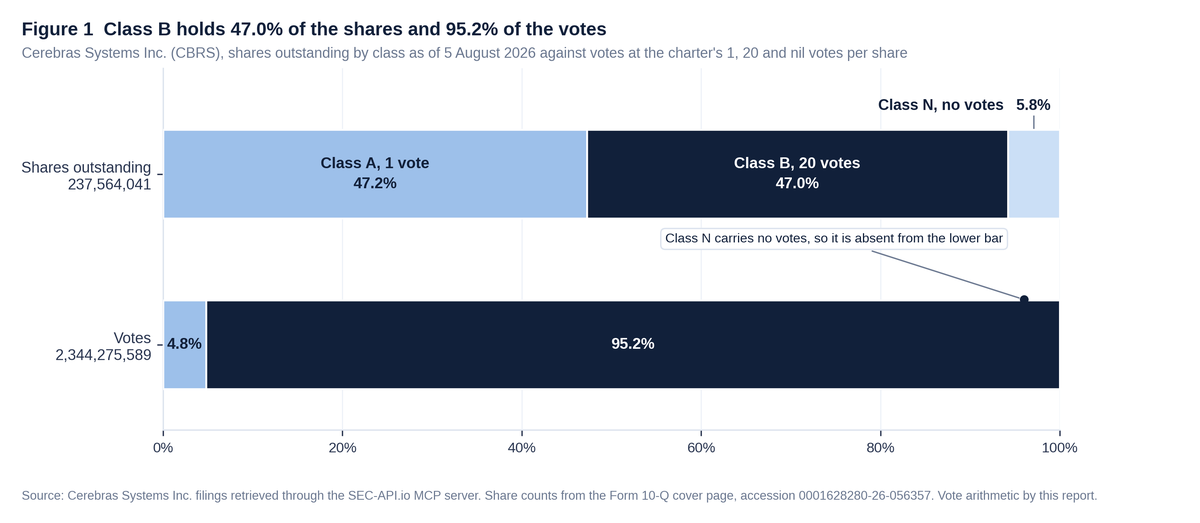
On the cover of its Form 10-Q for the quarter ended 30 June 2026, Cerebras Systems Inc. reports 112,247,109 Class A shares, 111,601,424 Class B shares and 13,715,508 Class N shares outstanding as of 5 August 2026. Class A carries one vote a share, Class B carries twenty and Class N carries none, so Class B holds 46.98% of the shares and 95.21% of the votes. No proxy statement of any kind has been filed and no annual meeting has been held, so the reportable record is the charter, which sets no time based and no ownership based sunset on Class B, the cover page share counts and the fifteen Schedules 13D and 13G that holders file for themselves.
Cerebras (CBRS): First Public Quarters
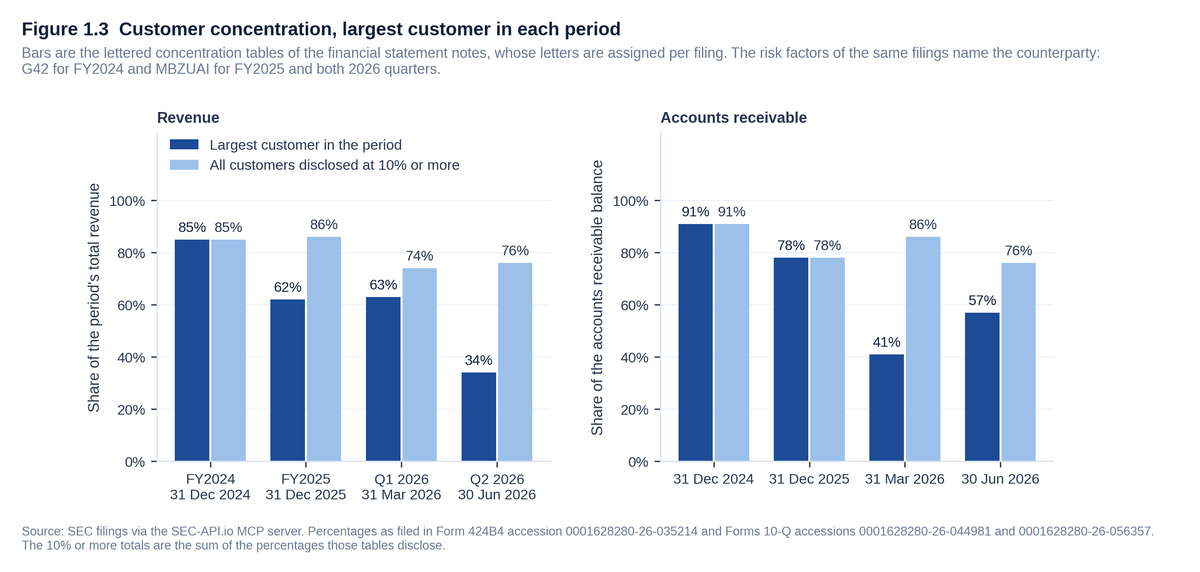
Cerebras Systems Inc. reported revenue of $180.1 million for the quarter ended 30 June 2026, 74.3% above the same quarter of 2025, and an operating loss of $(477.2) million carrying $377.0 million of share based compensation. No Form 10-K has been filed, so the audited record stops at 31 December 2025 inside the IPO prospectus, at revenue of $510.0 million for FY2025 and $290.3 million for FY2024. The risk factors put Mohamed bin Zayed University of Artificial Intelligence at 34% of revenue in the June 2026 quarter against 70% a year earlier, and Class B carries twenty votes a share and holds 95.2% of the votes on 47.0% of the shares.
CoreWeave (CRWV): Ownership and Votes
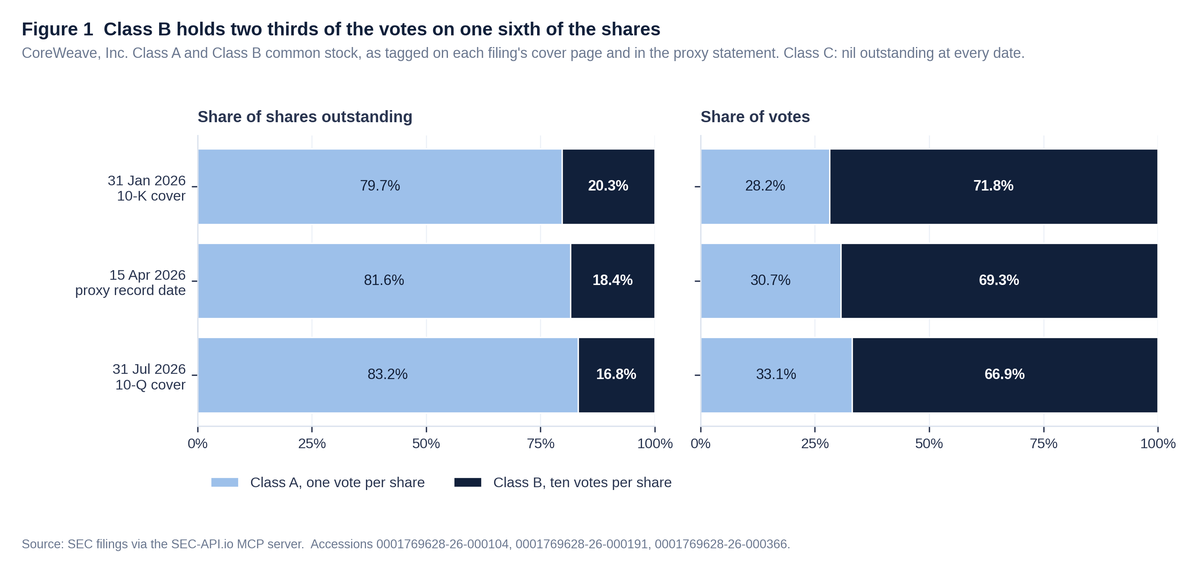
CoreWeave, Inc. reported 458,871,690 Class A shares and 92,664,912 Class B shares outstanding as of 31 July 2026. Class A carries one vote per share and Class B ten, so Class B was 16.8% of the shares and 66.9% of the votes. The proxy statement of 22 April 2026 puts the twelve executive officers and directors at 5.38% of Class A, all of the Class B and 72.32% of total voting power, with Michael Intrator alone at 38.70%. Thirty three filings in the Schedule 13G family name the company as subject and no Schedule 13D has ever been filed against it.
CoreWeave (CRWV): Insider Filings 2026
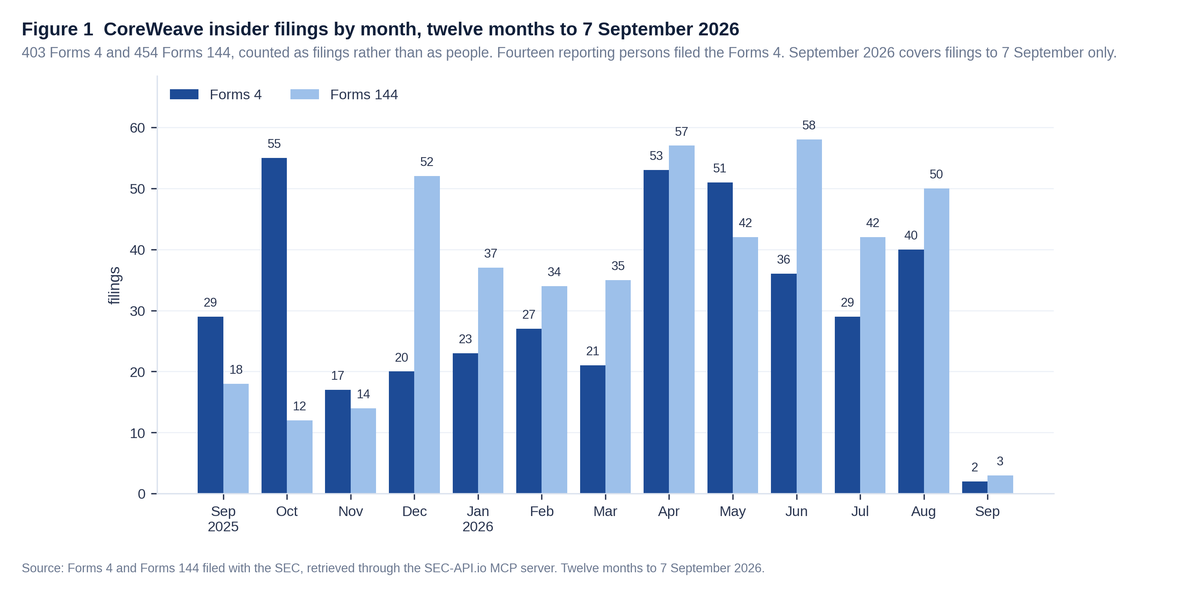
People and entities subject to Section 16 filed 403 Forms 4, two Forms 4/A and three Forms 3 naming CoreWeave, Inc. as issuer in the twelve months to 7 September 2026, alongside 454 Forms 144. Table I of those Forms 4 records 4,545 lines under code S, an open market or private sale, over 77,752,779 shares, and no line at all under code P. The Rule 10b5-1 checkbox is ticked on 192 of the 403 filings. Magnetar Financial LLC accounts for 119 of them and 45,028,526 of the shares disposed.
CoreWeave (CRWV): 2026 Revenue Analysis, Top Customer Concentration & Exposure
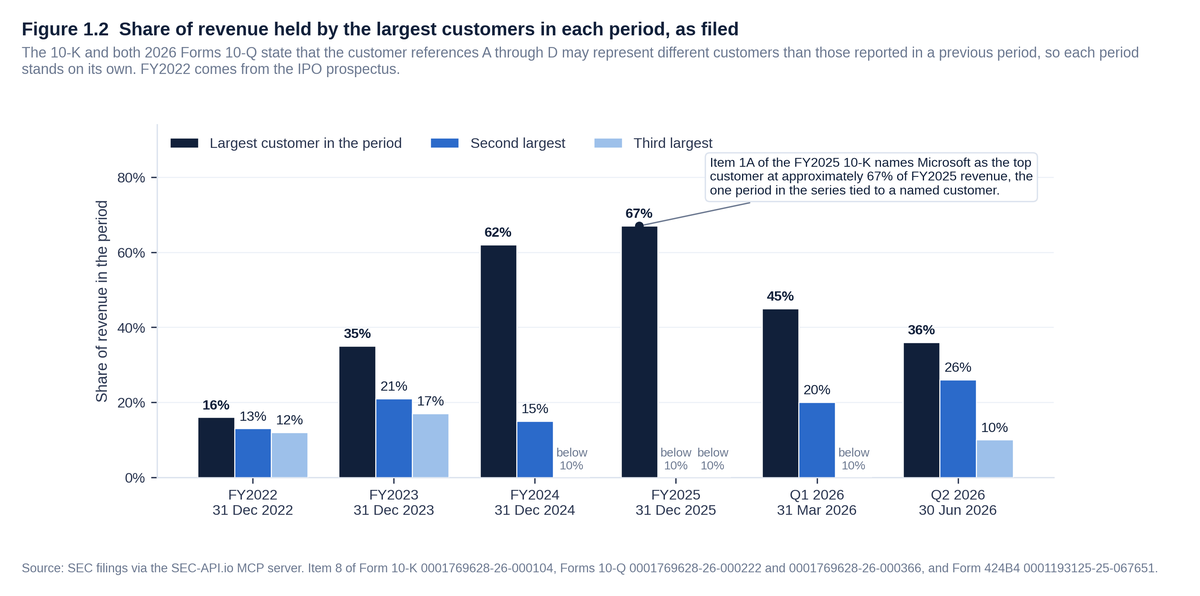
CoreWeave, Inc. disclosed in Item 8 of its Form 10-K for the year ended 31 December 2025 that its largest customer took 67% of FY2025 revenue, against 62% in FY2024 and 35% in FY2023, and its Forms 10-Q put the top rank at 45% in the quarter ended 31 March 2026 and 36% in the quarter ended 30 June 2026. Item 1A of the same 10-K names Microsoft as that top customer for FY2025. Remaining performance obligations were $103.7 billion at 30 June 2026 against $60.7 billion at 31 December 2025, debt on the balance sheet was $35.1 billion, and the June quarter carried an operating loss of $(49) million on revenue of $2.6 billion.
lululemon (LULU) Q2 FY2026: earnings, tariffs, proxy
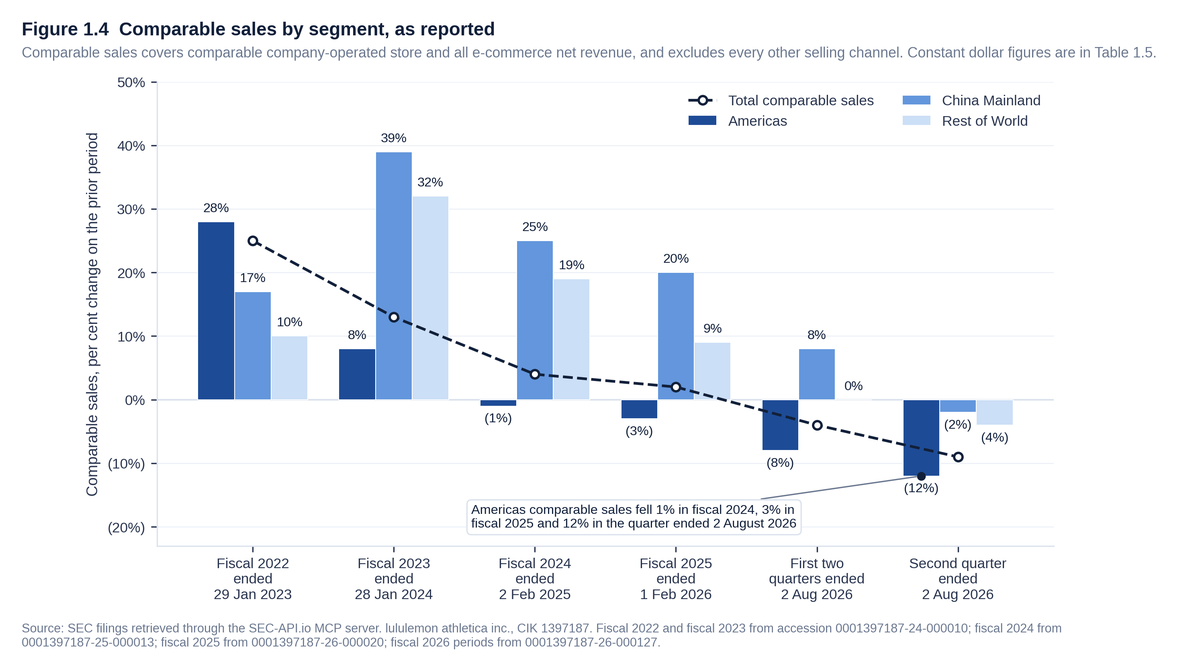
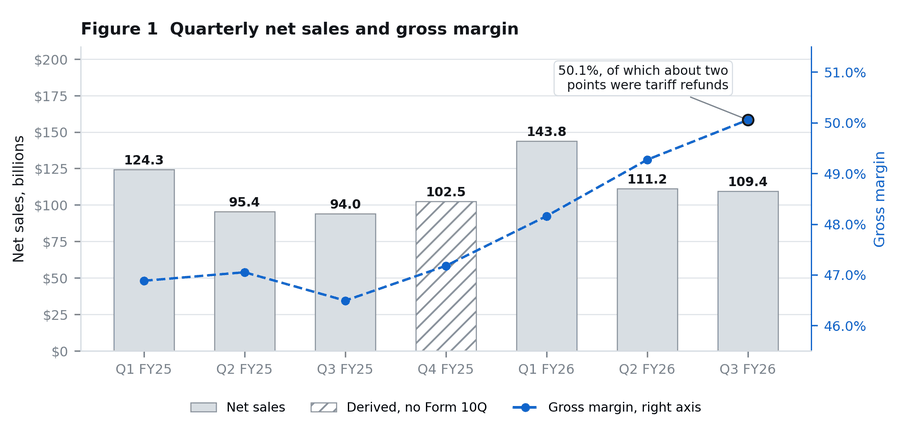
lululemon athletica inc. reported net revenue of $2,415.6 million for the quarter ended 2 August 2026, below the $2.450 billion to $2.475 billion guided on 4 June 2026, with comparable sales down 9% and gross margin at 60.5% including 560 basis points from $134.5 million of refunds of tariffs paid under the International Emergency Economic Powers Act. For fiscal 2025, the year ended 1 February 2026, net revenue was $11,102.6 million, 4.9% above the prior year, and gross margin fell 260 basis points to 56.6%. Shares outstanding on the cover pages fell from 110,482,671 as of 11 March 2026 to 105,594,064 as of 28 August 2026, and the 2026 annual meeting was a contested solicitation.
Financial analysis of Palantir Technologies, the quarter to 30 June 2026 against the FY2025 record
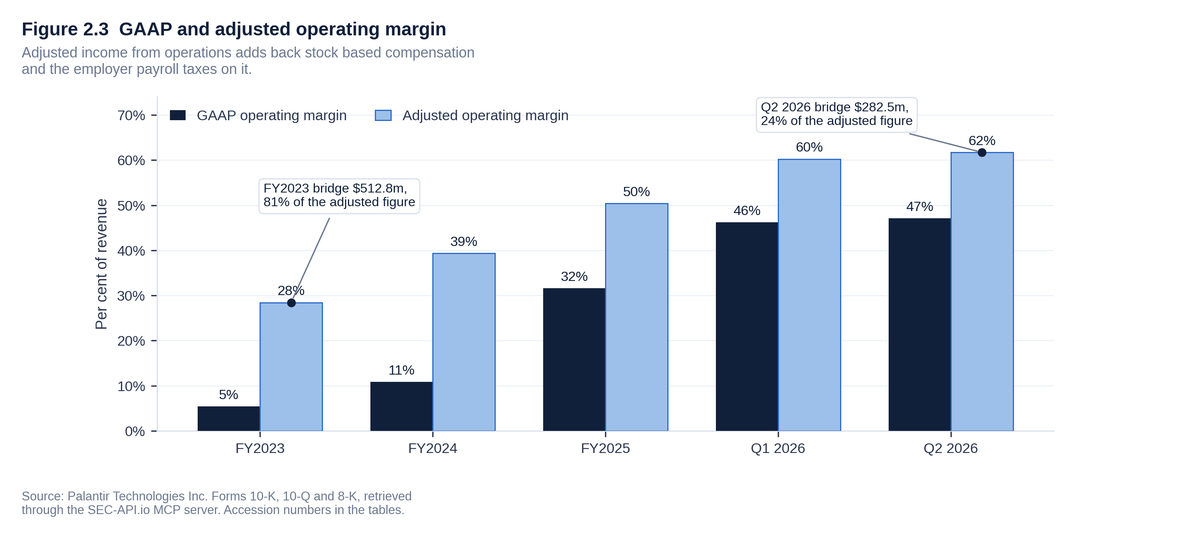
Palantir reported revenue of $1,935.5 million for the quarter to 30 June 2026, 93% above the same quarter of 2025, and income from operations of $912.0 million at a 47.1% operating margin against 26.8%. Stock based compensation was $265.2 million, 13.7% of revenue, and management's adjusted income from operations of $1,194.5 million is that charge plus $17.3 million of employer payroll taxes added to the GAAP figure, a bridge of $282.5 million. At the 6 April 2026 record date the 1,005,000 Class F shares were 0.04% of the shares outstanding and carried 27.7% of the voting power on the election of directors.
Financial analysis of Meta Platforms, the quarter to 30 June 2026 against the FY2025 record
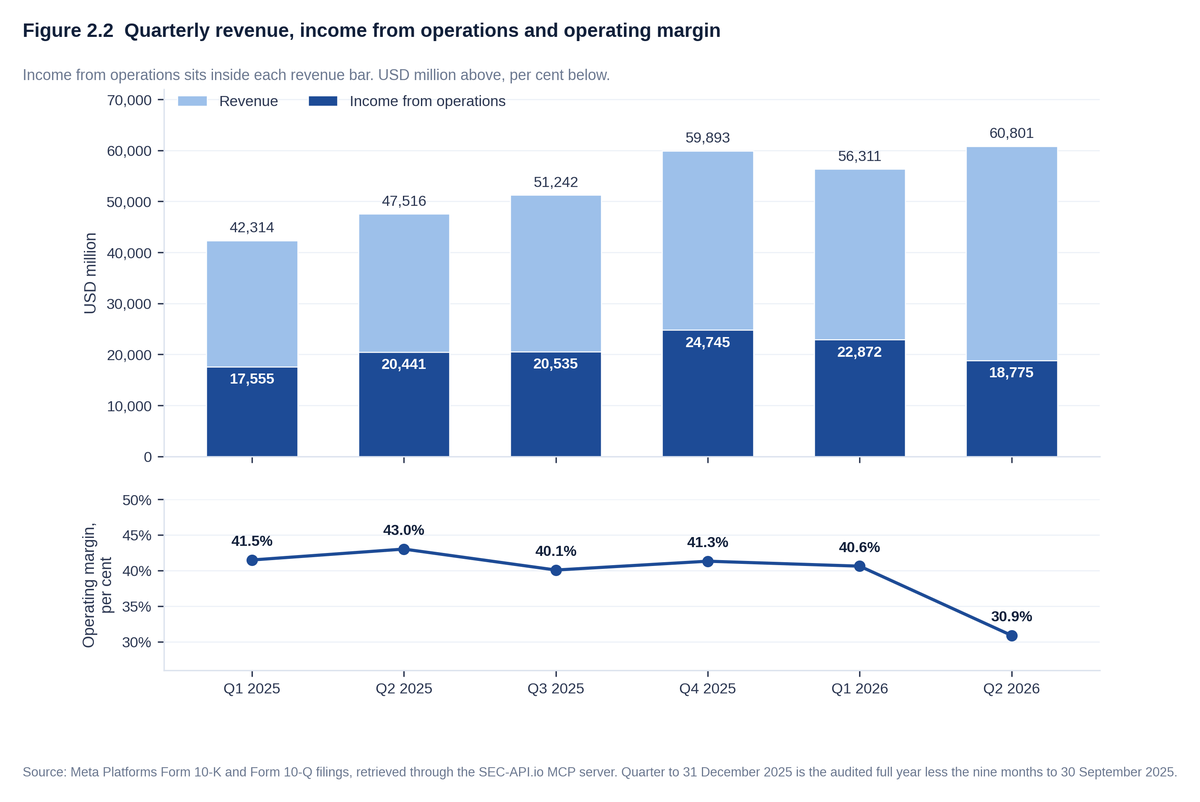
Meta Platforms reported revenue of $60.80 billion for the quarter to 30 June 2026, 28% above the same quarter of 2025, and income from operations of $18.78 billion, 8% lower, at an operating margin of 30.9% against 43.0%. Costs and expenses rose 55%, with research and development up 67% to $21.66 billion and $2.40 billion of charges related to legal proceedings inside a general and administrative line that rose 111%. Advertising sold on the Family of Apps was 97.6% of the quarter's revenue and Reality Labs earned $431 million against an operating loss of $4.62 billion. Capital expenditure was $50.92 billion in the six months against a 2026 outlook of $130 billion to $145 billion raised twice since January, lease obligations signed and not yet commenced reached $278.99 billion and noncancelable contractual commitments $349.31 billion. Net cash was $6.60 billion at 30 June 2026 against $48.99 billion at the end of 2024. At the 1 April 2026 record date Mark Zuckerberg held 13.5% of the shares and 60.8% of the combined vote, and all ten shareholder proposals were defeated at the annual meeting of 27 May 2026.
Financial analysis of SpaceX, the three audited years and the first quarter as a public company
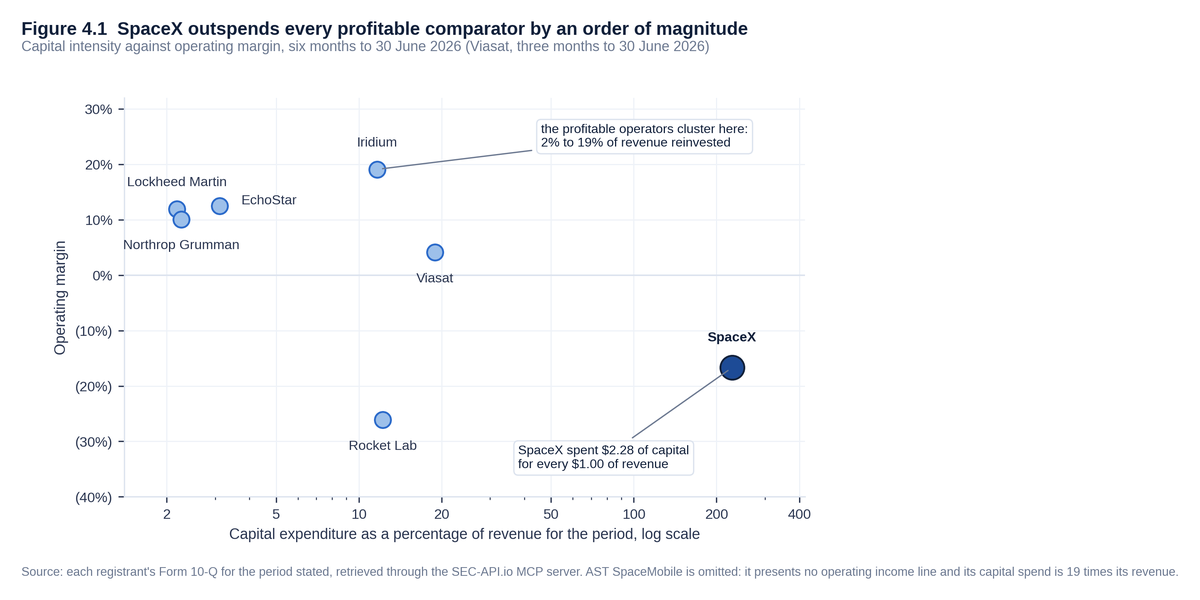
In the quarter to 30 June 2026 the Connectivity segment, which sells Starlink satellite broadband, produced 54.9% of SpaceX's revenue, the AI segment 32.8% and the Space segment, which launches rockets and builds spacecraft, 12.3%. Launching rockets and building spacecraft produced 21.9% of the $18,674m of revenue reported for 2025. The Connectivity segment earned a 37.7% operating margin in the first half of 2026, higher than any listed satellite operator in the comparator set, while the Space and AI segments lost $4,930m between them and 82.7% of $28,476m of half year capital expenditure went to the AI segment. Elon Musk holds about 46% of the economics and about 85% of the vote through a 10:1 dual class structure with no sunset. At the 3 September 2026 close of $149.74 the market pays 76.5 times annualised revenue, an order of magnitude above every profitable operator in the comparator set, and the terminal multiple moves the implied value per share nearly twice as far as the largest operating driver.
Financial analysis of Tesla, FY2025 and the first half of 2026
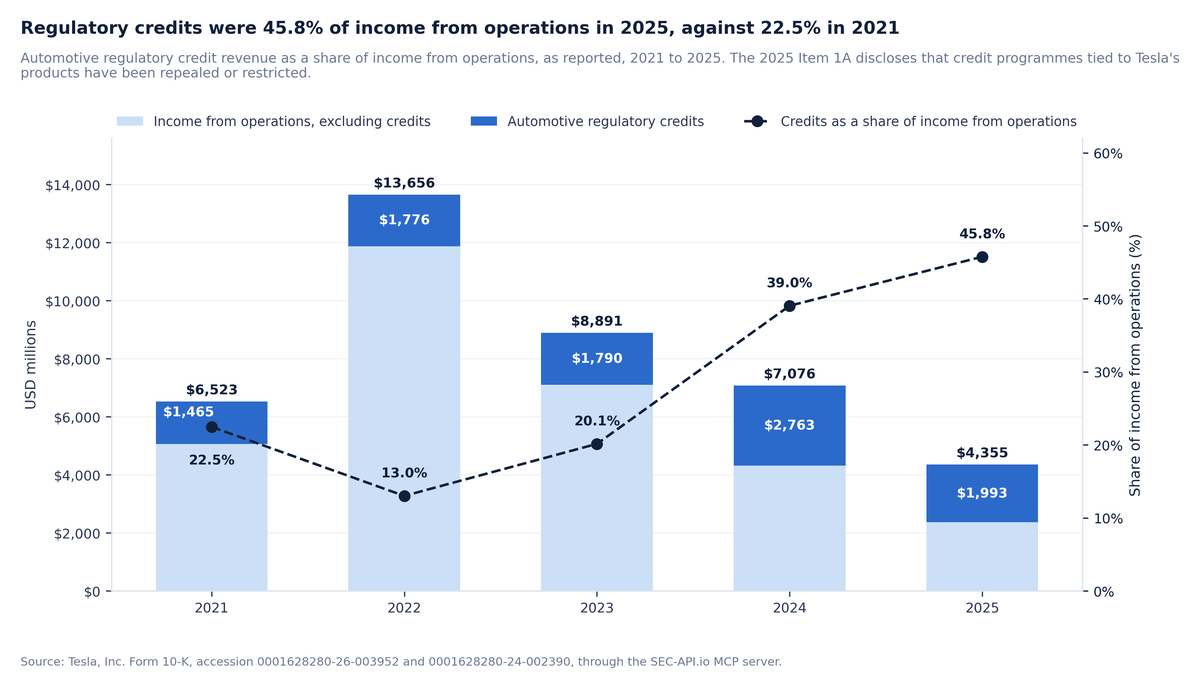
Regulatory credits supplied 45.8% of Tesla's 2025 income from operations; excluding them from both sides, the automotive segment gross margin fell 9 basis points in 2025 against a 71 basis point fall as reported. Capital expenditure in the first half of 2026 reached 97.1% of the whole of 2025, at 2.58 times depreciation, taking free cash flow to $352m for the half and the June quarter to an outflow of $1,092m. Tesla's enterprise value is 14.4 times 2025 revenue against about 1.0 times for General Motors and Ford, and moving the terminal multiple alone from 6.0 to 14.0 times moves the base case value $250 a share.
Financial analysis of Exxon Mobil, FY2025 and the first half of 2026
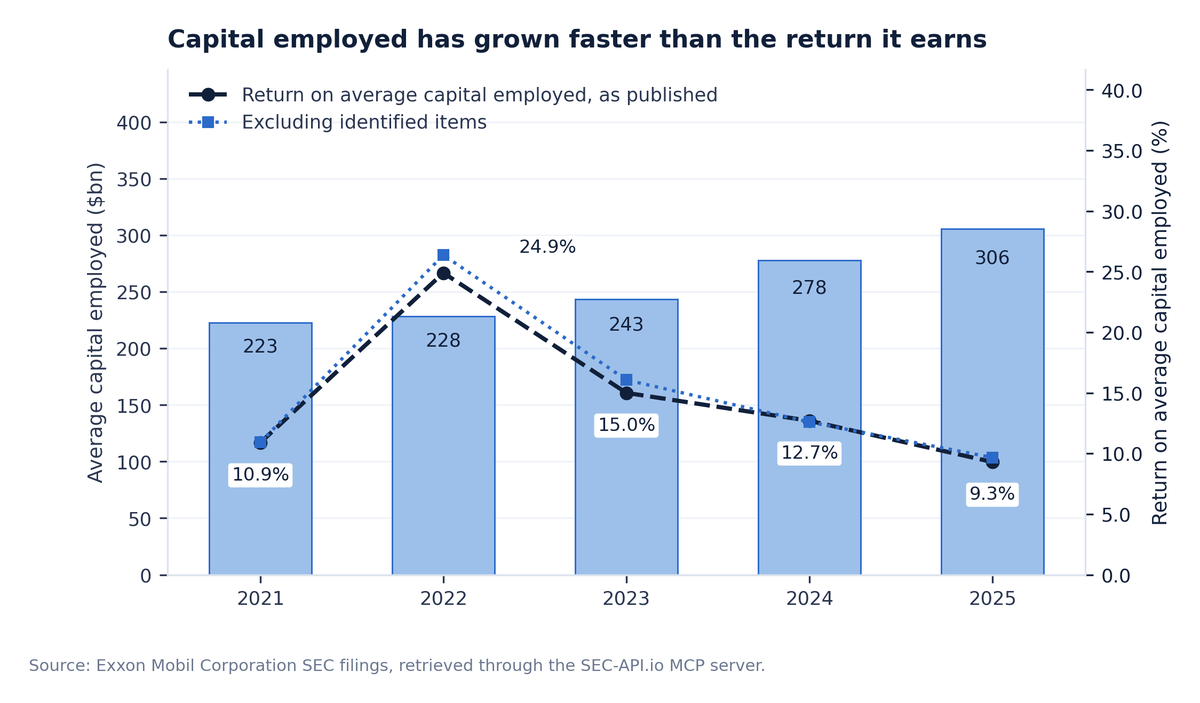
ExxonMobil earned $18.7bn in the first half of 2026 against $14.8bn a year earlier, with the indicative refining margin at $22.6 a barrel against $12.6 and oil equivalent production 37 thousand barrels a day lower. The full year behind it returned 9.3% on average capital employed against 12.7% in 2024, and distributions of $37.5bn ran $13.9bn ahead of the cash left after capital spending. On that return the stock trades at 10.5 times EV/EBITDA against a peer median of 6.1 times, on essentially the same return on capital as Shell and TotalEnergies.
Financial analysis of CVS Health, FY2025 and the first half of 2026
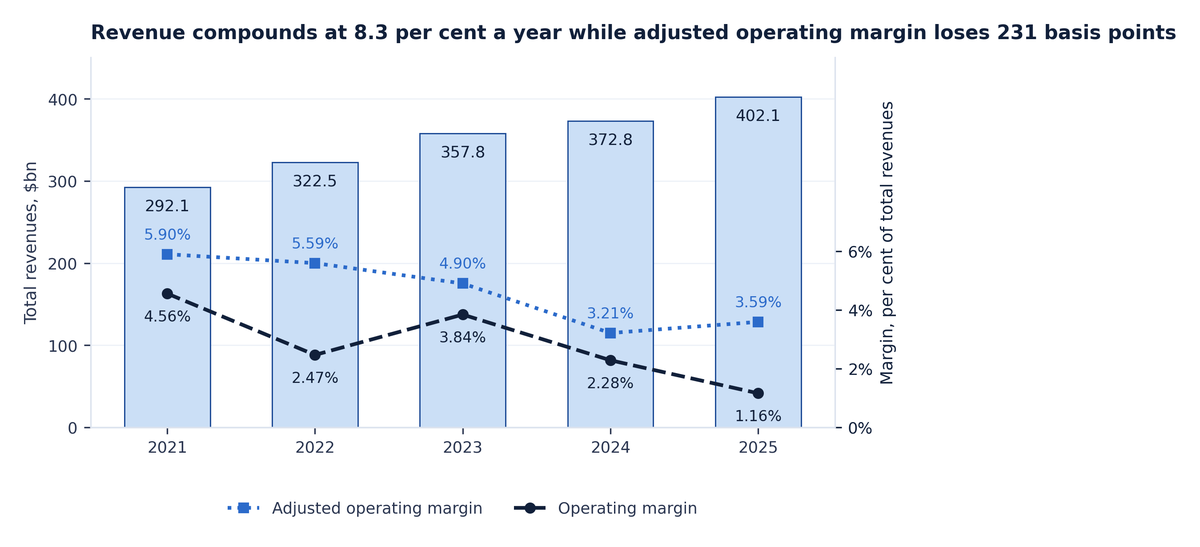
CVS Health compounded revenue at 8.3% a year for five years to $402,067m and shrank adjusted operating income 4.3% a year and Adjusted EPS 5.3% a year while doing it, excluding $31,034m from operating income over the period, 39.2% of the $79,217m of adjusted operating income it reported. Of the 128 basis point improvement in the Health Care Benefits medical benefit ratio that the stock has rerated on, 58 basis points came from underwriting and 70 came from a larger prior year reserve release. Goodwill has exceeded book equity in every one of the five years, and the four reportable segments bill $473,630m against $402,067m of consolidated revenue, because one CVS unit sells to another.
Financial analysis of Walmart, fiscal 2026 and the first half of fiscal 2027
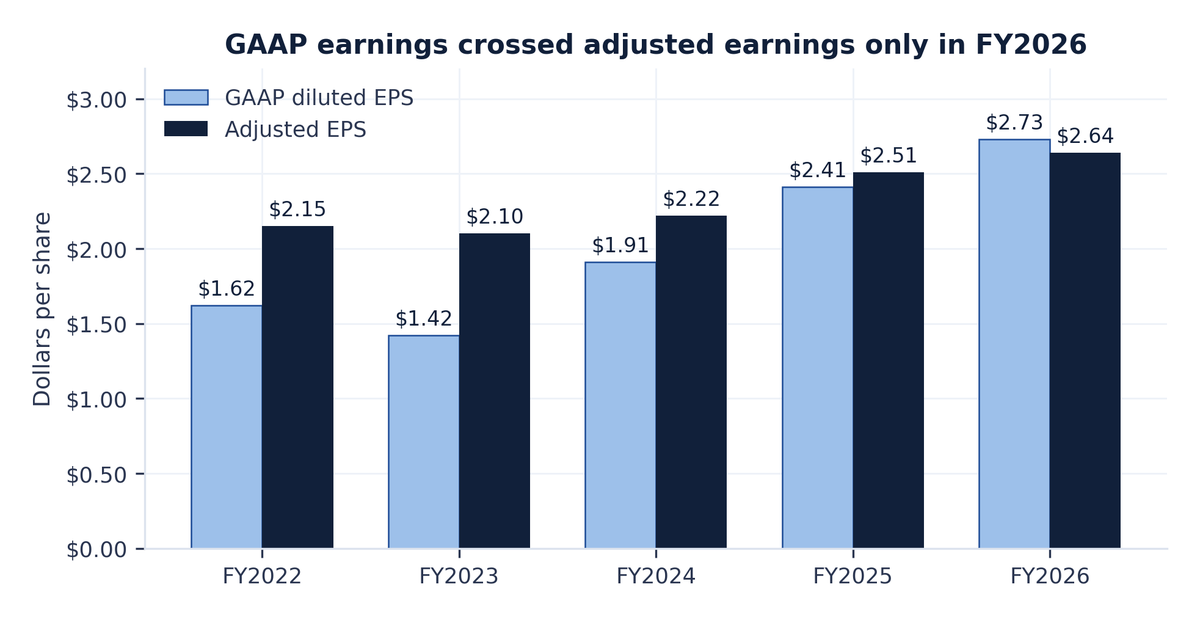
Walmart's FY2026 GAAP diluted earnings per share rose 13.3% while adjusted earnings per share rose 5.2%, and the whole of the gap is a $2,869m swing in the marks on equity and other investments. Free cash flow of $14,923m no longer covers the $15,595m paid out in dividends and buybacks, a cover of 0.96 times against 1.70 times in FY2024. The raised FY2027 guide implies second half adjusted operating income growth of 0.8% to 3.7% against 13.6% delivered in the first half, because a $2.9bn tariff refund is being reinvested in price, and at $106.54 the stock trades on 37.6 times the midpoint of that guide.
Financial analysis of Amazon, FY2025 and the first half of 2026
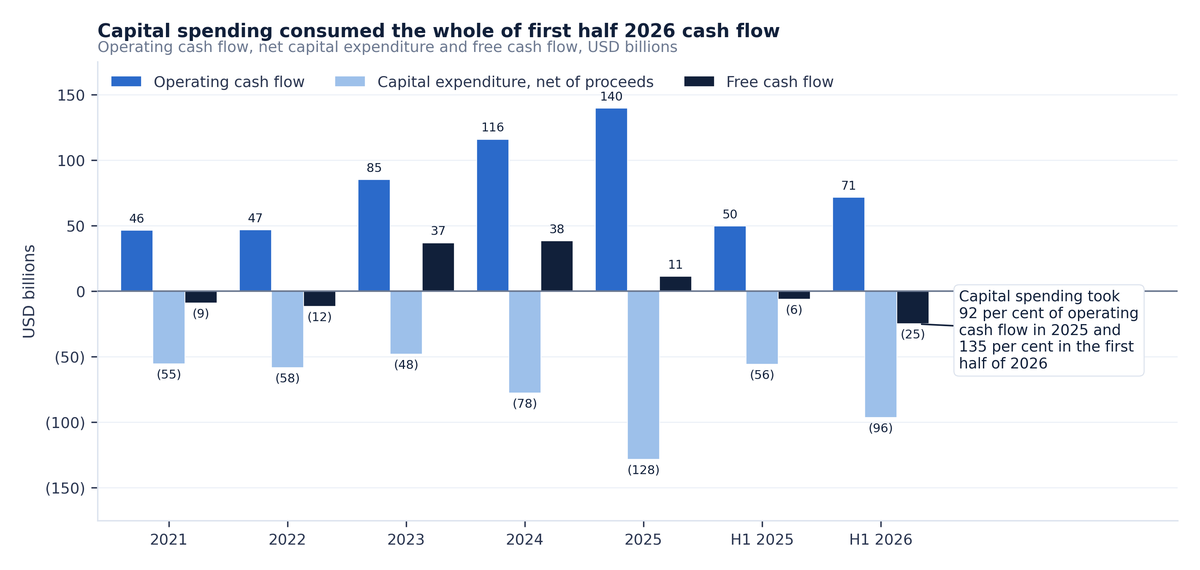
Amazon's cash purchases of property and equipment rose 58.8% to $131,819m in FY2025 and took 94.5% of operating cash flow, cutting free cash flow measured before proceeds and incentives 76.6% to $7,695m, and capital spending reached 135% of operating cash flow in the first half of 2026. The profit that funds it sits in one eighteenth of the revenue: AWS is 18.0% of net sales and 57.0% of consolidated operating income, and its margin fell from 37.0% to 35.4% while it grew 19.7%, slower than every rival cloud line on file. Reported earnings have detached from operations at the same time, with $53.4bn of the $80.9bn of June 2026 quarter pretax income nonoperating, so trailing twelve month earnings of $12.39 a share become $6.65 on a core basis and the multiple paid goes from 20.6 times to 38.4 times.
Financial analysis of Berkshire Hathaway, FY2025 and the first half of 2026
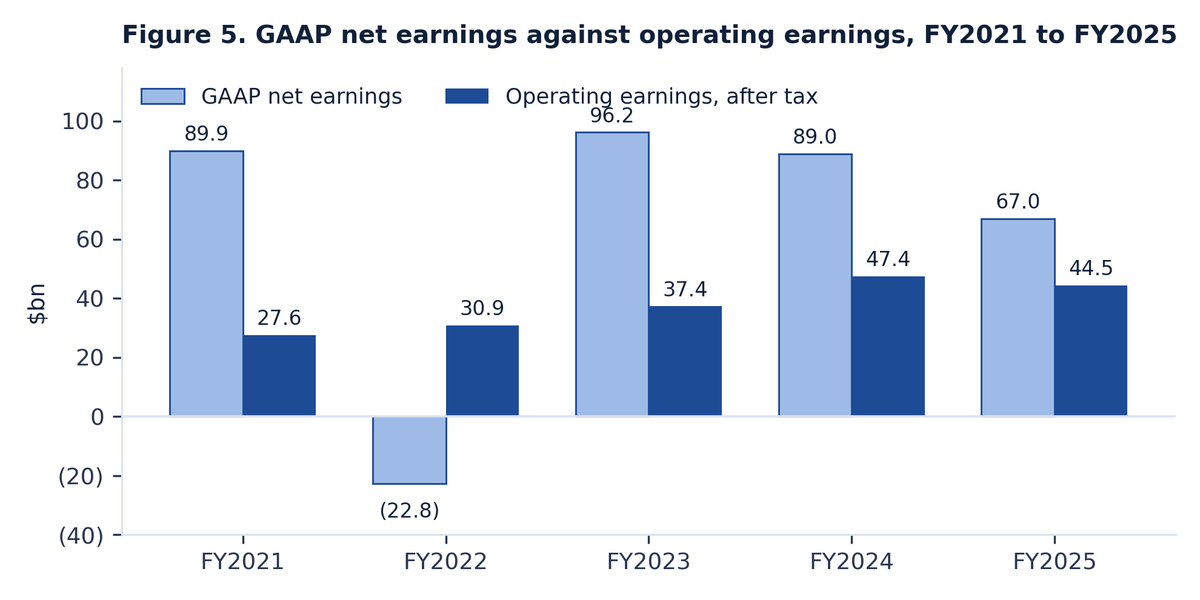
Berkshire's FY2025 revenue was flat at $371,444m while earnings before income taxes fell $27,917m to $82,459m, almost all of it in investment and equity method marks. Operating earnings after tax fell 6.2% to $44,486m, the only decline of the five years, and core return on average equity of 6.3% is the lowest of the nine property and casualty filers compared here, because McLane and Pilot Travel Centers supply 25.3% of segment revenue and 1.7% of segment pretax earnings. Capital policy changed with the chief executive: nothing was repurchased in 2025 and $4,762m of stock had been bought by 30 June 2026 after the 4 March restart.
Financial analysis of Microsoft, FY2026: capital intensity against a record margin
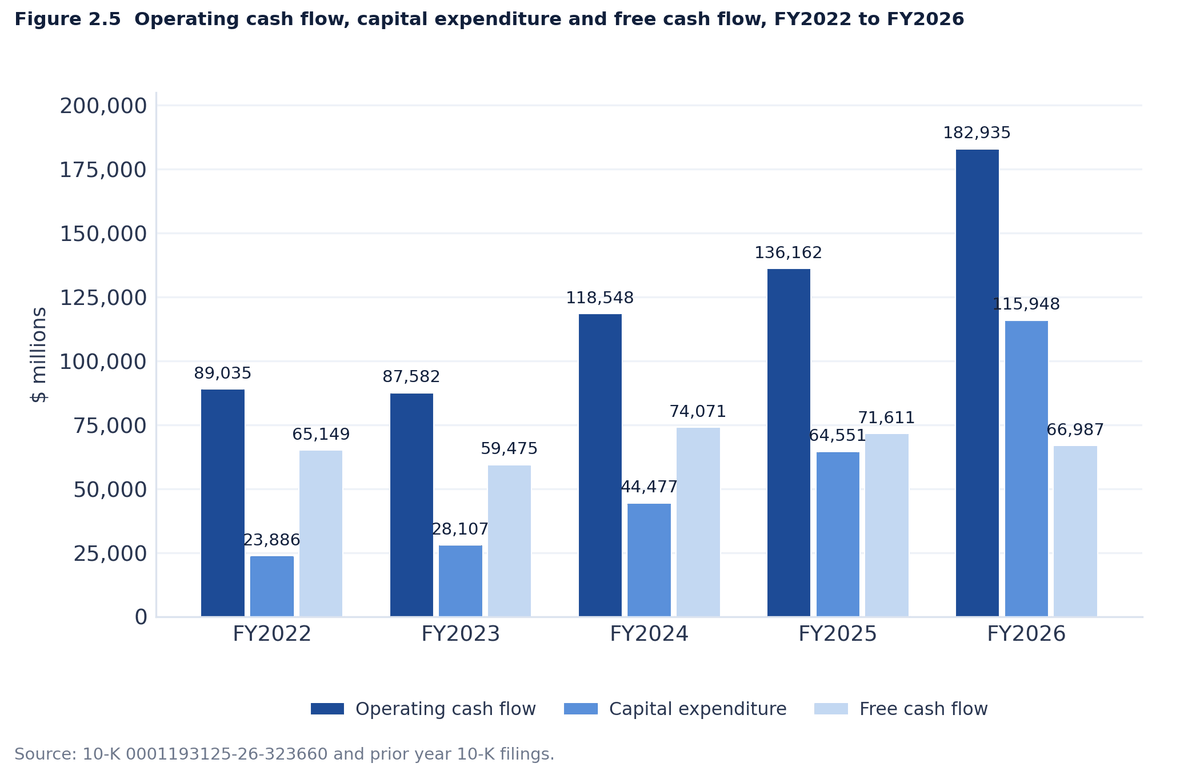
Microsoft grew FY2026 revenue 17.8% to $331,839 million and lifted operating margin to a five year high of 46.8%, but capital expenditure of $115,948 million took 34.9% of revenue and cut free cash flow for a second year to $66,987 million, turning $5,242 million of net cash into $(30,045) million of net debt. Reported diluted EPS growth of 31.6% falls to 17.1% once the OpenAI and other investment gains come out, and OpenAI alone supplied 7.3% of revenue and most of the $678 billion commercial backlog. The case rests on whether that signed backlog converts faster than the datacentre depreciates.
Financial analysis of UnitedHealth Group, FY2025
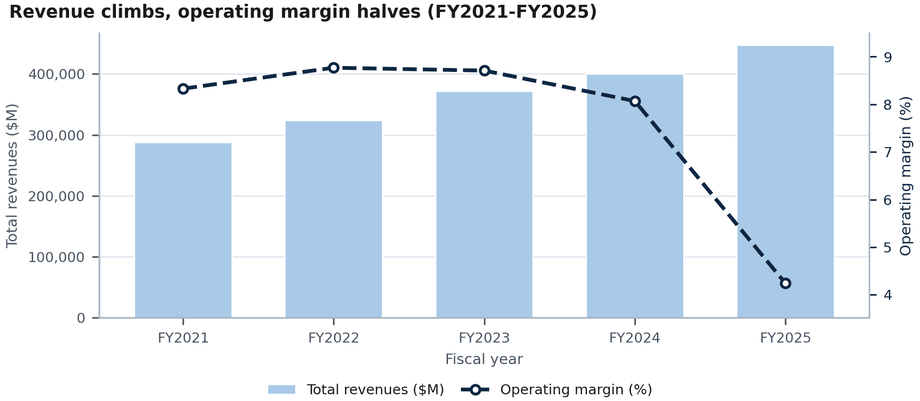
UnitedHealth Group grew FY2025 revenue 11.8% to $447.6B and still lost 41% of its operating income, which fell to $19.0B as the medical care ratio rose 360 basis points to 89.15% and OptumHealth swung to a $(278)M operating loss. Benchmarked against six peers, roughly two fifths of the damage is sector wide and three fifths is company specific. Insiders bought $32.1M in the May 2025 trough and have bought nothing since.
Financial Analysis August 2026: Salesforce, Inc.
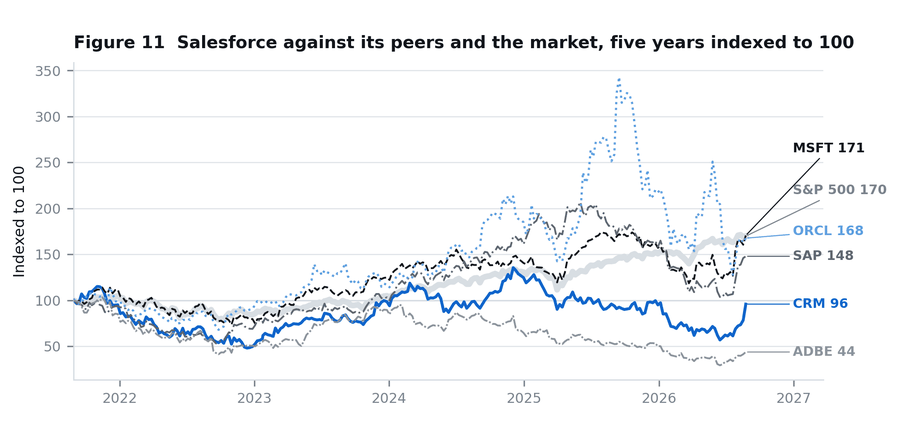
Salesforce has grown and lost value at the same time for two years: revenue is up 11.2% over the trailing year and free cash flow is a record 15.2 billion dollars, yet the shares sit 29% below their December 2024 peak and five years of holding them has returned (4.2%) against 70% for the S&P 500. Reported profit is flattered by 4.2 billion dollars of unrealised marks on private holdings, and a 25 billion dollar debt funded repurchase has replaced net cash with 27.9 billion of net debt.
Financial Analysis August 2026: Apple Inc
Apple's record year came from hardware margin, not the services mix that usually drives it: over nine months products margin gained 2.96 percentage points while services added 0.82. At 36.5 times earnings the share price needs free cash flow to compound at 11.9% a year for a decade, against the 8.0% it managed over the past five.
Financial analysis of Sandisk, August 2026
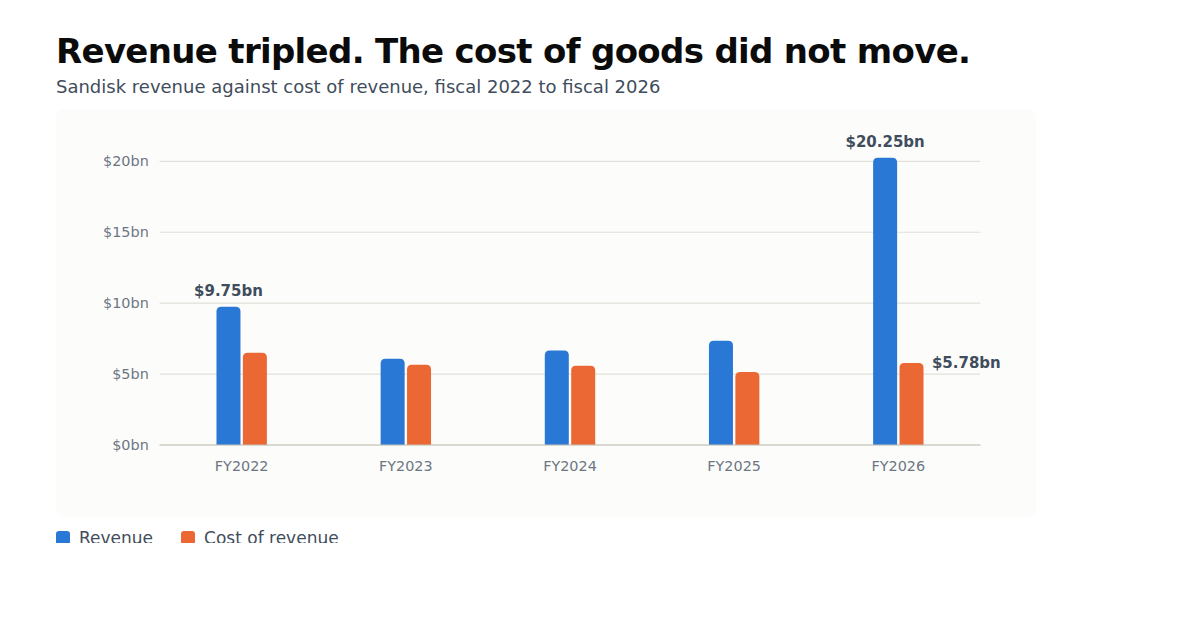
Sandisk turned a $1.6bn loss into $11.4bn of net income in twelve months while its payments to the Kioxia joint venture stayed flat at $3.4bn to $3.6bn, so almost all of the gain is price rather than volume or cost. Ten New Business Model contracts now pre-sell more than half of fiscal 2027 bits at around 80% gross margin, with $31.3bn more signed after year end. The bull case rests on NAND staying scarce, and in the eight weeks to 27 August SK hynix and the Kioxia partnership committed the capacity that ends scarcity.
Financial analysis of SK hynix, August 2026
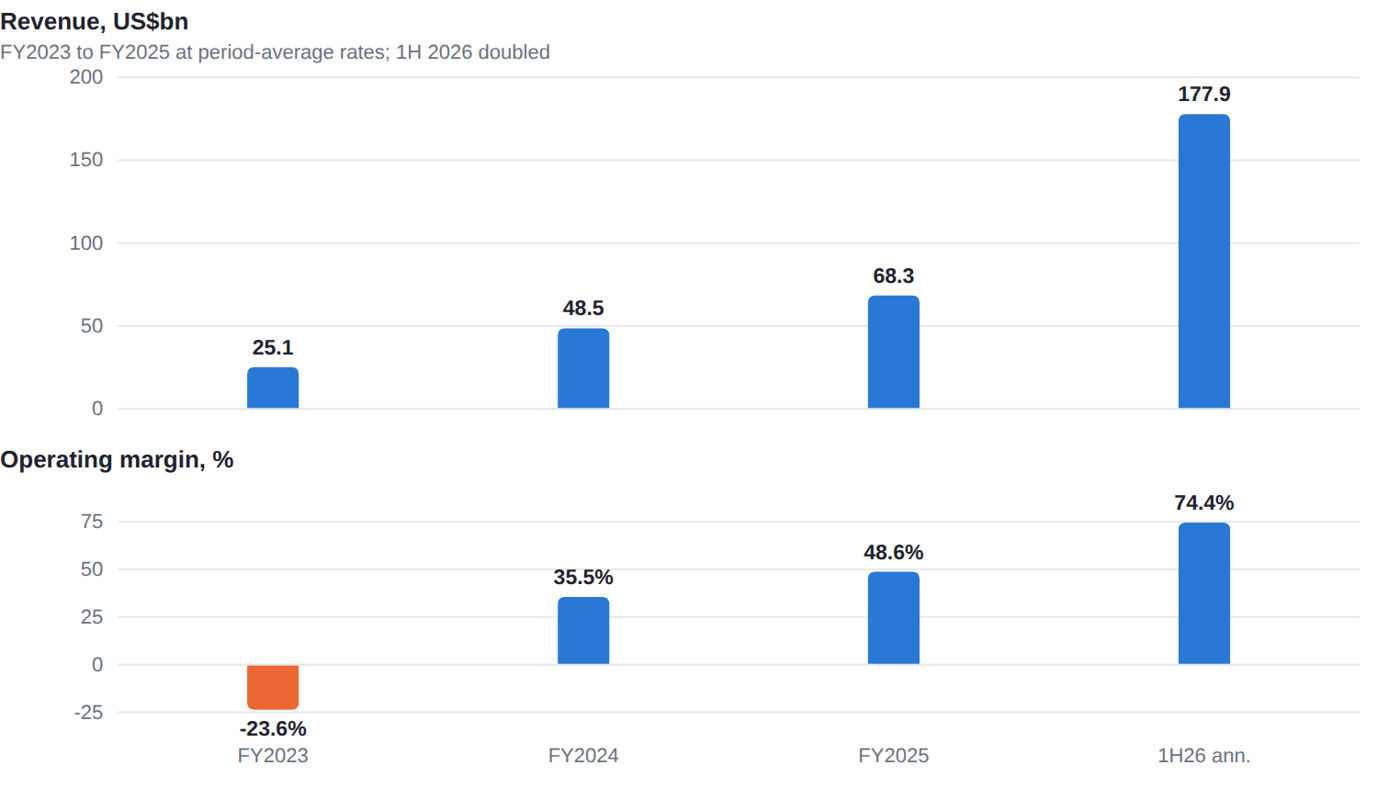
SK hynix earns a 76% operating margin and trades at 8.8x trailing operating profit, but the price requires about $64bn of free cash flow a year from 2029, roughly 3.5x the 2025 outturn. Only 28% of enterprise value is covered by discounted 2027 and 2028 cash flow, so almost three quarters of it rests on years no filing describes. Built from the July 2026 IPO prospectus, all 31 SEC filings and the Q2 earnings call, with every figure converted to US dollars.
Alphabet's 2026 annual meeting: the vote that was settled before it started
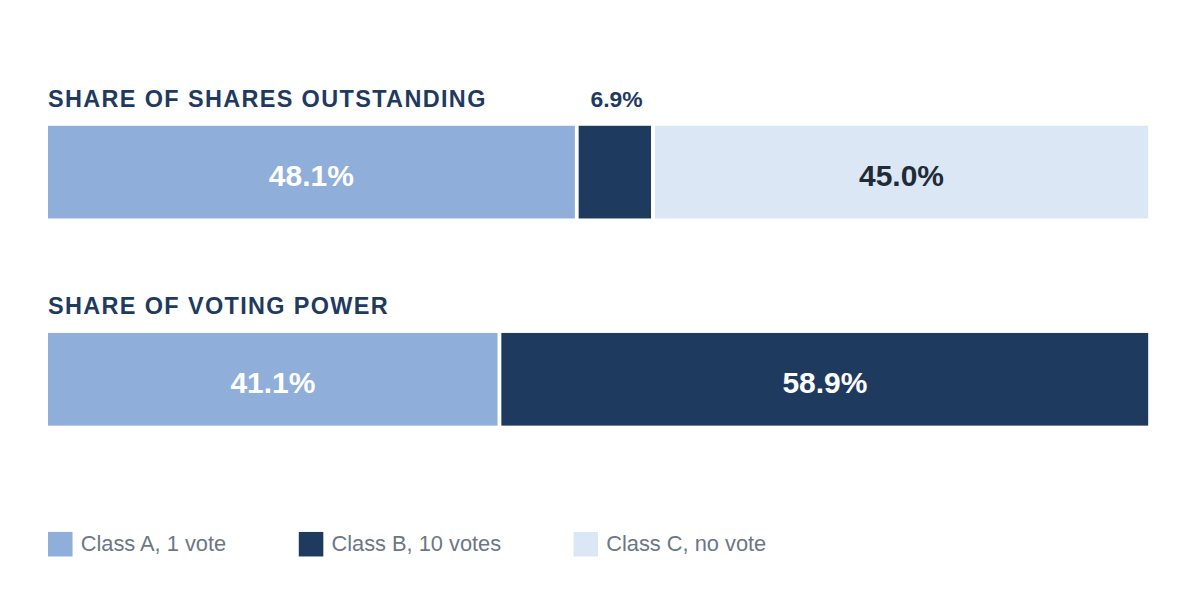
Re-running Alphabet's 2026 ballot without its ten-vote Class B shares reverses two outcomes: a majority of unaffiliated voting power opposed the executive pay programme, and support for one share, one vote rises from 31% to an estimated 96%. All thirteen management items passed and all ten shareholder proposals failed, five of them on AI.
Financial analysis of Alphabet, August 2026
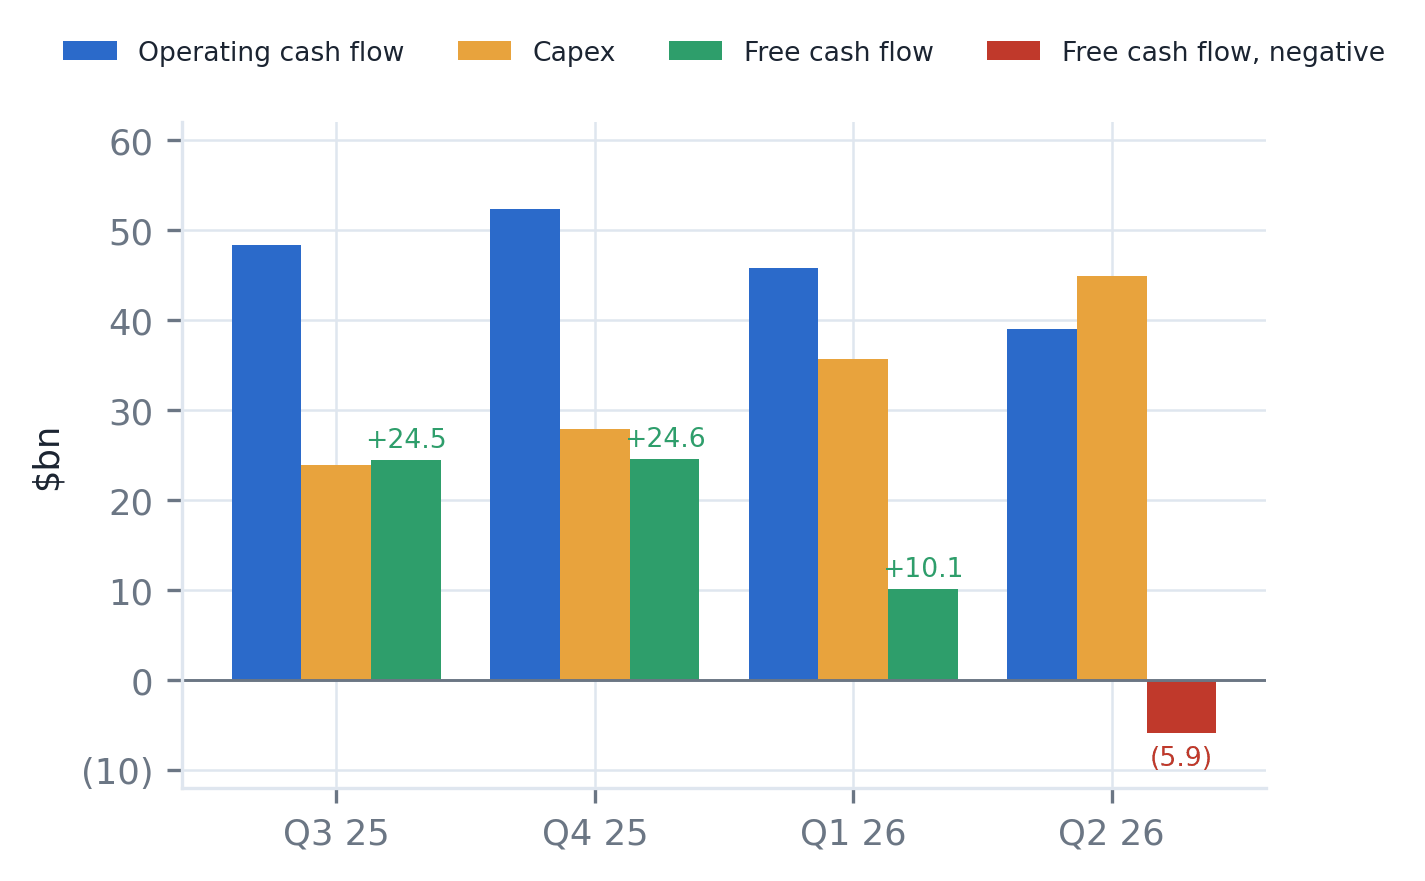
Alphabet's free cash flow turned negative in the June 2026 quarter, at minus $5.9bn, the first negative quarter on record, as capital expenditure quadrupled to $132bn over the last twelve months and buybacks stopped. This analysis reads all seventeen 10-Q filings, five 10-Ks, eighteen 8-Ks, 185 insider forms and five earnings call transcripts, and finds the stock is discounting the bull case rather than the base case.
AI infrastructure supply and demand: what 42 issuers disclosed
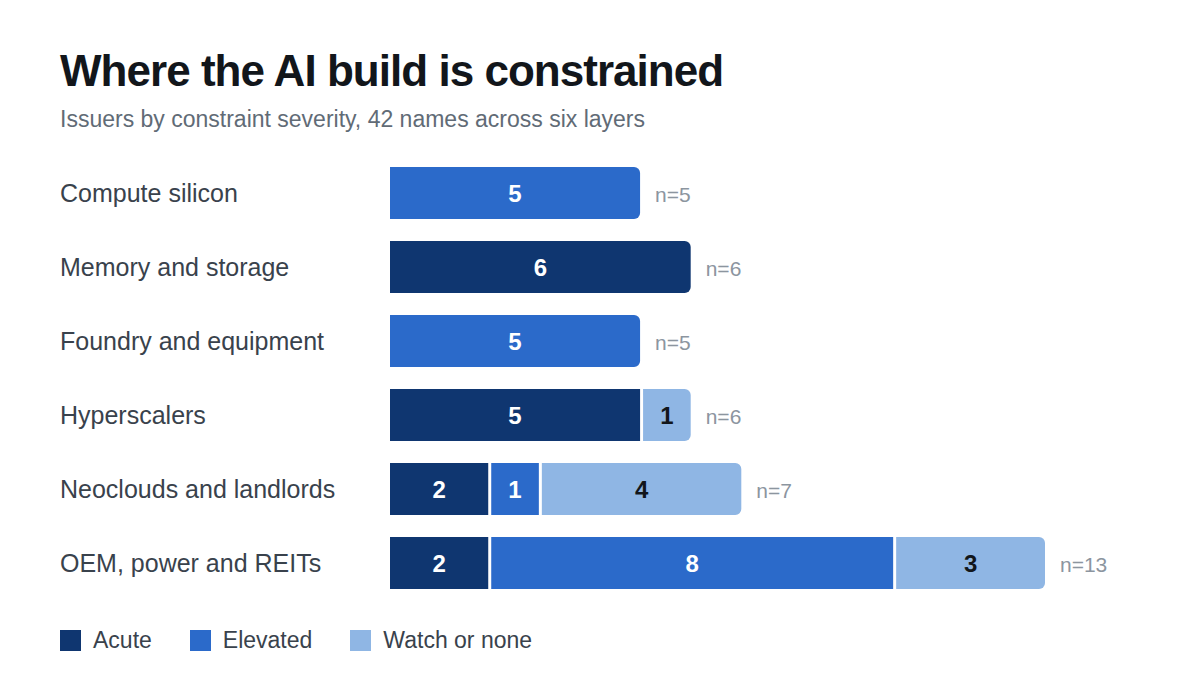
Thirty of 42 AI infrastructure issuers name a supply or capacity constraint in their last two reported quarters, but only five wrote that language into a risk factor. Memory is the binding constraint today and every memory name is sold out; from 2027 it becomes electricity. The gap between contracted demand and deliverable supply is clearing on price rather than volume.
Inside Jane Street's Q2 2026 Form 13F: cover page and top 50 positions
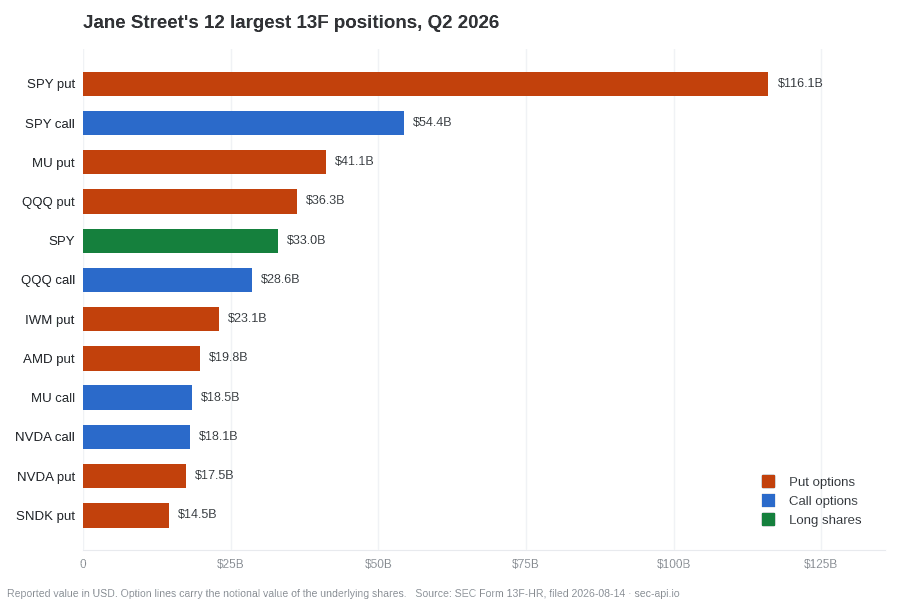
Jane Street Group's Form 13F-HR for the quarter ended June 30, 2026 reports 14,718 positions worth $1.206 trillion. This post lists the filing's cover page, the split between puts, calls and long shares, and the 50 largest positions with CUSIP, share count and share of portfolio, along with the API queries that return the data.
Financial analysis of Lumentum, fiscal 2026
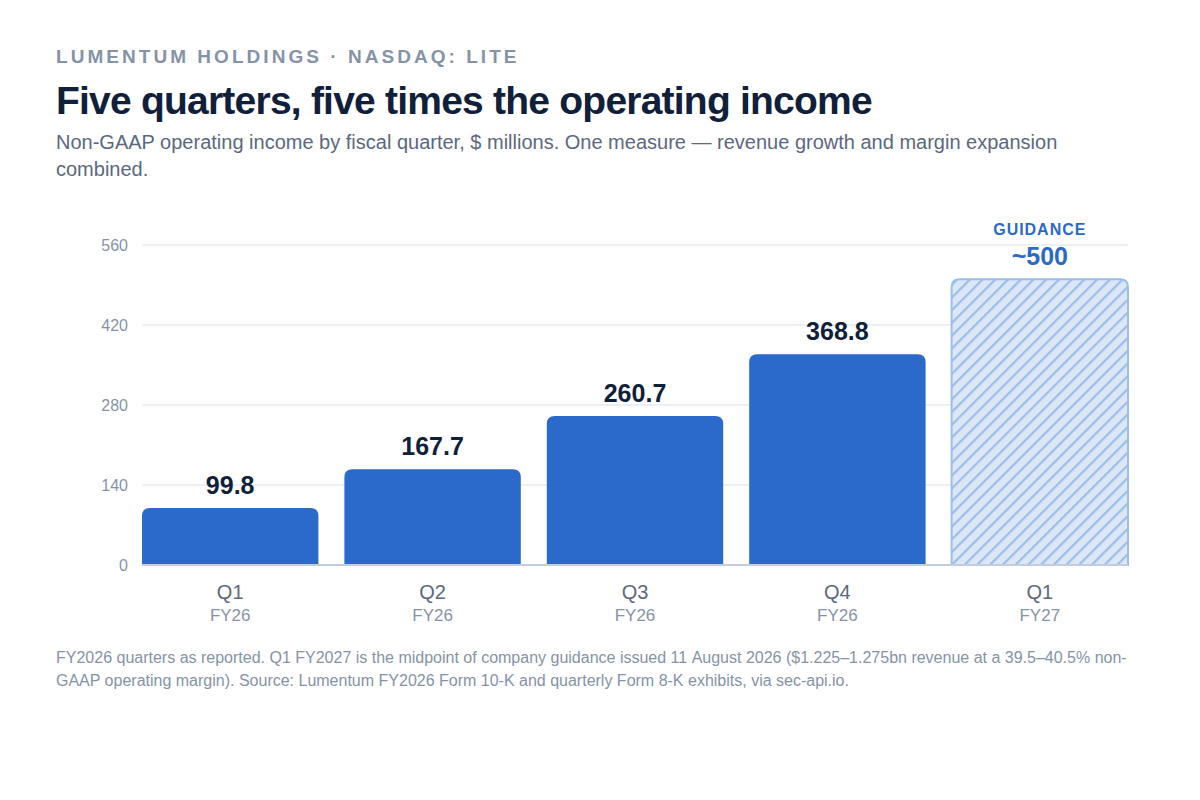
Lumentum's fiscal 2026 revenue rose 83.2% to $3.01bn and non-GAAP operating margin reached 29.8%, while a $7.8bn non-cash charge on converting notes to equity produced a $6.9bn GAAP net loss. A five-year ratio analysis, a peer comparison against Coherent, Fabrinet, Ciena and Applied Optoelectronics, twelve months of 8-K filings including NVIDIA's $2.0bn preferred investment, and three-year revenue, margin and free-cash-flow scenarios with sensitivity grids.
Financial analysis of NVIDIA, August 2026
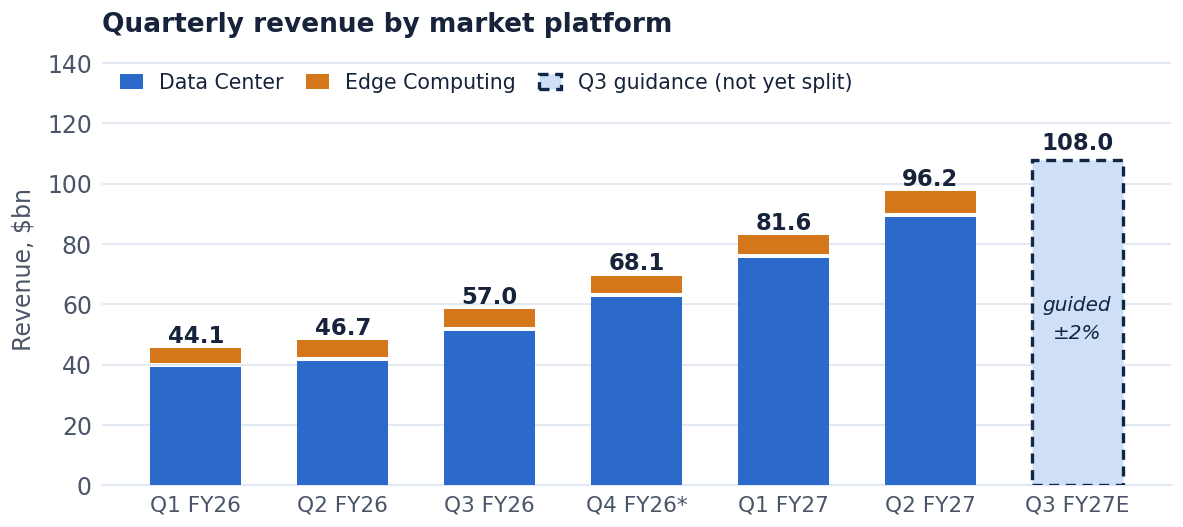
NVIDIA is no longer expensive on earnings. It is expensive on the durability of those earnings. At 18.4x forward EPS it trades below AMD, Broadcom and Texas Instruments, and the whole debate is whether $279bn of committed supply is a demand signal or an inventory bomb. Five years of financials and ratios, sector benchmarking, market history and forward scenarios.
SK hynix Q2 2026 earnings: revenue more than triples
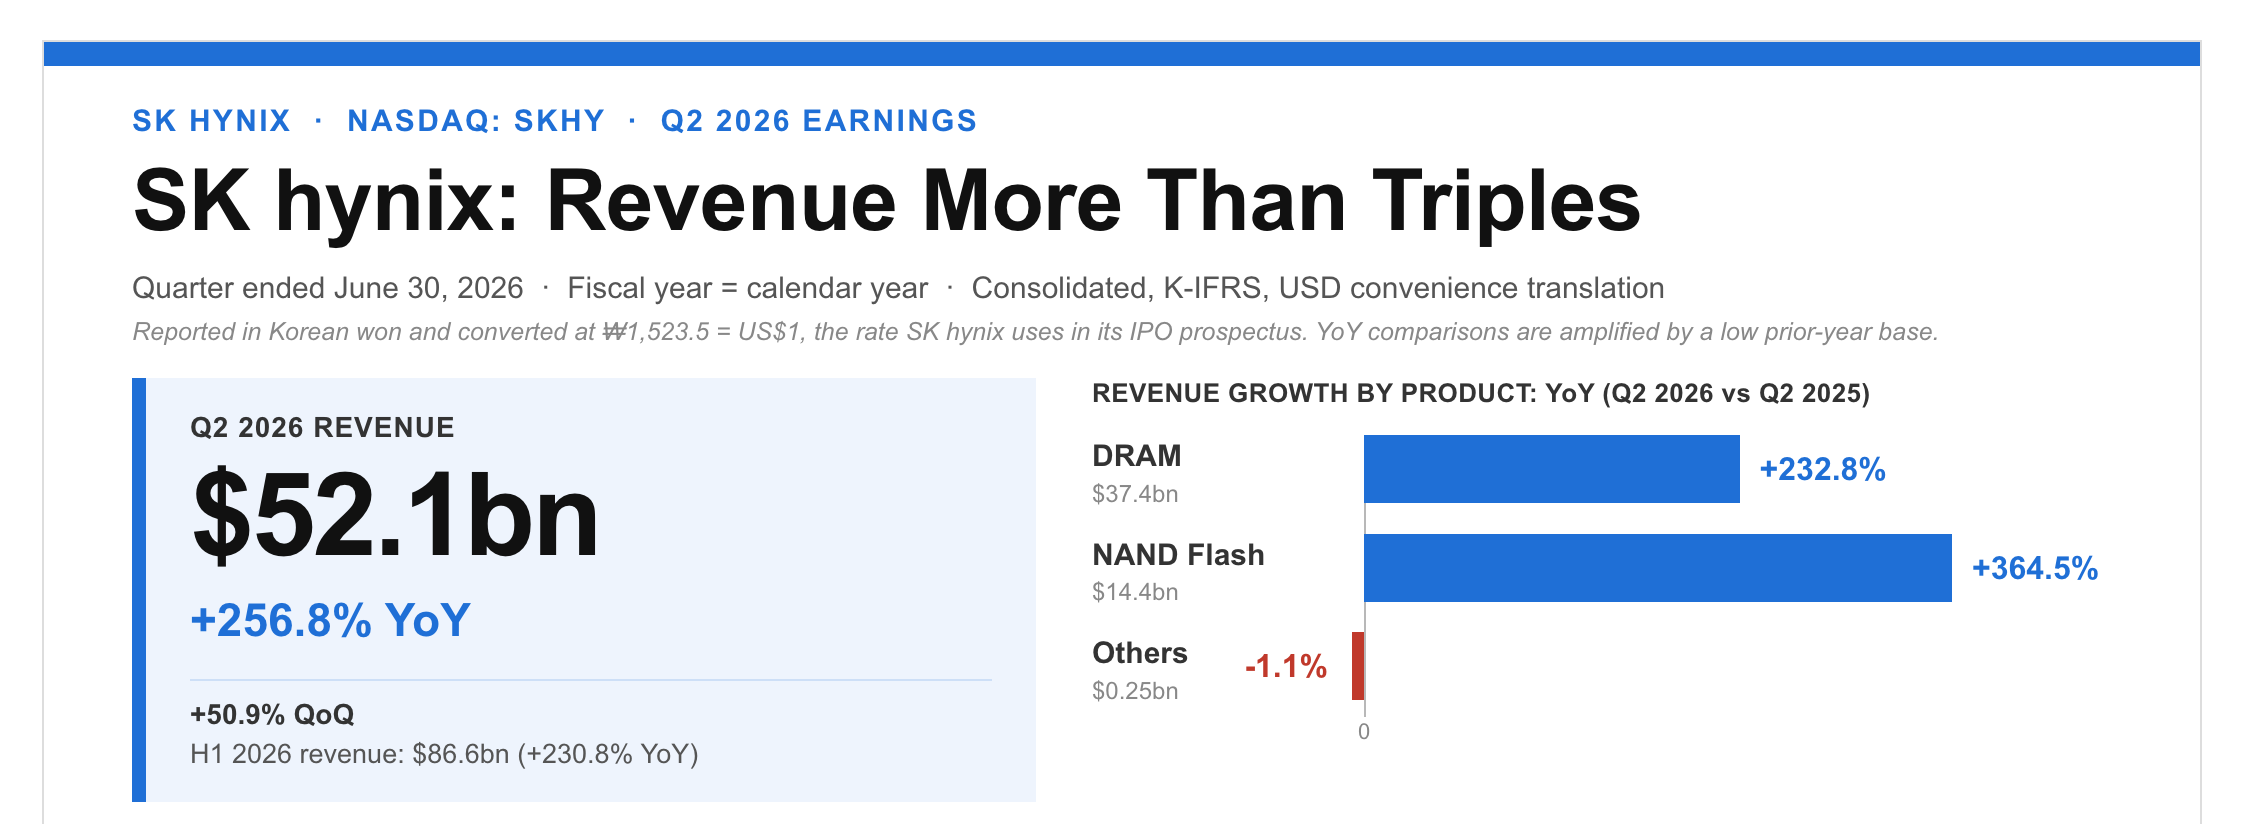
Q2 revenue of $52.1bn, up 256.8% year over year and 50.9% quarter over quarter, with H1 at $86.6bn. NAND Flash grew 364.5% and DRAM 232.8%. $34.9bn of the $61.7bn net profit is a non-cash valuation gain on financial instruments rather than operations, and long-term investment assets went from $9.5bn to $56.0bn in six months. China was 24.8% of Q2 revenue, and the BIS equipment license for the China fabs covers 2026 only. The company is targeting to double wafer output within five years.
Financial analysis of Nebius, August 2026 earnings
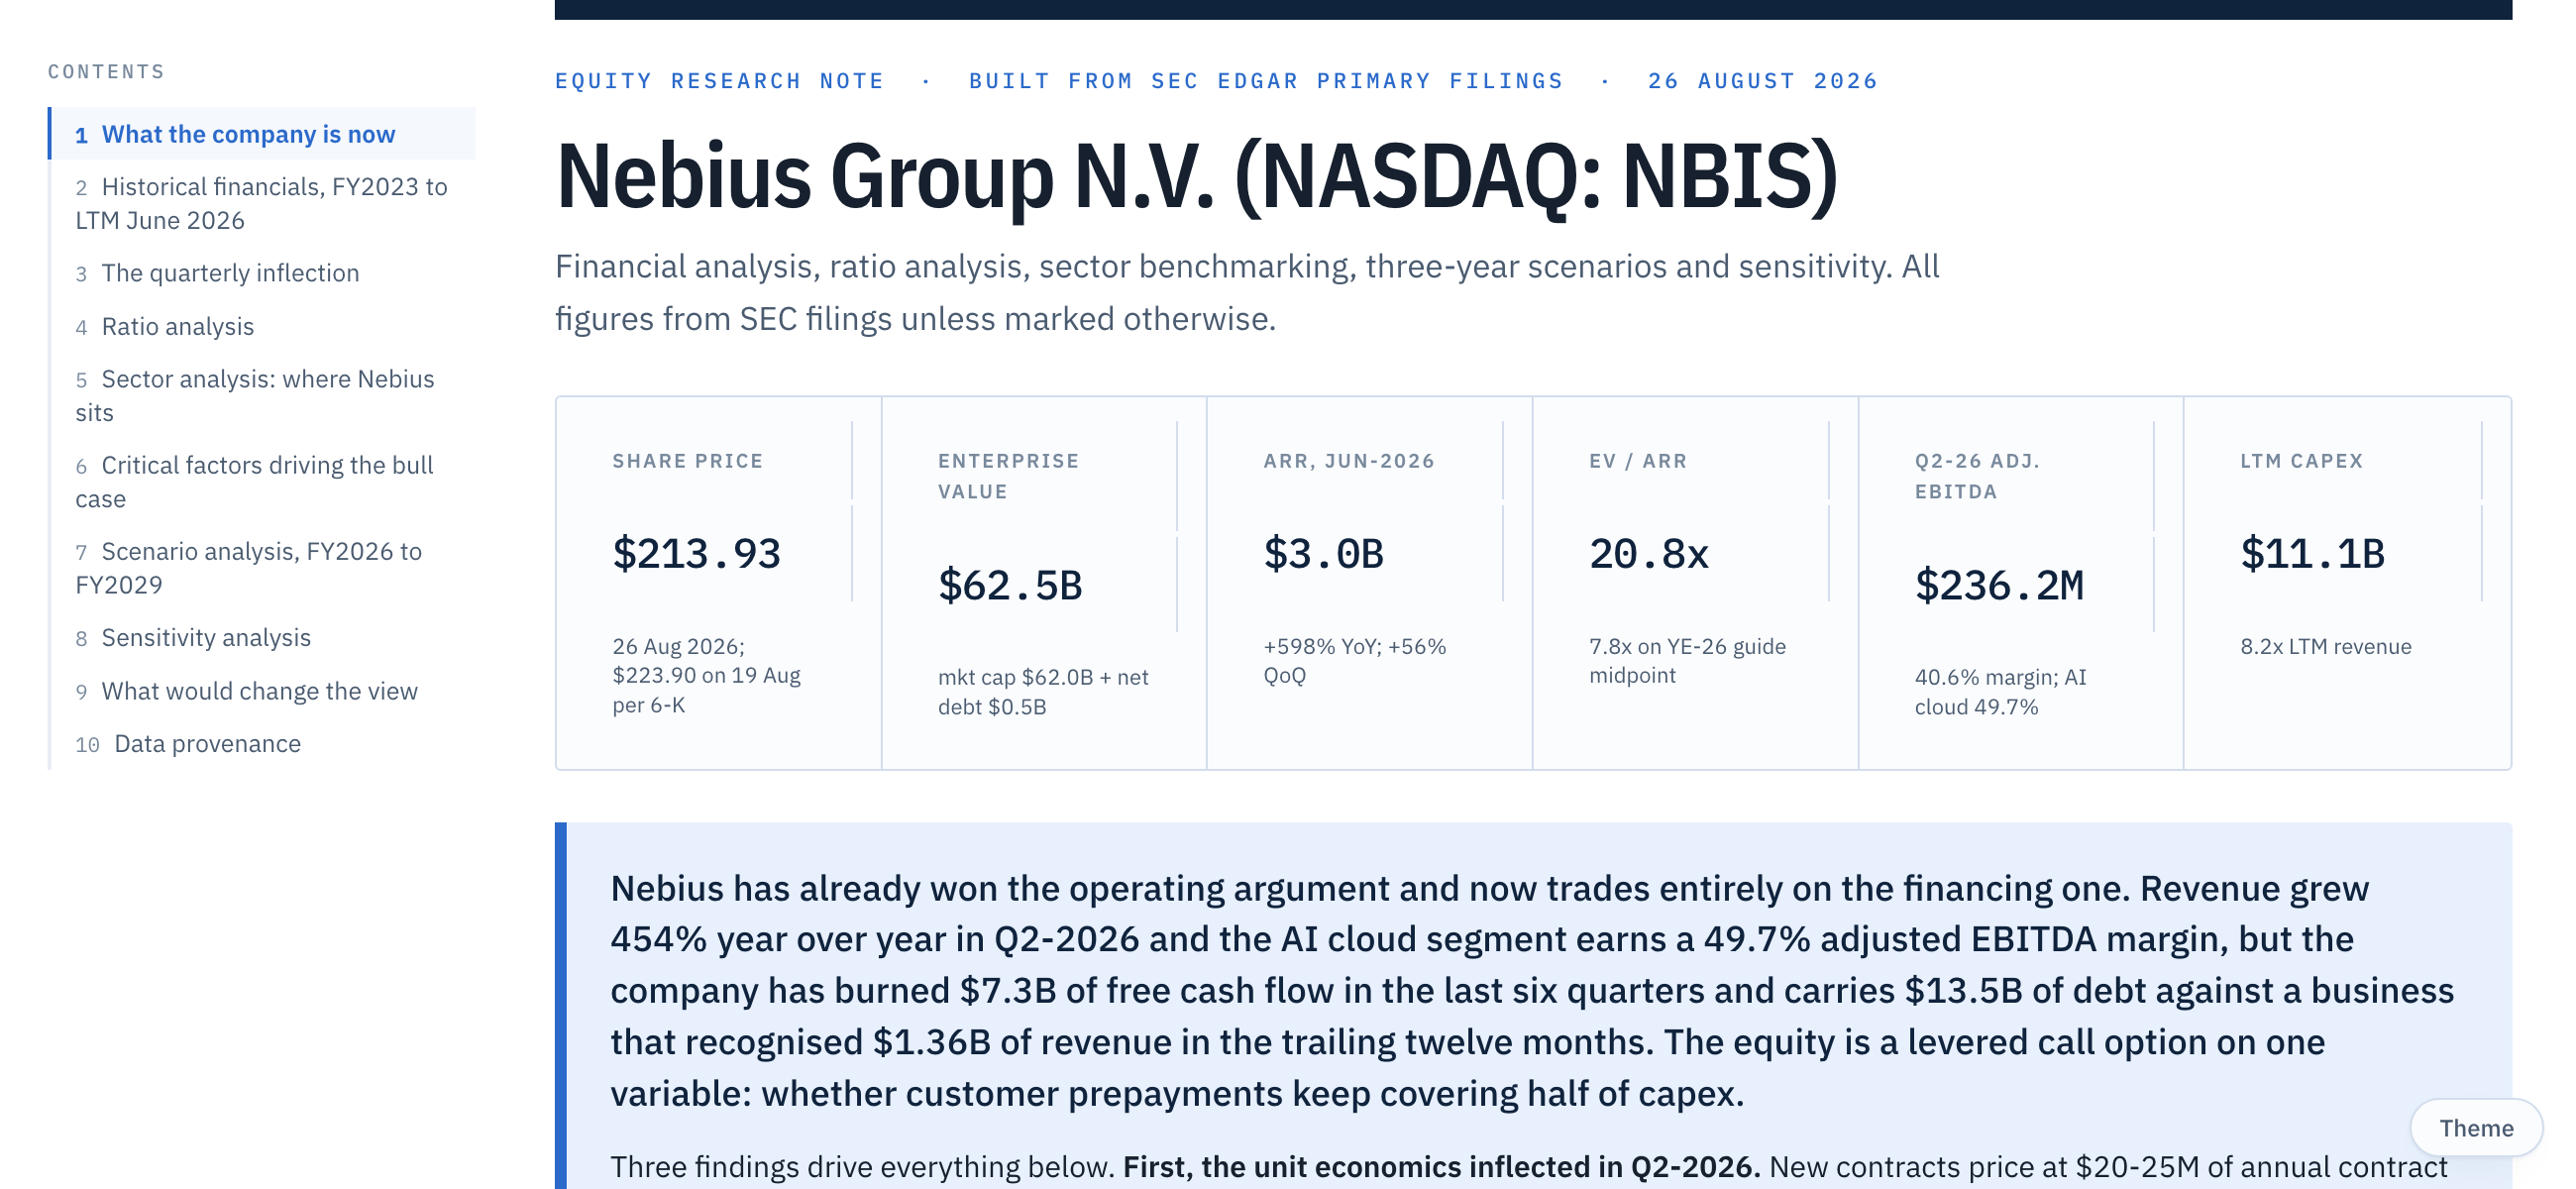
Nebius is what was left of Yandex after it sold its Russian operations in July 2024. It rebuilt around an AI cloud business that first booked revenue in 2023 and now accounts for 98% of segment revenue. Ten sections from the filings: historicals, the quarterly inflection, ratios, sector position, scenarios and sensitivities.