Rank an industry on revenue, margin, R&D and capex from annual filings
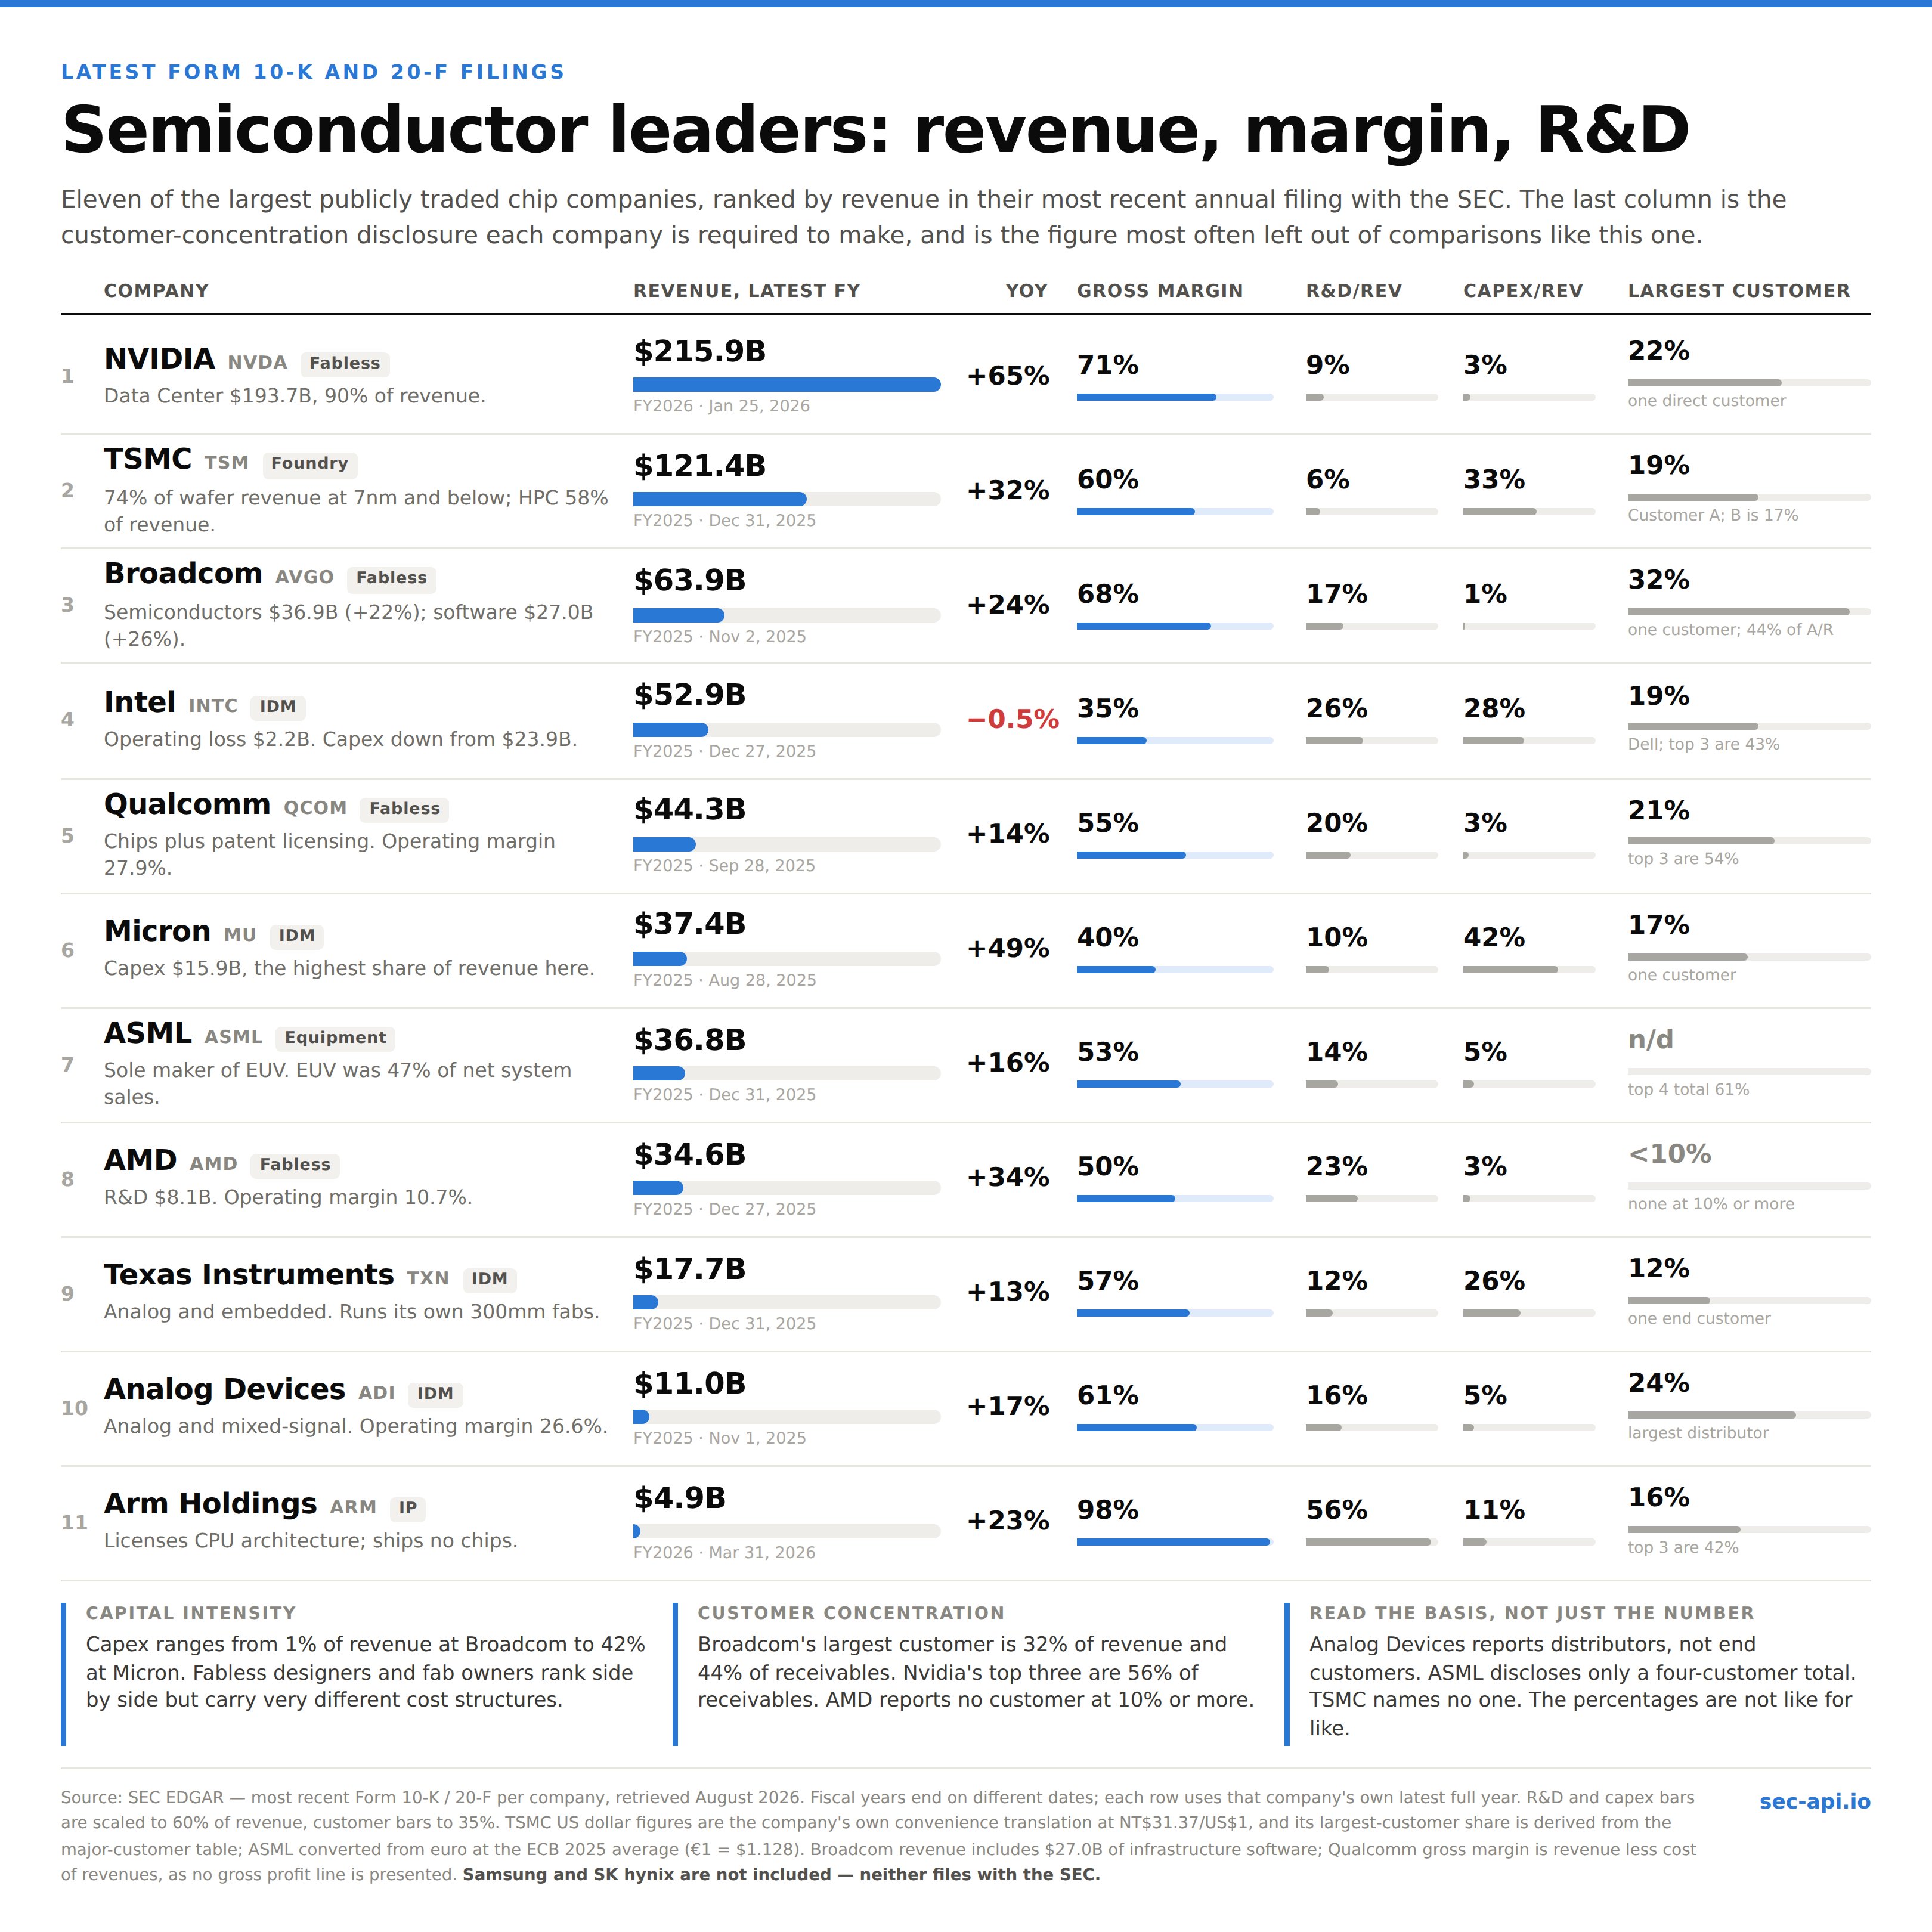
Reads the latest annual filing for eleven chip companies, pulls revenue, gross margin, R&D, capex and customer concentration from XBRL, and renders a ranked scorecard where every figure is labelled by that company's own fiscal year end and by the basis it was disclosed on.
Prompt
Build a 1080×1080 PNG infographic ranking semiconductor companies by revenue, sourced entirely from SEC filings. Follow this spec exactly.

## Data

Pull the most recent annual filing (Form 10-K, or 20-F for foreign private issuers) for each of these eleven companies, and take the figures from the filing's XBRL data:

NVDA, TSM, AVGO, INTC, QCOM, MU, ASML, AMD, TXN, ADI, ARM

For each company extract, for its latest full fiscal year:

- Total revenue, and prior-year revenue (for YoY growth)
- Gross profit → gross margin as % of revenue
- Research and development expense → % of revenue
- Capital expenditure (the purchases-of-property-and-equipment line in the cash flow statement) → % of revenue
- Operating income → operating margin
- Largest disclosed customer as a % of revenue, from the concentration-of-risk disclosure (ConcentrationRiskPercentage)

Rank rows by revenue, descending.

## Known traps — handle these explicitly

- Fiscal years do not align. They span roughly Aug 2025 to Mar 2026 across this group. Use each company's own latest full year and label the end date on every row.
- Qualcomm presents no gross profit line. Derive it as revenue less cost of revenues.
- TSMC reports in TWD. Use the company's own USD convenience translation, disclosed in the filing, and state the rate.
- ASML reports in EUR. Convert at a stated published rate and footnote it.
- Nvidia's customer-concentration facts carry a segment dimension in XBRL, but the filing text says the percentages are of total revenue. Read the prose, not the tag.
- AMD discloses no customer at 10% or more of revenue — only an accounts-receivable concentration. Show "<10%", not a number.
- ASML discloses only a four-customer aggregate, no single-customer figure. Show "n/d" with the aggregate as a caption.
- Analog Devices reports distributors, not end customers. Caption it as such.
- TSMC names no customer — derive the largest share from its major-customer table.
- Broadcom's revenue includes ~$27B of infrastructure software, so it is not a pure semiconductor number. Footnote it.
- Samsung and SK hynix cannot be included — neither files with the SEC. Say so on the graphic.

Verify every headline figure against the filing's own prose or tables before building anything. Do not trust a single XBRL tag read.

## Layout

Single card, 1080×1080, white background, 4px blue rule across the top.

- Kicker: "Latest Form 10-K and 20-F filings"
- Headline: "Semiconductor leaders: revenue, margin, R&D" — must fit on one line
- Two-line standfirst explaining the ranking and calling out the customer column
- Table header, then 11 rows at 65px each, hairline separators
- Three short notes at the bottom, each with a blue left rule
- Source paragraph across the bottom, with "sec-api.io" alone in the right corner

Columns, left to right (widths in px, total 1012): rank 24 (row number, muted); company 296 (name + ticker + business-model chip: Fabless / Foundry / IDM / Equipment / IP, then one short factual line beneath); revenue 186 (value, bar, then "FY20XX · <end date>"); YoY 62 (signed %); gross margin 128 (value + meter); R&D/rev 88 (value + bar); capex/rev 92 (value + bar); largest customer 136 (value + bar + caption naming the basis).

Bar scaling: revenue to the largest company, R&D and capex to 60% of revenue, customer bars to 35%.

## Design rules

- One accent colour only: blue #2a78d6. Everything else neutral — ink #0b0b0b, secondary #52514e, muted #898781, bar tracks #eeedea, grey bar fills #a8a6a0, meter track #dfeafa, hairlines #e6e5e0.
- Red #d03b3b is reserved for negative growth. Nothing else is coloured.
- System sans throughout. font-variant-numeric: tabular-nums on every numeric column.
- Bars 8px, meters 4px, 4px rounded data-end, square at the baseline.

## Copy rules

Write descriptively, not persuasively. State what each company does and cite figures from its filing. Do not assert who is "winning", do not describe moats or pricing power, do not use the "X says one thing, Y says another" construction. The bottom notes should be ranges and comparisons drawn from the table itself, plus one note warning that the customer-concentration percentages are not measured on the same basis.

## Output

Build as a single self-contained HTML file, render with headless Chromium at deviceScaleFactor: 3 for a 3240×3240 PNG, and also emit a vector PDF at 1080×1080pt. Check the rendered image for text wrapping and overflow before delivering.
Output
When to use this prompt
- Comparing companies whose fiscal years do not line up, where a naive screen would compare different periods.
- Building a sector one-pager from filings rather than from a data vendor, with every figure traceable to a 10-K or 20-F.
- Checking capital intensity across business models, where fabless designers and fab owners sit in the same ranking.
What you get back
- Eleven companies ranked by revenue, each row carrying its own fiscal year end date, from NVIDIA at $215.9B down to Arm at $4.9B.
- Ratios computed against each company's own revenue rather than against a common base, so gross margin, R&D and capex stay comparable across very different sizes.
- The adjustments stated on the graphic itself: TSMC at the company's own convenience translation of NT$31.37 to the dollar, ASML converted at the ECB 2025 average, Qualcomm gross margin derived because it files no gross profit line, and Broadcom flagged as including $27.0B of infrastructure software.
- An explicit note that Samsung and SK hynix are absent because neither files with the SEC, rather than leaving a reader to assume the list is complete.
- Customer concentration with its basis attached, because the disclosures are not comparable. Broadcom's 32% is of revenue and 44% of receivables, Analog Devices reports its largest distributor rather than an end customer, ASML gives only a four-customer total of 61%, and AMD names no customer at 10% or more.
Variations
- Change the ticker list, or pass a SIC code and let the Mapping API resolve the constituents.
- Swap the metrics for inventory turns, deferred revenue or headcount.
- Run it once per year and diff the ranking to show how the order changed.
- Drop the customer column for a straight financial comparison, or keep only that column to screen for single-customer risk.
Filings used
- The most recent Form 10-K or 20-F for NVDA, TSM, AVGO, INTC, QCOM, MU, ASML, AMD, TXN, ADI and ARM, retrieved August 2026.
- Fiscal years ending between August 28, 2025 and March 31, 2026, each labelled on its own row.
- XBRL financial data from each filing, verified against the filing prose before use.
Related prompts
Track revenue backlog across the semiconductor industry over five quarters
Resolves all 25 US semiconductor companies through the Mapping API and pulls five quarters of Item 2.02 earnings press releases for each. None quantify revenue backlog, so the output charts accounts receivable instead, ranked across the industry and trended per company.
Turn a quarterly earnings release into a one-page graphic
Extracts headline figures, segment growth, the newest risk factor and forward guidance from a company's most recent earnings release, then renders a 1080 by 1080 graphic: one hero metric, a segment chart, six supporting tiles and two callouts. The prompt carries the full visual template, so the layout is identical across companies and quarters.