Cisco (CSCO), Financial Analysis
Insights derived from analysing SEC filings. Independent analysis, not a publication of the SEC.
- Revenue $18.52bn in Q1 FY2027 (quarter to 24 Oct 2026), +24.4% year on year, against +17.6% in Q4 FY2026; GAAP operating expenses fell 3.0% to $6.19bn. GAAP operating income $5.60bn (30.2% margin against 22.6%); diluted EPS $1.14 against $0.72. Non GAAP operating margin 37.8% and non GAAP EPS $1.40 (+40%).
- Networking product revenue $11.13bn, +43.3%, 60.1% of revenue; it supplied 93% of the $3.63bn revenue increase. Cisco raised its FY2027 expectation for AI infrastructure revenue from hyperscalers to $9bn from $7.5bn, against about $4bn in FY2026, after $9.3bn of such orders in FY2026.
- Security $2.12bn (+7.1%), Collaboration $1.14bn (+7.7%), Observability $279m (+1.8%) and Services $3.85bn (+1.2%). Listed security peers grew 20% to 34% in their latest quarters. RPO $46.2bn (+7.7%).
- GAAP gross margin 63.7% against 65.5%: product 61.8% against 64.5%, services 70.9% against 68.4%. Inventory rose to $6.38bn at 24 Oct 2026 from $3.40bn a year earlier; the FY2026 10-K reports inventory purchase commitments of $17.17bn, +126%, mainly for Cisco Silicon One products and memory.
- FY2027 guidance raised to revenue $74.8bn to $75.8bn (+18.9% at the midpoint on FY2026) and non GAAP EPS $5.47 to $5.53, from $72.2bn to $73.4bn and $5.05 to $5.11 on 12 Aug 2026; Q2 FY2027 revenue $18.0bn to $18.2bn. Q1 operating cash flow $4.36bn; $3.65bn returned through dividends and buybacks.
- Shares closed at $102.01 on 12 Nov 2026, before the release; P/E 27.1x TTM GAAP EPS of $3.76. Insiders sold $105.8m of stock in 12 months, $102.7m under Rule 10b5‑1 plans, with no open market purchases. Scenario prices three years forward on GAAP P/E: base $116, best $193, worst $55.
Figures are read from the filings of Cisco Systems, Inc. (central index key 858877): the Q1 FY2027 earnings release (8-K Ex 99.1 of 12 Nov 2026), the Forms 10-K for FY2024, FY2025 and FY2026, the Forms 10-Q for Q1 to Q3 FY2026, the Forms 8-K with all their exhibits, incl. the earnings releases for Q1 FY2026 to Q1 FY2027 with the guidance they contain, the Item 2.05 restructuring filing, the Item 5.02 director and officer filings and the Item 5.07 vote results, the 2026 proxy statement (DEF 14A of 29 Oct 2026), Forms 4, and the filings of the peers used in chapters 2 to 4 and 7. The Q1 FY2027 Form 10-Q was not on EDGAR on 13 Nov 2026, so Q1 FY2027 figures come from the release. Cisco files no separate CFO commentary document; CFO commentary is taken from the CFO statements and the guidance tables in the releases. Earnings call statements are not used. Share price $102.01 is the regular session close of 12 Nov 2026, before the release after the close. Accession numbers appear in the Sources appendix.
1 Revenue & Business Model
- Storyline: revenue growth rose from 8% in Q1 FY2026 to 24% in Q1 FY2027, led by networking sales for AI infrastructure and campus refresh, while security, collaboration, observability and services grew 1% to 8%. Chapters 2 to 4 cover the three revenue drivers: Networking; Security; Services, Observability and Collaboration.
- Cisco sells networking, security, collaboration and observability products and services, and manages the business by three geographic segments: Americas, EMEA and APJC. Customers include businesses, public institutions, governments and service providers incl. hyperscalers. The FY2026 10-K reports about 82,400 employees, 25,400 of them in sales and marketing.
- Revenue FY2022 $51.6bn, FY2024 $53.8bn, FY2026 $63.3bn (+11.8%); TTM Q1 FY2027 $67.0bn. Product revenue was $14.67bn in Q1 FY2027 (+32.4%), 79.2% of revenue against 74.4% a year earlier.
- Regions in Q1 FY2027: Americas $11.51bn (+28.0%), EMEA $4.46bn (+17.8%), APJC $2.56bn (+21.1%). GAAP gross margin by segment: Americas 64.1%, EMEA 68.9%, APJC 66.5%.
- AI infrastructure demand from hyperscalers was about 6% of FY2026 revenue against less than 2% in FY2025 (10-K FY2026). Software revenue was $23.2bn in FY2026 (+4%).


| Line | Q1 FY2025 | Q2 FY2025 | Q3 FY2025 | Q4 FY2025 | Q1 FY2026 | Q2 FY2026 | Q3 FY2026 | Q4 FY2026 | Q1 FY2027 |
|---|---|---|---|---|---|---|---|---|---|
| Revenue ($m) | 13,841 | 13,991 | 14,149 | 14,673 | 14,883 | 15,349 | 15,841 | 17,252 | 18,517 |
| Revenue growth year on year (%) | n/a | n/a | n/a | n/a | 7.5 | 9.7 | 12.0 | 17.6 | 24.4 |
| Networking ($m) | 6,753 | 6,850 | 7,068 | 7,633 | 7,768 | 8,294 | 8,815 | 9,791 | 11,132 |
| Networking growth year on year (%) | n/a | n/a | n/a | n/a | 15.0 | 21.1 | 24.7 | 28.3 | 43.3 |
| Security ($m) | 2,017 | 2,111 | 2,013 | 1,953 | 1,980 | 2,018 | 2,008 | 2,226 | 2,120 |
| Collaboration ($m) | 1,085 | 996 | 1,031 | 1,042 | 1,055 | 1,054 | 1,024 | 1,167 | 1,136 |
| Observability ($m) | 258 | 277 | 261 | 259 | 274 | 277 | 269 | 275 | 279 |
| Services ($m) | 3,727 | 3,757 | 3,775 | 3,787 | 3,806 | 3,707 | 3,724 | 3,793 | 3,850 |
| Non GAAP operating income ($m) | 4,721 | 4,861 | 4,880 | 5,029 | 5,119 | 5,311 | 5,412 | 6,198 | 7,007 |
| RPO ($bn) | 40.0 | 41.3 | 41.7 | 43.5 | 42.9 | 43.4 | 43.5 | 46.7 | 46.2 |
2 Networking: $11.13bn in Q1 FY2027, +43%, and a $9bn Hyperscaler AI Outlook for FY2027
- Networking product revenue $11.13bn in Q1 FY2027, +43.3%, after +15%, +21%, +25%, +28% in Q1 to Q4 FY2026; FY2026 $34.67bn (+22%). Networking was 60.1% of revenue against 52.2% a year earlier.
- AI infrastructure from hyperscalers (8-K Ex 99.1): orders of $1.3bn, $2.1bn and $5.3bn year to date by Q3 FY2026, then $4bn in Q4, $9.3bn for FY2026; revenue about $4bn in FY2026, expected $7.5bn in FY2027 (Aug 2026) and $9bn (Nov 2026).
- Product orders growth (releases): 13% in Q1, 18% in Q2, 35% in Q3 and 35% in Q4 FY2026; excluding hyperscalers 19% in Q3 and 25% in Q4. The Q1 FY2027 release states no orders figure.
- Supply build: the 10-K FY2026 ties the rise in inventory purchase commitments to $17.17bn to Cisco Silicon One products for hyperscalers and memory supply; the FY2026 MD&A credits AI infrastructure and campus networking for the 22% networking growth.
How networking demand is changing
- NVIDIA Data Center revenue $89.0bn in the Jul 2026 quarter, +117% (8-K Ex 99.2, 26 Aug 2026)
- Broadcom AI semiconductor revenue $16.7bn in the quarter to 2 Aug 2026, +221%, with $21.7bn guided for the next quarter (8-K, 2 Sep 2026)
- Arista revenue $3.66bn in Q3 2026, +58.5% (8-K Ex 99.1, 3 Nov 2026)
- HPE Data Center Networking revenue $382m in the quarter to 31 Jul 2026, +112.2%, largely from the Juniper acquisition of Jul 2025 (8-K, 2 Sep 2026)
- HPE expects Campus & Branch revenue to grow at a high single digit % CAGR through FY2029 with a Wi Fi 7 refresh (8-K, 30 Sep 2026)
- Cisco 10-K FY2026 risk factors: hyperscalers can design their own networking equipment and semiconductors or buy direct from contract manufacturers; customers choose a network architecture before products.


| Company | Line | Period | Revenue | Growth (%) | Margin (%) | Detail |
|---|---|---|---|---|---|---|
| Cisco | Networking product revenue | Q1 FY2027 | $11.13bn | 43.3 | n/a | no margin by product category |
| Arista Networks | Total revenue | Q3 2026 | $3.66bn | 58.5 | 44.9 | GAAP operating margin |
| HPE (incl. Juniper) | Networking segment revenue | quarter to 31 Jul 2026 | $2.90bn | 74.9 | 22.0 | segment operating margin; Campus & Branch $1.4bn (+31.0%) |
| NVIDIA | Data Center revenue | Jul 2026 quarter | $89.02bn | 117.0 | n/a | includes compute and networking; networking not reported separately |
| Broadcom | AI semiconductor revenue | quarter to 2 Aug 2026 | $16.70bn | 221.0 | 53.9 | custom accelerators and Ethernet switching silicon; company GAAP operating margin |
| Celestica | Connectivity & Cloud Solutions revenue | Q3 2026 | $4.87bn | 102.0 | 8.9 | segment margin; contract manufacturer of switches for hyperscalers |
| Ciena | Optical Networking revenue | quarter to 1 Aug 2026 | $1.19bn | 46.1 | 18.0 | company GAAP operating margin |
3 Security: $2.12bn, +7%, While Listed Security Peers Grow 20% to 34%
- Security product revenue $2.12bn in Q1 FY2027, +7.1%, after (2%), (4%), 0%, +14% in Q1 to Q4 FY2026. FY2026 $8.23bn (+2%) after $8.09bn in FY2025 and $5.08bn in FY2024; Splunk is included from Mar 2024.
- Share of revenue: security was 11.4% of Q1 FY2027 revenue against 13.3% a year earlier, as networking grew faster.
- Peers (latest 8-K releases): Palo Alto Networks +34%, CrowdStrike +26%, Zscaler +25% and Fortinet +20%; Fortinet product revenue +37%. Cisco's 10-K names CrowdStrike, Fortinet, Palo Alto Networks and Zscaler among its competitors.
- Acquisitions in security: Astrix Security (non human identity, Q4 FY2026) and WideField Security (Q1 FY2027).
How the security market is changing
- Palo Alto Networks next generation security ARR $9.10bn, +63%, and RPO $21.2bn, +34%, at 31 Jul 2026 (8-K Ex 99.1, 1 Sep 2026)
- CrowdStrike ARR $5.84bn, +25%, and Falcon Flex ARR $2.29bn, +101%, at 31 Jul 2026 (8-K Ex 99.1, 26 Aug 2026)
- Fortinet product revenue $765m in Q3 2026, +37%; billings $2.34bn, +29% (8-K Ex 99.1, 28 Oct 2026)
- Zscaler ARR $3.77bn, +25%, at 31 Jul 2026 (8-K Ex 99.1, 3 Sep 2026)
- Cisco 10-K FY2026 risk factors add AI tools that let attackers exploit vulnerabilities with little or no delay, and post quantum cryptography


| Company | Line | Period | Revenue | Growth (%) | Margin (%) | Detail |
|---|---|---|---|---|---|---|
| Cisco | Security product revenue | Q1 FY2027 | $2.12bn | 7.1 | n/a | includes Splunk security |
| Palo Alto Networks | Total revenue | Jul 2026 quarter | $3.41bn | 34.0 | 5.0 | GAAP operating margin |
| Fortinet | Total revenue | Q3 2026 | $2.08bn | 20.0 | 34.0 | GAAP operating margin; product revenue $765m (+37%) |
| CrowdStrike | Total revenue | Jul 2026 quarter | $1.47bn | 26.0 | (2.3) | GAAP operating margin; non GAAP 25% |
| Zscaler | Revenue | Jul 2026 quarter | $898m | 25.0 | (1.7) | GAAP operating margin; non GAAP 24%; growth 20% excluding Red Canary |
4 Services, Observability and Collaboration: $5.27bn, RPO $46.2bn and Services Margin 70.9%
- Services revenue $3.85bn in Q1 FY2027, +1.2%; FY2026 $15.03bn, flat. Services GAAP gross margin 70.9% against 68.4%.
- Observability $279m (+1.8%) and Collaboration $1.14bn (+7.7%). Together with services these lines were $5.27bn, 28.4% of revenue.
- RPO $46.2bn at 24 Oct 2026, +7.7%: product $23.4bn (+7%) and services $22.8bn (+9%). Deferred revenue $30.1bn (+7%).
- Software and subscription (10-K FY2026): software revenue $23.2bn (+4%) across all categories and services; subscription revenue +1%.
How software, observability and collaboration markets are changing
- Datadog revenue $1.20bn in Q3 2026, +35.2% (8-K Ex 99.1, 4 Nov 2026)
- Dynatrace revenue $580m in the Sep 2026 quarter, +17%; ARR $2.21bn, +16% (8-K Ex 99.1, 3 Nov 2026)
- Microsoft 365 commercial seat growth 5% in the Sep 2026 quarter (10-Q Q1 FY2027)
- Cisco 10-K FY2026: software revenue $23.2bn, +4%; subscription revenue +1%


| Company | Line | Period | Revenue | Growth (%) | Margin (%) | Detail |
|---|---|---|---|---|---|---|
| Cisco | Services revenue | Q1 FY2027 | $3.85bn | 1.2 | 70.9 | services GAAP gross margin |
| Cisco | Observability product revenue | Q1 FY2027 | $279m | 1.8 | n/a | includes Splunk observability |
| Cisco | Collaboration product revenue | Q1 FY2027 | $1.14bn | 7.7 | n/a | |
| Datadog | Total revenue | Q3 2026 | $1.20bn | 35.2 | 6.2 | GAAP operating margin |
| Dynatrace | Total revenue | Sep 2026 quarter | $580m | 17.0 | 31.8 | non GAAP operating margin; ARR $2.21bn |
| Microsoft | Microsoft 365 cloud revenue | Sep 2026 quarter | $27.78bn | 17.2 | n/a | collaboration competitor (Teams) |
5 Financial Analysis & Ratios
- GAAP operating margin TTM 26.3% against 24.3% in FY2026 and 20.8% in FY2025. Non GAAP operating income TTM $23.9bn (35.7% of revenue).
- Net income TTM $14.96bn (22.3% of revenue); diluted EPS TTM $3.76. Q4 FY2026 included $822m of other income, incl. $869m of gains on investments, and $511m of restructuring charges.
- Free cash flow TTM $13.73bn: operating cash flow $15.32bn less capex $1.59bn. Capex rose to $502m in Q1 FY2027 from $323m.
- Balance sheet at 24 Oct 2026: cash and investments $15.85bn; debt $29.80bn, of which short term $10.43bn; net debt $13.95bn; goodwill $59.5bn; deferred revenue $30.06bn; equity $51.61bn.
- Capital returns: TTM buybacks $6.11bn and dividends $6.59bn, 92% of TTM free cash flow. In Q1 FY2027 Cisco bought 18m shares at $112.38 on average; $6.1bn of authorization remains. Quarterly dividend $0.42.
| Line item | FY2022 | FY2023 | FY2024 | FY2025 | FY2026 | TTM Q1 FY2027 |
|---|---|---|---|---|---|---|
| Revenue | 51.6 | 57.0 | 53.8 | 56.7 | 63.3 | 67.0 |
| Gross profit | 32.2 | 35.8 | 34.8 | 36.8 | 40.9 | 42.9 |
| Research and development | 6.8 | 7.6 | 8.0 | 9.3 | 9.6 | 9.6 |
| Selling, general and administrative | 11.2 | 12.4 | 13.2 | 14.0 | 14.3 | 14.3 |
| Operating income | 14.0 | 15.0 | 12.2 | 11.8 | 15.4 | 17.6 |
| Net income | 11.8 | 12.6 | 10.3 | 10.2 | 13.3 | 15.0 |
| Diluted EPS ($) | 2.82 | 3.07 | 2.54 | 2.55 | 3.33 | 3.76 |
| Operating cash flow | 13.2 | 19.9 | 10.9 | 14.2 | 14.2 | 15.3 |
| Capital expenditure | (0.5) | (0.8) | (0.7) | (0.9) | (1.4) | (1.6) |
| Free cash flow | 12.7 | 19.0 | 10.2 | 13.3 | 12.8 | 13.7 |
| Stock based compensation | 1.9 | 2.4 | 3.1 | 3.6 | 3.8 | 3.7 |
| Cash and investments | n/a | 26.1 | 17.9 | 16.1 | 15.9 | 15.8 |
| Total debt | n/a | 8.4 | 31.0 | 28.1 | 29.5 | 29.8 |
| Total equity | 39.8 | 44.4 | 45.5 | 46.8 | 50.3 | 51.6 |

| Metric | Q1 FY2026 | Q1 FY2027 | Change |
|---|---|---|---|
| Revenue ($bn) | 14.88 | 18.52 | 24.4% |
| Gross profit ($bn) | 9.75 | 11.79 | 21.0% |
| Operating income ($bn) | 3.36 | 5.60 | 66.5% |
| Net income ($bn) | 2.86 | 4.55 | 59.2% |
| Diluted EPS ($) | 0.72 | 1.14 | 58.3% |
| Operating cash flow ($bn) | 3.21 | 4.36 | 35.6% |
| Free cash flow ($bn) | 2.89 | 3.86 | 33.4% |
| Operating margin (%) | 22.6 | 30.2 | 7.6 pts |
| Net margin (%) | 19.2 | 24.6 | 5.4 pts |
| Ratio | FY2022 | FY2023 | FY2024 | FY2025 | FY2026 | TTM Q1 FY2027 |
|---|---|---|---|---|---|---|
| Growth and margins | ||||||
| Revenue growth (%) | n/a | 10.6 | (5.6) | 5.3 | 11.8 | n/a |
| Gross margin (%) | 62.5 | 62.7 | 64.7 | 64.9 | 64.5 | 64.1 |
| Operating margin (%) | 27.1 | 26.4 | 22.6 | 20.8 | 24.3 | 26.3 |
| Net margin (%) | 22.9 | 22.1 | 19.2 | 18.0 | 21.0 | 22.3 |
| FCF margin (%) | 24.7 | 33.4 | 19.0 | 23.5 | 20.2 | 20.5 |
| Cost and investment intensity | ||||||
| R&D (%) revenue | 13.1 | 13.2 | 14.8 | 16.4 | 15.1 | 14.3 |
| SBC (%) revenue | 3.7 | 4.1 | 5.7 | 6.4 | 6.0 | 5.5 |
| Capex (%) revenue | 0.9 | 1.5 | 1.2 | 1.6 | 2.2 | 2.4 |
| Effective tax rate (%) | 18.4 | 17.7 | 15.6 | 8.3 | 17.1 | 17.4 |
| Returns | ||||||
| ROE (%) | 29.7 | 30.0 | 23.0 | 22.1 | 27.3 | 29.0 |
| ROA (%) | n/a | 12.4 | 9.1 | 8.3 | 10.5 | 11.6 |
| ROIC (%) | 28.7 | 46.5 | 17.5 | 18.3 | 19.9 | 22.2 |
| Asset turnover (x) | n/a | 0.56 | 0.43 | 0.46 | 0.49 | 0.52 |
| Liquidity and leverage | ||||||
| Current ratio (x) | n/a | 1.38 | 0.91 | 1.00 | 0.93 | 0.96 |
| Debt to equity (x) | n/a | 0.19 | 0.68 | 0.60 | 0.59 | 0.58 |
| Net cash ($bn) | n/a | 17.8 | (13.1) | (12.0) | (13.6) | (14.0) |
| Efficiency and cash quality | ||||||
| Days sales outstanding | n/a | 37 | 45 | 43 | 43 | 32 |
| Inventory days | n/a | 63 | 65 | 58 | 93 | 97 |
| Shareholder returns (%) FCF | 109 | 56 | 119 | 94 | 99 | 92 |


| Measure | Value |
|---|---|
| Market cap ($bn) | 402.2 |
| Enterprise value ($bn) | 416.2 |
| P/E (TTM) (x) | 27.1 |
| EV/Sales (TTM) (x) | 6.2 |
| EV/EBITDA (TTM) (x) | 20.7 |
| FCF yield (%) | 3.4 |
| Price/Book (x) | 7.8 |
Cost structure and profitability
- GAAP gross margin 63.7% in Q1 FY2027 against 65.5%, with gross profit +21.0% against revenue +24.4%; GAAP operating margin +7.6 pts year on year and +5.5 pts on Q4 FY2026.
- Cost of sales 36.3% of revenue against 34.5%: product cost of sales rose +43% against product revenue +32%; services cost of sales fell 7.1%.
- GAAP operating expenses fell 3.0% to $6.19bn: research and development $2.42bn (+1.0%), sales and marketing $2.83bn (down 1.4%), general and administrative $717m (down 2.2%); restructuring $28m against $147m.
- GAAP to non GAAP gap: 7.6 pts of margin in Q1 FY2027 against 11.8 pts a year earlier; stock based compensation 4.9% of revenue against 7.1%.


| Line | Q1 FY2026 | Q2 FY2026 | Q3 FY2026 | Q4 FY2026 | Q1 FY2027 |
|---|---|---|---|---|---|
| Cost of sales (% of revenue) | 34.5 | 35.0 | 36.4 | 35.9 | 36.3 |
| Research and development (% of revenue) | 16.1 | 15.3 | 15.0 | 14.1 | 13.1 |
| Sales and marketing (% of revenue) | 19.3 | 18.8 | 18.0 | 17.1 | 15.3 |
| General and administrative (% of revenue) | 4.9 | 4.5 | 4.2 | 3.9 | 3.9 |
| Amortization of purchased intangibles (% of revenue) | 1.6 | 1.5 | 1.4 | 1.3 | 1.0 |
| Restructuring and other charges (% of revenue) | 1.0 | 0.2 | 0.0 | 3.0 | 0.2 |
| Stock based compensation (incl. in lines above) (% of revenue) | 7.1 | 6.1 | 5.8 | 5.4 | 4.9 |
| Operating income (% of revenue) | 22.6 | 24.6 | 25.0 | 24.7 | 30.2 |
| Non GAAP operating income (% of revenue) | 34.4 | 34.6 | 34.2 | 35.9 | 37.8 |
| Line | Q1 FY2026 | Q1 FY2027 | Change |
|---|---|---|---|
| Revenue | 14,883 | 18,517 | 3,634 |
| Gross profit | 9,745 | 11,788 | 2,043 |
| Operating expenses | (6,382) | (6,190) | 192 |
| Operating income | 3,363 | 5,598 | 2,235 |
| Interest and other income, net | 28 | (103) | (131) |
| Income taxes | (531) | (943) | (412) |
| Net income | 2,860 | 4,552 | 1,692 |
Inventory, purchase commitments and debt
- Inventory $6.38bn at 24 Oct 2026, against $3.16bn at 26 Jul 2025 and $5.69bn at 25 Jul 2026; inventories absorbed $686m of operating cash flow in Q1 FY2027.
- Inventory purchase commitments $17.17bn at 25 Jul 2026 against $7.60bn; inventory deposits and prepayments $1.10bn against $0.83bn. The 10-K links the increase to Cisco Silicon One products for hyperscalers and to agreements securing memory supply and pricing.
- Debt $29.80bn at 24 Oct 2026 (short term $10.43bn, long term $19.37bn) against $28.09bn at 26 Jul 2025; cash and investments $15.85bn. Interest expense $368m in Q1 FY2027 against interest income $234m.

6 MD&A & Management Commentary
Q1 FY2027 results: 8-K Ex 99.1 of 12 Nov 2026
- Revenue $18.52bn, +24.4% year on year and +7.3% on Q4 FY2026; product +32.4%, services +1.2%. Americas +28.0%, EMEA +17.8%, APJC +21.1%.
- Profit lines: GAAP operating income $5.60bn against $3.36bn (+66%); non GAAP operating income $7.01bn against $5.12bn; net income $4.55bn against $2.86bn; GAAP tax rate 17.2%, non GAAP 18.5%.
- Costs: GAAP operating expenses $6.19bn, (3.0%), 33.4% of revenue against 42.9%. Stock based compensation $911m against $1.06bn; amortization of purchased intangibles $191m; restructuring $28m.
- Balance sheet items: inventory $6.38bn against $5.69bn at 25 Jul 2026; RPO $46.2bn (product +7%, services +9%); deferred revenue $30.1bn (+7.5%).
- Cash: operating cash flow $4.36bn (+36%); capex $502m; debt issued $5.19bn and repaid $6.01bn; short term borrowings +$1.11bn. Acquisition: WideField Security.
| Item | Outlook | Source |
|---|---|---|
| Q2 FY2027 revenue | $18.0bn to $18.2bn; Q2 FY2026 actual $15.35bn | 8-K Ex 99.1, 12 Nov 2026 |
| Q2 FY2027 non GAAP gross and operating margin | 65% to 66%; 36% to 37% (GAAP operating margin 27% to 28%) | 8-K Ex 99.1, 12 Nov 2026 |
| Q2 FY2027 EPS | non GAAP $1.34 to $1.36; GAAP $1.07 to $1.09 | 8-K Ex 99.1, 12 Nov 2026 |
| FY2027 revenue | $74.8bn to $75.8bn (12 Aug 2026: $72.2bn to $73.4bn); Q2 to Q4 implied $56.3bn to $57.3bn | 8-K Ex 99.1; derived |
| FY2027 non GAAP EPS | $5.47 to $5.53 (12 Aug 2026: $5.05 to $5.11); FY2026 actual $4.33 | 8-K Ex 99.1 |
| FY2027 GAAP EPS | $4.38 to $4.44 (12 Aug 2026: $4.00 to $4.06); FY2026 actual $3.33 | 8-K Ex 99.1 |
| FY2027 AI infrastructure revenue from hyperscalers | $9bn, more than double FY2026 (12 Aug 2026: $7.5bn); FY2026 about $4bn | 8-K Ex 99.1, 12 Aug and 12 Nov 2026 |
| FY2026 revenue guidance path | $60.2bn to $61.0bn (Nov 2025), $61.2bn to $61.7bn (Feb 2026), $62.8bn to $63.0bn (May 2026); actual $63.33bn | 8-K Ex 99.1 releases |
| Restructuring | plan of 13 May 2026 with charges up to $1bn; FY2027 GAAP EPS guidance includes $0.11 for it | 8-K Item 2.05; 8-K Ex 99.1 |
Management and CFO commentary
- Cisco files no separate CFO commentary document; the points below come from the CFO and CEO statements and guidance tables in the releases filed as 8-K Ex 99.1.
- Q1 FY2027 release (12 Nov 2026), CFO Mark Patterson: revenue, non GAAP operating margin and non GAAP EPS all above the high end of guidance; FY2027 revenue and non GAAP EPS guidance raised; earnings growing faster than revenue.
- Q1 FY2027 release, CEO Chuck Robbins: revenue and non GAAP EPS growth the highest for Cisco in over 15 years. The release summary reports double digit growth across all geographies and customer markets.
- Q4 FY2026 release (12 Aug 2026): Q4 product orders +35%; FY2026 productivity measured by revenue, non GAAP operating margin and earnings per employee the highest in 30 years (CFO).
- Q3 FY2026 release (13 May 2026): FY2026 AI infrastructure orders expectation raised to $9bn from $5bn and revenue to $4bn from $3bn; restructuring plan announced the same day.
| Speaker | Date and source | Statement |
|---|---|---|
| Mark Patterson, CFO | 12 Nov 2026, 8-K Ex 99.1 | “Q1 FY27 was another record quarter for Cisco” |
| Mark Patterson, CFO | 12 Nov 2026, 8-K Ex 99.1 | “we remain focused on delivering durable growth and driving continued capital returns” |
| Chuck Robbins, Chair and CEO | 13 May 2026, 8-K Ex 99.1 | “Cisco delivered record quarterly revenue in Q3” |
| Item | Disclosure |
|---|---|
| 10-K FY2026, Item 7 | AI infrastructure demand from hyperscalers was about 6% of FY2026 revenue against less than 2% in FY2025; software revenue $23.2bn (+4%); subscription revenue +1%. |
| 10-K FY2026, Item 7 | Inventory $5.69bn (+80%) and inventory purchase commitments $17.17bn (+126%) at 25 Jul 2026, mainly for Cisco Silicon One products for hyperscalers and memory supply; $14.34bn due within one year. |
| 10-K FY2026, Item 7 | Product gross margin (0.5) pts in FY2026 on product mix and higher memory costs; provisions for inventory and purchase commitments $387m against $493m. |
| 10-K FY2026, Item 1 | About 82,400 employees at 25 Jul 2026, of which about 25,400 in sales and marketing; three geographic segments; four product categories. |
| 10-K FY2026, Item 7 | Goodwill $59.5bn with no impairment; fair value above carrying value by $64.7bn (Americas), $88.6bn (EMEA) and $33.7bn (APJC). Effective tax rate 17.1% (FY2025 8.3%). |
| 10-K FY2026, Item 7 | Total debt $29.53bn and cash and investments $15.92bn at 25 Jul 2026; other purchase obligations $7.04bn. |
| 10-Q Q1 FY2027 | Not on EDGAR on 13 Nov 2026; notes on purchase commitments, legal matters and risk factor updates for the quarter are not yet available. |
7 Peer Valuation & Sector Summary
- Sector: networking, security and observability equipment and software. The FY2026 10-K names Arista, Broadcom, Ciena, CrowdStrike, Datadog, Dell, Dynatrace, Fortinet, HPE, Huawei, Microsoft, Nokia, NVIDIA, Palo Alto Networks, Zoom and Zscaler, among others, as competitors.
- Growth, latest period year on year: ANET 58.5%, DDOG 35.2%, PANW 34.0%, HPE 30.8% (9M FY2026, incl. Juniper), CRWD 25.8%, CSCO 24.4%.
- GAAP operating margin TTM: ANET 43.8%, CSCO 26.3%, HPE 6.2%, PANW 6.1%, DDOG 2.3%, CRWD (2.5%).
- Valuation, EV/Sales TTM: CRWD 42.8x, PANW 22.5x, ANET 20.7x, DDOG 14.5x, CSCO 6.2x, HPE 1.9x. P/E: ANET 54.8x, CSCO 26.9x, HPE 23.7x.
| Company | Revenue TTM ($bn) | Revenue growth (%) | Gross margin (%) | Operating margin (%) | Net margin (%) | FCF margin (%) | ROE (%) | Net cash ($bn) | Market value ($bn) | EV/Sales (x) | P/E TTM (x) |
|---|---|---|---|---|---|---|---|---|---|---|---|
| CSCO | 67.0 | 24.4 | 64.1 | 26.3 | 22.3 | 20.5 | 29.0 | (14.0) | 402 | 6.2 | 27.1 |
| ANET | 11.9 | 58.5 | 62.9 | 43.8 | 40.0 | 42.2 | 28.9 | 14.4 | 261 | 20.7 | 54.8 |
| HPE | 41.9 | 30.8 | 37.9 | 6.2 | 6.7 | 9.9 | 10.5 | (14.0) | 67 | 1.9 | 23.7 |
| PANW | 11.5 | 34.0 | 70.4 | 6.1 | 2.7 | 35.8 | 1.7 | 6.1 | 264 | 22.5 | n/a |
| CRWD | 5.4 | 25.8 | 75.2 | (2.5) | 0.8 | 28.3 | 1.1 | 4.3 | 235 | 42.8 | n/a |
| DDOG | 4.3 | 35.2 | 79.6 | 2.3 | 6.1 | 25.9 | 6.4 | 4.3 | 66 | 14.5 | 253.7 |

8 Material Events & Contracts
- Nine Forms 8-K from 12 Nov 2025 to 12 Nov 2026: five earnings releases, the restructuring plan (Item 2.05), the 2025 annual meeting results with the amended stock plan, and three director or officer changes.
- Restructuring (8-K Item 2.05, 13 May 2026): pre tax charges up to $1bn, mainly severance and other cash costs, to shift investment to silicon, optics, security and AI; about $450m in Q4 FY2026 and the rest in FY2027. Restructuring charges were $511m in Q4 FY2026 and $28m in Q1 FY2027.
- Board and officers: Daniel Schulman left the board on 21 May 2026 after becoming CEO of Verizon; Peter Shimer joined on 6 Apr 2026 and Girish Rishi on 9 Oct 2026; Nichlas Fink succeeded Victoria Wong as Chief Accounting Officer on 20 May 2026.
- Acquisitions closed: NeuralFabric and EzDubs (Q2 FY2026), Galileo and Astrix Security (Q4 FY2026), WideField Security (Q1 FY2027); no amounts stated in the releases. Cash paid for acquisitions was $516m in FY2026 and $113m in Q1 FY2027.
| Date | Items | Event |
|---|---|---|
| 12 Nov 2025 | 2.02, 9.01 | Q1 FY2026 results (Ex 99.1): revenue $14.88bn (+8%), product orders +13%, AI infrastructure orders from hyperscalers $1.3bn |
| 17 Dec 2025 | 5.02, 5.07, 9.01 | Annual meeting of 16 Dec 2025: nine directors elected; stock plan amended with 57.49m added shares (Ex 10.1); say on pay approved; stockholder proposal rejected |
| 11 Feb 2026 | 2.02, 9.01 | Q2 FY2026 results (Ex 99.1): revenue $15.35bn (+10%), AI infrastructure orders $2.1bn, dividend raised to $0.42 |
| 6 Apr 2026 | 5.02 | Director Daniel Schulman to resign effective 21 May 2026 after becoming CEO of Verizon; Peter Shimer appointed director and Audit Committee member |
| 1 May 2026 | 5.02 | Chief Accounting Officer Victoria Wong to retire 19 May 2026; Nichlas Fink appointed from 20 May 2026 with a $500,000 RSU award |
| 13 May 2026 | 2.02, 2.05, 9.01 | Q3 FY2026 results (Ex 99.1): revenue $15.84bn (+12%), product orders +35%; restructuring plan with pre tax charges up to $1bn |
| 12 Aug 2026 | 2.02, 9.01 | Q4 and FY2026 results (Ex 99.1): FY2026 revenue $63.33bn (+12%); AI infrastructure orders $9.3bn in FY2026; FY2027 revenue guidance $72.2bn to $73.4bn |
| 9 Oct 2026 | 5.02 | Girish Rishi, CEO of Cognite, appointed director effective 9 Oct 2026 |
| 12 Nov 2026 | 2.02, 9.01 | Q1 FY2027 results (Ex 99.1): revenue $18.52bn (+24%), FY2027 guidance raised to $74.8bn to $75.8bn, AI infrastructure revenue expectation $9bn |
| Contract | Terms |
|---|---|
| Inventory purchase commitments | $17.17bn at 25 Jul 2026 against $7.60bn a year earlier; $14.34bn due within one year, $2.56bn in one to three years; includes long term supply agreements for memory with variable pricing (10-K FY2026). |
| Other purchase obligations | $7.04bn at 25 Jul 2026, of which $2.46bn due within one year (10-K FY2026). |
| 2005 Stock Incentive Plan | Amended and restated on 16 Dec 2025, adding 57,490,000 shares; term to the 2030 annual meeting (8-K Ex 10.1). |
| Share repurchase program | $6.1bn remaining at 24 Oct 2026 with no termination date; 18m shares bought for $2.0bn in Q1 FY2027 (8-K Ex 99.1). |
9 Ownership, Voting Power & Annual Meeting
- One class of common stock with one vote per share. BlackRock 8.9%, Vanguard Capital Management 7.2% and State Street 5.0% are the holders of 5% or more listed in the 2026 proxy statement (27 Aug 2026).
- Annual meeting of 16 Dec 2025 (Item 5.07): all nine directors elected; Charles Robbins received 90.9% of votes cast; say on pay 89.0%; the amended stock plan approved; a stockholder proposal on a report about inclusion programs received about 1% of votes cast.
- 2026 annual meeting on 15 Dec 2026 (proxy of 29 Oct 2026): election of directors, say on pay, auditor ratification and two stockholder proposals, on a report about charitable support and on a human rights impact assessment; the board recommends against both. CEO FY2026 total compensation $48.5m, a CEO pay ratio of 217 to 1.
- Insiders, Form 4 transactions 14 Nov 2025 to 10 Nov 2026: no open market purchases; sales of $105.8m, of which $102.7m under Rule 10b5‑1 plans. Charles Robbins sold 665,005 shares for $53.4m; sale prices ranged from $74.12 to $122.44.
| Proposal | For (bn votes) | Against (bn votes) | Abstain (bn votes) | For as % of votes cast | Result |
|---|---|---|---|---|---|
| Election of Michael D. Capellas | 2.664 | 0.230 | 0.005 | 92.1 | Elected |
| Election of Charles H. Robbins | 2.621 | 0.262 | 0.015 | 90.9 | Elected |
| Election of Daniel H. Schulman | 2.588 | 0.268 | 0.042 | 90.6 | Elected |
| Election of Sarah Rae Murphy | 2.886 | 0.008 | 0.004 | 99.7 | Elected |
| Amended 2005 Stock Incentive Plan | 2.790 | 0.094 | 0.015 | 96.7 | Approved |
| Say on pay (advisory) | 2.550 | 0.315 | 0.034 | 89.0 | Approved |
| Ratify PricewaterhouseCoopers | 3.035 | 0.285 | 0.005 | 91.4 | Approved |
| Stockholder proposal: report on inclusion programs | 0.030 | 2.827 | 0.042 | 1.1 | Rejected |
Annual meeting remarks
- No management remarks, presentation or shareholder questions from the meeting of 16 Dec 2025 were filed; the Item 5.07 filing reports vote counts only.
| Holder | Shares (m) | Share of class (%) | Basis |
|---|---|---|---|
| BlackRock, Inc. | 351.1 | 8.9 | 13G filed 25 Jan 2024 |
| Vanguard Capital Management | 283.8 | 7.2 | 13G filed 29 Apr 2026 |
| State Street Corporation | 197.4 | 5.0 | 13G filed 7 Aug 2026 |
| Person | Shares sold | Value ($m) |
|---|---|---|
| Charles Robbins, Chair and CEO | 665,005 | 53.44 |
| Jeetendra Patel, President and CPO | 189,483 | 15.26 |
| Deborah Stahlkopf, EVP and Chief Legal Officer | 185,658 | 14.95 |
| Mark Patterson, EVP and CFO | 93,704 | 8.02 |
| Thimaya Subaiya, EVP Operations | 83,031 | 7.01 |
| Oliver Tuszik, EVP Global Sales | 30,733 | 2.74 |
| Michael Capellas, director | 27,000 | 2.08 |
| Kristina Johnson, director | 13,481 | 1.04 |
| Victoria Wong, former Chief Accounting Officer | 13,010 | 1.00 |
10 Risk Factors
- Item 1A of the FY2026 10-K holds 38 risk factors, the same number as the FY2025 10-K (13,062 words against 13,245). No factor was added or removed; 22 were reworded under the similarity test. The changes add hyperscaler concentration, memory supply and cost, AI driven competition and AI driven exploitation of vulnerabilities. The Q1 FY2027 10-Q, which would carry any update, was not filed on 13 Nov 2026.
| Risk | Disclosure and change |
|---|---|
| Hyperscaler concentration | Heading now names AI infrastructure sales to large cloud and hyperscaler customers; demand depends on a limited number of customers' capital spending; hyperscaler AI demand was about 6% of FY2026 revenue and $9bn of such revenue is expected in FY2027. |
| Supply and purchase commitments | Inventory purchase commitments $17.17bn (+126%) and inventory $5.69bn (+80%) at 25 Jul 2026; inventory $6.38bn at 24 Oct 2026; factor names the fiscal 2026 memory shortages and higher deposits and prepayments to suppliers. |
| Gross margin | Product gross margin 61.8% in Q1 FY2027 against 64.5%; the factor adds growth in lower margin markets and amortization of acquired intangibles. |
| Competition | Adds semiconductor companies, systems providers and cloud providers as competitors in AI infrastructure, and hyperscalers designing their own networking equipment and semiconductors. |
| Security vulnerabilities | Adds AI tools that let attackers exploit flaws with little or no delay and the need to adopt post quantum cryptography. |
| Restructuring | Plan of 13 May 2026 with charges up to $1bn; $511m in Q4 FY2026 and $28m in Q1 FY2027. |
| Taxes | GAAP effective tax rate 17.1% in FY2026 against 8.3% in FY2025; the OECD Pillar Two paragraph was removed from the factor. |
How risk factors changed
- Comparison: 10-K FY2026 filed 2 Sep 2026 acc 0000858877-26-000132 against 10-K FY2025 filed 3 Sep 2025 acc 0000858877-25-000111.
- 'AI' appears 36 times in 13 of 38 risk factors in the FY2026 10-K, against 20 times in 8 factors a year earlier.
- Hyperscalers are named in 4 risk factors (6 mentions) against none in the FY2025 10-K, covering concentration, competition and supply commitments.
- Memory supply and cost is named in 2 factors, incl. the memory shortages of fiscal 2026, against 1 factor a year earlier.
- New exposures named: agentic AI systems, AI driven exploitation of vulnerabilities and post quantum cryptography.
- Removed passages: OECD Pillar Two minimum tax and the Aug 2025 supplier settlement example.

| Measure | 10-K FY2025 | 10-K FY2026 |
|---|---|---|
| Risk factors (count) | 38 | 38 |
| Words in Item 1A | 13,245 | 13,062 |
| Change | Risk factor | What changed |
|---|---|---|
| Reworded | Results may fluctuate | Lists the timing, size and mix of orders from hyperscaler and cloud customers and lead time management as drivers of fluctuation; adds that results are not a reliable indicator of future results. |
| Reworded | Economic and geopolitical conditions | Text shortened; adds that conditions in one customer market or segment can affect results in that segment; 'operating results' replaced by 'results of operations'. |
| Reworded | Revenue hard to predict | Adds component shortages to the causes of order timing shifts; text shortened from 679 to 485 words. |
| Reworded | Supply chain and component supply | Names the memory shortages of fiscal 2026 and rising costs of constrained memory components; adds higher inventory deposits and prepayments with contract manufacturers and suppliers and expected higher purchase commitments in fiscal 2027. |
| Reworded | Gross margin may vary | Adds growth in lower margin markets with different pricing and cost structures, and increased amortization of acquired intangibles, as margin factors. |
| Reworded | Service provider, cloud and AI infrastructure sales | Heading now names AI infrastructure sales to large cloud and hyperscaler customers; adds that demand depends on a limited number of customers' capital spending, deployment timing and decisions to buy from other vendors or develop in house; text grows from 422 to 582 words. |
| Reworded | Competition | Adds AI and cloud infrastructure markets where customers pick a network architecture before products, competitors incl. semiconductor companies and cloud providers, and hyperscalers designing their own networking equipment and semiconductors or buying direct from contract manufacturers; 572 to 726 words. |
| Reworded | Acquisitions | Wording updated; adds assumed liabilities and intellectual property litigation to acquisition risks. |
| Reworded | New markets | Text shortened; adds a closing sentence that failure to manage these risks could harm results. |
| Reworded | Strategic alliances | Text shortened and reordered; no new exposure named. |
| Reworded | Product quality | Adds a cross reference to the cybersecurity risk factors. |
| Reworded | Global operations | Adds government shutdowns and environmental regulations incl. climate change laws to the list of country risks; text shortened from 338 to 219 words. |
| Filing | Change disclosed |
|---|---|
| 10-Q Q1 FY2027 (quarter to 24 Oct 2026) | Not filed on EDGAR by 13 Nov 2026; no Form 10-Q Part II Item 1A update exists after the FY2026 10-K. |
11 Stock Price, Scenarios & Sensitivity
- CSCO closed at $102.01 on 12 Nov 2026, before the Q1 FY2027 release after the close. 52 week closing high $130.00 and closing low $73.35; the close is 21.5% below the 52 week closing high. Highest month end close in five years $120.42 in May 2026.
- Valuation: market value $402.2bn on 3.94bn shares (27 Aug 2026, 10-K cover); enterprise value $416.2bn incl. net debt of $13.95bn. P/E 27.1x TTM GAAP EPS and 21.6x TTM non GAAP EPS of $4.72; EV/Sales 6.2x.
- Scenario method: implied price equals TTM Q1 FY2030 GAAP EPS times an exit P/E. EPS is revenue times GAAP operating margin, less $500m a year of net interest and other expense, taxed at 17%, over 3.88bn shares (3.94bn less 1.5% for buybacks net of stock awards). Revenue grows from TTM Q1 FY2027 $67.0bn for three years.

Critical factors and core assumptions
| Factor | Current value | Best case requires | Evidence in filings |
|---|---|---|---|
| AI infrastructure revenue from hyperscalers | about $4bn in FY2026; $9bn expected in FY2027 | further growth beyond FY2027 | 8-K Ex 99.1, 12 Aug and 12 Nov 2026 |
| Networking growth | +43.3% in Q1 FY2027 | double digit growth after FY2027 | 8-K Ex 99.1; product orders +35% in Q3 and Q4 FY2026 |
| Product gross margin | 61.8% GAAP (Q1 FY2026 64.5%) | memory costs ease and pricing holds | 10-K FY2026 MD&A: product mix and memory costs |
| Security growth | +7.1% in Q1 FY2027 | growth near the 20% to 34% of listed peers | 8-K Ex 99.1 of Cisco and peers |
| Purchase commitments | $17.17bn at 25 Jul 2026 | converted to revenue without write downs | 10-K FY2026; provisions $387m in FY2026 |
| GAAP margin gap | GAAP 30.2% against non GAAP 37.8% in Q1 FY2027 | lower amortization and restructuring | 8-K Ex 99.1, GAAP to non GAAP tables |
- Revenue base TTM Q1 FY2027 $67.0bn; FY2027 guidance $74.8bn to $75.8bn; GAAP operating margin TTM 26.3% and Q1 FY2027 30.2%.
- Best case: 14% revenue CAGR as AI infrastructure revenue keeps rising after FY2027 and campus refresh continues; GAAP operating margin 33%; exit P/E 28x, near today's 27.1x.
- Base case: 9% revenue CAGR, with FY2027 near guidance and slower growth after; GAAP operating margin 29%; exit P/E 22x.
- Worst case: 3% revenue CAGR as hyperscaler purchases pause after FY2027 and memory costs stay high; GAAP operating margin 24%; exit P/E 15x.
- Shares down 1.5% from 3.94bn through buybacks net of stock awards; dividends excluded from implied prices.
Scenarios, three years forward
| Measure | Worst case | Base case | Best case |
|---|---|---|---|
| Revenue CAGR, 3 years (%) | 3.0 | 9.0 | 14.0 |
| Revenue, TTM Q1 FY2030 ($bn) | 73.2 | 86.7 | 99.2 |
| Operating margin, TTM Q1 FY2030 (%) | 24.0 | 29.0 | 33.0 |
| Net income, TTM Q1 FY2030 ($bn) | 14.2 | 20.5 | 26.8 |
| EPS, TTM Q1 FY2030 ($) | 3.65 | 5.27 | 6.89 |
| Exit P/E (x) | 15.0 | 22.0 | 28.0 |
| Implied price ($) | 55 | 116 | 193 |
| Change against $102.01 (%) | (46) | 14 | 89 |
| Implied annual return (%) | (18.8) | 4.3 | 23.7 |
| Description | Hyperscaler pause, memory costs high | FY2027 near guidance, slower after | AI revenue keeps rising after FY2027 |

Sensitivity analysis
| Revenue CAGR \ Operating margin | 24% | 27% | 29% | 31% | 33% |
|---|---|---|---|---|---|
| 3% | $80 | $91 | $97 | $104 | $111 |
| 6% | $88 | $99 | $106 | $114 | $121 |
| 9% | $96 | $108 | $116 | $124 | $132 |
| 12% | $104 | $117 | $126 | $135 | $144 |
| 14% | $110 | $124 | $133 | $142 | $152 |
| Exit P/E \ Operating margin | 24% | 27% | 29% | 31% | 33% |
|---|---|---|---|---|---|
| 15x | $65 | $73 | $79 | $85 | $90 |
| 18x | $78 | $88 | $95 | $101 | $108 |
| 22x | $96 | $108 | $116 | $124 | $132 |
| 25x | $109 | $122 | $132 | $141 | $150 |
| 28x | $122 | $137 | $147 | $158 | $168 |
Disclaimer
This analysis is for information only and is not financial advice. It is derived from public SEC filings retrieved via sec-api.io and is not a publication of the U.S. Securities and Exchange Commission. Scenario values are model outputs under stated assumptions and are not forecasts. Data as of 13 November 2026.
Sources
All company and peer figures are read from SEC filings retrieved through the sec-api.io MCP server. Share prices are regular session closes as dated in the text.
| Form | Period | Filed | Accession number |
|---|---|---|---|
| 8-K Ex 99.1 | Q1 FY2027 | 12 Nov 2026 | 0000858877-26-000170 |
| DEF 14A | 2026 annual meeting | 29 Oct 2026 | 0001308179-26-000439 |
| 8-K Item 5.02 | Oct 2026 | 9 Oct 2026 | 0000858877-26-000156 |
| 10-K | FY2026 | 2 Sep 2026 | 0000858877-26-000132 |
| 8-K Ex 99.1 | Q4 FY2026 | 12 Aug 2026 | 0000858877-26-000106 |
| 10-Q | Q3 FY2026 | 19 May 2026 | 0000858877-26-000078 |
| 8-K Ex 99.1, Item 2.05 | Q3 FY2026 | 13 May 2026 | 0000858877-26-000075 |
| 8-K Item 5.02 | Apr 2026 | 1 May 2026 | 0000858877-26-000057 |
| 8-K Item 5.02 | Mar 2026 | 6 Apr 2026 | 0000858877-26-000048 |
| 10-Q | Q2 FY2026 | 17 Feb 2026 | 0000858877-26-000021 |
| 8-K Ex 99.1 | Q2 FY2026 | 11 Feb 2026 | 0000858877-26-000006 |
| 8-K Items 5.02, 5.07, Ex 10.1 | 2025 annual meeting | 17 Dec 2025 | 0000858877-25-000199 |
| 10-Q | Q1 FY2026 | 18 Nov 2025 | 0000858877-25-000171 |
| 8-K Ex 99.1 | Q1 FY2026 | 12 Nov 2025 | 0001193125-25-277624 |
| 10-K | FY2025 | 3 Sep 2025 | 0000858877-25-000111 |
| 10-K | FY2024 | 5 Sep 2024 | 0000858877-24-000017 |
| Company | Form | Filed | Accession number |
|---|---|---|---|
| Arista Networks | 8-K Ex 99.1 | 3 Nov 2026 | 0001596532-26-000252 |
| Broadcom | 8-K Ex 99.1 | 2 Sep 2026 | 0001730168-26-000076 |
| Celestica | 8-K Ex 99.1 | 26 Oct 2026 | 0001030894-26-000049 |
| Ciena | 8-K Ex 99.1 | 3 Sep 2026 | 0001628280-26-060245 |
| CrowdStrike | 8-K Ex 99.1 | 26 Aug 2026 | 0001535527-26-000029 |
| Datadog | 8-K Ex 99.1 | 4 Nov 2026 | 0001628280-26-069792 |
| Dynatrace | 8-K Ex 99.1 | 3 Nov 2026 | 0001773383-26-000069 |
| Fortinet | 8-K Ex 99.1 | 28 Oct 2026 | 0001262039-26-000024 |
| HPE (incl. Juniper) | 8-K Ex 99.1 | 2 Sep 2026 | 0001645590-26-000078 |
| HPE (incl. Juniper) | 8-K Ex 99.1 | 30 Sep 2026 | 0001645590-26-000084 |
| Microsoft | 10-Q | 28 Oct 2026 | 0001193125-26-436133 |
| NVIDIA | 8-K Ex 99.2 | 26 Aug 2026 | 0001045810-26-000073 |
| Palo Alto Networks | 8-K Ex 99.1 | 1 Sep 2026 | 0001327567-26-000019 |
| Zscaler | 8-K Ex 99.1 | 3 Sep 2026 | 0001713683-26-000156 |
| Filed | Exhibit | Document | Content |
|---|---|---|---|
| 12 Nov 2025 | Ex 99.1 | Q1 FY2026 results release | Revenue $14.88bn (+8%); GAAP EPS $0.72, non GAAP EPS $1.00; Product orders +13%; AI infrastructure orders from hyperscalers $1.3bn in the quarter |
| 17 Dec 2025 | Ex 10.1 | 2005 Stock Incentive Plan, amended and restated | Approved by stockholders on 16 Dec 2025; adds 57,490,000 shares to the plan; Plan terminates at the 2030 annual meeting unless extended |
| 11 Feb 2026 | Ex 99.1 | Q2 FY2026 results release | Revenue $15.35bn (+10%); GAAP EPS $0.80, non GAAP EPS $1.04; Product orders +18%; networking product orders above 20%; AI infrastructure orders from hyperscalers $2.1bn |
| 13 May 2026 | Ex 99.1 | Q3 FY2026 results release and restructuring plan | Revenue $15.84bn (+12%); GAAP EPS $0.85, non GAAP EPS $1.06; Product orders +35%, +19% excluding hyperscalers; networking product orders above 50% |
| 12 Aug 2026 | Ex 99.1 | Q4 and FY2026 results release | Q4 revenue $17.25bn (+18%); FY2026 revenue $63.33bn (+12%), GAAP EPS $3.33, non GAAP EPS $4.33; Q4 product orders +35%, +25% excluding hyperscalers; networking product orders +40% |
| 12 Nov 2026 | Ex 99.1 | Q1 FY2027 results release | Revenue $18.52bn (+24%); product +32%, services +1%; GAAP EPS $1.14 (+58%), non GAAP EPS $1.40 (+40%); Networking $11.13bn (+43%), Security $2.12bn (+7%), Collaboration $1.14bn (+8%), Observability $279m (+2%) |
Read next
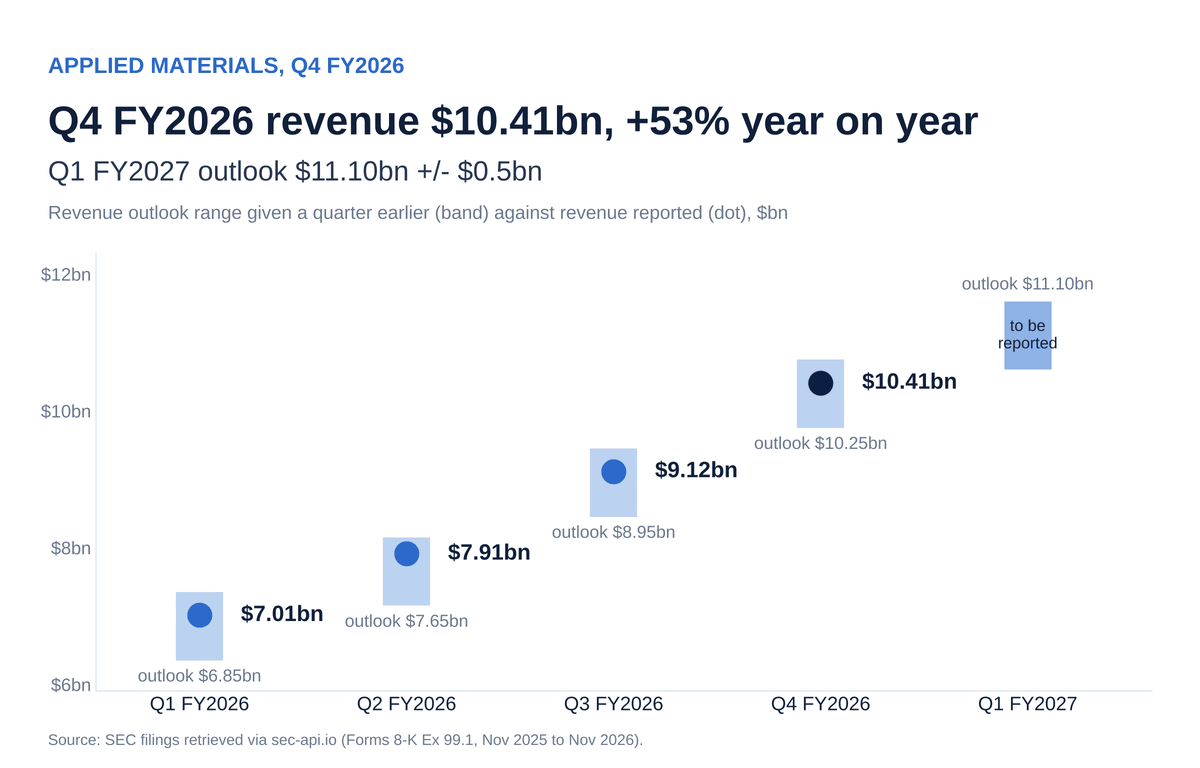
Applied Materials (AMAT) Q4 FY2026 Earnings SEC Filing Analysis: $10.41bn Revenue, DRAM at 33% of Systems Sales and an $11.10bn Q1 FY2027 Outlook
November 13, 2026·36 min read
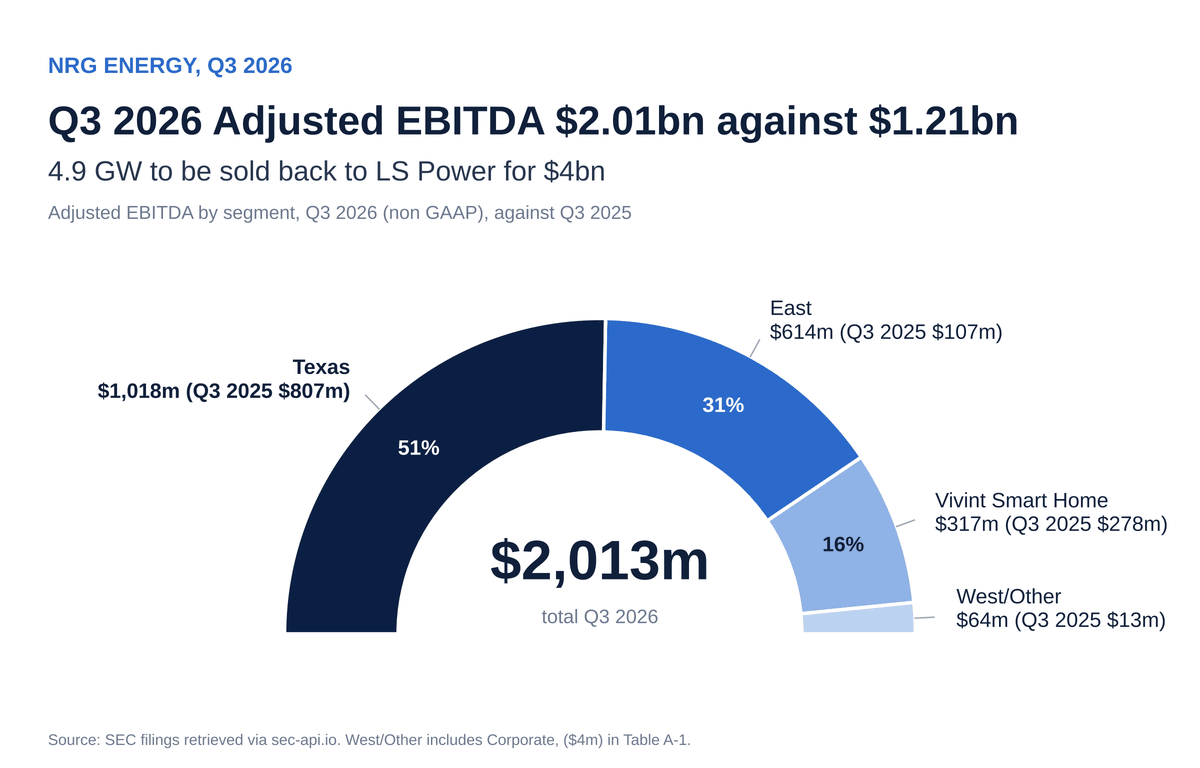
NRG Energy (NRG) Q3 2026 Earnings SEC Filing Analysis: $2.01bn Adjusted EBITDA, $4bn LS Power Asset Sale and First 2027 Guidance
November 12, 2026·54 min read