Klarna Group plc (KLAR), Financial Analysis
Insights derived from analysing SEC filings. Independent analysis, not a publication of the SEC.
- Revenue $1.01bn in Q3 2026, +11.7% year on year, while transaction costs rose +2.6% to $638m; transaction margin dollars (TMD) $371m, +32.0%. TMD margin 36.8% of revenue against 31.1%. GMV $36.05bn (+10.4%), revenue 2.80% of GMV.
- US GMV $8.22bn (+23.7%), 23% of group GMV; US Fair Financing $3.56bn (+73.3%). US TMD $70m against $17m, a US TMD margin of 17.7% against 5.4%; outside the US 49.0% against 44.9%.
- Provision for credit losses $201m, 0.56% of GMV against 0.72% a year earlier, with about $7.7bn of loans sold through forward flows in the quarter. US Fair Financing 30+ day delinquency 3.7% on the Q2 2026 cohort against 3.5%; US Pay Later 30+ day 1.4% against 1.7%.
- Adjusted operating income $21m against $(14)m; IFRS operating loss $(53)m against $(83)m and net loss $(65)m against $(95)m. Share based payments $54m (+38.5%) and adjusted operating expenses $350m (+18.6%) sit between the two measures.
- Klarna Card volume $4.5bn (+111%) and subscription revenue $43m (+530%); 2.6m paying subscribers; merchants 1.35m (+59%); active consumers 122m; ARPAC $34.0 (+21%).
- FY2026 outlook reiterated: GMV $149bn to $151bn, revenue $4.08bn to $4.16bn, TMD $1.62bn to $1.65bn, adjusted operating income $280m to $300m; Q4 2026 positive net income expected. Shares closed at $13.63 on 16 Nov 2026, 66% below the $40 IPO price; market value $5.17bn, 2.2x equity attributable to shareholders (2.0x total equity). Chris Koegel is appointed CFO effective 1 Jan 2027, subject to regulatory approval; Niclas Neglen remains CFO until the end of 2026.
Figures are read from the Q3 2026 Form 6-K of 17 Nov 2026 (acc 0001628280-26-074361): the press release (Ex 99.1), the earnings release with the interim statements of profit or loss, financial position and cash flows (Ex 99.2), the earnings presentation (Ex 99.3, read from the filed slide images) and the supplementary materials with quarterly data from Q1 2024 (Ex 99.4); the Forms 6-K for Q3 2025 to Q2 2026 incl. the H1 2026 interim financial statements, the FY2025 annual report on Form 20-F, the IPO prospectus on Form 424B4 (Sep 2025) for FY2022 to FY2024, and all Forms 6-K with their exhibits from Nov 2025 to Nov 2026, incl. the CFO appointment of 12 Nov 2026. Klarna is a foreign private issuer and files Forms 20-F and 6-K in place of Forms 10-K, 10-Q and 8-K; it files no separate CFO commentary, so the financial sections of the earnings release are used. Ownership comes from Schedules 13G and Forms 3 and 4 for central index key 2003292; peer figures from each peer's own filings. Share price $13.63 is the close of 16 Nov 2026, the last close before the release (the 17 Nov 2026 session had not closed when this post was prepared). Accession numbers appear in the Sources appendix.
1 Revenue & Business Model
- Storyline: Klarna runs a payments and credit network across 26 markets and earns on each purchase through merchant fees, interest and fees from consumers and gains on loans it sells. It manages to transaction margin dollars, revenue less processing, credit and funding costs. The three chapters that follow cover the drivers of that margin: Fair Financing and the US, the Klarna Card and subscriptions, and credit and funding.
- Three products (Ex 99.3 and Ex 99.4, Nov 2026): Pay Later, the charge card equivalent at 0% interest, $27.30bn of Q3 GMV (76%, +6%); Fair Financing, installments over three to 48 months (20-F), $5.24bn (15%, +61%); Pay in Full, $3.51bn (10%, (3%)). Consumer services and advertising (shopping browser, agentic commerce, subscriptions) generated $588m of revenue in 2025 and grew 30% so far in 2026.
- Revenue by type in Q3 2026: transaction and service $683m (+7.7%), interest income $273m (+1.5%) and gains on consumer receivables sold $53m, a line that started in Q4 2025.
- Annual revenue FY2022 $1.90bn, FY2023 $2.28bn, FY2024 $2.81bn, FY2025 $3.51bn; TTM Q3 2026 $4.15bn. Operating loss narrowed from $(980)m in FY2022 to $(230)m in FY2025 and $(20)m TTM.
- By market in Q3 2026: US revenue $395m (+24.6%), global ex US $614m (+4.8%). Events and services rose to 14% of GMV from 9%; apparel and accessories fell to 32% from 36%.


| Line | Q1 2025 | Q2 2025 | Q3 2025 | Q4 2025 | Q1 2026 | Q2 2026 | Q3 2026 |
|---|---|---|---|---|---|---|---|
| GMV ($bn) | 25.3 | 31.2 | 32.7 | 38.7 | 33.7 | 36.6 | 36.1 |
| Revenue ($m) | 701 | 823 | 903 | 1,082 | 1,012 | 1,042 | 1,009 |
| Take rate (% of GMV) | 2.77 | 2.64 | 2.76 | 2.80 | 3.00 | 2.84 | 2.80 |
| Transaction costs ($m) | 430 | 508 | 622 | 710 | 623 | 596 | 638 |
| Transaction margin dollars ($m) | 271 | 315 | 281 | 372 | 389 | 446 | 371 |
| TMD margin (% of revenue) | 38.7 | 38.3 | 31.1 | 34.4 | 38.4 | 42.8 | 36.8 |
| Adjusted operating income ($m) | 3 | 29 | (14) | 47 | 68 | 91 | 21 |
| Operating profit (loss) ($m) | (90) | (46) | (83) | (11) | 17 | 27 | (53) |
| Net profit (loss) ($m) | (99) | (53) | (95) | (26) | 1 | 9 | (65) |
| Line | Q1 2025 | Q2 2025 | Q3 2025 | Q4 2025 | Q1 2026 | Q2 2026 | Q3 2026 |
|---|---|---|---|---|---|---|---|
| Transaction and service revenue | 519 | 604 | 634 | 743 | 671 | 707 | 683 |
| Gains on consumer receivables | 0 | 0 | 0 | 73 | 57 | 69 | 53 |
| Interest income | 182 | 219 | 269 | 267 | 284 | 266 | 273 |
| US revenue | 238 | 275 | 317 | 413 | 399 | 376 | 395 |
| Global ex US revenue | 463 | 548 | 586 | 669 | 613 | 666 | 614 |
2 Fair Financing and the US: Volume Up, Margin Rebuilding
- US GMV $8.22bn in Q3 2026 (+23.7%) and US revenue $395m (+25%); US share of GMV 23%, up 3 points. US Fair Financing $3.56bn, 43% of US GMV; 12 month US Fair Financing volume $12.5bn (+140%).
- US TMD $70m against $17m; US TMD margin 17.7% against 5.4%, after 23.4% in Q2 and 26.6% in Q1 2026. Klarna states mature markets run near 60%.
- US provisions $126m, 1.53% of US GMV, against 2.03% a year earlier; cumulative US Fair Financing net charge offs reached 4.4% at month 15 on the Q2 2025 cohort, against 3.8% at month 18 on Q1 2025 (Ex 99.4).
- Distribution: Walmart (through OnePay), Airbnb, eBay, Apple Upgrade, Southwest Airlines, J.Crew and Fiserv; 283,000 merchants offered Fair Financing (21%) against 150,000 a year earlier.
How US installment lending is changing
- Affirm: Affirm GMV grew 34% to $14.4bn in the Sep 2026 quarter; revenue $1.26bn (+35%), 8.79% of GMV; operating income $187.1m (Affirm 8-K Ex 99.1, 5 Nov 2026).
- Sezzle: Sezzle total transaction volume grew 34.9% to $1.4bn in Q3 2026; revenue $166.5m (+42.6%); operating margin 38.6% (Sezzle 8-K Ex 99.1, 4 Nov 2026).
- Upstart: Upstart revenue $371m in Q3 2026 (+34%); income from operations $36.0m (Upstart 8-K Ex 99.1, 3 Nov 2026).
- Block: Block consumer lending originations (Borrow and Afterpay) $19.0bn in Q3 2026, +40% (Block 8-K Ex 99.1, 3 Nov 2026).
- Charter: Klarna applied on 6 Jul 2026 to the Utah DFI and FDIC for Klarna Bank USA, an industrial bank; it serves US customers through partner banks today (6-K Ex 99.1).


| Company | Period | Volume or revenue | Growth (%) | Margin (%) | Detail |
|---|---|---|---|---|---|
| Klarna US | Q3 2026 | GMV $8.22bn | +23.7 | 17.7 | TMD margin; US Fair Financing $3.56bn (+73%) |
| Affirm | Sep 2026 quarter | GMV $14.4bn | +34.0 | 14.8 | Operating margin; revenue 8.79% of GMV |
| Sezzle | Q3 2026 | TTV $1.4bn | +34.9 | 38.6 | Operating margin; revenue 11.9% of TTV |
| Upstart | Q3 2026 | Revenue $370.5m | +33.7 | 9.7 | Operating margin |
| Block | Q3 2026 | Lending originations $19.0bn | +40.0 | n/a | Borrow and Afterpay |
Delinquency by origination cohort
| Measure | Q1 2025 | Q2 2025 | Q3 2025 | Q4 2025 | Q1 2026 | Q2 2026 |
|---|---|---|---|---|---|---|
| US Fair Financing 30+ DPD | 2.6 | 3.5 | 3.4 | 3.2 | 3.0 | 3.7 |
| US Fair Financing 60+ DPD | 2.8 | 3.7 | 3.6 | 3.3 | 3.2 | n/a |
| Global ex US Fair Financing 30+ DPD | 1.7 | 1.9 | 1.8 | 1.8 | 1.6 | 1.5 |
| US Pay Later 30+ DPD | 1.2 | 1.7 | 1.6 | 1.6 | 1.3 | 1.4 |
| US Pay Later 60+ DPD | 1.1 | 1.5 | 1.4 | 1.4 | 1.1 | 1.2 |
| Global ex US Pay Later 30+ DPD | 1.5 | 1.6 | 1.7 | 1.6 | 1.4 | 1.3 |
3 Klarna Card, Subscriptions and the Merchant Network
- Klarna Card volume $4.5bn in Q3 2026 (+111%) after $2.1bn a year earlier; card users shop about three times as often; financing on the card added to Fair Financing delinquencies.
- Subscription revenue $43m (+530%) from $7m in Q3 2025; 2.6m paying subscribers, three times a year earlier.
- Active consumers 122m (+7%), merchants 1.35m (+59%), ARPAC $34.0 (+21%); 142,000 merchants added in the quarter; Klarna attributes merchant growth to default on integrations with payment service providers (Ex 99.1).
- AI assistant: live with a small group of early users on WhatsApp, iMessage and the Klarna app; the shopping browser has driven more than $34bn of GMV since 2020.
How cards and subscriptions are changing BNPL
- Affirm Card: Affirm Card GMV grew 117% to $3.3bn in the Sep 2026 quarter; active cardholders 6.0m (+112%); Card alone 23% of Affirm GMV (Affirm 8-K Ex 99.1, 5 Nov 2026).
- Sezzle: Sezzle active subscribers grew 68.1% to 955,000 in Q3 2026; transaction frequency 7.8x a quarter (Sezzle 8-K Ex 99.1, 4 Nov 2026).
- Block: Block Cash App Commerce Enablement volume (Cash App Card, Cash App Pay, Afterpay BNPL and Cash App Business) $56.9bn in Q3 2026, +14%, at a 1.74% monetization rate (Block 8-K Ex 99.1, 3 Nov 2026).
- Distribution: Klarna default on payment service provider integrations in the Q3 2026 outlook: J.P. Morgan Payments, Adyen, Worldline, Worldpay (Global Payments) and Fiserv Clover and Commerce Hub (6-K Ex 99.2).


| Company | Period | Measure | Growth (%) | Detail |
|---|---|---|---|---|
| Klarna Card | Q3 2026 | Volume $4.5bn | +111 | 6% of active consumers use the card, 11% in the US |
| Affirm Card | Sep 2026 quarter | GMV $3.3bn | +117 | 6.0m active cardholders; 23% of Affirm GMV |
| Klarna subscriptions | Q3 2026 | Revenue $43m | +530 | 2.6m paying subscribers; $178m recurring revenue run rate |
| Sezzle subscriptions | Q3 2026 | 955,000 subscribers | +68.1 | Transaction frequency 7.8x a quarter |
| Block Cash App | Q3 2026 | Commerce enablement $56.9bn | +14.0 | Monetization rate 1.74% |
4 Credit and Funding: Provisions, Deposits and Forward Flows
- Transaction costs $638m (+3%) against GMV +10%; provisions $201m ((14%)), funding $182m (+1%), processing and servicing $255m (+23%).
- Provisions by market: US 1.53% of GMV, global ex US 0.27% against 0.38%. Since inception Klarna has underwritten more than $0.8tn at average provisions of about 0.6% of GMV.
- Funding: deposits $12.73bn, 88% of funding; interest on funding $131m ((5%)); fair value adjustment on loans sold and held for sale $51m (+21%). About $7.7bn of loans were sold through forward flows in Q3.
- Capital tools: $518m risk transfer (Jul 2026), $900m and $2bn forward flow facilities, credit linked notes ($171m) and a pending US industrial bank charter.
How BNPL credit and funding are changing
- PayPal: PayPal renewed its European BNPL receivables sale with KKR managed funds in Nov 2025: up to EUR 65bn of receivables from France, Germany, Italy, Spain and the UK through Mar 2028 (PayPal 8-K, 17 Nov 2025).
- EU rules: The revised EU Consumer Credit Directive brings BNPL under consumer credit rules from Nov 2026 (PayPal FY2025 10-K).
- Affirm: Affirm provision for credit losses $259.4m in the Sep 2026 quarter against $162.8m a year earlier; funding costs $134.4m (Affirm 8-K Ex 99.1).
- Sezzle: Sezzle provision for credit losses 2.7% of TTV in Q3 2026 against 3.1%; FY2026 target about 2.5% of TTV (Sezzle 8-K Ex 99.1).


| Company | Period | Measure | Detail |
|---|---|---|---|
| Klarna | Q3 2026 | 0.56% of GMV | Q3 2025 0.72%; deposits 88% of funding |
| Affirm | Sep 2026 quarter | 1.80% of GMV | $259.4m on $14.4bn; funding costs $134.4m |
| Sezzle | Q3 2026 | 2.7% of TTV | Q3 2025 3.1%; FY2026 target about 2.5% |
| PayPal | Nov 2025 | EUR 65bn | European BNPL receivables sale capacity with KKR funds to Mar 2028 |
5 Financial Analysis & Ratios
- Operating margin (0.5)% TTM against (6.6)% in FY2025 and (51.5)% in FY2022; TMD margin 38.1% TTM. Adjusted operating income $227m TTM against $65m in FY2025 and $(726)m in FY2022.
- Net loss $(81)m TTM incl. tax expense of $57m on a pre tax loss of $24m; FY2025 net loss $(273)m included share based payments of $157m against $92m in FY2024, which the 20-F links mainly to equity programs set up in connection with the IPO. P/E is not meaningful.
- Cash flow is shaped by lending: FY2025 operating cash flow $(1.03)bn after consumer receivables grew $2.79bn and deposits $2.15bn; 9M 2026 $(383)m, incl. $1.27bn of bonds and treasury bills bought. Capex $34m TTM. Free cash flow is shown for completeness only.
- Balance sheet at 30 Sep 2026: consumer receivables $10.00bn (of which $1.39bn at fair value through OCI), cash $3.54bn and debt securities $2.80bn; consumer deposits $12.73bn; notes payable and other borrowings $1.73bn; equity $2.59bn incl. $231m of non controlling interests.
- No dividends or buybacks. 379,160,066 ordinary shares at 30 Jun 2026, up from 377,507,910 at 31 Dec 2025.
| Line item | FY2022 | FY2023 | FY2024 | FY2025 | TTM Q3 2026 |
|---|---|---|---|---|---|
| Revenue | 1,904.0 | 2,276.0 | 2,811.0 | 3,509.0 | 4,145.0 |
| Gross profit | 687.0 | 1,085.0 | 1,217.0 | 1,239.0 | 1,578.0 |
| Research and development | 430.0 | 389.0 | 444.0 | 486.0 | 525.0 |
| Selling, general and administrative | 1,138.0 | 891.0 | 812.0 | 927.0 | 1,048.0 |
| Operating income | (980.0) | (323.0) | (121.0) | (230.0) | (20.0) |
| Net income | (1,035.0) | (244.0) | 21.0 | (273.0) | (81.0) |
| Diluted EPS ($) | (3.09) | (0.69) | 0.01 | (0.79) | (0.31) |
| Operating cash flow | 336.0 | 808.0 | 587.0 | (1,032.0) | (3,421.0) |
| Capital expenditure | (105.0) | (85.0) | (45.0) | (30.0) | (34.0) |
| Free cash flow | 231.0 | 723.0 | 542.0 | (1,062.0) | (3,455.0) |
| Stock based compensation | 56.0 | 43.0 | 92.0 | 157.0 | 153.0 |
| Cash and investments | n/a | 3,190.0 | 3,697.0 | 5,321.0 | 6,332.0 |
| Total debt | n/a | 324.0 | 513.0 | 1,359.0 | 1,728.0 |
| Total equity | 2,327.0 | 2,197.0 | 2,257.0 | 2,684.0 | 2,594.0 |

| Metric | Q3 2025 | Q3 2026 | Change |
|---|---|---|---|
| Revenue ($m) | 903.0 | 1,009.0 | 11.7% |
| Gross profit ($m) | 281.0 | 371.0 | 32.0% |
| Operating income ($m) | (83.0) | (53.0) | 36.1% |
| Net income ($m) | (95.0) | (65.0) | 31.6% |
| Diluted EPS ($) | (0.25) | (0.19) | 24.0% |
| Operating cash flow ($m) | 472.0 | 830.0 | 75.8% |
| Free cash flow ($m) | 464.0 | 820.0 | 76.7% |
| Operating margin (%) | (9.2) | (5.3) | 3.9 pts |
| Net margin (%) | (10.5) | (6.4) | 4.1 pts |
| Ratio | FY2022 | FY2023 | FY2024 | FY2025 | TTM Q3 2026 |
|---|---|---|---|---|---|
| Growth and margins | |||||
| Revenue growth (%) | n/a | 19.5 | 23.5 | 24.8 | n/a |
| Gross margin (%) | 36.1 | 47.7 | 43.3 | 35.3 | 38.1 |
| Operating margin (%) | (51.5) | (14.2) | (4.3) | (6.6) | (0.5) |
| Net margin (%) | (54.4) | (10.7) | 0.7 | (7.8) | (2.0) |
| Cost and investment intensity | |||||
| R&D (%) revenue | 22.6 | 17.1 | 15.8 | 13.9 | 12.7 |
| SBC (%) revenue | 2.9 | 1.9 | 3.3 | 4.5 | 3.7 |
| Returns | |||||
| ROE (%) | (44.5) | (10.8) | 0.9 | (11.1) | (3.1) |
| ROA (%) | n/a | (1.8) | 0.2 | (1.7) | (0.4) |
| Asset turnover (x) | n/a | 0.17 | 0.20 | 0.19 | 0.22 |
| Liquidity and leverage | |||||
| Debt to equity (x) | n/a | 0.15 | 0.23 | 0.51 | 0.67 |
| Net cash ($bn) | n/a | 2.9 | 3.2 | 4.0 | 4.6 |


| Measure | Value |
|---|---|
| Market cap ($bn) | 5.2 |
| Price/Book (x) | 2.0 |
Cost structure and profitability
- Costs (revenue less operating income) $1.06bn in Q3 2026, +7.7%, against revenue +11.7%; operating margin (5.3)% against (9.2)%.
- Transaction costs $638m, 63.2% of revenue against 68.9%: processing and servicing 0.71% of GMV, provisions 0.56%, funding 0.50%.
- Operating expenses outside transaction costs $424m (+16.5%): technology $138m, sales and marketing $127m, customer service $54m, general and administrative $99m, depreciation $6m.
- Adjusted operating income to operating loss in Q3 2026: $21m less D&A $22m, share based payments $54m, plus restructuring and other $2m, gives $(53)m.


| Line | Q3 2025 | Q4 2025 | Q1 2026 | Q2 2026 | Q3 2026 |
|---|---|---|---|---|---|
| Processing and servicing (% of revenue) | 23.0 | 23.1 | 26.3 | 22.4 | 25.3 |
| Provision for credit losses (% of revenue) | 26.0 | 23.1 | 18.4 | 18.4 | 19.9 |
| Funding costs (% of revenue) | 19.9 | 19.4 | 16.9 | 16.4 | 18.0 |
| Technology and product development (% of revenue) | 13.6 | 11.8 | 12.7 | 12.5 | 13.7 |
| Sales and marketing (% of revenue) | 11.3 | 11.8 | 10.4 | 12.3 | 12.6 |
| Customer service and operations (% of revenue) | 5.9 | 4.8 | 5.4 | 5.6 | 5.4 |
| General and administrative (% of revenue) | 8.5 | 6.5 | 8.0 | 8.7 | 9.8 |
Balance sheet, credit allowance and funding
- Allowance for credit losses $376m at 30 Sep 2026 against $492m at 31 Dec 2025; Q3 provisions $201m, realized losses $157m and releases on asset sales $82m.
- Consumer receivables at amortized cost $8.24bn against $10.46bn at 31 Dec 2025, while receivables at fair value through OCI rose to $1.39bn from $386m.
- Deposits $12.73bn against $13.97bn at 30 Sep 2025; notes payable $1.73bn against $2.62bn. Average consumer balance $124 and duration about 40 days at end Q4 2025 (Ex 99.2).
| Line | Q1 2025 | Q2 2025 | Q3 2025 | Q4 2025 | Q1 2026 | Q2 2026 | Q3 2026 |
|---|---|---|---|---|---|---|---|
| Opening allowance | 332 | 354 | 401 | 492 | 492 | 448 | 414 |
| Provision for credit losses | 136 | 174 | 235 | 250 | 186 | 192 | 201 |
| Realized losses | (123) | (141) | (144) | (193) | (169) | (166) | (157) |
| Asset sale activity | 0 | 0 | 0 | (57) | (55) | (59) | (82) |
| FX and other | 9 | 14 | 0 | 0 | (5) | (3) | 0 |
| Closing allowance | 354 | 401 | 492 | 492 | 448 | 414 | 376 |
6 MD&A & Management Commentary
Q3 2026 results: Form 6-K of 17 Nov 2026
- Against the Aug 2026 guide for Q3: GMV $36.05bn (guide $35bn to $36bn), revenue $1.01bn ($940m to $980m), TMD $371m ($340m to $360m), adjusted operating income $21m ($5m to $15m). The Aug release called Q3 the investment quarter for PSP launches.
- Revenue lines: transaction and service revenue $683m (+8%); gains on consumer receivables plus interest income $326m (+21%). ARPAC $34.0 against $28.1.
- Costs: processing and servicing $255m, 0.71% of GMV against 0.64% in Q2 (settlement and card issuing); provisions $201m ((14%)); funding $182m, of which interest $131m and fair value adjustment on loans sold $51m.
- Operating costs: IFRS non transaction operating expenses $424m (+17%); adjusted operating expenses $350m (+19%, +20% like for like); general and administrative $99m against $77m.
- Q4 2026 implied by the reiterated year: GMV $42.6bn to $44.6bn, revenue $1.02bn to $1.10bn, TMD $414m to $444m and adjusted operating income $100m to $120m; net gains on consumer receivables expected above Q3.
- Accounting change withdrawn: in Aug Klarna expected new US and German Fair Financing originations to be measured at fair value from H2 (about 10bps of GMV lower revenue, 2bps higher TMD); in Nov it said it no longer expects to sell these loans to the extent that triggers that presentation, so the outlook no longer includes the 2bps TMD pull forward.
| Item | Outlook | Source |
|---|---|---|
| FY2026 GMV | $149bn to $151bn, reiterated 17 Nov 2026; set 18 Aug 2026 from more than $155bn (Feb and May 2026) | 6-K Ex 99.1, 18 Aug and 17 Nov 2026 |
| FY2026 revenue | $4.08bn to $4.16bn (2.74% to 2.75% of GMV), reiterated; prior more than $4.34bn (more than 2.80% of GMV) | 6-K Ex 99.1, 18 Aug and 17 Nov 2026 |
| FY2026 transaction margin dollars | $1.62bn to $1.65bn (1.09% of GMV), reiterated; raised in Aug from more than $1.61bn (more than 1.04%) | 6-K Ex 99.1, 18 Aug and 17 Nov 2026 |
| FY2026 adjusted operating income | $280m to $300m (6.9% to 7.2% of revenue), reiterated; prior more than $299m | 6-K Ex 99.1, 18 Aug and 17 Nov 2026 |
| Implied Q4 2026 | GMV $42.6bn to $44.6bn; revenue $1.02bn to $1.10bn; TMD $414m to $444m; adjusted operating income $100m to $120m; positive net income expected | 6-K Ex 99.2, 17 Nov 2026 |
| Q3 2026 guidance against actual | GMV $35bn to $36bn (actual $36.1bn); revenue $940m to $980m (actual $1.01bn); TMD $340m to $360m (actual $371m); adjusted operating income $5m to $15m (actual $21m) | 6-K Ex 99.1, 18 Aug 2026; Ex 99.2, 17 Nov 2026 |
| Q2 2026 guidance against actual | GMV $35.5bn to $36.5bn (actual $36.6bn); revenue $960m to $1.00bn (actual $1.04bn); TMD $375m to $395m (actual $446m); adjusted operating income $30m to $50m (actual $91m) | 6-K Ex 99.1, 14 May and 18 Aug 2026 |
Management and CFO commentary
- Klarna files no CFO commentary document; the points below come from the earnings releases and press releases filed as 6-K exhibits.
- Q3 2026 release, financial sections: transaction costs +3% against GMV +10%; share based payments $54m on the annual compensation cycle, expected to return to pre Q3 levels; Q4 gains on consumer receivables expected above Q3.
- Q3 2026, CEO Sebastian Siemiatkowski: fourth straight quarter of revenue above $1bn and positive adjusted operating income; the company is running on track with or ahead of all full year outlook items.
- Q2 2026 release (18 Aug 2026): FY2026 GMV cut on about $600m of currency translation and German volumes; TMD guidance raised; Q3 described as the investment quarter.
- Q1 2026 release (14 May 2026): revenue per employee near $1.4m, four times the 2022 level; the 2022 consumer cohort generated $12 of revenue in its first year and $52 now.
- Q4 2025 release (19 Feb 2026): 15.8m banking consumers (+101%) generating $107 of revenue per user against $30 on average.
| Speaker | Date and source | Statement |
|---|---|---|
| Sebastian Siemiatkowski, CEO | 17 Nov 2026, 6-K Ex 99.1 | “We are keeping more of each dollar we process through our everyday finance network” |
| Sebastian Siemiatkowski, CEO | 18 Aug 2026, 6-K Ex 99.1 | “We measure our progress in transaction margin dollars.” |
| Sebastian Siemiatkowski, CEO | 19 Feb 2026, 6-K Ex 99.2 | “Consumers are moving away from predatory revolving credit” |
| Item | Disclosure |
|---|---|
| 20-F FY2025, results | Revenue $3.51bn (FY2024 $2.81bn); operating loss $(230)m; net loss $(273)m; diluted EPS $(0.79); share based payments $157m. |
| 20-F FY2025, balance sheet | Total assets $18.80bn; consumer deposits $13.00bn; notes payable $1.36bn; equity $2.68bn; 377,507,910 ordinary shares. |
| 20-F FY2025, controls | IT general controls material weakness identified before the IPO reported remediated at 31 Dec 2025. |
| 20-F FY2025, shares | 335,521,212 ordinary shares restricted by lock up until 9 Mar 2026; Class B shares with ten votes held by pre IPO holders. |
| H1 2026 interim, borrowings | Notes payable $1.69bn: warehouse $573m, financial institutions $372m (incl. credit linked notes $171m), senior bonds $399m, subordinated $179m, commercial paper $92m. |
| H1 2026 interim, contingencies | Possible outcomes $100m to $200m across pending matters; FTC draft complaint on the Buyer Protection Policy received Aug 2026. |
| H1 2026 interim, subsequent events | PriceRunner award against Google about $2.1bn incl. interest, appealed 22 Jul 2026, not recognized; $518m risk transfer 16 Jul 2026; Apple device leasing from Jul 2026. |
| 6-K Q3 2026, funding | Deposits $12.73bn, 88% of funding; about $7.7bn of loans sold through forward flows in Q3. |
| 6-K Q3 2026, credit | Allowance for credit losses $376m at 30 Sep 2026; realized losses $157m and asset sale releases $82m in Q3. |
7 Peer Valuation & Sector Summary
- Sector: BNPL and consumer payments. Klarna competes with specialist lenders (Affirm, Sezzle, Upstart) and with wallets and payment networks that also offer pay later products (PayPal, Block Afterpay).
- Growth, latest quarter year on year: SEZL 42.6%, AFRM 35.2% (quarter to 30 Sep 2026), UPST 33.7%, KLAR 11.7%, XYZ 9.9%, PYPL 2.0%.
- Operating margin TTM: SEZL 41.9%, PYPL 17.0%, AFRM 11.8%, UPST 4.6%, XYZ 4.6%, KLAR (0.5%).
- Valuation: market value KLAR $5.17bn against AFRM $21.4bn, SEZL $5.5bn and UPST $1.9bn; P/E TTM SEZL 29.9x, UPST 28.7x, PYPL 10.9x. KLAR and AFRM P/E not shown.
| Company | Revenue TTM ($bn) | Revenue growth (%) | Gross margin (%) | Operating margin (%) | Net margin (%) | FCF margin (%) | ROE (%) | Net cash ($bn) | Market value ($bn) | EV/Sales (x) | P/E TTM (x) |
|---|---|---|---|---|---|---|---|---|---|---|---|
| KLAR, TTM Sep 2026 | 4.1 | 11.7 | 38.1 | (0.5) | (2.0) | n/a | n/a | n/a | 5 | n/a | n/a |
| AFRM, TTM Sep 2026 | 4.6 | 35.2 | n/a | 11.8 | n/a | n/a | n/a | n/a | 21 | n/a | n/a |
| SEZL, TTM Sep 2026 | 0.6 | 42.6 | n/a | 41.9 | 31.4 | n/a | n/a | n/a | 5 | n/a | 29.9 |
| UPST, TTM Sep 2026 | 1.3 | 33.7 | n/a | 4.6 | 4.9 | n/a | n/a | n/a | 2 | n/a | 28.7 |
| PYPL, TTM Sep 2026 | 34.3 | 2.0 | 45.8 | 17.0 | 13.8 | 18.4 | 23.8 | 1.6 | 47 | 1.3 | 10.9 |
| XYZ, TTM Sep 2026 | 25.7 | 9.9 | 47.5 | 4.6 | 1.8 | 13.5 | 2.0 | 1.2 | 53 | 2.0 | 115.3 |

8 Material Events & Contracts
- 14 filings from 18 Nov 2025 to 17 Nov 2026 (Forms 6-K and 20-F; the two Forms 6-K of 18 Nov 2025 share one row): quarterly results, the annual report and AGM, the PriceRunner ruling, the US bank charter application, the Apple Upgrade program and the CFO appointment.
- Funding transactions in the filings: a $2bn forward flow facility (Q1 2026) supporting $17bn of US financing capacity, a $518m risk transfer (Jul 2026, three years), a $900m forward flow facility (Jul 2026) and credit linked notes of $171m.
- Management: Chris Koegel, Vice President, Head of Corporate Finance and Investor Relations at Robinhood, becomes CFO on 1 Jan 2027 subject to regulatory approval.
| Date | Items | Event |
|---|---|---|
| 18 Nov 2025 | 6-K | Q3 2025 results: revenue $903m (+28%), GMV $32.7bn; Q4 2025 outlook GMV $37.5bn to $38.5bn, TMD $390m to $400m; Q3 2025 interim report (second 6-K) |
| 19 Feb 2026 | 6-K | Q4 2025 results: first $1bn revenue quarter ($1.08bn, +38%), GMV $38.7bn (+32%); 4.2m active Klarna Card users |
| 20 Feb 2026 | 6-K | Q4 2025 earnings presentation (image slides) with FY2026 outlook as of 19 Feb 2026 |
| 26 Feb 2026 | 20-F | FY2025 annual report: revenue $3.51bn, operating loss $(230)m, net loss $(273)m; 377,507,910 ordinary shares; IT general controls material weakness reported remediated |
| 14 May 2026 | 6-K | Q1 2026 results: revenue $1.01bn (+44%), GMV $33.7bn (+33%), adjusted operating income $68m; $2bn forward flow facility; Q2 guidance |
| 27 May 2026 | 6-K | AGM notice, proxy form, UK annual report 2025 and directors' remuneration report and policy |
| 23 Jun 2026 | 6-K | AGM of 22 Jun 2026: all 12 resolutions passed; 72.3% of voting rights participated; for votes 98.9% (resolutions 11 and 12) to 100.0% of votes cast, computed from the filed counts |
| 1 Jul 2026 | 6-K | Stockholm court awards PriceRunner $1.97bn in damages and interest against Google; subject to appeal, funder and former shareholder shares and tax |
| 6 Jul 2026 | 6-K | Applications to Utah DFI and FDIC for Klarna Bank USA, an industrial bank; $91.3bn of US credit provided since 2019 |
| 28 Jul 2026 | 6-K | Klarna named leasing provider for Apple Upgrade (US); $518m risk transfer and $900m forward flow facility noted |
| 18 Aug 2026 | 6-K | Q2 2026 results: revenue $1.04bn (+27%), TMD $446m (+42%), net income $9m; FY2026 GMV guidance cut to $149bn to $151bn, TMD guidance raised; H1 interim statements |
| 12 Nov 2026 | 6-K | Chris Koegel (Robinhood) named CFO from 1 Jan 2027, subject to regulatory approval; Niclas Neglen remains CFO to end 2026 |
| 17 Nov 2026 | 6-K | Q3 2026 results: revenue $1.01bn (+12%), TMD $371m (+32%), net loss $(65)m; FY2026 outlook reiterated |
| Contract | Terms |
|---|---|
| Apple Upgrade (Jul 2026) | Klarna is the US leasing provider: 12 and 24 month leases for iPhone and Apple Watch, 24 and 36 months for Mac and iPad; receivables at fair value; expected to add to adjusted operating income in 2026. |
| Forward flow facilities | $2bn facility (Q1 2026) supporting $17bn of US financing capacity; $900m facility (Jul 2026); about $7.7bn of loans sold in Q3 2026. |
| Risk transfer (Jul 2026) | $518m with an external investor, three years; receivables stay on balance sheet; supports a further $12bn of lending. |
| PSP default on agreements | J.P. Morgan Payments, Adyen, Worldline, Worldpay (Global Payments), Stripe, Nexi, Fiserv Clover and Commerce Hub; Mollie renewed (350,000 businesses). |
| Notes payable at 30 Jun 2026 | Warehouse $573m, senior unsecured bonds $399m, subordinated $179m, commercial paper $92m (Jan to Jun 2026 issues at discount rates of 2.20% to 2.71%). |
| PriceRunner v Google | First instance award about $2.1bn incl. interest; appealed by both parties; shares payable to litigation funders and former PriceRunner holders; not recognized. |
9 Ownership, Voting Power & Annual Meeting
- Two voting classes: ordinary shares with one vote and Class B shares with ten votes and no economic rights, issued to pre IPO holders; Class C shares with ten votes may be issued to the CEO, capped at 15% of votes (20-F).
- AGM of 22 Jun 2026 (6-K): all 12 resolutions passed; about 72.3% of voting rights took part. Remuneration policy 99.1% of votes cast; authority to allot shares 98.9%.
- Insiders: CEO Sebastian Siemiatkowski bought 692,506 shares on 26 Aug 2026 for $9.95m at an average $14.37; no open market sales on Forms 4 from 31 Mar to 30 Oct 2026. Officers received option and RSU grants.
- 13G filers at 30 Sep 2025: Sequoia funds 14.6%, Heartland A/S 7.86%, Sebastian Siemiatkowski 7.49%, Victor Jacobsson 6.4% of ordinary shares; no later 13G amendments filed.
| Proposal | For (bn votes) | Against (bn votes) | Abstain (bn votes) | For as % of votes cast | Result |
|---|---|---|---|---|---|
| 1 Annual report and accounts FY2025 | 1.662 | 0.000 | n/a | 100.0 | Passed |
| 2 Directors' remuneration report | 1.661 | 0.001 | n/a | 100.0 | Passed |
| 3 Directors' remuneration policy | 1.648 | 0.014 | n/a | 99.1 | Passed |
| 4 Reappoint Ernst & Young LLP as auditor | 1.662 | 0.000 | n/a | 100.0 | Passed |
| 6 Reappoint Niclas Neglen as director | 1.660 | 0.002 | n/a | 99.9 | Passed |
| 7 Reappoint Andrew Reed as director | 1.660 | 0.002 | n/a | 99.9 | Passed |
| 8 Reappoint Mateusz Staniszewski as director | 1.660 | 0.002 | n/a | 99.9 | Passed |
| 9 Reappoint Markus Villig as director | 1.660 | 0.002 | n/a | 99.9 | Passed |
| 11 Authority to allot shares | 1.322 | 0.014 | n/a | 98.9 | Passed |
| 12 Disapply pre emption rights (special) | 1.322 | 0.014 | n/a | 98.9 | Passed |
Annual meeting remarks
- No management remarks, presentation or shareholder questions from the meeting of 22 Jun 2026 were filed; the 6-K of 23 Jun 2026 reports vote counts only.
| Holder | Ordinary shares (m) | Share of class (%) | Filed |
|---|---|---|---|
| Sequoia Capital funds (SC US (TTGP)) | 55.03 | 14.6 | 13 Nov 2025 |
| Heartland A/S (Anders Holch Povlsen) | 29.65 | 7.86 | 14 Nov 2025 |
| Sebastian Siemiatkowski | 28.56 | 7.49 | 18 Nov 2025 |
| Victor Jacobsson and related entities | 24.11 | 6.4 | 12 Nov 2025 |
| Type | Detail |
|---|---|
| Open market purchase | Sebastian Siemiatkowski, CEO: 692,506 shares at an average $14.37, $9.95m, 26 Aug 2026 |
| Option grants | CEO 1,628,701 (30 Mar), 1,166,563 (1 Jun), 1,099,917 and 2,021,470 (20 Aug 2026); other officers 84,034 to 1,319,155 |
| RSU grants and settlements | Officers incl. the CFO, CMO, CTO and CCO, quarterly (codes A and M) |
| Open market sales | None reported on Forms 4 |
10 Risk Factors
- Item 3.D of the FY2025 20-F holds 81 risk factors against 90 in the Sep 2025 prospectus (46,069 words against 46,860). 0 were added, 9 removed and 11 materially reworded. The 2026 Forms 6-K refer to the 20-F and file no update.
| Risk | Disclosure and change |
|---|---|
| Credit losses | Provisions $201m in Q3 2026 (0.56% of GMV); US Fair Financing 30+ day delinquency 3.7% on the Q2 2026 cohort against 3.5%. |
| Funding and loan sales | Deposits 88% of funding; Q4 guidance assumes higher gains on consumer receivables than Q3; forward flows of about $7.7bn in Q3. |
| Regulation | US industrial bank application pending; EU revised Consumer Credit Directive applies to BNPL from Nov 2026 (PayPal 10-K). |
| Legal | FTC draft complaint on Buyer Protection Policy (Aug 2026); contingent outcomes $100m to $200m. |
| Volume in Germany | FY2026 GMV guidance cut in Aug 2026 to $149bn to $151bn from more than $155bn, citing about $600m of currency translation and a more measured view of German volumes. |
| Profitability | IFRS operating loss $(53)m in Q3 2026 and $(230)m in FY2025; share based payments $54m in Q3. |
| Voting control | Class B shares carry ten votes; possible Class C shares for the CEO up to 15% of votes. |
| Management change | New CFO from 1 Jan 2027, subject to regulatory approval. |
How risk factors changed
- Comparison: 20-F FY2025 Item 3.D filed 26 Feb 2026 acc 0002003292-26-000007 against 424B4 prospectus risk factors filed 10 Sep 2025 acc 0002003292-25-000052.
- The 20-F holds 81 risk factors against 90 in the IPO prospectus; nine were removed, none added.
- Five of the nine removed factors concern the IPO itself or share trading before listing.
- Eight of the 11 materially reworded factors sit in the share ownership group, reflecting the listed multi class structure.
- The material weakness factor now reports remediation at 31 Dec 2025.

| Measure | 424B4 Sep 2025 | 20-F FY2025 |
|---|---|---|
| Risk factors (count) | 90 | 81 |
| Words in risk factor section | 46,860 | 46,069 |
| Change | Risk factor | What changed |
|---|---|---|
| Removed | May fail to grow consumer base | No longer a separate factor; consumer points folded into the merchant factor, which grew by 728 words. |
| Removed | Operating without necessary licenses | Separate licensing factor dropped; regulatory group keeps 11 factors. |
| Removed | Failure to promote and protect the brand | Separate brand factor dropped. |
| Removed | Controlled foreign corporation tax consequences | US CFC tax factor dropped. |
| Removed | Active trading market may never develop | Dropped after the Sep 2025 listing. |
| Removed | Change in control regimes and approvals | Dropped as a separate factor. |
| Removed | NYSE governance exemptions as foreign issuer | Merged into the foreign private issuer factor, which grew by 370 words. |
| Removed | Immediate dilution for offering investors | IPO specific; dropped. |
| Removed | Discretion over use of IPO proceeds | IPO specific; dropped. |
| Reworded | Attracting and retaining merchants | Body similarity 0.46; 728 words added, incl. consumer base points from the removed factor. |
| Reworded | Reliance on third party systems | Shortened by 104 words. |
| Reworded | Material weakness in internal control | Heading now states the IT general controls weakness was remediated at 31 Dec 2025. |
| Reworded | Multi class share structure and voting control | Describes Class B shares now in issue (ten votes, no economic rights) and possible Class C shares for the CEO capped at 15% of votes. |
| Reworded | Foreign private issuer rules | 370 words added, incl. NYSE governance exemptions. |
| Reworded | Possible loss of foreign issuer status | 117 words added. |
| Reworded | Shareholder rights under English law | Body similarity 0.68. |
| Reworded | Capital decisions need shareholder approval | 520 words added on English company law approvals. |
| Reworded | Future share sales | Now states 377,507,910 shares outstanding and 335,521,212 restricted until 9 Mar 2026. |
| Reworded | DTC eligibility of shares | Shortened by 101 words. |
| Reworded | UK stamp duty on transfers outside DTC | 361 words added. |
| Filing | Change disclosed |
|---|---|
| 6-K Q1 to Q3 2026 releases and H1 2026 interim statements | No risk factor update filed; releases refer to the 20-F risk factors. The H1 statements add an FTC draft complaint (Aug 2026) to contingent liabilities of $100m to $200m. |
11 Stock Price, Scenarios & Sensitivity
- KLAR closed at $13.63 on 16 Nov 2026, the last close before the Q3 release. 52 week closing high $32.50 on 4 Dec 2025 and low $12.27 on 27 Mar 2026; IPO price $40 on 10 Sep 2025. On the Q4 2025 results day (19 Feb 2026) the close fell to $13.85 from $18.95; on the Q2 2026 results day (18 Aug 2026) to $15.06 from $19.51.
- Valuation basis: P/E on future operating income. Market value $5.17bn on 379.16m ordinary shares; price to equity attributable to shareholders 2.2x; the valuation table shows 2.0x on total equity incl. non controlling interests. TTM operating loss $(20)m, so the scenario applies an operating margin and a P/E to TTM Q3 2029 revenue.
- Scenario method: implied price = TTM Q3 2029 revenue x operating margin x (1 less 25% tax) / shares x exit P/E. Growth rates, margins, exit multiples and share changes are this report's own assumptions, not company guidance. Base case revenue $6.14bn at a 9% IFRS operating margin; for reference, FY2026 guidance for adjusted operating income, a non IFRS measure before share based payments and D&A, is 6.9% to 7.2% of revenue, while TTM IFRS operating margin is (0.5)%.

Critical factors and core assumptions
| Factor | Current value | Best case requires | Evidence in filings |
|---|---|---|---|
| US Fair Financing | US Fair Financing $3.56bn in Q3 2026 (+73%); US TMD margin 17.7% | US TMD margin moves toward the about 60% of mature markets | 6-K Ex 99.2, 17 Nov 2026 |
| Credit | provisions 0.56% of GMV | provisions at or below 0.6% of GMV as Fair Financing grows | 6-K Ex 99.2 and 99.4 |
| Card and subscriptions | card volume $4.5bn; subscription revenue $43m | card use rises beyond the merchant network; $178m recurring revenue grows | 6-K Ex 99.3 |
| Cost growth | adjusted operating expenses +19% against TMD +32% | adjusted opex grows below TMD | 6-K Ex 99.2 |
| Funding | deposits 88% of funding; forward flows $7.7bn in Q3 | loan sales continue at Q3 pricing | 6-K Ex 99.2; Jul 2026 6-K |
| Share based payments | $54m in Q3 2026 | return to pre Q3 levels as stated | 6-K Ex 99.2 |
- Revenue base TTM Q3 2026 $4.15bn; FY2026 guidance $4.08bn to $4.16bn; Q3 2026 growth +11.7%.
- Best case: 22% revenue CAGR to $7.53bn as US Fair Financing and the card grow; operating margin 13%; exit P/E 22x, below SEZL at 29.9x.
- Base case: 14% revenue CAGR to $6.14bn; operating margin 9%; exit P/E 18x, between PYPL 10.9x and UPST 28.7x.
- Worst case: 6% revenue CAGR to $4.94bn with higher credit or funding costs; operating margin 3%; exit P/E 14x.
- Shares up 3% (best), 4% (base) and 5% (worst) from 379.16m through equity awards; no dividends or buybacks; tax 25%. All scenario inputs are this report's assumptions, not company guidance.
Scenarios, three years forward
| Measure | Worst case | Base case | Best case |
|---|---|---|---|
| Revenue CAGR, 3 years (%) | 6.0 | 14.0 | 22.0 |
| Revenue, TTM Q3 2029 ($bn) | 4.9 | 6.1 | 7.5 |
| Operating margin, TTM Q3 2029 (%) | 3.0 | 9.0 | 13.0 |
| Net income, TTM Q3 2029 ($bn) | 0.1 | 0.4 | 0.7 |
| EPS, TTM Q3 2029 ($) | 0.28 | 1.05 | 1.88 |
| Exit P/E (x) | 14.0 | 18.0 | 22.0 |
| Implied price ($) | 3.91 | 18.92 | 41.34 |
| Change against $13.63 (%) | (71) | 39 | 203 |
| Implied annual return (%) | (34.1) | 11.6 | 44.8 |
| Description | Report assumption: credit or funding costs rise; growth slows | Report assumption: growth near the 2026 rate; 9% operating margin | Report assumption: US margin rises toward mature markets |

Sensitivity analysis
| Revenue CAGR \ Operating margin | 3% | 6% | 9% | 12% | 15% |
|---|---|---|---|---|---|
| 6% | $5.07 | $10.14 | $15.21 | $20.28 | $25.35 |
| 10% | $5.67 | $11.33 | $17.00 | $22.67 | $28.33 |
| 14% | $6.31 | $12.61 | $18.92 | $25.23 | $31.54 |
| 18% | $6.99 | $13.99 | $20.98 | $27.98 | $34.97 |
| 22% | $7.73 | $15.46 | $23.19 | $30.92 | $38.65 |
| Exit P/E \ Operating margin | 3% | 6% | 9% | 12% | 15% |
|---|---|---|---|---|---|
| 12x | $4.20 | $8.41 | $12.61 | $16.82 | $21.02 |
| 15x | $5.26 | $10.51 | $15.77 | $21.02 | $26.28 |
| 18x | $6.31 | $12.61 | $18.92 | $25.23 | $31.54 |
| 22x | $7.71 | $15.42 | $23.13 | $30.84 | $38.54 |
| 26x | $9.11 | $18.22 | $27.33 | $36.44 | $45.55 |
Disclaimer
This analysis is for information only and is not financial advice. It is derived from public SEC filings retrieved via sec-api.io and is not a publication of the U.S. Securities and Exchange Commission. Scenario values are model outputs under stated assumptions and are not forecasts. Data as of 17 November 2026.
Sources
All company and peer figures are read from SEC filings retrieved through the sec-api.io MCP server. Share prices are regular session closes as dated in the text.
| Form | Period | Filed | Accession number |
|---|---|---|---|
| 6-K | 30 Sep 2026 | 17 Nov 2026 | 0001628280-26-074361 |
| 6-K | 12 Nov 2026 | 12 Nov 2026 | 0001628280-26-073169 |
| 6-K | 30 Jun 2026 | 18 Aug 2026 | 0001628280-26-057573 |
| 6-K | 28 Jul 2026 | 28 Jul 2026 | 0001628280-26-049939 |
| 6-K | 6 Jul 2026 | 6 Jul 2026 | 0001628280-26-047131 |
| 6-K | 1 Jul 2026 | 1 Jul 2026 | 0001628280-26-046370 |
| 6-K | 23 Jun 2026 | 23 Jun 2026 | 0001628280-26-044898 |
| 6-K | 27 May 2026 | 27 May 2026 | 0001628280-26-038366 |
| 6-K | 31 Mar 2026 | 14 May 2026 | 0001628280-26-034877 |
| 20-F | 31 Dec 2025 | 26 Feb 2026 | 0002003292-26-000007 |
| 6-K | 31 Dec 2025 | 20 Feb 2026 | 0002003292-26-000004 |
| 6-K | 31 Dec 2025 | 19 Feb 2026 | 0002003292-26-000002 |
| 6-K | 30 Sep 2025 | 18 Nov 2025 | 0001628280-25-052803 |
| 6-K | 30 Sep 2025 | 18 Nov 2025 | 0001628280-25-052805 |
| 424B4 | 30 Jun 2025 | 10 Sep 2025 | 0002003292-25-000052 |
| Schedule 13G | 30 Sep 2025 | 13 Nov 2025 | 0001193125-25-280685 |
| Schedule 13G | 30 Sep 2025 | 14 Nov 2025 | 0001104659-25-111849 |
| Schedule 13G | 30 Sep 2025 | 18 Nov 2025 | 0000950103-25-014930 |
| Schedule 13G | 30 Sep 2025 | 12 Nov 2025 | 0001193125-25-277522 |
| 4 | 26 Aug 2026 | 28 Aug 2026 | 0002097107-26-000004 |
| Company | Form | Filed | Accession number |
|---|---|---|---|
| Affirm | 8-K | 5 Nov 2026 | 0001628280-26-071005 |
| Affirm | 10-K | 27 Aug 2026 | 0001628280-26-059279 |
| Sezzle | 8-K | 4 Nov 2026 | 0001662991-26-000169 |
| Sezzle | 10-K | 26 Feb 2026 | 0001662991-26-000016 |
| Upstart | 8-K | 3 Nov 2026 | 0001647639-26-000083 |
| Upstart | 10-K | 10 Feb 2026 | 0001647639-26-000027 |
| Block | 8-K | 3 Nov 2026 | 0001628280-26-069513 |
| PayPal | 8-K | 17 Nov 2025 | 0001193125-25-284822 |
| Filed | Exhibit | Document | Content |
|---|---|---|---|
| 18 Nov 2025 | Ex 99.2 | Q3 2025 earnings press release | Revenue $903m (+28% reported, +26% like for like); GMV $32.7bn; US GMV +43%, US revenue +51%; Q4 2025 outlook: GMV $37.5bn to $38.5bn, TMD $390m to $400m; realized losses 0.44% of GMV |
| 18 Nov 2025 | Ex 99.1 | Q3 2025 interim financial statements | Unaudited interim condensed statements for the nine months to 30 Sep 2025; Net loss Q3 2025 $(95)m; cash $6.79bn at 30 Sep 2025 |
| 19 Feb 2026 | Ex 99.2 | Q4 2025 earnings press release | Revenue $1.08bn (+38%), first $1bn quarter; GMV $38.7bn (+32%), US revenue +58%; 15.8m banking consumers (+101%); 4.2m active card users; provisions 0.65% of GMV |
| 20 Feb 2026 | Ex 99.1 | Q4 2025 earnings presentation | Image slides; outlook effective 19 Feb 2026; FY2026 outlook later restated as GMV more than $155bn, TMD more than $1.61bn, AOI more than $299m |
| 14 May 2026 | Ex 99.1 | Q1 2026 press release | Revenue $1.01bn (+44%), GMV $33.7bn (+33%), TMD $389m (+44%), AOI $68m; net income $1m; $2bn forward flow facility supports $17bn of US financing capacity; Q2 guide GMV $35.5bn to $36.5bn |
| 27 May 2026 | Ex 99.1 to 99.4 | AGM notice, proxy form, UK annual report 2025, remuneration report | Notice of the 22 Jun 2026 AGM with 12 resolutions; Directors' remuneration policy put to a binding vote |
| 23 Jun 2026 | Ex 99.1 | AGM results | All 12 resolutions passed; for votes 98.9% to 100.0% of votes cast, computed from the filed counts (the company states at or above 99%); Holders of about 72.3% of voting rights took part |
| 1 Jul 2026 | Ex 99.1 | PriceRunner ruling against Google | Court awards PriceRunner $1.97bn in damages and accrued interest; Subject to appeal; reduced by litigation funder and former shareholder shares and tax |
| 6 Jul 2026 | Ex 99.1 | US bank charter application | Applications to Utah DFI and FDIC for Klarna Bank USA, an industrial bank; $91.3bn of credit to US consumers since 2019; 30m US users a year |
| 28 Jul 2026 | Ex 99.1, Ex 99.2 | Apple Upgrade leasing program | Klarna is leasing provider for Apple Upgrade in the US: 12 to 36 month leases; Note to investors: $518m risk transfer and a $900m forward flow facility; about 90% of the balance sheet deposit funded in Q1 2026 |
| 18 Aug 2026 | Ex 99.1 | Q2 2026 press release and outlook update | Revenue $1.04bn (+27%), TMD $446m (+42%), AOI $91m, net income $9m; FY2026 GMV to $149bn to $151bn from more than $155bn; TMD raised to $1.62bn to $1.65bn |
| 18 Aug 2026 | Ex 99.4 | H1 2026 interim financial statements | 379,160,066 ordinary shares and 187,794,148 Class B shares at 30 Jun 2026; Contingent liabilities $100m to $200m incl. FTC draft complaint on Buyer Protection Policy (Aug 2026) |
| 12 Nov 2026 | Ex 99.1 | CFO appointment | Chris Koegel, from Robinhood, CFO from 1 Jan 2027, subject to regulatory approval; Niclas Neglen remains CFO until the end of 2026 |
| 17 Nov 2026 | Ex 99.1 | Q3 2026 press release | GMV $36.1bn (+10%; US +24%), revenue $1.01bn (+12%), TMD $371m (+32%), AOI $21m; FY2026 outlook reiterated; provisions 0.56% of GMV against 0.72% |
| 17 Nov 2026 | Ex 99.2 | Q3 2026 earnings release | TMD margin 36.8% (+5.7 pts); US TMD $70m, 18% of revenue; ex US $301m, 49%; Deposits $12.7bn, 88% of funding; about $7.7bn of loans sold through forward flows |
| 17 Nov 2026 | Ex 99.3 | Q3 2026 earnings presentation | US Fair Financing $12.5bn over 12 months (+140%); Klarna Card volume $4.5bn (+111%); Subscription revenue $43m (+530%); $178m annual recurring revenue |
| 17 Nov 2026 | Ex 99.4 | Q3 2026 supplementary materials | Quarterly P&L, US and ex US P&L, GMV by product Q1 2024 to Q3 2026; Allowance for credit losses $376m at 30 Sep 2026 against $492m at 31 Dec 2025 |
Read next
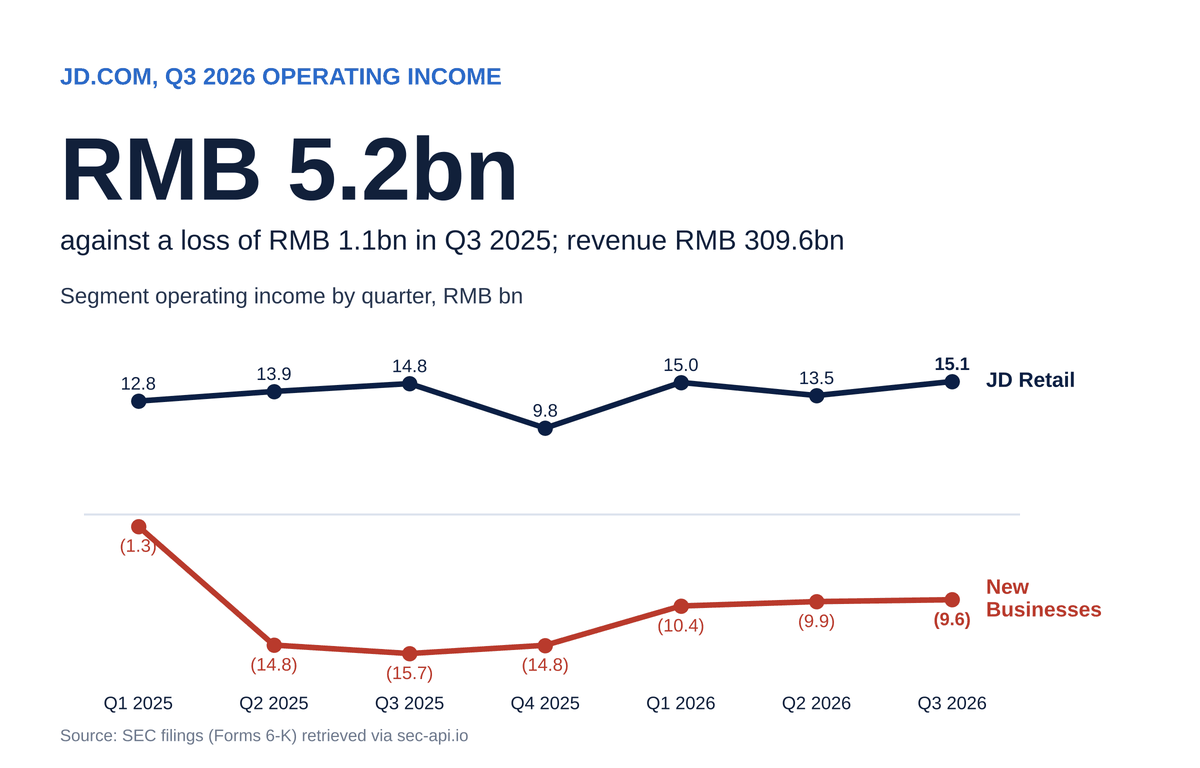
JD.com (JD) Q3 2026 Earnings: Revenue RMB 309.6bn (+3.5%), Operating Income RMB 5.2bn and a RMB 9.6bn New Businesses Loss, SEC Filing Analysis
November 17, 2026·34 min read
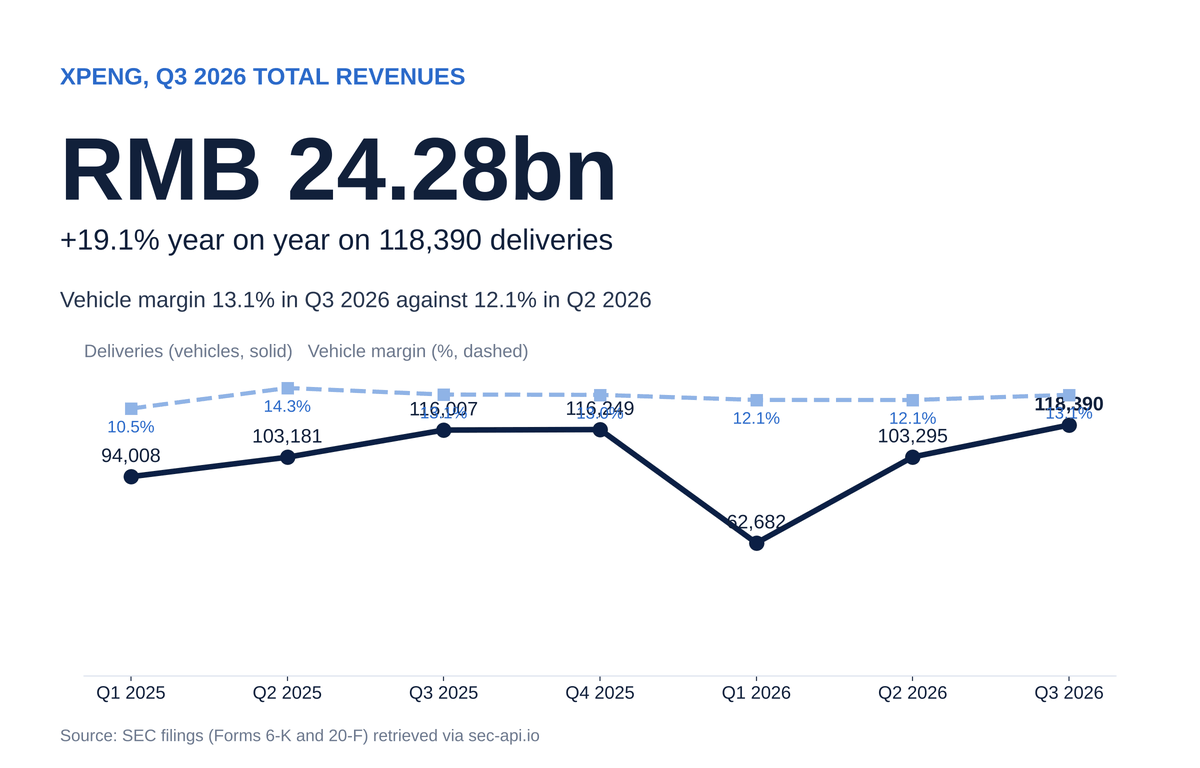
XPeng (XPEV) Q3 2026 Earnings: RMB 24.28bn Revenue, 13.1% Vehicle Margin and a RMB 30.40bn to RMB 31.80bn Q4 Outlook, SEC Filing Analysis
November 17, 2026·32 min read