Palo Alto Networks (PANW), Financial Analysis
Insights derived from analysing SEC filings. Independent analysis, not a publication of the SEC.
- Revenue $3.45bn in Q1 FY2027 (quarter to 31 Oct 2026), +39.2% year on year; Idira, the CyberArk identity business, added $353m, and revenue excluding Idira rose 25.0%. NGS ARR $9.73bn (+66%) against $9.10bn at 31 Jul 2026; RPO $21.0bn (+35%), of which $9.4bn is due within 12 months.
- Network & AI Security revenue $2.28bn, +19.9%, 66.2% of revenue; product revenue $595m (+37.1%) and subscription and support $2.85bn (+39.7%). Fortinet grew 20.5% in Q3 2026 and Zscaler 24.9% in its Jul 2026 quarter.
- Cortex revenue $647m, +53.3%, mainly from the Chronosphere observability acquisition; CrowdStrike grew 25.8% in its Jul 2026 quarter. Segment gross margin: Network & AI Security 79.7%, Cortex 67.5%, Idira 90.1%.
- GAAP operating margin 2.8% against 12.5%: amortization of acquired intangibles $282m against $39m and share based compensation charges $622m against $387m. Non GAAP operating income $1.06bn (30.7% margin). Net income $482m incl. a $369m discrete tax benefit; free cash flow $1.84bn.
- Same day filings: agreement to buy Applied Compute for $4.5bn in PANW shares at $337.16 each (Item 3.02, Ex 99.2); the 8-K states the number of shares is not yet known, and $4.5bn at $337.16 implies about 13.3m shares, 1.6% of the 821m outstanding (derived); $1bn buyback authorization extended to 31 Dec 2027 (Item 8.01). The $1.1bn of 2030 Notes from CyberArk are convertible in the quarter to 31 Dec 2026; fair value $1.93bn.
- FY2027 guidance raised to revenue $14.52bn to $14.57bn (+26.7% at the midpoint) and NGS ARR $11.475bn to $11.525bn; non GAAP operating margin held at 29.5%. Shares closed at $339.92 on 18 Nov 2026, before the release: EV/Sales 21.8x TTM; scenario prices three years forward on EV/Sales: base $335, best $509, worst $164.
Figures are read from the filings of Palo Alto Networks, Inc. (central index key 1327567): the 8-K of 18 Nov 2026 with Ex 99.1 (Q1 FY2027 results) and Ex 99.2 (Applied Compute) and its Items 3.02 and 8.01, the Q1 FY2027 Form 10-Q of 18 Nov 2026, the Forms 10-K for FY2024, FY2025 and FY2026, the Forms 10-Q for Q1 FY2026, the Forms 8-K with all their exhibits, incl. the earnings releases for Q1 FY2026 to Q1 FY2027 with the guidance they contain, the CyberArk and Chronosphere completion filings, the Item 5.07 vote results, the 2026 proxy statement (DEF 14A of 27 Oct 2026), 53 Forms 4, and the filings of the peers used in chapters 2 to 4 and 7. PANW files no separate CFO commentary document; CFO commentary is taken from the CFO statements and guidance in the releases. Earnings call statements are not used. Share price $339.92 is the regular session close of 18 Nov 2026, before the release after the close. Accession numbers appear in the Sources appendix.
1 Revenue & Business Model
- Storyline: revenue growth rose from 16% in Q1 FY2026 to 39% in Q1 FY2027 after the CyberArk and Chronosphere acquisitions, while GAAP operating margin fell from 12.5% to 2.8% on amortization and share based compensation. Chapters 2 to 4 cover the three reported segments: Network & AI Security; Cortex; Idira.
- Palo Alto Networks sells cybersecurity platforms: firewalls and secure access (Network & AI Security), security operations, cloud security and observability (Cortex), and identity security (Idira). It sells mainly through distributors and resellers to end customers in over 180 countries, incl. almost all of the Fortune 100 (10-Q Q1 FY2027).
- Revenue FY2022 $5.5bn, FY2024 $8.0bn, FY2026 $11.5bn (+24.5%); TTM Q1 FY2027 $12.5bn. Subscription and support was 82.7% of Q1 FY2027 revenue; FY2026 subscription $6.24bn (+25%), support $2.96bn (+21%), product $2.28bn (+27%).
- Regions in Q1 FY2027: Americas $2.33bn (+41.7%), EMEA $728m (+39.7%), APAC $392m (+25.6%). US revenue $2.15bn, 62.4% of the total.
- NGS ARR (Next Generation Security annualized recurring revenue) excludes hardware, legacy attached subscriptions, support and services; management has stated a target of $20bn of NGS ARR in FY2030 (8-K Ex 99.1, 1 Sep 2026).


| Line | Q1 FY2025 | Q2 FY2025 | Q3 FY2025 | Q4 FY2025 | Q1 FY2026 | Q2 FY2026 | Q3 FY2026 | Q4 FY2026 | Q1 FY2027 |
|---|---|---|---|---|---|---|---|---|---|
| Revenue ($m) | 2,139 | 2,257 | 2,289 | 2,536 | 2,474 | 2,594 | 3,002 | 3,410 | 3,445 |
| Revenue growth year on year (%) | n/a | n/a | n/a | n/a | 15.7 | 14.9 | 31.1 | 34.5 | 39.2 |
| Product ($m) | 354 | 421 | 453 | 574 | 434 | 514 | 594 | 738 | 595 |
| Subscription and support ($m) | 1,785 | 1,836 | 1,836 | 1,962 | 2,040 | 2,080 | 2,408 | 2,672 | 2,850 |
| Subscription and support growth (%) | n/a | n/a | n/a | n/a | 14.3 | 13.3 | 31.2 | 36.2 | 39.7 |
| GAAP operating income ($m) | 286 | 241 | 219 | 497 | 309 | 397 | (183) | 172 | 96 |
| Non GAAP operating income ($m) | 616 | 641 | 627 | 768 | 746 | 785 | 814 | 1,011 | 1,059 |
| NGS ARR ($bn) | n/a | n/a | n/a | 5.60 | 5.90 | 6.30 | 8.10 | 9.10 | 9.73 |
| RPO ($bn) | n/a | n/a | n/a | 15.8 | 15.5 | 16.0 | 18.4 | 21.2 | 21.0 |
| Segment | Q1 FY2026 ($m) | Q1 FY2027 ($m) | Growth (%) | Gross margin Q1 FY2027 (%) | Gross margin Q1 FY2026 (%) |
|---|---|---|---|---|---|
| Network & AI Security | 1,904 | 2,282 | 19.9 | 79.7 | 81.9 |
| Cortex | 422 | 647 | 53.3 | 67.5 | 71.6 |
| Idira | 0 | 353 | n/a | 90.1 | n/a |
| Corporate & Other | 148 | 163 | 10.1 | (141.7) | (17.6) |
| Total | 2,474 | 3,445 | 39.2 | 68.0 | 74.2 |
2 Network & AI Security: $2.28bn in Q1 FY2027, +20%, and Product Revenue +37%
- Network & AI Security revenue $2.28bn in Q1 FY2027, +19.9%, 66.2% of revenue; the 10-Q attributes the growth to cloud delivered security services, next generation firewalls and SASE. Segment gross margin 79.7% against 81.9%.
- Product revenue $595m, +37.1%, from hardware and software licenses incl. CyberArk licenses; product gross margin 65.4% against 79.5%. Subscription and support $2.85bn, +39.7%.
- Prisma AIRS is the AI security platform within the segment, covering AI gateways, AI red teaming, agent identity and AI runtime security (10-Q Q1 FY2027); Protect AI ($635m, Jul 2025) and Portkey ($117m, May 2026) were acquired for this area.
- Platformization: the 10-Q describes the strategy as consolidating point products into platforms; the release states no count of platformized customers for Q1 FY2027.
How network security is changing
- Fortinet product revenue rose 37% to $765m in Q3 2026; it raised FY2026 billings guidance for the third time (8-K Ex 99.1, 28 Oct 2026).
- Zscaler ARR $3.77bn at 31 Jul 2026, +25%, or +20% excluding Red Canary (8-K Ex 99.1, 3 Sep 2026).
- Cisco security product revenue $2.12bn in Q1 FY2027, +7% (8-K Ex 99.1, 12 Nov 2026).
- PANW 10-K FY2026: hardware cost rose on supply chain challenges; US and Chinese tariffs affected some components, and memory and storage shortages are named in the Q1 FY2027 MD&A.


| Company | Line | Period | Revenue | Growth (%) | Margin (%) | Detail |
|---|---|---|---|---|---|---|
| Palo Alto Networks | Network & AI Security revenue | Q1 FY2027 | $2.28bn | 19.9 | 79.7 | segment gross margin |
| Fortinet | Total revenue | Q3 2026 (Sep 2026 quarter) | $2.08bn | 20.5 | 33.9 | GAAP operating margin; product revenue $765m (+37%) |
| Zscaler | Revenue | Q4 FY2026 (Jul 2026 quarter) | $898m | 24.9 | (1.7) | GAAP operating margin; ARR $3.77bn (+25%) |
| Cisco | Security product revenue | Q1 FY2027 (Oct 2026 quarter) | $2.12bn | 7.1 | n/a | no margin by product category |
3 Cortex: $647m, +53%, as Chronosphere Adds Observability
- Cortex revenue $647m in Q1 FY2027, +53.3%, primarily from Chronosphere observability revenue (10-Q). Segment gross margin 67.5% against 71.6%.
- Cortex covers XSIAM and XDR security operations, Cortex Cloud and observability (XCOR, Chronosphere). Embrace Mobile ($292m, 27 Aug 2026) adds real user monitoring and Console Systems ($393m, 1 Sep 2026) agent workflows.
- NGS ARR, which spans all segments, $9.73bn at 31 Oct 2026 (+66%); Q3 FY2026 NGS ARR included $1.6bn from CyberArk and Chronosphere. RPO $21.0bn; FY2027 guidance $25.3bn to $25.5bn.
- Usage pricing: the FY2026 10-K adds a risk factor that observability and AI offerings priced on consumption can see AI native customers cut usage.
How security operations and observability are changing
- CrowdStrike revenue $1.47bn in the Jul 2026 quarter, +26%; ARR $5.84bn, +25%; Falcon Flex ARR $2.29bn, +101% (8-K Ex 99.1, 26 Aug 2026).
- Datadog revenue grew 35.2% in Q3 2026 to $1.20bn, GAAP operating margin 6.2% (8-K Ex 99.1, 4 Nov 2026).
- PANW bought Chronosphere (observability) for $2.95bn on 29 Jan 2026, Embrace Mobile for $292m and Console Systems for $393m in Q1 FY2027 (10-K FY2026, 10-Q Q1 FY2027).
- PANW 10-K FY2026 adds a risk factor on consumption priced observability and AI offerings, where AI native customers can cut usage.


| Company | Line | Period | Revenue | Growth (%) | Margin (%) | Detail |
|---|---|---|---|---|---|---|
| Palo Alto Networks | Cortex revenue | Q1 FY2027 | $647m | 53.3 | 67.5 | segment gross margin; incl. Chronosphere |
| CrowdStrike | Total revenue | Q2 FY2027 (Jul 2026 quarter) | $1.47bn | 25.8 | (2.3) | GAAP operating margin; ARR $5.84bn (+25%) |
| Datadog | Total revenue | Q3 2026 (Sep 2026 quarter) | $1.20bn | 35.2 | 6.2 | GAAP operating margin; observability and security |
4 Idira (CyberArk): $353m of Identity Revenue at a 90% Segment Gross Margin
- Idira revenue $353m in Q1 FY2027, 10.2% of revenue, all from the CyberArk acquisition; segment gross profit $318m (90.1%). Goodwill allocated to Idira $3.24bn.
- CyberArk consideration $21.06bn, incl. 112m PANW shares valued at $18.49bn; FY2026 included $930m of revenue and a $797m net loss from CyberArk and Chronosphere together (10-K FY2026).
- Idira covers workforce, privileged, machine identity, identity governance and AI agent security (10-Q Q1 FY2027). The FY2026 10-K adds risk factors on AI agents as a new class of identity and on the definition of the identity market.
- Applied Compute ($4.5bn in shares, agreed 18 Nov 2026) adds post training and inference software for open weight AI models; at $337.16 a share, about 13.3m shares (derived; the 8-K states the number is not yet known).
How identity security is changing
- CyberArk completion release (8-K Ex 99.1, 11 Feb 2026): machine identities outnumber human identities by more than 80 to 1, a figure stated by the company.
- Okta revenue $805m in the Jul 2026 quarter, +11% (8-K Ex 99.1, 26 Aug 2026).
- PANW 10-K FY2026 adds risk factors on AI agents as a new class of identity and on the lack of a standard definition of the identity security market.


| Company | Line | Period | Revenue | Growth (%) | Margin (%) | Detail |
|---|---|---|---|---|---|---|
| Palo Alto Networks | Idira revenue | Q1 FY2027 | $353m | n/a | 90.1 | segment gross margin; CyberArk from 11 Feb 2026 |
| Okta | Total revenue | Q2 FY2027 (Jul 2026 quarter) | $805m | 10.6 | 13.3 | GAAP operating margin ($107m); cRPO $2.585bn (+14%); RPO $4.858bn (+17%) |
5 Financial Analysis & Ratios
- GAAP operating margin TTM 3.9% against 6.1% in FY2026 and 13.5% in FY2025. Non GAAP operating income TTM $3.67bn (29.5% of revenue).
- Net income TTM $455m (3.7% of revenue); diluted EPS TTM $0.61. Losses on the fair value of the 2030 Notes were $562m in FY2026 and $157m in Q1 FY2027; Q1 FY2027 includes a $369m tax benefit.
- Free cash flow TTM $4.27bn (34.3% of revenue): operating cash flow $4.71bn less capex $443m. Adjusted free cash flow in Q1 FY2027 $1.94bn, 56.2% of revenue; FY2027 guidance 38.0%.
- Balance sheet at 31 Oct 2026: cash and investments $9.14bn; 2030 Notes $1.93bn at fair value, now current; net cash $7.21bn; goodwill $22.56bn and intangibles $6.87bn; deferred revenue $14.59bn; equity $28.67bn.
- Capital returns: $1.0bn of buybacks in Feb 2026 (6.8m shares at $147.69), none in Q1 FY2027; $1.0bn authorization remains, extended to 31 Dec 2027. No dividend.
| Line item | FY2022 | FY2023 | FY2024 | FY2025 | FY2026 | TTM Q1 FY2027 |
|---|---|---|---|---|---|---|
| Revenue | 5.5 | 6.9 | 8.0 | 9.2 | 11.5 | 12.5 |
| Gross profit | 3.8 | 5.0 | 6.0 | 6.8 | 8.1 | 8.6 |
| Research and development | 1.4 | 1.6 | 1.8 | 2.0 | 2.6 | 2.8 |
| Selling, general and administrative | 2.6 | 3.0 | 3.5 | 3.5 | 4.8 | 5.3 |
| Operating income | (0.2) | 0.4 | 0.7 | 1.2 | 0.7 | 0.5 |
| Net income | (0.3) | 0.4 | 2.6 | 1.1 | 0.3 | 0.5 |
| Diluted EPS ($) | (0.45) | 0.64 | 3.64 | 1.60 | 0.40 | 0.61 |
| Operating cash flow | 2.0 | 2.8 | 3.3 | 3.7 | 4.6 | 4.7 |
| Capital expenditure | (0.2) | (0.1) | (0.2) | (0.2) | (0.4) | (0.4) |
| Free cash flow | 1.8 | 2.6 | 3.1 | 3.5 | 4.1 | 4.3 |
| Stock based compensation | 1.0 | 1.1 | 1.1 | 1.3 | 1.8 | 2.0 |
| Cash and investments | n/a | 5.4 | 6.8 | 8.5 | 7.9 | 9.1 |
| Total debt | n/a | 2.0 | 1.0 | 0.0 | 1.8 | 1.9 |
| Total equity | 0.2 | 1.7 | 5.2 | 7.8 | 27.5 | 28.7 |

| Metric | Q1 FY2026 | Q1 FY2027 | Change |
|---|---|---|---|
| Revenue ($bn) | 2.47 | 3.45 | 39.2% |
| Gross profit ($bn) | 1.84 | 2.34 | 27.6% |
| Operating income ($bn) | 0.31 | 0.10 | (68.9%) |
| Net income ($bn) | 0.33 | 0.48 | 44.3% |
| Diluted EPS ($) | 0.47 | 0.57 | 21.3% |
| Operating cash flow ($bn) | 1.77 | 1.93 | 8.9% |
| Free cash flow ($bn) | 1.69 | 1.84 | 9.2% |
| Operating margin (%) | 12.5 | 2.8 | (9.7 pts) |
| Net margin (%) | 13.5 | 14.0 | 0.5 pts |
| Ratio | FY2022 | FY2023 | FY2024 | FY2025 | FY2026 | TTM Q1 FY2027 |
|---|---|---|---|---|---|---|
| Growth and margins | ||||||
| Revenue growth (%) | n/a | 25.3 | 16.5 | 14.9 | 24.5 | n/a |
| Gross margin (%) | 68.8 | 72.3 | 74.3 | 73.4 | 70.4 | 68.9 |
| Operating margin (%) | (3.4) | 5.6 | 8.5 | 13.5 | 6.1 | 3.9 |
| Net margin (%) | (4.9) | 6.4 | 32.1 | 12.3 | 2.7 | 3.7 |
| FCF margin (%) | 32.6 | 38.2 | 38.6 | 37.6 | 35.8 | 34.3 |
| Cost and investment intensity | ||||||
| R&D (%) revenue | 25.8 | 23.3 | 22.5 | 21.5 | 22.2 | 22.7 |
| SBC (%) revenue | 18.4 | 15.6 | 13.4 | 14.0 | 15.5 | 16.1 |
| Capex (%) revenue | 3.5 | 2.1 | 2.0 | 2.7 | 3.8 | 3.6 |
| Effective tax rate (%) | n/a | 22.4 | (160.8) | 28.9 | 42.7 | (205.4) |
| Returns | ||||||
| ROE (%) | (127.1) | 44.9 | 74.5 | 17.5 | 1.7 | 1.6 |
| ROA (%) | n/a | 3.0 | 14.9 | 5.2 | 0.9 | 0.9 |
| ROIC (%) | (73.7) | n/a | n/a | n/a | 2.7 | 1.8 |
| Asset turnover (x) | n/a | 0.48 | 0.40 | 0.39 | 0.24 | 0.25 |
| Liquidity and leverage | ||||||
| Current ratio (x) | n/a | 0.78 | 0.89 | 0.94 | 0.87 | 0.66 |
| Debt to equity (x) | n/a | 1.14 | 0.19 | 0.00 | 0.06 | 0.07 |
| Net cash ($bn) | n/a | 3.4 | 5.8 | 8.5 | 6.1 | 7.2 |
| Efficiency and cash quality | ||||||
| Days sales outstanding | n/a | 130 | 119 | 117 | 115 | 60 |
| Shareholder returns (%) FCF | 50 | 10 | 18 | n/a | 24 | 23 |


| Measure | Value |
|---|---|
| Market cap ($bn) | 279.1 |
| Enterprise value ($bn) | 271.9 |
| EV/Sales (TTM) (x) | 21.8 |
| P/E on TTM non GAAP EPS (x) | 86.1 |
| P/E on FY2027 non GAAP EPS guidance midpoint (x) | 79.4 |
| FCF yield (%) | 1.5 |
| Price/Book (x) | 9.7 |
Cost structure and profitability
- GAAP gross margin 68.0% in Q1 FY2027 against 74.2%, with gross profit +27.6% against revenue +39.2%; GAAP operating margin (9.7) pts year on year and (2.3) pts on Q4 FY2026.
- Costs and expenses (revenue less operating income) $3.35bn, +54.7%: cost of revenue +72.9%, product cost +131.5% against product revenue +37.1%.
- Acquisition costs in the quarter: amortization of acquired intangibles $282m (8.2% of revenue) against $39m; acquisition related costs $55m. CyberArk restructuring: $60m expected, $12m reserve left.
- GAAP to non GAAP gap: 28.0 pts of margin in Q1 FY2027 against 17.7 pts a year earlier; share based compensation charges 18.1% of revenue against 15.6%.


| Line | Q1 FY2026 | Q2 FY2026 | Q3 FY2026 | Q4 FY2026 | Q1 FY2027 |
|---|---|---|---|---|---|
| Cost of revenue (% of revenue) | 25.8 | 26.4 | 32.4 | 32.4 | 32.0 |
| Research and development (% of revenue) | 21.3 | 19.7 | 24.5 | 22.8 | 23.2 |
| Sales and marketing (% of revenue) | 33.1 | 31.7 | 38.7 | 33.0 | 33.9 |
| General and administrative (% of revenue) | 7.2 | 6.9 | 10.5 | 6.6 | 8.2 |
| Share based compensation charges (in lines above) (% of revenue) | 15.6 | 12.4 | 17.2 | 14.3 | 18.1 |
| Amortization of acquired intangibles (in lines above) (% of revenue) | 1.6 | 1.5 | 9.3 | 8.2 | 8.2 |
| Operating income (% of revenue) | 12.5 | 15.3 | (6.1) | 5.0 | 2.8 |
| Non GAAP operating income (% of revenue) | 30.2 | 30.3 | 27.1 | 29.6 | 30.7 |
| Line | Q1 FY2026 | Q1 FY2027 | Change |
|---|---|---|---|
| Revenue | 2,474 | 3,445 | 971 |
| Gross profit | 1,836 | 2,342 | 506 |
| Operating expenses | (1,527) | (2,246) | (719) |
| Operating income | 309 | 96 | (213) |
| Other income (expense), net | 103 | (71) | (174) |
| Income taxes | (78) | 457 | 535 |
| Net income | 334 | 482 | 148 |
6 MD&A & Management Commentary
Q1 FY2027 results: 8-K Ex 99.1 and Form 10-Q of 18 Nov 2026
- Revenue $3.45bn, +39.2% year on year and +1.0% on Q4 FY2026; guidance had been $3.300bn to $3.310bn. NGS ARR $9.73bn against guidance of $9.54bn to $9.56bn; RPO $21.0bn against $20.8bn to $20.9bn.
- Profit lines: GAAP operating income $96m against $309m; non GAAP operating income $1.06bn against $746m (+42.0%); GAAP EPS $0.57 against $0.47; non GAAP EPS $1.05 against $0.93 and guidance of $0.96 to $0.98.
- Costs: operating expenses $2.25bn, +47.1%; research and development +51.1%, sales and marketing +42.3%, general and administrative +57.0%. The 10-Q attributes the rise to personnel costs, incl. headcount from acquisitions ($234m in research and development, $206m in sales and marketing).
- Gross margin (10-Q MD&A): product gross margin 65.4% against 79.5% on supply chain challenges, product mix and amortization; subscription and support 68.5% against 73.1% on amortization and cloud hosting costs. The MD&A names memory and storage shortages among cost factors.
- Cash and tax: operating cash flow $1.93bn (+8.9%); $624m paid for acquisitions (Embrace Mobile, Console Systems); effective tax rate (1,828%) after a $369m discrete benefit on a fiscal 2018 transaction.
| Item | Outlook | Source |
|---|---|---|
| Q2 FY2027 revenue | $3.530bn to $3.550bn (+36% to +37%); Q2 FY2026 actual $2.59bn | 8-K Ex 99.1, 18 Nov 2026 |
| Q2 FY2027 NGS ARR and RPO | NGS ARR $10.20bn to $10.22bn (+61%); RPO $21.5bn to $21.6bn | 8-K Ex 99.1, 18 Nov 2026 |
| Q2 FY2027 non GAAP EPS | $1.01 to $1.03 on 837m to 842m shares | 8-K Ex 99.1, 18 Nov 2026 |
| FY2027 revenue | $14.52bn to $14.57bn (1 Sep 2026: $14.10bn to $14.20bn); Q2 to Q4 implied $11.08bn to $11.13bn | 8-K Ex 99.1; derived |
| FY2027 NGS ARR | $11.475bn to $11.525bn (1 Sep 2026: $11.075bn to $11.175bn) | 8-K Ex 99.1 |
| FY2027 RPO | $25.3bn to $25.5bn (1 Sep 2026: $25.2bn to $25.4bn) | 8-K Ex 99.1 |
| FY2027 non GAAP EPS | $4.26 to $4.30 on 844m to 847m shares (1 Sep 2026: $4.16 to $4.19) | 8-K Ex 99.1 |
| FY2027 margins | non GAAP operating margin 29.5% and adjusted free cash flow margin 38.0%, both unchanged | 8-K Ex 99.1 |
| FY2026 revenue guidance path | $10.50bn to $10.54bn (Nov 2025, before acquisitions), $11.28bn to $11.31bn (Feb 2026), $11.415bn to $11.425bn (Jun 2026); actual $11.48bn | 8-K Ex 99.1 releases |
| Longer term | NGS ARR $20bn in FY2030; adjusted free cash flow margin 40% in FY2028 | 8-K Ex 99.1, 1 Sep 2026 |
Management and CFO commentary
- PANW files no separate CFO commentary document; the points below come from the CFO and CEO statements and guidance in the releases filed as 8-K Ex 99.1 and 99.2.
- Q1 FY2027 release (18 Nov 2026), CFO Dipak Golechha: growth rose across each segment in a seasonally slower Q1; full year guidance raised on the threat environment and demand.
- Q1 FY2027 release, CEO Nikesh Arora: a record Q1 and one of the largest NGS ARR results against expectations; Applied Compute is to deliver secure open weight models.
- Q4 FY2026 release (1 Sep 2026): nearly $1bn of net new NGS ARR in Q4 FY2026; target of $20bn NGS ARR in FY2030 (CEO) and a 40% adjusted free cash flow margin in FY2028 (CFO).
- Q3 FY2026 release (2 Jun 2026): integration of acquisitions ahead of plan; Q3 revenue included $388m from CyberArk and Chronosphere.
| Speaker | Date and source | Statement |
|---|---|---|
| Nikesh Arora, Chairman and CEO | 18 Nov 2026, 8-K Ex 99.1 | “As AI reshapes the threat landscape, we must continually evolve” |
| Dipak Golechha, CFO | 18 Nov 2026, 8-K Ex 99.1 | “we are materially raising our full year guidance” |
| Nikesh Arora, Chairman and CEO | 18 Nov 2026, 8-K Ex 99.2 | “Every enterprise is going to run a mix of open and closed models” |
| Item | Disclosure |
|---|---|
| 10-K FY2026, Item 7 | Revenue $11.48bn (+24%); NGS ARR $9.1bn against $5.6bn; RPO $21.2bn against $15.8bn; gross margin 70.4% against 73.4%; operating margin 6.1% against 13.5%. |
| 10-K FY2026, Note 4 Acquisitions | CyberArk (11 Feb 2026) consideration $21.06bn, of which $18.49bn in 112m PANW shares; Chronosphere (29 Jan 2026) $2.95bn; Koi Security $231m; Portkey $117m. Chronosphere and CyberArk added $930m of revenue and a $797m net loss in FY2026. |
| 10-K FY2026, balance sheet | Goodwill $22.01bn against $4.57bn and intangible assets $7.02bn against $0.76bn at 31 Jul 2026; total assets $48.46bn against $23.58bn. |
| 10-K FY2026, Note 9 Debt | CyberArk 0% convertible notes due 2030 carried at fair value, $1.77bn at 31 Jul 2026; a $562m loss on their fair value in FY2026 is in other income. |
| 10-K FY2026, segments | One operating and reportable segment in FY2026; the Q1 FY2027 10-Q reports three segments (Network & AI Security, Cortex, Idira) plus Corporate & Other. |
| 10-K FY2026, capital return | 7m shares bought for $1.0bn at $147.70 on average in FY2026; no dividend. |
| 10-Q Q1 FY2027, segments | Network & AI Security $2.28bn (+20%), Cortex $647m (+53%, mainly Chronosphere), Idira $353m (CyberArk), Corporate & Other $163m. |
| 10-Q Q1 FY2027, taxes | Discrete US federal tax benefit of $369m on a fiscal 2018 transaction after judicial developments; effective tax rate (1,828%). |
| 10-Q Q1 FY2027, 2030 Notes | Sale price condition met in the quarter to 30 Sep 2026; holders may convert in the quarter to 31 Dec 2026; $1.1bn principal outstanding, fair value $1.93bn, classified as current. |
| 10-Q Q1 FY2027, commitments | Purchase commitments $8.0bn at 31 Oct 2026, of which cloud hosting $7.42bn; contingent consideration for the IBM QRadar assets $144m. |
| 10-Q Q1 FY2027, subsequent event | Applied Compute merger agreement of 18 Nov 2026, $4.5bn in shares, expected to close in Q3 FY2027 subject to regulatory clearance (HSR waiting period, 8-K Item 7.01). |
7 Peer Valuation & Sector Summary
- Sector: cybersecurity platforms. The FY2026 10-K adds cloud infrastructure providers and AI companies with native security, and vendors bundling identity and observability, to the competitive risks.
- Growth, latest period year on year: PANW 39.2% (incl. acquisitions), CRWD 25.8%, ZS 24.9%, CSCO 24.4% (company total), FTNT 20.5%.
- GAAP operating margin TTM: FTNT 33.0%, CSCO 26.3%, PANW 3.9%, CRWD (2.5%), ZS (4.0%). Free cash flow margin: FTNT 43.5%, PANW 34.3%, CRWD 28.3%.
- Valuation, EV/Sales TTM: CRWD 44.2x, PANW 21.8x, FTNT 11.7x, ZS 9.1x, CSCO 5.9x. GAAP P/E: FTNT 43.1x, CSCO 25.8x.
| Company | Revenue TTM ($bn) | Revenue growth (%) | Gross margin (%) | Operating margin (%) | Net margin (%) | FCF margin (%) | ROE (%) | Net cash ($bn) | Market value ($bn) | EV/Sales (x) | P/E TTM (x) |
|---|---|---|---|---|---|---|---|---|---|---|---|
| PANW | 12.5 | 39.2 | 68.9 | 3.9 | 3.7 | 34.3 | 1.6 | 7.2 | 279 | 21.8 | n/a |
| CRWD | 5.4 | 25.8 | 75.2 | (2.5) | 0.8 | 28.3 | 1.1 | 4.3 | 243 | 44.2 | n/a |
| FTNT | 7.9 | 20.5 | 79.7 | 33.0 | 29.0 | 43.5 | 131.0 | 4.8 | 97 | 11.7 | 43.1 |
| ZS | 3.4 | 24.9 | 76.8 | (4.0) | (1.9) | 25.4 | (2.9) | 1.8 | 32 | 9.1 | n/a |
| CSCO | 67.0 | 24.4 | 64.1 | 26.3 | 22.3 | 20.5 | 30.1 | (14.0) | 383 | 5.9 | 25.8 |

8 Material Events & Contracts
- Fourteen Forms 8-K from 19 Nov 2025 to 18 Nov 2026: five earnings releases, two acquisition agreements and two completions, buyback and convertible note filings, the headquarters lease extension, the 2025 annual meeting results and two director and officer filings.
- 8-K of 18 Nov 2026, Items 3.02 and 7.01: merger agreement with Applied Compute, Inc. for $4.5bn, subject to adjustments, paid in PANW shares valued at $337.16, the volume weighted average close for the 15 trading days to 17 Nov 2026. The 8-K states the number of shares to be issued is not yet known; $4.5bn at $337.16 implies about 13.3m shares (derived). Shares are to go to accredited investors under Section 4(a)(2) and Regulation D. Closing needs HSR clearance and is expected in Q3 FY2027; Applied Compute's CEO is to become Co Chief AI Officer (Ex 99.2).
- 8-K of 18 Nov 2026, Item 8.01: the board extended the $1bn repurchase authorization to 31 Dec 2027; about 821m shares were outstanding on 11 Nov 2026.
- CyberArk (8-K of 11 Feb 2026): completed on 11 Feb 2026 for $45.00 in cash and 2.2005 PANW shares per CyberArk share; consideration $21.06bn (10-K FY2026). PANW guaranteed CyberArk's $1.25bn of 0% notes due 2030 and assumed the capped calls; conversions from 23 Mar 2026 are settled with cash for principal.
- Chronosphere (8-K of 19 Nov 2025 and 29 Jan 2026): agreed at $3.35bn in cash and replacement awards, completed on 29 Jan 2026; consideration $2.95bn (10-K FY2026). Chronosphere reported ARR above $160m at Sep 2025.
| Date | Items | Event |
|---|---|---|
| 19 Nov 2025 | 2.02, 7.01, 8.01, 9.01 | Q1 FY2026 results (Ex 99.1): revenue $2.47bn (+16%), NGS ARR $5.9bn (+29%); agreement to buy Chronosphere for $3.35bn in cash and replacement awards (Ex 99.2); $1bn buyback authorization extended to 31 Dec 2026 |
| 19 Nov 2025 | 5.02, 9.01 | Mark Goodburn appointed director and audit committee chair; Mary Pat McCarthy to retire on 23 Jan 2026 (Ex 99.1) |
| 21 Nov 2025 | 8.01 | Proxy supplement: 2,735,105 shares of equity awards granted on 10 Nov 2025; 24,341,864 shares left for grant under the 2021 Plan |
| 11 Dec 2025 | 5.02, 5.07, 9.01 | Annual meeting of 9 Dec 2025: three directors elected; say on pay not approved (221.2m for, 253.8m against); 2021 Plan +10m shares (Ex 10.1); proposal to elect directors annually approved |
| 29 Jan 2026 | 7.01, 9.01 | Chronosphere acquisition completed on 29 Jan 2026 (Ex 99.1) |
| 11 Feb 2026 | 1.01, 2.03, 8.01, 9.01 | CyberArk acquisition completed: $45.00 cash plus 2.2005 PANW shares per CyberArk share; PANW guarantees CyberArk's $1.25bn 0% convertible notes due 2030, now exchangeable into PANW shares (Ex 4.1, 4.2); capped calls amended (Ex 4.4); intent to list on the Tel Aviv Stock Exchange (Ex 99.1) |
| 17 Feb 2026 | 2.02, 9.01 | Q2 FY2026 results (Ex 99.1): revenue $2.59bn (+15%), NGS ARR $6.3bn (+33%), RPO $16.0bn; FY2026 revenue guidance raised to $11.28bn to $11.31bn incl. acquisitions |
| 11 Mar 2026 | 8.01 | Buyback: $1.0bn bought on 20 and 24 Feb 2026, about 6.8m shares at $147.69; board added $1.0bn authorization (total $5.1bn since 2019) |
| 23 Mar 2026 | 8.01 | 2030 Notes: conversions from 23 Mar 2026 settled in cash for $1,000 of principal per $1,000 note and the excess in shares or cash |
| 10 Apr 2026 | 1.01, 2.03, 9.01 | Santa Clara headquarters leases (about 940,000 square feet) extended 12 years to 31 Jul 2040; base rent $3.825 per square foot per month with 2% annual increases after a 12 month abatement (Ex 10.1 to 10.3) |
| 2 Jun 2026 | 2.02, 9.01 | Q3 FY2026 results (Ex 99.1): revenue $3.00bn (+31%) incl. $388m from CyberArk and Chronosphere; NGS ARR $8.1bn (+60%); RPO $18.4bn (+36%) |
| 21 Aug 2026 | 5.02, 5.03, 9.01 | Executive change in control and severance policy (Ex 10.1): CEO 200% of salary and bonus in a change in control, other executive officers 150%; amended bylaws (Ex 3.1) |
| 1 Sep 2026 | 2.02, 9.01 | Q4 FY2026 results (Ex 99.1): revenue $3.41bn (+34%), NGS ARR $9.10bn (+63%), RPO $21.2bn; FY2027 guidance revenue $14.10bn to $14.20bn; Console acquired |
| 18 Nov 2026 | 2.02, 3.02, 7.01, 8.01, 9.01 | Q1 FY2027 results (Ex 99.1); agreement to buy Applied Compute for $4.5bn in shares at $337.16 each, issued under Section 4(a)(2) (Item 3.02, Ex 99.2); $1bn buyback authorization extended to 31 Dec 2027 (Item 8.01) |
| Contract | Terms |
|---|---|
| Applied Compute merger agreement (18 Nov 2026) | $4.5bn in PANW shares at $337.16 per share, subject to adjustments; Fortis Advisors as representative of the indemnifying parties; HSR waiting period required (8-K Items 3.02, 7.01). |
| 2030 Notes and capped calls | CyberArk 0% convertible senior notes due 15 Jun 2030, $1.25bn issued, $1.1bn outstanding at 31 Oct 2026, guaranteed by PANW; convertible in the quarter to 31 Dec 2026 (8-K Ex 4.1, 4.2, 4.4; 10-Q Q1 FY2027). |
| Headquarters lease amendments (8 Apr 2026) | About 940,000 square feet at Tannery Way, Santa Clara, extended to 31 Jul 2040; $3.825 per square foot per month after 12 months free, +2% a year (8-K Ex 10.1 to 10.3). |
| Purchase commitments | $8.0bn at 31 Oct 2026, of which cloud hosting $7.42bn and inventory $402m; $504m due in the rest of FY2027 (10-Q Q1 FY2027). |
| Executive change in control and severance policy (20 Aug 2026) | CEO 200% of salary and target bonus and 24 months of health benefits on a change in control termination; other executive officers 150% and 18 months (8-K Ex 10.1). |
| Revolving credit facility | $400m unsecured, expandable by $350m; nothing drawn at 31 Oct 2026. |
9 Ownership, Voting Power & Annual Meeting
- One class of common stock with one vote per share. Vanguard Capital Management 7.4% and BlackRock 6.0% are the holders of 5% or more listed in the 2026 proxy statement; directors and executive officers held 0.55%.
- Annual meeting of 9 Dec 2025 (Item 5.07): say on pay received 46.6% of votes cast and was not approved; a shareholder proposal to elect all directors annually received 93.8% and was approved; John Donovan was elected with 78.9%; the 2021 Plan received 10m more shares.
- 2026 annual meeting on 8 Dec 2026 (proxy of 27 Oct 2026): election of directors, auditor ratification, say on pay, an amendment to the 2021 Equity Incentive Plan and an advisory vote on an annual voting policy for directors; 818,771,631 shares may vote.
- Insiders, Forms 4 for transactions 26 Nov 2025 to 4 Nov 2026: CEO Nikesh Arora bought 68,085 shares on the open market on 27 Mar 2026 for $10.0m (about $146.88 a share); insider sales totalled $126.8m, $100.0m of it under Rule 10b5‑1 plans, at $147.90 to $417.13 a share.
| Proposal | For (m votes) | Against (m votes) | Abstain (m votes) | For as % of votes cast | Result |
|---|---|---|---|---|---|
| Election of John M. Donovan | 376.3 | 100.8 | 2.4 | 78.9 | Elected |
| Election of James J. Goetz | 448.9 | 29.6 | 0.9 | 93.8 | Elected |
| Election of Helle Thorning‑Schmidt | 475.9 | 2.5 | 1.1 | 99.5 | Elected |
| Ratify Ernst & Young LLP | 563.9 | 14.0 | 1.0 | 97.6 | Ratified |
| Say on pay (advisory) | 221.2 | 253.8 | 4.4 | 46.6 | Not approved |
| 2021 Plan amendment (+10m shares) | 452.6 | 22.6 | 4.2 | 95.2 | Approved |
| Shareholder: buybacks and pay metrics policy | 14.8 | 458.7 | 6.0 | 3.1 | Not approved |
| Shareholder: elect directors annually | 443.6 | 29.3 | 6.5 | 93.8 | Approved |
Annual meeting remarks
- No management remarks, presentation or shareholder questions from the meeting of 9 Dec 2025 were filed; the Item 5.07 filing reports vote counts only.
| Holder | Shares (m) | Share of class (%) | Basis |
|---|---|---|---|
| Vanguard Capital Management | 60.8 | 7.4 | 2026 proxy, Schedule 13G |
| BlackRock, Inc. | 49.2 | 6.0 | 2026 proxy, Schedule 13G |
| Nikesh Arora, Chairman and CEO | 2.16 | under 1 | 2026 proxy |
| Nir Zuk | 1.99 | under 1 | 2026 proxy |
| Lee Klarich, Chief Product and Technology Officer | 1.07 | under 1 | 2026 proxy |
| Person | Shares | Value ($m) |
|---|---|---|
| Nikesh Arora, Chairman and CEO (purchase) | 68,085 | 10.00 |
| Lee Klarich, Chief Product and Technology Officer | 304,446 | 62.52 |
| James J. Goetz, director | 87,684 | 21.74 |
| William Jenkins, President | 63,336 | 21.26 |
| Dipak Golechha, CFO | 42,500 | 13.96 |
| John Key, director | 11,572 | 3.31 |
| Josh Paul, Chief Accounting Officer | 8,900 | 2.24 |
| Aparna Bawa, director | 4,745 | 1.57 |
| Helle Thorning‑Schmidt, director | 700 | 0.24 |
10 Risk Factors
- Item 1A of the FY2026 10-K holds 51 risk factors against 47 in the FY2025 10-K (16,571 words against 18,158): 12 added, 4 removed and 35 reworded or merged. Added factors cover identity security, AI agents as identities, cloud providers and AI companies as competitors, usage priced offerings and cloud capacity. The Q1 FY2027 10-Q repeats 49 factors unchanged and updates the 2030 Notes factor.
| Risk | Disclosure and change |
|---|---|
| Acquisition integration | CyberArk ($21.06bn) and Chronosphere ($2.95bn) closed in Q3 FY2026; goodwill $22.56bn and intangibles $6.87bn at 31 Oct 2026; Applied Compute ($4.5bn) pending. |
| GAAP profitability | GAAP operating margin 2.8% in Q1 FY2027 against non GAAP 30.7%; amortization $282m and share based compensation charges $622m in the quarter; $4.5bn of unrecognized share based compensation over 2.4 years. |
| 2030 Notes | $1.1bn principal convertible in the quarter to 31 Dec 2026, payable in cash for principal; fair value $1.93bn; fair value losses $157m in Q1 FY2027. |
| Usage priced offerings | Added factor: observability and AI offerings priced on consumption; AI native customers may cut usage after rapid growth. |
| Hardware supply and costs | Product gross margin 65.4% against 79.5%; MD&A cites supply chain challenges and memory and storage shortages; Flex is the main manufacturer. |
| Cloud capacity | Added factor on third party cloud capacity; cloud hosting commitments $7.42bn at 31 Oct 2026. |
| Israel | Operations in Israel expanded with CyberArk; the factor adds escalation involving Iran and reserve duty call ups. |
How risk factors changed
- Comparison: 10-K FY2026 filed 10 Sep 2026 acc 0001327567-26-000023 against 10-K FY2025 filed 29 Aug 2025 acc 0001327567-25-000027.
- 'AI' appears 52 times in 11 of 51 risk factors in the FY2026 10-K, against 23 times in 6 of 47 a year earlier.
- Identity security and AI agents are the subject of two added factors after the CyberArk acquisition.
- Observability is named in 4 factors against none a year earlier, after the Chronosphere acquisition.
- Item 1A is 1,587 words shorter despite 4 more factors, as merged supply and seasonality factors replace five older ones.

| Measure | 10-K FY2025 | 10-K FY2026 |
|---|---|---|
| Risk factors (count) | 47 | 51 |
| Words in Item 1A | 18,158 | 16,571 |
| Change | Risk factor | What changed |
|---|---|---|
| Added | Consumption priced offerings and usage optimization | Observability and AI offerings priced on usage; AI native customers can reduce consumption after rapid growth. |
| Added | Identity security market lacks a standard definition | Analyst rankings of the identity security category can affect demand after the CyberArk acquisition. |
| Added | Vendor consolidation may favor broader platforms | Hyperscalers and software companies can bundle identity and observability with other security products. |
| Added | Cloud providers and AI companies offer native security | Native security, identity and observability tools bundled at low or no cost with cloud infrastructure. |
| Added | Ecosystem of third party integrations | Strategy depends on integrations with third party technologies that need ongoing investment. |
| Added | AI agents as a new class of identity | Identity products must secure AI agents at a scale beyond human identity models. |
| Added | Shared responsibility security model | Customer configuration errors can harm the company's reputation. |
| Added | Service level commitments | Failure to meet service level terms in subscription agreements can reduce revenue. |
| Added | Third party cloud data center capacity | Cloud capacity limits, incl. demand for AI compute, can slow onboarding and usage growth. |
| Added | Foreign certification and testing requirements | Products need certification and regulatory approval in foreign jurisdictions. |
| Added | Cash to settle 2030 Notes | PANW guarantees CyberArk's 2030 Notes and must pay cash on conversion, repurchase or maturity. |
| Added | Capped Calls may affect the 2030 Notes and the stock | Replaces the factor on the 2025 warrant transactions. |
| Removed | Completion of the CyberArk acquisition | Removed after the closing on 11 Feb 2026. |
| Removed | Warrant transactions | Removed after the 2025 warrants settled; replaced by the Capped Calls factor. |
| Removed | Raising additional capital | No longer a separate factor. |
| Removed | International trade regulations and export controls | Folded into the factors on international sales and on manufacturing partners. |
| Reworded | AI development, deployment and use | Extended by 236 words; AI vulnerabilities found by researchers or attackers before remediation, and AI investments that may not earn an adequate return. |
| Reworded | Operations and employees in Israel | Israel operations expanded with CyberArk; adds escalation involving Iran and reserve duty call ups. |
| Reworded | Tax liabilities | Extended by 261 words on challenges to intercompany valuation of acquired technology. |
| Reworded | Manufacturing partners and limited supply | Merges three supply factors; names Flex as main manufacturer and US and Chinese tariffs on components. |
| Reworded | Network or data security incidents | Rewritten under a new heading; 419 words. |
| Reworded | CyberArk changed the scope of the business | Moves from expected changes to changes that occurred after the closing. |
| Reworded | Results vary, incl. seasonality | Merges the former seasonality factor. |
| Reworded | Competition | Shortened by 128 words as cloud providers and consolidation move to new factors. |
| Filing | Change disclosed |
|---|---|
| 10-Q Q1 FY2027 filed 18 Nov 2026 | 51 factors, 49 unchanged; the 2030 Notes factor adds that the sale price condition was met, so holders may convert in the quarter to 31 Dec 2026, and the subscription factor is updated. |
11 Stock Price, Scenarios & Sensitivity
- PANW closed at $339.92 on 18 Nov 2026, before the Q1 FY2027 release after the close. 52 week closing high $419.91 and closing low $141.67; the close is 19.0% below the 52 week closing high. Highest month end close in five years $397.31 in Sep 2026.
- Valuation: market value $279.1bn on 821m shares (11 Nov 2026); enterprise value $271.9bn after net cash of $7.21bn. EV/Sales 21.8x TTM; P/E 86.1x TTM non GAAP EPS of $3.95 and 79.4x the FY2027 non GAAP EPS guidance midpoint. GAAP P/E is not meaningful on TTM EPS of $0.61.
- Scenario method: implied price equals TTM Q1 FY2030 revenue times an exit EV/Sales multiple, plus net cash of $7.21bn, over 854m shares (821m plus 4% for the Applied Compute shares and stock awards). Revenue grows from TTM Q1 FY2027 $12.5bn for three years. Growth rates, multiples and the 4% share increase are this report's own assumptions; company guidance covers FY2027 only.

Critical factors and core assumptions
| Factor | Current value | Best case requires | Evidence in filings |
|---|---|---|---|
| NGS ARR growth | $9.73bn, +66% incl. acquisitions; FY2027 guidance +26% to +27% | above 25% a year after the acquisitions lap | 8-K Ex 99.1, 18 Nov 2026; management FY2030 target $20bn |
| Network & AI Security growth | +19.9% in Q1 FY2027 | near 20% as firewall and SASE demand continues | 10-Q Q1 FY2027 segment note |
| Cortex and observability | $647m, +53.3% | usage growth without customer optimization | 10-K FY2026 added risk factor on usage pricing |
| Idira margin and growth | $353m revenue, 90.1% segment gross margin | identity sales into the installed base | 10-Q Q1 FY2027 |
| GAAP margin gap | GAAP 2.8% against non GAAP 30.7% | amortization and stock pay fall as a share of revenue | 8-K Ex 99.1 GAAP to non GAAP tables |
| Dilution | 821m shares; about 13.3m implied for Applied Compute (derived) | buybacks offset awards and deal shares | 8-K Items 3.02 and 8.01 |
- Revenue base TTM Q1 FY2027 $12.5bn; FY2027 guidance $14.52bn to $14.57bn; Q1 FY2027 growth +39.2%, 25.0% excluding Idira.
- Best case (report assumption): 24% revenue CAGR with NGS ARR growth above 25% and Applied Compute adding revenue; exit EV/Sales 18x, against 21.8x today.
- Base case (report assumption): 17% revenue CAGR, with FY2027 near the raised guidance and mid teens growth after the acquisitions lap; exit EV/Sales 14x.
- Worst case (report assumption): 10% revenue CAGR as organic growth slows and usage priced revenue is optimized by customers; exit EV/Sales 8x, below Fortinet (11.7x) and Zscaler (9.1x) at 18 Nov 2026.
- Shares up 4% (report assumption) from 821m for the Applied Compute shares and stock awards net of buybacks; net cash held at $7.21bn; no dividends.
Scenarios, three years forward
| Measure | Worst case | Base case | Best case |
|---|---|---|---|
| Revenue CAGR, 3 years (%) | 10.0 | 17.0 | 24.0 |
| Revenue, TTM Q1 FY2030 ($bn) | 16.6 | 19.9 | 23.7 |
| Exit EV/Sales (x) | 8.0 | 14.0 | 18.0 |
| Implied price ($) | 164 | 335 | 509 |
| Change against $339.92 (%) | (52) | (1) | 50 |
| Implied annual return (%) | (21.6) | (0.4) | 14.4 |
| Description | Organic slowdown, lower multiple | FY2027 guidance, mid teens after | NGS ARR growth above 25% |

Sensitivity analysis
| Revenue CAGR \ EV/Sales | 8x | 11x | 14x | 16x | 18x |
|---|---|---|---|---|---|
| 10% | $164 | $222 | $280 | $319 | $358 |
| 14% | $181 | $246 | $311 | $354 | $397 |
| 17% | $195 | $265 | $335 | $382 | $429 |
| 20% | $210 | $286 | $361 | $412 | $462 |
| 24% | $231 | $314 | $398 | $453 | $509 |
Disclaimer
This analysis is for information only and is not financial advice. It is derived from public SEC filings retrieved via sec-api.io and is not a publication of the U.S. Securities and Exchange Commission. Scenario values are model outputs under stated assumptions and are not forecasts. Data as of 19 November 2026.
Sources
All company and peer figures are read from SEC filings retrieved through the sec-api.io MCP server. Share prices are regular session closes as dated in the text.
| Form | Period | Filed | Accession number |
|---|---|---|---|
| 8-K Ex 99.1 / 99.2 | Q1 FY2027 | 18 Nov 2026 | 0001327567-26-000030 |
| 10-Q | Q1 FY2027 | 18 Nov 2026 | 0001327567-26-000033 |
| DEF 14A | 2026 annual meeting | 27 Oct 2026 | 0001308179-26-000432 |
| 10-K | FY2026 | 10 Sep 2026 | 0001327567-26-000023 |
| 8-K Ex 99.1 | Q4 FY2026 | 1 Sep 2026 | 0001327567-26-000019 |
| 8-K Item 5.02, 5.03 | Aug 2026 | 21 Aug 2026 | 0001193125-26-361122 |
| 8-K Ex 99.1 | Q3 FY2026 | 2 Jun 2026 | 0001327567-26-000012 |
| 8-K Item 1.01 | Apr 2026 | 10 Apr 2026 | 0001193125-26-151637 |
| 8-K Item 8.01 | Mar 2026 | 23 Mar 2026 | 0001193125-26-119729 |
| 8-K Item 8.01 | Mar 2026 | 11 Mar 2026 | 0001327567-26-000009 |
| 8-K Ex 99.1 | Q2 FY2026 | 17 Feb 2026 | 0001327567-26-000003 |
| 8-K Ex 4.1, 4.2, 4.4, 99.1 | Feb 2026 | 11 Feb 2026 | 0001193125-26-045600 |
| 8-K Ex 99.1 | Jan 2026 | 29 Jan 2026 | 0001193125-26-029489 |
| 8-K Item 5.07 | Dec 2025 | 11 Dec 2025 | 0001193125-25-315915 |
| 8-K Item 8.01 | Nov 2025 | 21 Nov 2025 | 0001193125-25-291350 |
| 10-Q | Q1 FY2026 | 19 Nov 2025 | 0001327567-25-000035 |
| 8-K Ex 99.1 / 99.2 | Q1 FY2026 | 19 Nov 2025 | 0001327567-25-000032 |
| 8-K Item 5.02 | Nov 2025 | 19 Nov 2025 | 0001193125-25-288132 |
| 10-K | FY2025 | 29 Aug 2025 | 0001327567-25-000027 |
| 10-K | FY2024 | 6 Sep 2024 | 0001327567-24-000029 |
| Forms 4 | Nov 2025 to Nov 2026 | 5 Nov 2026 | 0001493152-26-050251 |
| Company | Form | Filed | Accession number |
|---|---|---|---|
| Cisco | 8-K Ex 99.1 | 12 Nov 2026 | 0000858877-26-000170 |
| CrowdStrike | 8-K Ex 99.1 | 26 Aug 2026 | 0001535527-26-000029 |
| CrowdStrike | 10-Q | 26 Aug 2026 | 0001535527-26-000031 |
| Datadog | 8-K Ex 99.1 | 4 Nov 2026 | 0001628280-26-069792 |
| Fortinet | 8-K Ex 99.1 | 5 Feb 2026 | 0001262039-26-000003 |
| Fortinet | 8-K Ex 99.1 | 28 Oct 2026 | 0001262039-26-000024 |
| Fortinet | 10-Q (cover share count) | 29 Oct 2026 | 0001262039-26-000027 |
| Okta | 8-K Ex 99.1 | 26 Aug 2026 | 0001660134-26-000068 |
| Zscaler | 8-K Ex 99.1 | 3 Sep 2026 | 0001713683-26-000156 |
| Zscaler | 10-K | 3 Sep 2026 | 0001713683-26-000157 |
| Filed | Exhibit | Document | Content |
|---|---|---|---|
| 19 Nov 2025 | Ex 99.1 | Q1 FY2026 results release | Revenue $2.47bn (+16%); NGS ARR $5.9bn (+29%); RPO $15.5bn (+24%); FY2026 guidance: revenue $10.50bn to $10.54bn; NGS ARR $7.00bn to $7.10bn; adjusted free cash flow margin 38% to 39% |
| 19 Nov 2025 | Ex 99.2 | Chronosphere agreement | Consideration $3.35bn in cash and replacement equity awards; Chronosphere ARR over $160m at end of Sep 2025, growing at triple digit rates |
| 19 Nov 2025 | Ex 99.1 | Director appointment release | Mark Goodburn, former KPMG International Chairman of Advisory, joins the board and chairs the audit committee; Mary Pat McCarthy to retire on 23 Jan 2026 |
| 11 Dec 2025 | Ex 10.1 | Amended 2021 Equity Incentive Plan | Adds 10,000,000 shares to the plan reserve, approved at the 9 Dec 2025 meeting |
| 29 Jan 2026 | Ex 99.1 | Chronosphere completion release | Merger completed on 29 Jan 2026; Chronosphere becomes a wholly owned subsidiary |
| 11 Feb 2026 | Ex 4.1 / 4.2 | CyberArk indenture and supplemental indenture | 0% convertible notes due 2030 of $1.25bn become exchangeable into PANW shares and cash; PANW guarantees CyberArk's obligations |
| 11 Feb 2026 | Ex 4.4 | Capped call amendments | Dealers deliver PANW shares in place of CyberArk shares; PANW assumes CyberArk's rights and obligations |
| 11 Feb 2026 | Ex 99.1 | CyberArk completion release | $45.00 in cash and 2.2005 PANW shares per CyberArk share; Intent to add a secondary listing on the Tel Aviv Stock Exchange under the ticker CYBR |
| 17 Feb 2026 | Ex 99.1 | Q2 FY2026 results release | Revenue $2.59bn (+15%); NGS ARR $6.3bn (+33%); RPO $16.0bn (+23%); FY2026 guidance incl. acquisitions: revenue $11.28bn to $11.31bn; NGS ARR $8.52bn to $8.62bn |
| 10 Apr 2026 | Ex 10.1 to 10.3 | Headquarters lease amendments | Leases on Buildings E, F, G and H at Tannery Way extended 12 years to 31 Jul 2040; Base rent $3.825 per rentable square foot per month after 12 months of abatement, +2% a year; improvement allowance up to $72.50 per square foot |
| 2 Jun 2026 | Ex 99.1 | Q3 FY2026 results release | Revenue $3.00bn (+31%) incl. $388m from CyberArk and Chronosphere; NGS ARR $8.1bn (+60%) incl. $1.6bn acquired; RPO $18.4bn (+36%) incl. $1.8bn acquired |
| 21 Aug 2026 | Ex 10.1 | Executive change in control and severance policy | Outside a change in control: 100% of salary, 12 months of health benefits and 12 months of equity vesting; In a change in control: CEO 200% of salary and target bonus, other executive officers 150%; full vesting of awards |
| 21 Aug 2026 | Ex 3.1 | Amended and restated bylaws | Updates for Delaware law amendments, quorum and voting standards, proxy authorizations and indemnification |
| 1 Sep 2026 | Ex 99.1 | Q4 FY2026 results release | Revenue $3.41bn (+34%); NGS ARR $9.10bn (+63%); RPO $21.2bn (+34%); FY2026 adjusted free cash flow margin 38.4%; FY2027 guidance: revenue $14.10bn to $14.20bn; NGS ARR $11.075bn to $11.175bn; non GAAP EPS $4.16 to $4.19 |
| 18 Nov 2026 | Ex 99.1 | Q1 FY2027 results release | Revenue $3.44bn (+39%); NGS ARR $9.73bn (+66%); RPO $21.0bn (+35%); adjusted free cash flow $1.94bn, 56.2% margin; FY2027 guidance raised: revenue $14.52bn to $14.57bn; NGS ARR $11.475bn to $11.525bn; non GAAP EPS $4.26 to $4.30 |
| 18 Nov 2026 | Ex 99.2 | Applied Compute agreement | All stock transaction valued at $4.5bn, subject to adjustments; expected to close in Q3 FY2027; Applied Compute builds post training and inference software for open weight AI models; its CEO is to become Co Chief AI Officer |
Read next
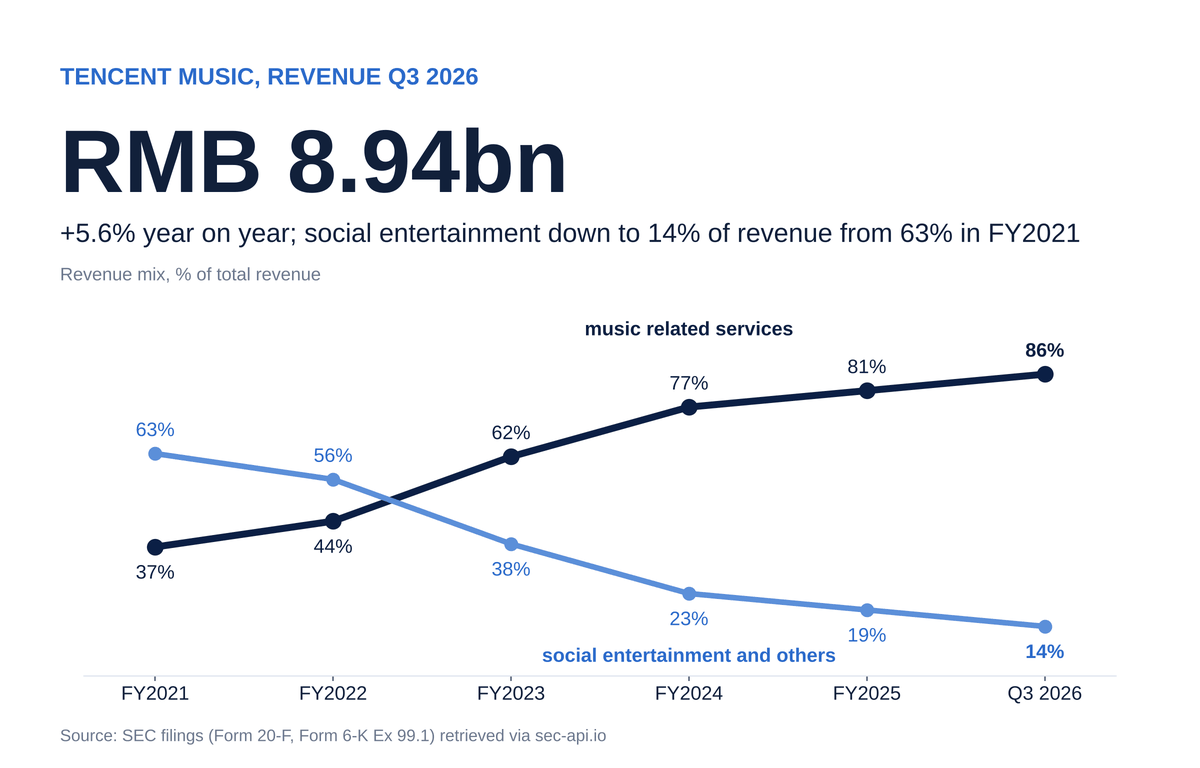
Tencent Music Entertainment (TME) Q3 2026 Earnings: RMB 8.94bn Revenue, Membership +9.2% and RMB 2.72bn Operating Profit, SEC Filing Analysis
November 19, 2026·34 min read
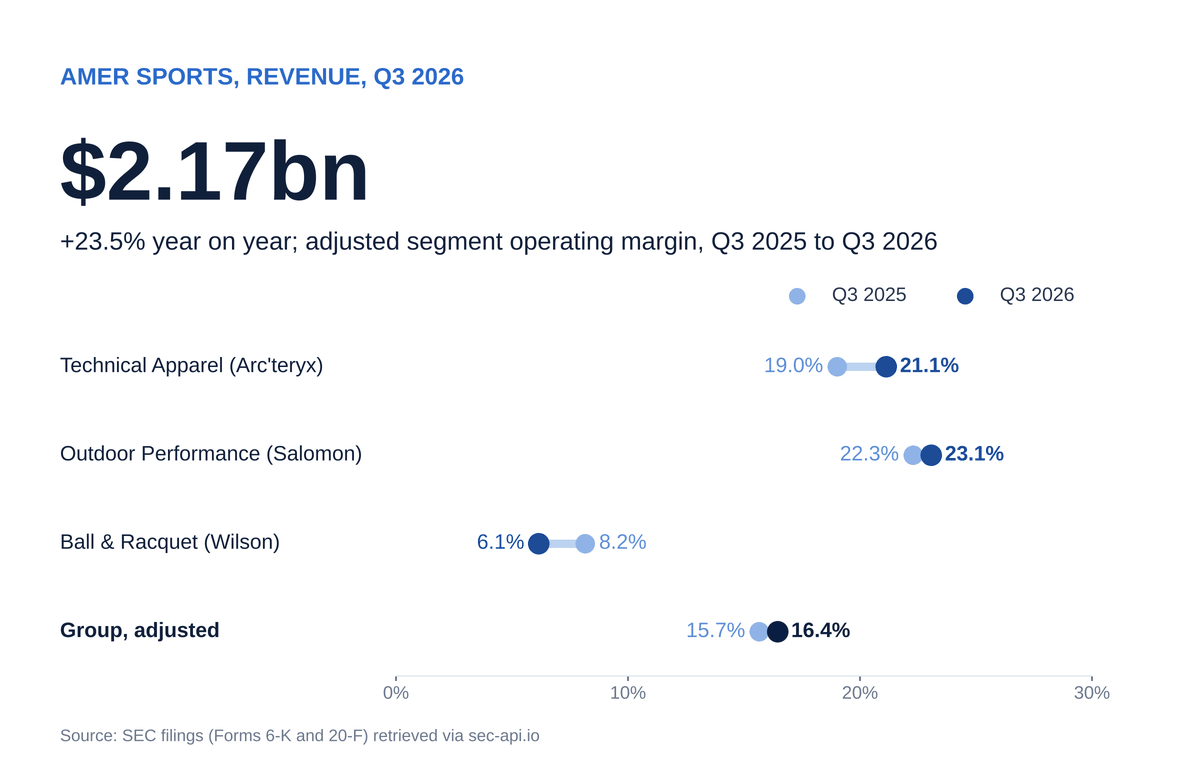
Amer Sports (AS) Q3 2026 Earnings: $2.17bn Revenue, 15.8% IFRS Operating Margin and a $1bn Buyback, SEC Filing Analysis
November 19, 2026·37 min read