Sea Limited (SE), Financial Analysis
Insights derived from analysing SEC filings. Independent analysis, not a publication of the SEC.
- Revenue $8.58bn in Q3 2026, +43.4% year on year; costs +43.7%, so the operating margin was 7.7% against 8.0%. Operating income $664.2m (+39.5%), net income $502.5m (+34.0%), diluted EPS $0.78 against $0.59. Adjusted EBITDA $931.3m (+28.9%) on the new definition that excludes Garena's deferred revenue effect.
- Shopee GMV $39.7bn (+23.3%), the slowest growth of the seven quarters shown, while Shopee revenue rose +41.3% to $6.07bn. Core marketplace revenue (fees and ads) was 11.6% of GMV against 9.5% a year earlier. Shopee adjusted EBITDA $269.2m; 9M 2026 $747.8m against the $1bn for FY2026 that the CEO was optimistic Shopee would reach (6-K, 11 Aug 2026).
- Monee revenue $1.62bn (+63.9%) on loans of $12.6bn (+60.0%); the NPL ratio over 90 days rose to 1.3% from 1.1%. Group provision for credit losses $681.5m (+82.3%); Monee adjusted EBITDA $298.3m (+15.5%). On 20 Oct 2026 the CEO wrote that Monee may go public.
- Garena revenue $840.1m (+28.6%) and adjusted EBITDA $458.2m (+45.9%), while bookings rose +5.9% to $890.0m. Quarterly paying users 68.6m (+4.1%); active users 671.7m against 670.8m.
- Operating cash flow $4.06bn in 9M 2026 against capex of $1.04bn; the loan book took a further $4.45bn of investing cash. Cash and short term investments $8.02bn and borrowings $1.22bn at 30 Sep 2026, after the $1.05bn redemption of the 2026 convertible notes. Buybacks reached $997.2m under the first $1bn program; a second $1.0bn was approved on 9 Nov 2026.
- Shares closed at $74.52 on 12 Nov 2026, 49.4% below the 52 week closing high of $147.26; P/E 26.8x TTM diluted EPS of $2.78 and EV/Sales 1.28x. Scenario prices three years forward on exit P/E: base $105, best $211, worst $32.
Figures are read from the Q3 2026 Form 6-K of 10 Nov 2026 (Ex 99.1 results release, acc 0001193125-26-455420), the Forms 6-K with the Q3 2025 to Q2 2026 releases, the FY2025, FY2024 and FY2023 annual reports on Form 20-F, and the Forms 6-K with all their exhibits from Nov 2025 to Nov 2026, incl. the buyback announcements, the annual general meeting notice and the CEO email of 20 Oct 2026. Sea is a foreign private issuer and files Forms 20-F and 6-K in place of Forms 10-K, 10-Q and 8-K; its quarterly 6-K carries summary statements without notes. Sea files no separate CFO commentary; management statements come from the CEO comments in the 6-K releases. Ownership data come from the FY2025 20-F, Schedules 13D and 13G and Forms 4 for central index key 1703399; peer figures from each peer's own filings. Share price $74.52 is the regular session close of 12 Nov 2026. Accession numbers appear in the Sources appendix.
1 Revenue & Business Model
- Storyline: Sea runs three businesses that feed each other; Shopee brings buyers and sellers, Monee lends to them and processes their payments, and Garena funded the group's growth. Revenue rose from $10.0bn in FY2021 to $30.3bn TTM Q3 2026, and the operating result moved from ($1.58bn) to $2.47bn. Chapters 2 to 4 cover the three revenue drivers: Shopee, Monee and Garena, each with industry change and competitors.
- Segment revenue Q3 2026: Shopee $6.07bn (70.7% of the total, incl. $746.1m sales of goods), Monee $1.62bn (18.9%), Garena $840.1m (9.8%) and other services $50.1m. Adjusted EBITDA by segment: Garena $458.2m, Monee $298.3m, Shopee $269.2m; other services ($83.9m).
- Mix shift FY2021 to FY2025: Garena fell from 43.4% of revenue to 10.5%, Shopee rose from 51.5% to 72.2% and Monee from 4.7% to 16.5% (20-F).
- Revenue by region FY2025: Southeast Asia $15.17bn (66.1%), Latin America $5.53bn (24.1%, +68.9%), rest of Asia $2.01bn, rest of world $228.3m (20-F).
- Scale (Q4 2025 release and 20-F FY2025): Shopee served around 400m active buyers and 20m sellers in 2025 (Q4 2025 release) and handled 13.9bn gross orders; Monee holds bank licences in Singapore, Indonesia and the Philippines; Free Fire is available in more than 160 markets. Employees rose to 102,700 from 80,700.


| Line | Q1 2025 | Q2 2025 | Q3 2025 | Q4 2025 | Q1 2026 | Q2 2026 | Q3 2026 |
|---|---|---|---|---|---|---|---|
| Group revenue ($m) | 4,841.1 | 5,259.5 | 5,986.0 | 6,851.9 | 7,097.5 | 7,787.8 | 8,582.3 |
| Shopee revenue ($m) | 3,524.2 | 3,771.1 | 4,294.8 | 4,974.6 | 5,113.6 | 5,587.6 | 6,070.2 |
| Monee revenue ($m) | 787.1 | 882.8 | 989.9 | 1,131.9 | 1,241.8 | 1,402.8 | 1,621.9 |
| Garena revenue ($m) | 495.6 | 559.1 | 653.0 | 701.0 | 696.6 | 746.6 | 840.1 |
| Shopee adjusted EBITDA ($m) | 264.4 | 227.7 | 186.0 | 202.5 | 223.2 | 255.4 | 269.2 |
| Monee adjusted EBITDA ($m) | 241.4 | 255.2 | 258.3 | 263.1 | 275.2 | 288.0 | 298.3 |
| Garena adjusted EBITDA ($m) | 224.7 | 279.9 | 314.0 | 382.8 | 367.5 | 409.5 | 458.2 |
| Group adjusted EBITDA ($m) | 713.1 | 740.9 | 722.3 | 806.1 | 828.3 | 896.9 | 931.3 |
| Shopee GMV ($bn) | 28.6 | 29.8 | 32.2 | 36.7 | 37.3 | 38.3 | 39.7 |
| Monee loans outstanding ($bn) | 5.8 | 6.9 | 7.9 | 9.2 | 9.9 | 11.1 | 12.6 |
| Garena bookings ($m) | 775.4 | 661.3 | 840.7 | 672.4 | 931.4 | 763.5 | 890.0 |
2 Shopee: GMV, Take Rate and Logistics Spend in Southeast Asia and Brazil
- GMV $39.7bn in Q3 2026 (+23.3%) on 4.5bn gross orders (+25.5%), after growth of 30.2% in Q1 and 28.4% in Q2 2026; FY2025 GMV $127.4bn (+26.8%). The 2026 aim is growth around 25%.
- Revenue grew faster than GMV: core marketplace revenue (transaction fees and ads) $4.60bn (+50.6%), 11.6% of GMV against 9.5%; Q2 2026 $4.26bn (+65.6%). Value added services (logistics) $724.4m, flat, after net offs against shipping subsidies in Q4 2025 to Q2 2026.
- Profit: Shopee adjusted EBITDA $269.2m (+44.7%), 0.68% of GMV; operating income $155.4m. 9M 2026 $747.8m against $880.6m for FY2025; reaching $1bn for FY2026 needs at least $252.2m in Q4.
- Costs: Shopee sales and marketing $1.43bn (+60.0%), 23.6% of Shopee revenue; Shopee cost of revenue $4.18bn, with logistics costs up as orders grew and further investment in logistics capacity.
How ecommerce in Sea's markets is changing
- Growth path: Shopee GMV rose 23.3% to $39.7bn in Q3 2026 against 28.4% growth in Q2 2026 and 30.2% in Q1 2026; FY2026 target is around 25% (Sea 6-K releases, 3 Mar to 10 Nov 2026).
- Monetization: Core marketplace revenue (transaction fees and advertising) rose 50.6% to $4.60bn in Q3 2026, against GMV growth of 23.3%; value added services (logistics) revenue was flat at $724.4m after net offs against shipping subsidies (Sea 6-K, 10 Nov 2026).
- Competition: Sea's FY2025 20-F names social media platforms, AI platforms and online search engines as increasing competition, and states that Shopee has been investigated by competition authorities over its use of an affiliated logistics business.
- Latin America: MercadoLibre's FY2025 10-K states that Asian ecommerce platforms gained market share in Latin America in 2025 through low prices and cross border logistics; its commerce revenue rose 47.1% in Q3 2026 (MercadoLibre 10-Q, 4 Nov 2026).
- Korea: Coupang Product Commerce revenue rose 5% in Q3 2026 with segment adjusted EBITDA margin down 424 bps to 4.6%, including costs from a fulfillment center fire in Korea (Coupang 8-K, 3 Nov 2026).
- Southeast Asia platforms: Grab Deliveries GMV rose 21% to $4.5bn in Q3 2026 and its self serve advertisers rose 39%; Grab attributes Deliveries revenue growth of 21% to Food and Groceries GMV and advertising monetization (Grab 6-K, 3 Nov 2026).


| Company and line | Period | Revenue | Growth (%) | Margin (%) | Detail |
|---|---|---|---|---|---|
| Sea (Shopee), shopee revenue | Q3 2026 | $6.07bn | 41.3 | 4.4 | GMV $39.7bn, +23.3%; margin is adjusted EBITDA over revenue |
| MercadoLibre, commerce net revenues | Q3 2026 | $6.14bn | 47.1 | n/a | GMV $22.8bn, +38% |
| Coupang, product commerce net revenues | Q3 2026 | $8.37bn | 5.0 | 4.6 | margin is segment adjusted EBITDA; 25.2m active customers, +2% |
| Amazon, international segment net sales | Q3 2026 | $43.11bn | 5.4 | 3.7 | segment operating margin |
| Grab, deliveries revenue | Q3 2026 | $561.0m | 21.0 | 21.9 | GMV $4.5bn, +21%; margin is segment adjusted EBITDA over revenue |
| PDD Holdings, transaction services revenue | Q2 2026 | 54.7 RMB bn | 13.3 | 24.7 | margin is group operating margin; Temu not reported separately |
3 Monee: Loan Book, Credit Costs and a Possible Listing
- Loans $12.6bn at 30 Sep 2026 (+60.0%), of which $11.2bn on book and $1.3bn off book, up from $5.1bn at 31 Dec 2024. Monee revenue $1.62bn (+63.9%) comes mainly from consumer and SME credit.
- Credit quality: NPL over 90 days 1.3% against 1.0% at 30 Jun 2026 and 1.1% a year earlier; Monee provision $678.7m against $372.3m, 41.8% of Monee revenue against 37.6%.
- Profit: Monee adjusted EBITDA $298.3m (+15.5%), margin 18.4% against 26.1%; Monee sales and marketing $334.6m (+111.8%). Funding costs and interest on deposits lifted Monee cost of revenue +43.9%.
- Structure: banks in Singapore, Indonesia and the Philippines, credit licences in seven markets incl. Brazil and Mexico (20-F). The CEO email of 20 Oct 2026 states Monee may go public; no plan or timing was filed.
How digital lending in emerging markets is changing
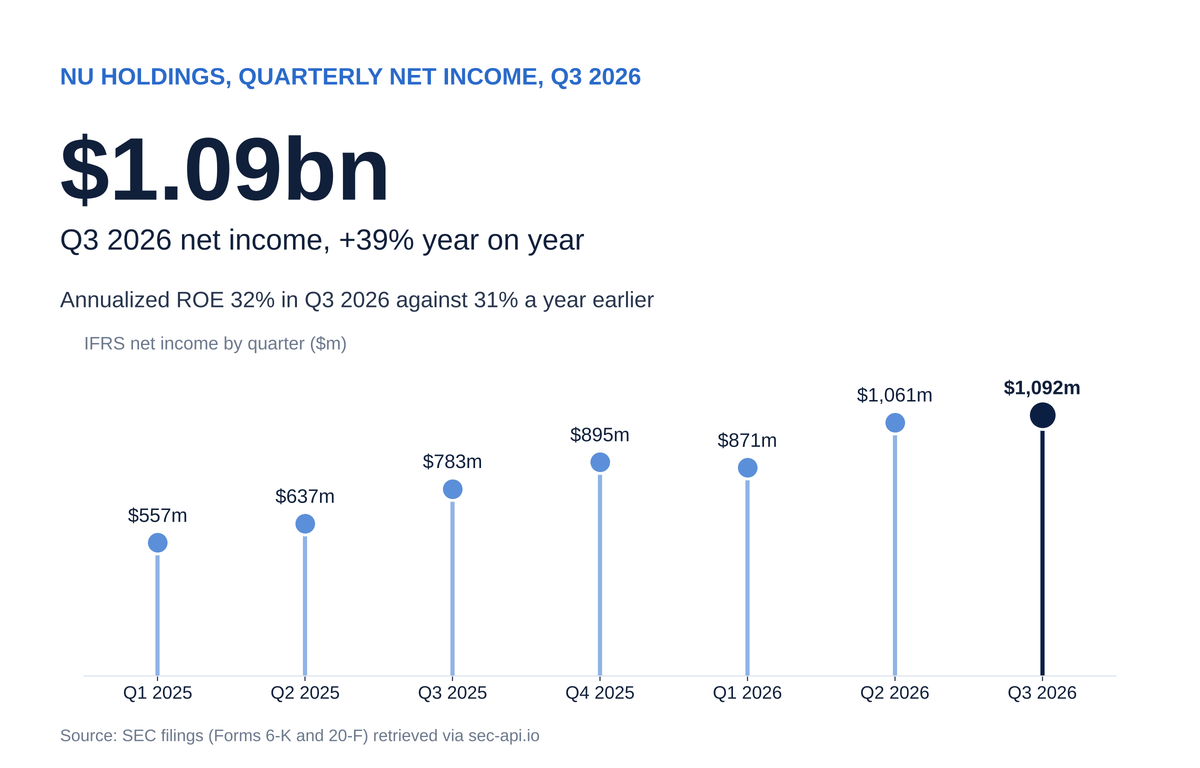
- Nu: Nu Holdings grew its credit portfolio 33% to $41.6bn in Q3 2026 with a 15 to 90 day NPL ratio of 4.9% and a 90+ ratio of 7.3%; it received a banking licence in Mexico (Nu 6-K, 12 Nov 2026).
- Grab: Grab's gross loan portfolio tripled to $2.7bn in Q3 2026 after consolidating Superbank (Indonesia) in Jun 2026; its financial services segment reached positive adjusted EBITDA for the first time (Grab 6-K, 3 Nov 2026).
- MercadoLibre: MercadoLibre's credit portfolio reached $17.9bn in Q3 2026, up 62% (MercadoLibre 10-Q, 4 Nov 2026).
- Licences: Sea holds bank licences in Singapore, Indonesia and the Philippines and credit licences in seven markets incl. Brazil and Mexico; in Apr 2025 its Singapore digital bank became parent of its Philippines bank (20-F FY2025).
- Credit costs: Sea's provision for credit losses rose 82.3% to $681.5m in Q3 2026 while Monee revenue rose 63.9% (Sea 6-K, 10 Nov 2026).


| Company and line | Period | Revenue | Growth (%) | Margin (%) | Detail |
|---|---|---|---|---|---|
| Sea (Monee), monee revenue | Q3 2026 | $1.62bn | 63.9 | 18.4 | loans $12.6bn, +60.0%; NPL 90+ 1.3%; margin is adjusted EBITDA over revenue |
| Nu Holdings, total revenue (managerial) | Q3 2026 | $6.26bn | 37.0 | 17.4 | credit portfolio $41.6bn, +33%; NPL 15 to 90 days 4.9%; growth FX neutral; margin is net income over revenue |
| MercadoLibre, fintech net revenues and financial income | Q3 2026 | $4.61bn | 42.5 | n/a | credit portfolio $17.9bn, +62% |
| Grab, financial services revenue | Q3 2026 | $201.0m | 124.0 | 6.0 | gross loan portfolio $2.7bn, +200%; NPL 90+ 2.6%; margin is segment adjusted EBITDA over revenue |
4 Garena: Free Fire, Bookings and the Deferred Revenue Effect
- Bookings $890.0m in Q3 2026 (+5.9%) against revenue $840.1m (+28.6%); bookings equal revenue plus the change in deferred revenue, and the change in Garena deferred revenue was $49.9m in Q3 2026 against $187.6m in Q3 2025.
- Users: 671.7m quarterly active users and 68.6m paying users (10.2%); bookings per user $1.33 against $1.25. The Q1 2026 release called Q1 2026 (bookings $931.4m) Garena's best quarter since 2021.
- Profit: Garena adjusted EBITDA $458.2m (+45.9%), 54.5% of revenue; Garena is the largest segment profit contributor at 44.7% of the three segments' adjusted EBITDA.
- Portfolio: Free Fire above 100m average daily active users (Q2 2026 release); Arena of Valor marked its tenth year; Palworld Online and Monster Hunter Outlanders announced on licensed IP.
How games publishing is changing
- Garena: Garena bookings rose 5.9% to $890.0m in Q3 2026 after +20.1% in Q1 and +15.5% in Q2 2026; quarterly active users were 671.7m against 670.8m a year earlier (Sea 6-K releases).
- Roblox: Roblox Q3 2026 bookings were about $1.7bn, down 12%, with daily active users at 138m, up 12% on Q2 2026 (Roblox 8-K, 29 Oct 2026).
- Direct sales: Playtika revenue was flat at $673.8m in Q3 2026 while its direct to consumer platform revenue rose 31.4% (Playtika 8-K, 5 Nov 2026).
- Platform fees: Take‑Two states that mobile carries a lower gross margin than console and PC because Apple and Google platform fees sit in cost of revenue (Take‑Two 10-Q, 9 Nov 2026); Garena cost of revenue rose 7.0% in Q3 2026, mainly third party payment channel costs.
- Content risk: Sea's FY2025 20-F adds a risk factor on third party developers, content creators and user generated content in its games.


| Company and line | Period | Revenue | Growth (%) | Margin (%) | Detail |
|---|---|---|---|---|---|
| Sea (Garena), garena revenue | Q3 2026 | $840.1m | 28.6 | 54.5 | bookings $890.0m, +5.9%; margin is adjusted EBITDA over revenue |
| Roblox, revenue | Q3 2026 | $1.57bn | 15.6 | n/a | bookings about $1.7bn, (12%); DAUs 138m |
| Playtika, revenue | Q3 2026 | $673.8m | (0.1) | 37.4 | margin is adjusted EBITDA margin |
| Electronic Arts, total net revenue | Jun 2026 quarter | $1.99bn | 18.9 | 25.8 | last filed quarter before going private in Aug 2026; margin is operating margin |
| Sony, game & network services sales | Sep 2026 quarter | 1,208.5 JPY bn | 8.6 | 18.2 | segment operating margin |
5 Financial Analysis & Ratios
- Operating margin TTM 8.2% against 8.7% in FY2025, (15.9%) in FY2021 and (11.9%) in FY2022. Gross margin TTM 45.0% against 44.7% in FY2025.
- Net income TTM $1.81bn and diluted EPS $2.78; FY2025 $1.61bn and $2.52. The effective tax rate TTM was 34.3% (FY2025 28.5%).
- Free cash flow TTM $4.34bn (operating cash flow $5.54bn less purchases of property and equipment $1.21bn). Growth in Monee's loan book is an investing outflow: $4.71bn in FY2025 and $4.45bn in 9M 2026, so free cash flow on this basis excludes loan funding.
- Balance sheet at 30 Sep 2026: cash $2.91bn, short term investments $5.11bn, long term investments $3.27bn and restricted cash $2.33bn; net loans receivable $10.60bn after a $1.38bn allowance; bank deposits payable $5.36bn; borrowings $1.22bn; equity $13.45bn.
- Capital returns: treasury stock rose to $635.6m at 30 Sep 2026 from $14.5m at 31 Dec 2025; repurchases used $743m of cash in 9M 2026. No dividends.
| Line item | FY2021 | FY2022 | FY2023 | FY2024 | FY2025 | TTM Q3 2026 |
|---|---|---|---|---|---|---|
| Revenue | 9,955.2 | 12,449.7 | 13,063.6 | 16,819.9 | 22,938.5 | 30,319.5 |
| Gross profit | 3,895.7 | 5,185.3 | 5,833.6 | 7,205.1 | 10,243.7 | 13,629.3 |
| Research and development | 831.7 | 1,376.5 | 1,164.1 | 1,206.0 | 1,157.1 | 1,190.2 |
| Selling, general and administrative | 4,817.6 | 4,706.8 | 3,913.9 | 4,740.4 | 5,850.0 | 7,974.3 |
| Operating income | (1,583.1) | (1,487.5) | 224.8 | 662.2 | 1,985.3 | 2,472.7 |
| Net income | (2,043.0) | (1,657.8) | 162.7 | 447.8 | 1,610.9 | 1,809.7 |
| Diluted EPS ($) | (3.84) | (2.96) | 0.25 | 0.74 | 2.52 | 2.78 |
| Operating cash flow | 208.6 | (1,055.7) | 2,079.7 | 3,277.4 | 5,024.5 | 5,541.1 |
| Capital expenditure | (772.2) | (924.2) | (241.6) | (318.2) | (513.8) | (1,205.0) |
| Free cash flow | (563.6) | (1,979.9) | 1,838.1 | 2,959.2 | 4,510.7 | 4,336.1 |
| Stock based compensation | 470.3 | 705.9 | 685.0 | 715.8 | 625.0 | 538.4 |
| Cash and investments | n/a | 6,894.2 | 5,358.7 | 8,620.6 | 10,572.2 | 8,018.1 |
| Total debt | n/a | 3,458.4 | 3,367.6 | 3,006.9 | 1,843.7 | 1,216.5 |
| Total equity | 7,424.4 | 5,810.8 | 6,697.6 | 8,477.6 | 12,648.3 | 13,454.2 |

| Metric | Q3 2025 | Q3 2026 | Change |
|---|---|---|---|
| Revenue ($m) | 5,986.0 | 8,582.3 | 43.4% |
| Gross profit ($m) | 2,599.4 | 3,935.4 | 51.4% |
| Operating income ($m) | 475.9 | 664.2 | 39.5% |
| Net income ($m) | 375.0 | 502.5 | 34.0% |
| Diluted EPS ($) | 0.59 | 0.78 | 32.2% |
| Operating cash flow ($m) | 1,175.4 | 1,500.8 | 27.7% |
| Free cash flow ($m) | 1,040.4 | 953.8 | (8.3%) |
| Operating margin (%) | 8.0 | 7.7 | (0.2 pts) |
| Net margin (%) | 6.3 | 5.9 | (0.4 pts) |
| Ratio | FY2021 | FY2022 | FY2023 | FY2024 | FY2025 | TTM Q3 2026 |
|---|---|---|---|---|---|---|
| Growth and margins | ||||||
| Revenue growth (%) | n/a | 25.1 | 4.9 | 28.8 | 36.4 | n/a |
| Gross margin (%) | 39.1 | 41.6 | 44.7 | 42.8 | 44.7 | 45.0 |
| Operating margin (%) | (15.9) | (11.9) | 1.7 | 3.9 | 8.7 | 8.2 |
| Net margin (%) | (20.5) | (13.3) | 1.2 | 2.7 | 7.0 | 6.0 |
| FCF margin (%) | (5.7) | (15.9) | 14.1 | 17.6 | 19.7 | 14.3 |
| Cost and investment intensity | ||||||
| R&D (%) revenue | 8.4 | 11.1 | 8.9 | 7.2 | 5.0 | 3.9 |
| SBC (%) revenue | 4.7 | 5.7 | 5.2 | 4.3 | 2.7 | 1.8 |
| Capex (%) revenue | 7.8 | 7.4 | 1.8 | 1.9 | 2.2 | 4.0 |
| Returns | ||||||
| ROE (%) | (27.5) | (25.1) | 2.6 | 5.9 | 15.3 | 13.5 |
| ROA (%) | n/a | (9.8) | 0.9 | 2.2 | 6.2 | 5.5 |
| Asset turnover (x) | n/a | 0.73 | 0.69 | 0.74 | 0.78 | 0.91 |
| Liquidity and leverage | ||||||
| Current ratio (x) | n/a | 1.83 | 1.44 | 1.49 | 1.58 | 1.43 |
| Debt to equity (x) | n/a | 0.60 | 0.50 | 0.35 | 0.15 | 0.09 |
| Net cash ($bn) | n/a | 3.4 | 2.0 | 5.6 | 8.7 | 6.8 |
| Efficiency and cash quality | ||||||
| Days sales outstanding | n/a | 8 | 7 | 7 | 6 | 5 |
| FCF to net income (x) | n/a | n/a | 11.30 | 6.61 | 2.80 | 2.40 |


| Measure | Value |
|---|---|
| Market cap ($bn) | 45.6 |
| Enterprise value ($bn) | 38.8 |
| P/E (TTM) (x) | 26.8 |
| EV/Sales (TTM) (x) | 1.3 |
| EV/EBITDA (TTM) (x) | 13.3 |
| FCF yield (%) | 9.5 |
| Price/Book (x) | 3.4 |
Cost structure and profitability
- Costs (revenue less operating income) $7.92bn in Q3 2026, +43.7%, against revenue +43.4%; operating margin (0.2) pts year on year and (0.6) pts on Q2 2026.
- Sales and marketing 22.0% of revenue against 19.2% a year earlier; Shopee and Monee drove the increase.
- Provision for credit losses 7.9% of revenue against 6.2%, and Monee's own provision 41.8% of Monee revenue against 37.6%.
- Gross margin 45.9% against 43.4%; research and development fell to 3.5% of revenue from 4.8%; share based compensation $132.1m against $154.2m.


| Line | Q3 2025 | Q4 2025 | Q1 2026 | Q2 2026 | Q3 2026 |
|---|---|---|---|---|---|
| Cost of revenue (% of revenue) | 56.6 | 56.2 | 55.7 | 54.4 | 54.1 |
| Sales and marketing (% of revenue) | 19.2 | 20.5 | 19.9 | 21.3 | 22.0 |
| General and administrative (% of revenue) | 5.7 | 5.7 | 5.7 | 5.1 | 5.0 |
| Provision for credit losses (% of revenue) | 6.2 | 5.7 | 6.6 | 7.1 | 7.9 |
| Research and development (% of revenue) | 4.8 | 4.1 | 4.2 | 4.0 | 3.5 |
| Share based compensation (in lines above) (% of revenue) | 2.6 | 2.1 | 1.9 | 1.7 | 1.5 |
| Depreciation and amortization (in lines above) (% of revenue) | 1.5 | 1.5 | 1.4 | 1.5 | 1.6 |
| Operating income (% of revenue) | 8.0 | 8.2 | 8.4 | 8.4 | 7.7 |
| Adjusted EBITDA (% of revenue) | 12.1 | 11.8 | 11.7 | 11.5 | 10.9 |
Cash, funding and capital returns
- Operating cash flow by quarter from Q1 2025: $756.9m, $1.62bn, $1.18bn, $1.48bn, $1.06bn, $1.51bn, $1.50bn.
- Capex rose to $547.0m in Q3 2026 from $135.0m in Q3 2025 (both derived as nine month less six month purchases of property and equipment stated in the releases); 9M 2026 $1.04bn against $351m in 9M 2025. The release attributes it to supporting existing operations.
- Funding of the loan book: bank deposits payable rose to $5.36bn from $3.80bn at 31 Dec 2025; borrowings $1.22bn; off book loans $1.3bn.
- Convertible notes: $2.63bn at 31 Dec 2024, $1.05bn at 31 Dec 2025 and nil at 30 Sep 2026 after the 2026 notes were redeemed.


| Line | Q4 2024 | Q1 2025 | Q2 2025 | Q3 2025 | Q4 2025 | Q1 2026 | Q2 2026 | Q3 2026 |
|---|---|---|---|---|---|---|---|---|
| Cash and short term investments ($m) | 8,620.6 | 8,426.2 | 9,410.7 | 9,902.0 | 10,572.2 | 10,540.7 | 9,098.9 | 8,018.1 |
| Convertible notes ($m) | 2,626.8 | 2,478.6 | 2,379.9 | 2,336.5 | 1,050.1 | 995.8 | 996.3 | 0.0 |
| Borrowings ($m) | 380.1 | 450.1 | 516.3 | 519.4 | 793.6 | 966.8 | 1,224.3 | 1,216.5 |
| Bank deposits payable ($m) | 2,711.7 | 3,154.3 | 3,414.0 | 3,484.2 | 3,798.3 | 4,063.3 | 4,285.3 | 5,358.5 |
6 MD&A & Management Commentary
Q3 2026 results: Form 6-K of 10 Nov 2026
- Revenue $8.58bn, +43.4% year on year and $794.5m above Q2 2026; 9M 2026 $23.47bn (+45.9%). Service revenue $7.83bn (+43.3%), sales of goods $748.6m (+44.6%).
- Gross profit $3.94bn (+51.4%), margin 45.9% against 43.4%. Shopee cost of revenue rose +36.8% on logistics costs as order volume grew and investment in logistics capabilities; Monee cost of revenue +43.9% on interest on deposits, funding and collection costs; Garena +7.0%, mainly payment channel costs.
- Operating expenses $3.27bn (+54.1%): sales and marketing $1.89bn (+64.0%; Shopee $1.43bn +60.0%, Monee $334.6m +111.8%), provision for credit losses $681.5m (+82.3%), general and administrative $425.2m (+25.1%), research and development $301.7m (+5.4%).
- Below operating income: non operating income $123.3m against $61.2m, incl. an investment gain of $65.2m and interest income of $62.2m; income tax $280.4m (+74.0%), 35.6% of pre tax income.
- Cash (9M 2026): operating cash flow $4.06bn (+14.6%); investing outflow $5.63bn, incl. loans receivable growth $4.45bn and property and equipment $1.04bn; financing inflow $482.8m, incl. bank deposits +$1.82bn, convertible note redemption $1.05bn and buybacks $743m.
- Definition change: from Q3 2026 Garena adjusted EBITDA excludes the net effect of changes in deferred revenue and related cost ($52.0m in Q3 2026, $151.9m in Q3 2025), which Sea still discloses. On the old definition Q2 2026 group adjusted EBITDA was $917.2m.
| Item | Outlook | Source |
|---|---|---|
| Shopee FY2026 GMV | growth of around 25% year on year (set 3 Mar 2026; on track per 12 May 2026 release) | 6-K Ex 99.1, 3 Mar 2026 and 12 May 2026 |
| Shopee FY2026 adjusted EBITDA | no lower than FY2025 ($880.6m) in absolute dollars (3 Mar 2026) | 6-K Ex 99.1, 3 Mar 2026 |
| Shopee FY2026 adjusted EBITDA, Aug 2026 update | CEO optimistic Shopee reaches $1bn for the full year | 6-K Ex 99.1, 11 Aug 2026 |
| Q3 2026 release | no new numeric outlook; second $1.0bn buyback authorization approved 9 Nov 2026 | 6-K Ex 99.1, 10 Nov 2026 |
Management and CFO commentary
- Sea files no CFO commentary document or call transcript on EDGAR; the points below come from the CEO comments in the 6-K releases and the 20 Oct 2026 employee email.
- Q3 2026 release (10 Nov 2026), CEO Forrest Li: Shopee reached record highs in top and bottom line metrics with a growing buyer base, higher monetization and better unit economics; Monee extends credit into more everyday spending on and off Shopee; Garena bookings and profitability grew.
- CEO email (20 Oct 2026): Garena quarterly active users rose from 69m at listing to 666m; Shopee quarterly GMV rose 35x to $38.3bn; Monee may go public; Sea Cloud to be offered to enterprises.
- Q2 2026 release (11 Aug 2026): optimistic that Shopee reaches $1bn adjusted EBITDA in FY2026; credit penetration remains low in Monee markets; Free Fire above 100m average daily active users.
- Q1 2026 release (12 May 2026): 2026 described as a year of investing to deepen competitive position; Garena's best quarter since 2021; Shopee on track for around 25% GMV growth.
- Q4 2025 release (3 Mar 2026): Shopee served around 400m active buyers and 20m sellers in 2025; Monee added over 20m first time borrowers; 2026 Shopee targets set.
| Speaker | Date and source | Statement |
|---|---|---|
| Forrest Li, Chairman and CEO | 10 Nov 2026, 6-K Ex 99.1 | “staying disciplined in how we manage risk and how we invest” |
| Forrest Li, Chairman and CEO | 10 Nov 2026, 6-K Ex 99.1 | “extending credit into more everyday spending scenarios” |
| Forrest Li, Chairman and CEO | 20 Oct 2026, 6-K Ex 99.1 | “Going public could give it the resources and the room to go further” |
| Item | Disclosure |
|---|---|
| 20-F FY2025, results | Revenue $22.94bn (+36.4%); operating income $1.99bn; net income $1.61bn; third profitable year after net losses until 2022. |
| 20-F FY2025, credit | Consumer and SME loans $9.2bn at 31 Dec 2025 ($8.2bn on book, $1.0bn off book); loan allowance $842.0m; write offs $992.9m in FY2025. |
| 20-F FY2025, licences | Bank licences in Singapore, Indonesia and the Philippines; credit licences in Indonesia, Thailand, the Philippines, Malaysia, Singapore, Brazil and Mexico; insurance underwriting in Indonesia and the Philippines. |
| 20-F FY2025, control | Forrest Li 57.6% of voting power; Class B shares carry 15 votes; Tencent 17.0% of shares with a voting proxy to the board. |
| 20-F FY2025, legal | New York and Arizona securities class actions settled for $40m and $46m, approved in 2025; Shopee investigated by competition authorities over an affiliated logistics business. |
| 20-F FY2025, staff | 102,700 employees at 31 Dec 2025 (80,700 a year earlier); 77,600 in general operations. |
| 6-K Q3 2026, Shopee | Core marketplace revenue $4.60bn (+50.6%); value added services $724.4m (+0.1%); sales of goods $746.1m (+44.6%). |
| 6-K Q3 2026, Monee | Loans $12.6bn: $11.2bn on book and $1.3bn off book (channeling by other lenders); NPL 90+ 1.3% against 1.1%. |
| 6-K Q3 2026, capital | 11.1m shares repurchased for $997.2m under the Nov 2025 program; additional $1.0bn approved 9 Nov 2026 without expiration. |
| 6-K Q3 2026, balance sheet | Convertible notes nil at 30 Sep 2026 against $1.05bn at 31 Dec 2025; deposits payable $5.36bn against $3.80bn. |
7 Peer Valuation & Sector Summary
- Sector: consumer internet in emerging markets. Sea competes in ecommerce with Lazada, TikTok Shop, Tokopedia, MercadoLibre and Temu, in digital finance with banks, Grab, Nu and MercadoLibre, and in games with global publishers. Peers below are listed in the US and file with the SEC.
- Growth, latest quarter year on year: SE 43.4%, MELI 45.1%, SHOP 31.6%, RBLX 15.6%, AMZN 12.1%, PYPL 2.0% (Q3 2026), TTWO (15.6%) (quarter to 30 Sep 2026).
- Operating margin TTM: PYPL 17.0%, SHOP 14.6%, AMZN 13.1%, SE 8.2%, MELI 7.4%, TTWO (2.8%), RBLX (19.8%).
- Valuation: SE trades at 26.8x TTM earnings and 1.28x EV/Sales, against MELI 42.4x and 2.19x, AMZN 19.4x and 3.34x, SHOP 86.7x and 12.5x, PYPL 10.9x. SE net cash $6.8bn.
| Company | Revenue TTM ($bn) | Revenue growth (%) | Gross margin (%) | Operating margin (%) | Net margin (%) | FCF margin (%) | ROE (%) | Net cash ($bn) | Market value ($bn) | EV/Sales (x) | P/E TTM (x) |
|---|---|---|---|---|---|---|---|---|---|---|---|
| SE, TTM Sep 2026 | 30.3 | 43.4 | 45.0 | 8.2 | 6.0 | 14.3 | 15.2 | 6.8 | 46 | 1.3 | 26.8 |
| MELI, TTM Sep 2026 | 38.5 | 45.1 | 42.0 | 7.4 | 4.9 | 31.8 | 26.2 | (4.4) | 80 | 2.2 | 42.4 |
| AMZN, TTM Sep 2026 | 797.5 | 12.1 | 51.4 | 13.1 | 16.9 | (5.3) | 26.3 | (66.1) | 2,599 | 3.3 | 19.4 |
| SHOP, TTM Sep 2026 | 14.2 | 31.6 | 47.5 | 14.6 | 15.0 | 18.8 | 16.8 | 5.3 | 182 | 12.5 | 86.7 |
| PYPL, TTM Sep 2026 | 34.3 | 2.0 | 45.8 | 17.0 | 13.8 | 18.4 | 23.8 | 1.6 | 47 | 1.3 | 10.9 |
| TTWO, TTM Sep 2026 | 6.4 | (15.6) | 56.6 | (2.8) | (3.8) | 1.5 | (6.7) | (0.9) | 40 | 6.4 | n/a |
| RBLX, TTM Sep 2026 | 5.9 | 15.6 | 79.3 | (19.8) | (16.5) | 26.6 | n/a | 5.2 | 37 | 5.4 | n/a |

8 Material Events & Contracts
- 8 filings from 13 Nov 2025 to 12 Nov 2026 (Forms 6-K and 20-F): quarterly results, two buyback authorizations, the AGM notice and the CEO email of 20 Oct 2026.
- CEO email, 20 Oct 2026 (6-K Ex 99.1): quarterly revenue rose from $94m at the Oct 2017 listing to $7.8bn; Monee is approaching the point where a listing could give it more resources; Sea Cloud, the in house cloud rebuilt for AI by about 500 staff over two years, will be offered to outside customers. No terms, timing or amounts were filed.
- Capital: the 0.25% convertible notes due 2026 were redeemed for $1.05bn in 2026; capped calls on the 2025 notes were settled for $582.4m in Q4 2025. Buybacks: $14.5m in Q4 2025, $168.4m in Q1 2026, $416.8m in Q2 2026; $997.2m cumulative by 10 Nov 2026.
| Date | Items | Event |
|---|---|---|
| 17 Nov 2025 | 6-K Ex 99.1 | Board authorizes a share repurchase program of up to $1bn of ADSs |
| 3 Mar 2026 | 6-K Ex 99.1 | Q4 and FY2025 results: revenue $22.9bn (+36.4%), net income $1.6bn; 2026 Shopee GMV growth target about 25% |
| 17 Apr 2026 | 20-F | FY2025 annual report: 102,700 employees; Forrest Li 57.6% of voting power; Tencent 17.0% of shares |
| 12 May 2026 | 6-K Ex 99.1 | Q1 2026 results: revenue $7.1bn (+46.6%); Garena bookings $931.4m; 1.8m shares repurchased for $168.4m |
| 11 Aug 2026 | 6-K Ex 99.1 | Q2 2026 results: revenue $7.8bn (+48.1%); CEO optimistic Shopee reaches $1bn adjusted EBITDA for FY2026; Garena EBITDA definition to change from Q3 |
| 25 Aug 2026 | 6-K Ex 99.1, 99.2 | Notice of AGM on 16 Sep 2026; no proposals submitted to shareholders |
| 20 Oct 2026 | 6-K Ex 99.1 | CEO email on the ninth IPO anniversary: Monee may go public; Sea Cloud to be offered to outside customers as an AI first enterprise platform |
| 10 Nov 2026 | 6-K Ex 99.1 | Q3 2026 results: revenue $8.6bn (+43.4%), net income $502.5m; additional $1.0bn buyback authorization |
| Contract | Terms |
|---|---|
| Share repurchase program (Nov 2025) | Up to $1bn of ADSs; 11.1m shares bought for $997.2m by 10 Nov 2026. |
| Additional repurchase authorization (9 Nov 2026) | $1.0bn, without expiration; timing and method not fixed. |
| 0.25% convertible senior notes due 2026 | Issued Sep 2021; $1.05bn carrying amount at 31 Dec 2025, redeemed for $1.05bn in 2026. |
| Credit funding | Off book channeling by other lenders $1.3bn of loans at 30 Sep 2026; securitization borrowings $478.3m raised in FY2025. |
| Bank deposits | Deposits payable $5.36bn at 30 Sep 2026; +$1.82bn in 9M 2026. |
| Tencent voting proxy (Sep 2022) | Tencent's Class A shares voted by the Sea board; about 8.3% of total voting power at 31 Mar 2026. |
9 Ownership, Voting Power & Annual Meeting
- Two share classes: Class A with 1 vote and Class B with 15 votes. Forrest Li holds all 45,527,793 Class B shares through Blue Dolphins Venture and 57.6% of total voting power incl. proxies from employees and directors (20-F, 31 Mar 2026; 13D/A of 2 Jan 2026: 57.7%).
- Annual general meeting of 16 Sep 2026: no proposal was submitted to shareholders (6-K of 25 Aug 2026), so no vote results were filed; the 24 Sep 2025 meeting also had no proposals.
- Insiders: Forms 4 from 18 Mar to 11 Nov 2026 show sales of $542.7m and no open market purchases: Gang Ye $194.5m (Mar to Sep 2026), Forrest Li $147.4m (11 to 28 Aug 2026) and director David Ma $117.2m (Mar and Apr 2026). The 13D/A of 2 Jan 2026 lists further sales by Forrest Li on 18 dates from 4 Nov to 30 Dec 2025 at $120.7 to $155.5.
- Schedules 13G: Baillie Gifford 6.55% at 30 Sep 2026 (6.7% in the 20-F table, based on its 13G of Feb 2025), T. Rowe Price 6.1% at 31 Mar 2026, WCM 5.5% (Apr 2026); Gang Ye 4.4% at 31 Dec 2025.
Annual meeting
- No management remarks, presentation or shareholder questions from the meeting of 16 Sep 2026 were filed; no proposal was put to shareholders.
| Holder | Shares (m) | Share of total (%) | Voting power (%) | Date and filing |
|---|---|---|---|---|
| Tencent entities (proxy to Sea board) | 104.26 | 17.0 | n/a | 31 Mar 2026, 20-F |
| Forrest Li, incl. Blue Dolphins, options and proxies | 104.08 | 16.0 | 57.6 | 31 Mar 2026, 20-F |
| Directors and officers as a group | 239.64 | 36.9 | 68.2 | 31 Mar 2026, 20-F |
| Baillie Gifford & Co | 37.15 | 6.55 | n/a | 30 Sep 2026, 13G/A |
| T. Rowe Price Associates | 33.50 | 6.1 | n/a | 31 Mar 2026, 13G |
| WCM Investment Management | 33.74 | 5.5 | 2.7 | 31 Mar 2026, 20-F |
| Gang Ye, COO | 27.27 | 4.4 | 1.5 | 31 Dec 2025, 13G/A |
| Person | Value sold ($m) |
|---|---|
| Gang Ye, COO and director | 194.54 |
| Forrest Li, Chairman and CEO | 147.35 |
| David Ma, director | 117.18 |
| David Chen, Chief Product Officer, Shopee | 34.90 |
| Yanjun Wang, Chief Corporate Officer and General Counsel | 16.24 |
| Chris Feng, President | 11.42 |
| Tony Hou, CFO | 8.41 |
| Terry Zhao, President of Garena | 8.23 |
| David Heng, director | 2.45 |
| Khoon Hua Kuok, director | 2.02 |
10 Risk Factors
- Item 3.D of the FY2025 20-F holds 64 risk factors against 63 in the FY2024 20-F (31,732 words against 30,936). 1 was added, 0 removed and 6 materially reworded. The 2026 results releases on Form 6-K refer to the 20-F risk factors and file no update.
| Risk | Disclosure and change |
|---|---|
| Credit quality | NPL over 90 days 1.3% at 30 Sep 2026 against 1.1%; provision for credit losses $681.5m in Q3 2026 (+82.3%); loans $12.6bn (+60.0%). |
| Banking regulation | Reworded factor: capital adequacy and large exposure ratios; Singapore and Philippines banks regulated as one group since Apr 2025; deposits $5.36bn. |
| Ecommerce competition | Factor names social media platforms, AI platforms and online search engines; Shopee sales and marketing $1.43bn in Q3 2026 (+60.0%) against GMV +23.3%. |
| Logistics and competition law | Shopee investigated by competition authorities over an affiliated logistics business (20-F); value added services revenue flat at $724.4m. |
| Game concentration | Garena relies on Free Fire; new factor on third party developers and user generated content; bookings +5.9% in Q3 2026. |
| Profitability | Net loss factor now lists net income of $162.7m, $447.8m and $1.6bn in 2023 to 2025; operating margin 7.7% in Q3 2026. |
| Infrastructure costs | Reworded: prices of computing hardware, semiconductors and power; Sea Cloud to be offered externally (Oct 2026). |
| Control | Forrest Li 57.6% of voting power; Class B 15 votes per share. |
How risk factors changed
- Comparison: 20-F FY2025 filed 17 Apr 2026, acc 0001140361-26-015366 (Item 3.D) against 20-F FY2024 filed 17 Apr 2025, acc 0001193125-25-084311 (Item 3.D).
- 64 risk factors in the FY2025 20-F against 63 a year earlier; 31,732 words against 30,936.
- One factor was added, on third party game developers and user generated content in Garena games.
- Monee banking and insurance factors were expanded: capital ratios, a Singapore and Philippines banking group since Apr 2025, and underwriting in Indonesia and the Philippines.
- The infrastructure factor now names data center and cloud providers, computing hardware, semiconductor and power prices.
- The net loss factor now records three profitable years, with net income of $1.6bn in 2025.

| Measure | 20-F FY2024 | 20-F FY2025 |
|---|---|---|
| Risk factors (count) | 63 | 64 |
| Words in Item 3.D | 30,936 | 31,732 |
| Change | Risk factor | What changed |
|---|---|---|
| Added | Actions of third party developers and creators | New factor: updates, thin content or delays by third party game developers, and user generated content that needs moderation, could make games revenue fluctuate or fall short. |
| Reworded | History of net losses | Now states net income of $162.7m, $447.8m and $1.6bn in 2023, 2024 and 2025 and that losses were recorded before 2023. |
| Reworded | Banking business requirements | About 300 words longer: adds capital adequacy and large exposure ratios and states that the Singapore digital bank became parent of the Philippines bank in Apr 2025, so both are regulated as one banking group. |
| Reworded | Insurance business | Adds that Sea underwrites insurance in Indonesia and the Philippines with a small, recent underwriting business, and that regulators are reviewing digital insurance distribution. |
| Reworded | Track record in game development | Adds that new titles may be published on new hardware or software platforms that need different development methods. |
| Reworded | Reliance on third party developers | About 200 words shorter; the text on developer actions and user generated content moved into the new separate factor. |
| Reworded | Technology, data center and cloud providers | Heading widened to data center and cloud service providers; adds exposure to prices of computing hardware, semiconductor components and power, and to hardware shortages. |
| Filing | Change disclosed |
|---|---|
| 6-K results releases Q1 to Q3 2026 (12 May, 11 Aug, 10 Nov 2026) | Results releases refer to risks described in the FY2025 20-F; no separate risk factor update is filed on Form 6-K. |
11 Stock Price, Scenarios & Sensitivity
- SE closed at $74.52 on 12 Nov 2026; on the results day of 10 Nov 2026 the close was $76.80, (1.5%) against $77.96 on 9 Nov 2026. 52 week closing high $147.26 on 18 Nov 2025 and low $73.99 on 11 Nov 2026. Highest month end close in five years $288.07 (Nov 2021).
- Valuation: market value $45.6bn on 612.48m shares (20-F, 31 Mar 2026); enterprise value $38.8bn after net cash of $6.80bn (cash and short term investments less borrowings). P/E 26.8x TTM diluted EPS of $2.78; EV/Sales 1.28x.
- Scenario method: implied price equals TTM Q3 2029 EPS times an exit P/E. EPS is revenue times GAAP operating margin plus $300m a year of non operating income, taxed at 30%, over 600.2m shares (612.5m less 2% for buybacks net of share awards). Revenue grows from TTM Q3 2026 $30.3bn for three years; net income to minority holders is ignored.

Critical factors and core assumptions
| Factor | Current value | Best case requires | Evidence in filings |
|---|---|---|---|
| Shopee GMV growth | +23.3% in Q3 2026; FY2026 aim around 25% | GMV growth near 20% a year to 2029 | 6-K Ex 99.1, 3 Mar and 10 Nov 2026 |
| Shopee monetization | core marketplace revenue 11.6% of GMV (9.5% a year earlier) | fees and ads keep rising faster than GMV | 6-K Ex 99.1 Shopee revenue table |
| Shopee profit | adjusted EBITDA $269.2m in Q3 2026; 9M $747.8m | $1bn in FY2026, then margin gains | 6-K Ex 99.1, 11 Aug 2026 |
| Monee credit costs | NPL 90+ 1.3%; provision $681.5m | NPL back near 1.0% with loans growing above 40% | 6-K Ex 99.1 releases |
| Garena bookings | $890.0m in Q3 2026 (+5.9%) | new titles add to Free Fire | 6-K Ex 99.1, 11 Aug and 10 Nov 2026 |
| Capital returns | $997.2m bought back; further $1.0bn approved | net share count falls 2% or more | 6-K Ex 99.1, 10 Nov 2026 |
- Revenue base TTM Q3 2026 $30.3bn; GAAP operating margin TTM 8.2% and Q3 2026 7.7%.
- Best case: 26% revenue CAGR to $60.7bn with GMV near 20% a year, Monee loans above 40% and Garena stable; operating margin 11%; exit P/E 26x, near today's 26.8x.
- Base case: 20% revenue CAGR to $52.4bn; operating margin 8%, near the TTM level; exit P/E 20x.
- Worst case: 10% revenue CAGR to $40.4bn as GMV growth slows further and credit losses rise; operating margin 4.5%; exit P/E 13x.
- Shares down 2% from 612.5m through buybacks net of share awards; non operating income $300m a year; tax rate 30% (TTM 34.3%).
Scenarios, three years forward
| Measure | Worst case | Base case | Best case |
|---|---|---|---|
| Revenue CAGR, 3 years (%) | 10.0 | 20.0 | 26.0 |
| Revenue, TTM Q3 2029 ($bn) | 40.4 | 52.4 | 60.7 |
| Operating margin, TTM Q3 2029 (%) | 4.5 | 8.0 | 11.0 |
| Net income, TTM Q3 2029 ($bn) | 1.5 | 3.1 | 4.9 |
| EPS, TTM Q3 2029 ($) | 2.47 | 5.24 | 8.13 |
| Exit P/E (x) | 13.0 | 20.0 | 26.0 |
| Implied price ($) | 32 | 105 | 211 |
| Change against $74.52 (%) | (57) | 41 | 184 |
| Implied annual return (%) | (24.5) | 12.0 | 41.6 |
| Description | Slower GMV, higher credit losses | Growth 20%, margin near TTM | GMV near 20%, margin 11% |

Sensitivity analysis
| Revenue CAGR \ Operating margin | 4.5% | 6% | 8% | 9.5% | 11% |
|---|---|---|---|---|---|
| 10% | $49 | $63 | $82 | $96 | $111 |
| 15% | $55 | $72 | $93 | $109 | $125 |
| 20% | $62 | $80 | $105 | $123 | $141 |
| 23% | $66 | $86 | $112 | $132 | $152 |
| 26% | $71 | $92 | $120 | $141 | $163 |
| Exit P/E \ Operating margin | 4.5% | 6% | 8% | 9.5% | 11% |
|---|---|---|---|---|---|
| 13x | $40 | $52 | $68 | $80 | $92 |
| 16x | $50 | $64 | $84 | $98 | $113 |
| 20x | $62 | $80 | $105 | $123 | $141 |
| 23x | $71 | $92 | $120 | $142 | $163 |
| 26x | $81 | $104 | $136 | $160 | $184 |
Disclaimer
This analysis is for information only and is not financial advice. It is derived from public SEC filings retrieved via sec-api.io and is not a publication of the U.S. Securities and Exchange Commission. Scenario values are model outputs under stated assumptions and are not forecasts. Data as of 13 November 2026.
Sources
All company and peer figures are read from SEC filings retrieved through the sec-api.io MCP server. Share prices are regular session closes as dated in the text.
| Form | Period | Filed | Accession number |
|---|---|---|---|
| 6-K | 30 Sep 2026 | 10 Nov 2026 | 0001193125-26-455420 |
| 6-K | 20 Oct 2026 | 20 Oct 2026 | 0001193125-26-425639 |
| 6-K | 25 Aug 2026 | 25 Aug 2026 | 0001193125-26-364238 |
| 6-K | 30 Jun 2026 | 11 Aug 2026 | 0001193125-26-344596 |
| 6-K | 31 Mar 2026 | 12 May 2026 | 0001193125-26-219378 |
| 20-F | 31 Dec 2025 | 17 Apr 2026 | 0001140361-26-015366 |
| 6-K | 31 Dec 2025 | 3 Mar 2026 | 0001193125-26-088151 |
| 6-K | 17 Nov 2025 | 17 Nov 2025 | 0001193125-25-283853 |
| 6-K | 30 Sep 2025 | 12 Nov 2025 | 0001193125-25-275616 |
| 6-K | 2 Sep 2025 | 2 Sep 2025 | 0001193125-25-193518 |
| 6-K | 30 Jun 2025 | 12 Aug 2025 | 0001193125-25-178935 |
| 6-K | 31 Mar 2025 | 13 May 2025 | 0001193125-25-118807 |
| 20-F | 31 Dec 2024 | 17 Apr 2025 | 0001193125-25-084311 |
| 6-K | 31 Dec 2024 | 4 Mar 2025 | 0001193125-25-045576 |
| 20-F | 31 Dec 2023 | 26 Apr 2024 | 0001140361-24-022429 |
| SCHEDULE 13D/A | 30 Dec 2025 | 2 Jan 2026 | 0001193125-26-000919 |
| SCHEDULE 13G/A | 31 Dec 2025 | 16 Jan 2026 | 0001193125-26-015341 |
| SCHEDULE 13G | 31 Mar 2026 | 15 May 2026 | 0000080255-26-000421 |
| SCHEDULE 13G | 6 Apr 2026 | 6 Apr 2026 | 0001062993-26-001859 |
| SCHEDULE 13G/A | 30 Sep 2026 | 21 Oct 2026 | 0001088875-26-000069 |
| 4 | 11 Nov 2026 | 12 Nov 2026 | 0001193125-26-458977 |
| Company | Form | Filed | Accession number |
|---|---|---|---|
| Amazon | 8-K Ex 99.1 | 29 Oct 2026 | 0001018724-26-000038 |
| Coupang | 8-K Ex 99.1 | 3 Nov 2026 | 0001834584-26-000084 |
| Electronic Arts | 10-Q | 3 Aug 2026 | 0001628280-26-051829 |
| Grab | 6-K Ex 99.1 | 3 Nov 2026 | 0001855612-26-000148 |
| MercadoLibre | 10-Q | 4 Nov 2026 | 0001099590-26-000029 |
| Nu Holdings | 6-K | 12 Nov 2026 | 0001292814-26-005273 |
| PDD Holdings | 6-K Ex 99.1 | 25 Aug 2026 | 0001104659-26-100534 |
| Playtika | 8-K Ex 99.1 | 5 Nov 2026 | 0001828016-26-000053 |
| Roblox | 8-K Ex 99.1 | 29 Oct 2026 | 0001628280-26-068235 |
| Sony | 6-K | 5 Nov 2026 | 0001104659-26-122935 |
| Filed | Exhibit | Document | Content |
|---|---|---|---|
| 17 Nov 2025 | Ex 99.1 | Share repurchase program of up to $1bn | Board authorizes repurchases of up to $1bn of ADSs; Methods incl. open market, block trades and preset trading plans |
| 3 Mar 2026 | Ex 99.1 | Q4 and FY2025 results release | FY2025 revenue $22.9bn (+36.4%), net income $1.6bn, adjusted EBITDA $3.4bn; 2026 aim: Shopee GMV growth around 25%, Shopee adjusted EBITDA no lower than 2025 |
| 12 May 2026 | Ex 99.1 | Q1 2026 results release | Revenue $7.1bn (+46.6%); net income $438.2m (+6.7%); Garena bookings $931.4m (+20.1%); 1.8m shares repurchased for $168.4m |
| 11 Aug 2026 | Ex 99.1 | Q2 2026 results release | Revenue $7.8bn (+48.1%); Shopee GMV $38.3bn (+28.4%); CEO optimistic Shopee reaches $1bn adjusted EBITDA in FY2026; 4.7m shares repurchased for $416.8m |
| 25 Aug 2026 | Ex 99.1 | AGM announcement | AGM on 16 Sep 2026 in Singapore; record date 4 Sep 2026; No proposal submitted to shareholders |
| 25 Aug 2026 | Ex 99.2 | Notice of annual general meeting | Signed by Forrest Li, Chairman and CEO; Attendance limited by venue capacity |
| 20 Oct 2026 | Ex 99.1 | CEO email to employees on ninth IPO anniversary | Quarterly revenue up more than 80x since listing, from $94m to $7.8bn; Shopee quarterly GMV up 35x to $38.3bn; Monee may go public; Sea Cloud to be offered to outside customers as an AI enterprise platform, built by about 500 staff over two years |
| 10 Nov 2026 | Ex 99.1 | Q3 2026 results release | Revenue $8.6bn (+43.4%); net income $502.5m (+34.0%); adjusted EBITDA $931.3m (+28.9%); 11.1m shares repurchased for $997.2m under the first program; further $1.0bn authorized 9 Nov 2026 |
Read next
Nu Holdings (NU) Q3 2026 Earnings: $1.09bn Net Income, 32% ROE and a $41.6bn Credit Portfolio, SEC Filing Analysis
November 13, 2026·35 min read
NVIDIA (NVDA) CEO Transition 8-K: Jensen Huang Resigns, CFO Colette Kress Interim CEO, Harvey Jones First Chair, SEC Filing Analysis
November 13, 2026·41 min read