Target (TGT), Financial Analysis
Insights derived from analysing SEC filings. Independent analysis, not a publication of the SEC.
- Net sales $27.07bn in Q3 FY2026 (13 weeks to 31 Oct 2026), +7.1% year on year; comparable sales +5.6% against (2.7%) a year earlier, with traffic +5.0% and average transaction amount +0.6%. Stores originated comparable sales +4.6% and digitally originated +9.8%; comparable sales were positive in all three quarters of FY2026 after four negative quarters.
- Operating income $1.67bn against $948m; operating margin 6.2% against 3.8% GAAP and 4.4% adjusted. The quarter includes $301m of IEEPA tariff refunds in cost of sales; without them operating income was $1.37bn (5.1% of sales, derived). Gross margin 30.5% against 28.2%.
- Diluted EPS $2.65 against $1.51 GAAP and $1.78 adjusted; tariff refunds added $0.50. Excluding refunds, the release states GAAP EPS would have risen 42% and adjusted EPS 21%. Nine month EPS $8.47 incl. about $2.14 of refunds.
- Category mix: Hardlines (Fun 101) +26.8%, Beauty +9.1%, Food & beverage +6.6%; Apparel & accessories (3.8%). Non merchandise sales $618m (+19.3%), with advertising revenue $296m (+22.8%).
- FY2026 guidance raised a third time: net sales around +6% (3 Mar 2026: around +2%), operating margin around 6.2% incl. about 1.1 pts of refunds, EPS $10.65 to $11.40 (earlier: $9.90 to $10.90). Derived by this report: Q4 FY2026 sales about $32.0bn (+5.1%) and EPS $2.18 to $2.93 against $2.30. Capex for 2027 set at $5bn to $6bn.
- Shares closed at $165.93 on 18 Nov 2026, 15.4x TTM diluted EPS of $10.77, against a 52 week closing low of $83.68 (20 Nov 2025). Michael Fiddelke became CEO on 1 Feb 2026; the board elected four new directors in 2026, the last joining on 1 Dec 2026. Scenario prices three years forward on GAAP P/E, on this report's own assumptions: base $168, best $253, worst $84.
Figures are read from the filings of Target Corporation (central index key 27419): the Q3 FY2026 earnings release (8-K Ex 99 of 18 Nov 2026, accession 0000027419-26-000051), the Forms 10-K for FY2024 and FY2025, the Forms 10-Q for Q1 and Q2 FY2026, the Forms 8-K with all their exhibits, incl. the earnings releases for Q2 FY2025 to Q3 FY2026 with the guidance they contain, the Item 5.02 officer and director filings, the credit agreement and the Item 5.07 vote results, the 2026 proxy statement (DEF 14A of 27 Apr 2026), Schedules 13G, Forms 3 and 4, and the 8-K releases of Walmart, Costco, TJX, Dollar General and Home Depot. The Q3 FY2026 Form 10-Q was not on EDGAR on 19 Nov 2026, so Q3 figures come from the release. Target files no separate CFO commentary document; CFO commentary is taken from the statements and guidance in the releases and from the 10-Q MD&A. Earnings call statements are not used. Share price $165.93 is the regular session close of 18 Nov 2026, the day of the release, which came before the open. Fiscal years end on the Saturday nearest 31 Jan; FY2026 ends 30 Jan 2027. Accession numbers appear in the Sources appendix.
1 Revenue & Business Model
- Storyline: comparable sales turned from (2.5%) in Q4 FY2025 to +5.6% in Q3 FY2026 on traffic, under a new CEO; tariff refunds lift FY2026 profit, and without them the Q3 FY2026 operating margin was 5.1% against 4.4% adjusted a year earlier (derived). Chapters 2 to 4 cover the three revenue drivers: stores and digital comparable sales; the merchandise categories; and non merchandise revenue from Roundel advertising, card profit sharing and memberships.
- Target sells general merchandise and food through more than 2,000 US stores and its apps and websites, as one segment. The 10-K states that stores fulfilled more than 97% of merchandise sales in each of the last three years, that owned and exclusive brands are about 30% of merchandise sales, and that about one half of merchandise is sourced outside the US, China the largest origin. About 415,000 team members at 31 Jan 2026.
- Net sales FY2022 $109.1bn, FY2023 $107.4bn (53 weeks), FY2024 $106.6bn and FY2025 $104.8bn ((1.7%)); TTM Q3 FY2026 $109.5bn. Operating margin 3.5% in FY2022, 5.3% in FY2023 and 4.9% in FY2025; TTM 6.2% incl. $1.30bn of tariff refunds (5.0% without, derived).
- Mix in FY2025: Food & beverage $24.14bn, Household essentials $18.02bn, Hardlines $15.80bn, Apparel & accessories $15.74bn, Home furnishings & decor $15.61bn, Beauty $13.21bn, and $2.06bn of non merchandise revenue (advertising $915m, credit card profit sharing $522m, other $626m).
- After tax return on invested capital, as defined by the company: 16.5% TTM to 31 Oct 2026 against 13.4% a year earlier; tariff refunds add 3.0 pts to the TTM figure (8-K Ex 99).


| Line | Q3 FY2024 | Q4 FY2024 | Q1 FY2025 | Q2 FY2025 | Q3 FY2025 | Q4 FY2025 | Q1 FY2026 | Q2 FY2026 | Q3 FY2026 |
|---|---|---|---|---|---|---|---|---|---|
| Net sales ($m) | 25,668 | 30,915 | 23,846 | 25,211 | 25,270 | 30,453 | 25,443 | 26,539 | 27,067 |
| Net sales growth year on year (%) | n/a | n/a | n/a | n/a | (1.6) | (1.5) | 6.7 | 5.3 | 7.1 |
| Comparable sales (%) | 0.3 | 1.5 | (3.8) | (1.9) | (2.7) | (2.5) | 5.6 | 3.8 | 5.6 |
| Comparable traffic (%) | 2.4 | 2.1 | (2.4) | (1.3) | (2.2) | (2.9) | 4.4 | 3.6 | 5.0 |
| Average transaction amount (%) | (2.0) | (0.6) | (1.4) | (0.6) | (0.5) | 0.4 | 1.1 | 0.2 | 0.6 |
| Stores originated comparable sales (%) | (1.9) | (0.5) | (5.7) | (3.2) | (3.8) | (3.9) | 4.7 | 2.7 | 4.6 |
| Digitally originated comparable sales (%) | 10.8 | 8.7 | 4.7 | 4.3 | 2.4 | 1.9 | 8.9 | 8.7 | 9.8 |
| Non merchandise sales ($m) | 440 | 487 | 441 | 492 | 518 | 613 | 549 | 592 | 618 |
| Operating income ($m) | 1,168 | 1,467 | 1,472 | 1,317 | 948 | 1,380 | 1,135 | 2,560 | 1,672 |
| Diluted EPS ($) | 1.85 | 2.41 | 2.27 | 2.05 | 1.51 | 2.30 | 1.71 | 4.11 | 2.65 |
2 Stores and Digital: Traffic Returns to Growth
- Comparable sales +5.6% in Q3 FY2026 after +5.6% in Q1 and +3.8% in Q2, against four negative quarters in FY2025 ((3.8%), (1.9%), (2.7%), (2.5%)).
- Traffic drives the change: comparable traffic +5.0% and average transaction amount +0.6%; in Q3 FY2025 traffic was (2.2%).
- Stores originated comparable sales +4.6% against (3.8%); digitally originated +9.8% against +2.4%. Digital share of merchandise sales 19.8% against 19.3%; stores fulfilled 97.4% of merchandise sales, incl. pickup, Drive Up and same day delivery.
- Store count 2,026 at 31 Oct 2026 against 1,995 a year earlier; retail square feet 254.8m against 250.5m. Q3 capex $1.4bn (+$0.4bn) went mainly to new and existing stores.
How store and digital shopping is changing
- TGT 10-K FY2025: stores fulfilled more than 97% of merchandise sales in each of the last three years, incl. Order Pickup, Drive Up and same day delivery.
- TGT Q1 FY2026 release (20 May 2026): same day delivery powered by Target Circle 360 grew more than 27%; Q2 FY2026 release: more than 25%.
- TGT Q3 FY2026 release: digitally originated sales 19.8% of merchandise sales against 19.3%; stores fulfilled 97.4% against 97.7%.
- Walmart Q3 FY2027 (comparable sales 13 weeks to 30 Oct 2026): Walmart US comparable sales +2.9% excluding fuel, transactions +1.5%, ticket +1.4%; Walmart US eCommerce +23%.
- Costco Q4 FY2026 (16 weeks to 30 Aug 2026): digitally enabled comparable sales +19.5%; total comparable sales +9.4% (+6.7% excluding gasoline and foreign exchange).
- Dollar General Q2 2026 (to 31 Jul 2026): same store sales +3.5% on traffic +2.0% and ticket +1.5%; fifth consecutive quarter of traffic growth.
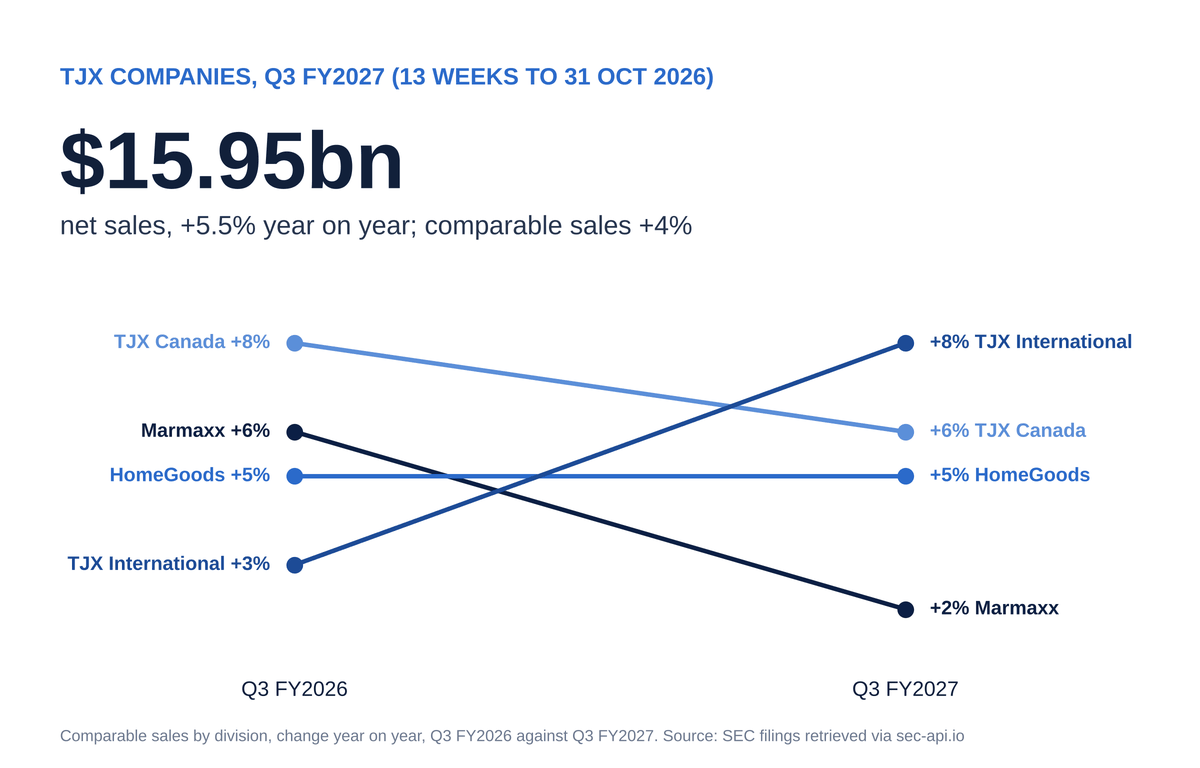
- TJX Q3 FY2027 (to 31 Oct 2026): comparable sales +4%; Marmaxx (US) +2%, HomeGoods +5%.
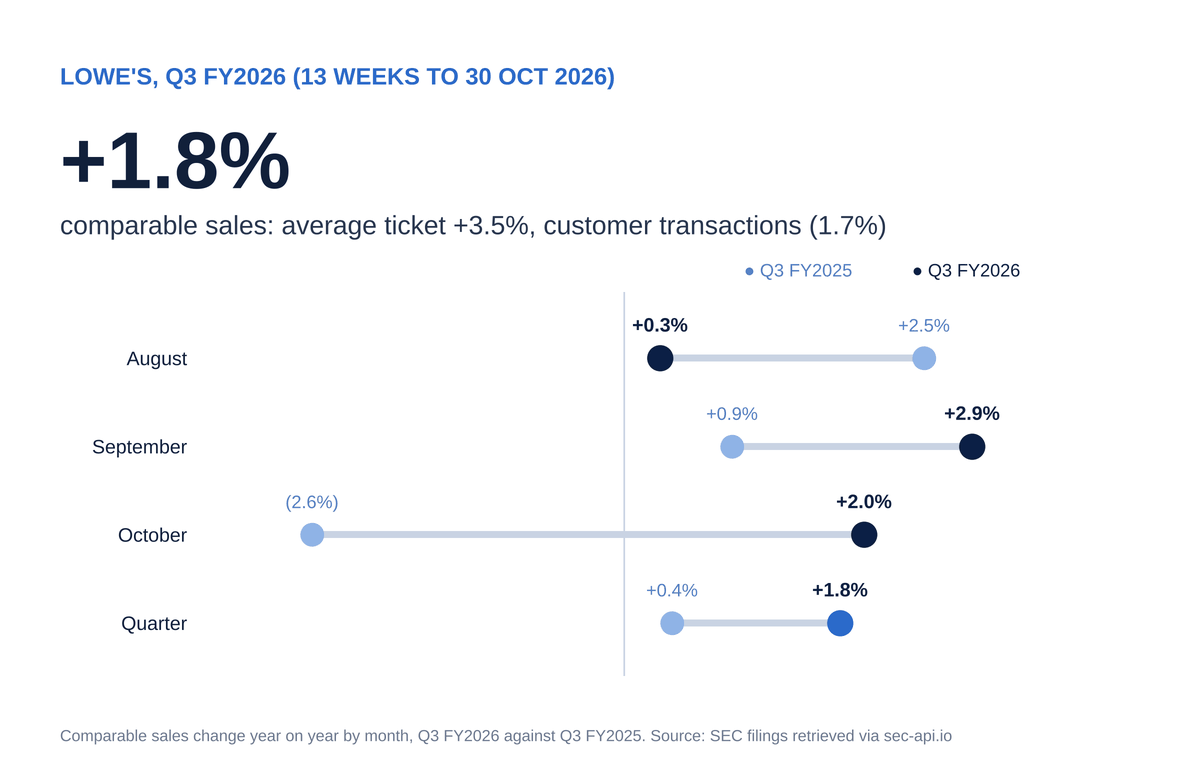
- Home Depot Q3 FY2026 (to 1 Nov 2026): comparable sales +2.2%, comparable transactions (0.5%).


| Company | Line | Period | Value | Growth (%) | Operating margin (%) | Detail |
|---|---|---|---|---|---|---|
| Target | Comparable sales | Q3 FY2026 (to 31 Oct 2026) | +5.6% | n/a | 6.2 | stores +4.6%, digital +9.8%; traffic +5.0% |
| Walmart | Walmart US comparable sales | Q3 FY2027 (13 weeks to 30 Oct 2026) | +2.9% | n/a | 4.1 | ex fuel; transactions +1.5%, ticket +1.4%; eCommerce +23% |
| Costco | Comparable sales | Q4 FY2026 (16 weeks to 30 Aug 2026) | +9.4% | n/a | 4.0 | digitally enabled +19.5%; +6.7% ex gasoline and FX |
| TJX | Comparable sales | Q3 FY2027 (to 31 Oct 2026) | +4.0% | n/a | n/a | pretax margin 13.0%; Marmaxx +2% |
| Dollar General | Same store sales | Q2 2026 (to 31 Jul 2026) | +3.5% | n/a | 6.8 | traffic +2.0%, ticket +1.5% |
| Home Depot | Comparable sales | Q3 FY2026 (to 1 Nov 2026) | +2.2% | n/a | 12.6 | ticket +3.0%, transactions (0.5%) |
3 Merchandise Categories: Fun 101, Beauty and Food Lead
- Q3 FY2026 net sales by category: Hardlines (Fun 101) $4.05bn (+26.8%), Beauty $3.53bn (+9.1%), Food & beverage $6.41bn (+6.6%), Household essentials $4.75bn (+4.5%), Home furnishings & decor $4.01bn (+2.5%), Apparel & accessories $3.69bn ((3.8%)).
- Hardlines (Fun 101) grew in each FY2026 quarter: +14.6% in Q1, +10.6% in Q2 and +26.8% in Q3; it was 15% of merchandise sales in H1 FY2026 against 14% (10-Q).
- Beauty +9.1% in Q3 FY2026 while the Ulta Beauty shop in shop agreement ended at its expiry in August 2026 (10-K). Apparel & accessories fell 3.8% in Q3 after +0.1% in Q2.
- Merchandise sales $26.45bn (+6.9%). Over five quarters Food & beverage moved from +1.5% in Q3 FY2025 to +6.6%; Home furnishings & decor from (6.6%) to +2.5%.
How the categories are changing
- TGT 10-K FY2025: Ulta Beauty shop in shop agreement ends at its expiry in August 2026 by mutual agreement.
- TGT 10-K FY2025: about one half of merchandise is sourced outside the US, China the largest country of origin; owned and exclusive brands about 30% of merchandise sales.
- TGT Q3 FY2026 release: tariff refunds of $301m in Q3 and $1.3bn in nine months recorded as a reduction of cost of sales.
- TJX Q3 FY2027: HomeGoods (US) net sales $2.74bn (+7.8%) and comparable sales +5%; Marmaxx $9.33bn (+3.2%).
- Dollar General Q2 2026: consumables $9.26bn (+5.0%), seasonal $1.19bn (+7.4%), home products $537m (+4.8%), apparel $303m (+4.5%).
- TJX Q3 FY2027 release: gross margin 32.9% incl. 0.8 pts net benefit from tariff refunds; Costco Q4 FY2026 EPS incl. $0.15 from tariff refunds.


| Company | Line | Period | Value | Growth (%) | Operating margin (%) | Detail |
|---|---|---|---|---|---|---|
| Target | Hardlines (Fun 101) | Q3 FY2026 (to 31 Oct 2026) | $4.05bn | +26.8% | n/a | 15.3% of merchandise sales |
| Target | Beauty | Q3 FY2026 (to 31 Oct 2026) | $3.53bn | +9.1% | n/a | 13.3% of merchandise sales |
| Target | Home furnishings & decor | Q3 FY2026 (to 31 Oct 2026) | $4.01bn | +2.5% | n/a | 15.1% of merchandise sales |
| Target | Apparel & accessories | Q3 FY2026 (to 31 Oct 2026) | $3.69bn | (3.8%) | n/a | 14.0% of merchandise sales |
| TJX HomeGoods | Net sales | Q3 FY2027 (to 31 Oct 2026) | $2.74bn | +7.8% | n/a | comparable sales +5% |
| TJX Marmaxx | Net sales | Q3 FY2027 (to 31 Oct 2026) | $9.33bn | +3.2% | n/a | apparel and home, comparable sales +2% |
| Dollar General | Consumables net sales | Q2 2026 (to 31 Jul 2026) | $9.26bn | +5.0% | n/a | 82% of net sales |
| Dollar General | Seasonal net sales | Q2 2026 (to 31 Jul 2026) | $1.19bn | +7.4% | n/a | toys, party, seasonal goods |
4 Non Merchandise Revenue: Roundel, Card and Membership
- Non merchandise sales $618m in Q3 FY2026 (+19.3%), 2.3% of net sales against 2.0%; nine months $1.76bn against $1.45bn.
- Advertising revenue $296m (+22.8%), mainly Roundel; FY2025 $915m against $649m in FY2024 and $404m in FY2022. Some Roundel arrangements are booked as a reduction of cost of sales or SG&A instead of net sales.
- Credit card profit sharing $153m (+28.6%) after year on year declines from Q2 FY2025 to Q1 FY2026; other $169m (+7.0%), which holds Target Circle 360 membership and Target+ marketplace revenue.
- Risk factor change: the FY2025 10-K adds a Roundel factor: advertisers have no long term commitments and AI enabled advertising tools add competition.
How retail media and memberships are changing
- TGT 10-K FY2025 adds a risk factor on Roundel: advertisers have no long term commitments; AI enabled ad tools named as competition.
- TGT 10-K FY2025, Note 2: advertising revenue $915m in FY2025 against $649m in FY2024 and $522m in FY2023.
- TGT Q4 FY2025 release: membership revenue more than doubled and marketplace grew more than 30% in Q4 FY2025.
- Walmart Q3 FY2027 (to 31 Oct 2026): global advertising +25%, Walmart US advertising +37%, membership fee revenue +17% globally; Walmart files growth rates, no dollar values.
- Costco Q4 FY2026: membership fees $1.85bn (+7.3%); FY2026 $5.91bn (+11.0%).
- TGT Q3 FY2026 release: non merchandise sales +19.3%; Roundel, Target Circle Card profit sharing, Target Circle 360 membership and Target+ marketplace named.


| Company | Line | Period | Value | Growth (%) | Operating margin (%) | Detail |
|---|---|---|---|---|---|---|
| Target | Advertising revenue | Q3 FY2026 (to 31 Oct 2026) | $296m | +22.8% | n/a | mainly Roundel; FY2025 $915m |
| Target | Credit card profit sharing | Q3 FY2026 (to 31 Oct 2026) | $153m | +28.6% | n/a | Target Circle Card |
| Target | Other non merchandise | Q3 FY2026 (to 31 Oct 2026) | $169m | +7.0% | n/a | incl. membership and marketplace |
| Walmart | Walmart US advertising | Q3 FY2027 (to 31 Oct 2026) | not filed | +37.0% | n/a | growth only filed; global advertising +25%, membership fee revenue +17% |
| Costco | Membership fees | Q4 FY2026 (16 weeks to 30 Aug 2026) | $1.85bn | +7.3% | n/a | FY2026 $5.91bn (+11.0%) |
5 Financial Analysis & Ratios
- Operating margin TTM 6.2% against 4.9% in FY2025, 5.2% in FY2024 and 5.3% in FY2023. TTM includes $1.30bn of tariff refunds; FY2025 includes the $593m interchange settlement gain and $250m of transformation costs.
- Net earnings TTM $4.92bn (4.5% of sales); diluted EPS TTM $10.77. Effective tax rate TTM 23.1%.
- Operating cash flow $5.73bn in the first nine months of FY2026 against $3.49bn; free cash flow TTM $4.16bn after capex of $4.65bn (4.2% of sales).
- Balance sheet at 31 Oct 2026: cash $4.46bn; debt $15.33bn (current $1.14bn, long term $14.19bn) against $16.50bn a year earlier; inventory $16.14bn; shareholders' investment $18.37bn against $15.50bn.
- Capital returns: dividends $2.08bn TTM, 50% of free cash flow; quarterly dividend $1.16 ($4.64 a year, 2.8% of the 18 Nov 2026 close). Buybacks of $251m in Q3 FY2026 at an average $155.49, the first since Q3 FY2025; $8.0bn of authorization left.
| Line item | FY2022 | FY2023 | FY2024 | FY2025 | TTM Q3 FY2026 |
|---|---|---|---|---|---|
| Revenue | 109.1 | 107.4 | 106.6 | 104.8 | 109.5 |
| Gross profit | 26.8 | 29.6 | 30.1 | 29.3 | 32.7 |
| Selling, general and administrative | 20.6 | 21.5 | 22.0 | 21.5 | 23.3 |
| Operating income | 3.8 | 5.7 | 5.6 | 5.1 | 6.7 |
| Net income | 2.8 | 4.1 | 4.1 | 3.7 | 4.9 |
| Diluted EPS ($) | 5.98 | 8.94 | 8.86 | 8.13 | 10.77 |
| Operating cash flow | 4.0 | 8.6 | 7.4 | 6.6 | 8.8 |
| Capital expenditure | (5.5) | (4.8) | (2.9) | (3.7) | (4.6) |
| Free cash flow | (1.5) | 3.8 | 4.5 | 2.8 | 4.2 |
| Stock based compensation | 0.2 | 0.3 | 0.3 | 0.3 | 0.3 |
| Cash and investments | 2.2 | 3.8 | 4.8 | 5.5 | 4.5 |
| Total debt | n/a | 16.0 | 15.9 | 16.5 | 15.3 |
| Total equity | 11.2 | 13.4 | 14.7 | 16.2 | 18.4 |

| Metric | Q3 FY2025 | Q3 FY2026 | Change |
|---|---|---|---|
| Revenue ($bn) | 25.27 | 27.07 | 7.1% |
| Gross profit ($bn) | 7.13 | 8.26 | 15.8% |
| Operating income ($bn) | 0.95 | 1.67 | 76.4% |
| Net income ($bn) | 0.69 | 1.21 | 75.8% |
| Diluted EPS ($) | 1.51 | 2.65 | 75.5% |
| Operating cash flow ($bn) | 1.13 | 1.21 | 7.2% |
| Free cash flow ($bn) | 0.15 | (0.15) | n/a |
| Operating margin (%) | 3.8 | 6.2 | 2.4 pts |
| Net margin (%) | 2.7 | 4.5 | 1.7 pts |
| Ratio | FY2022 | FY2023 | FY2024 | FY2025 | TTM Q3 FY2026 |
|---|---|---|---|---|---|
| Growth and margins | |||||
| Revenue growth (%) | n/a | (1.6) | (0.8) | (1.7) | n/a |
| Gross margin (%) | 24.6 | 27.5 | 28.2 | 27.9 | 29.9 |
| Operating margin (%) | 3.5 | 5.3 | 5.2 | 4.9 | 6.2 |
| Net margin (%) | 2.5 | 3.9 | 3.8 | 3.5 | 4.5 |
| FCF margin (%) | (1.4) | 3.6 | 4.2 | 2.7 | 3.8 |
| Cost and investment intensity | |||||
| SBC (%) revenue | 0.2 | 0.2 | 0.3 | 0.3 | 0.3 |
| Capex (%) revenue | 5.1 | 4.5 | 2.7 | 3.6 | 4.2 |
| Effective tax rate (%) | 18.7 | 21.9 | 22.2 | 22.3 | 23.1 |
| Returns | |||||
| ROE (%) | 24.8 | 33.6 | 29.1 | 24.0 | 26.8 |
| ROA (%) | n/a | 7.5 | 7.2 | 6.3 | 7.7 |
| ROIC (%) | 34.8 | 17.4 | 16.7 | 14.7 | 17.7 |
| Asset turnover (x) | n/a | 1.94 | 1.84 | 1.76 | 1.71 |
| Liquidity and leverage | |||||
| Current ratio (x) | n/a | 0.91 | 0.94 | 0.94 | 0.99 |
| Debt to equity (x) | n/a | 1.19 | 1.09 | 1.02 | 0.83 |
| Net cash ($bn) | 2.2 | (12.2) | (11.2) | (11.0) | (10.9) |
| Efficiency and cash quality | |||||
| Inventory days | n/a | 56 | 61 | 59 | 77 |
| Shareholder returns (%) FCF | n/a | 53 | 68 | 87 | 56 |


| Measure | Value |
|---|---|
| Market cap ($bn) | 75.1 |
| Enterprise value ($bn) | 86.0 |
| P/E (TTM) (x) | 15.4 |
| EV/Sales (TTM) (x) | 0.8 |
| EV/EBITDA (TTM) (x) | 8.6 |
| FCF yield (%) | 5.5 |
| Price/Book (x) | 4.1 |
Cost structure and profitability
- Gross margin 30.5% in Q3 FY2026 against 28.2%, with cost of sales +3.7% against net sales +7.1%; $301m of tariff refunds account for 1.1 pts. In Q2 FY2026 refunds of $994m added 3.7 pts.
- SG&A 21.9% of sales against 21.9% GAAP and 21.3% adjusted; D&A $665m (+2.5%). Nine month SG&A rose 8.1% against adjusted nine month SG&A of $15.92bn.
- Operating margin without refunds and one off items: 5.1% in Q3 FY2026 against 4.4% adjusted a year earlier, and 5.9% in Q2 FY2026 against 5.2% (derived).
- Operating income bridge Q3 FY2025 to Q3 FY2026: gross margin +$1.13bn (refunds $301m), SG&A +$386m, operating income +$724m.


| Line | Q3 FY2025 | Q4 FY2025 | Q1 FY2026 | Q2 FY2026 | Q3 FY2026 |
|---|---|---|---|---|---|
| Cost of sales (% of net sales) | 71.8 | 73.4 | 71.0 | 66.3 | 69.5 |
| Gross margin (% of net sales) | 28.2 | 26.6 | 29.0 | 33.7 | 30.5 |
| Selling, general and administrative (% of net sales) | 21.9 | 19.9 | 21.9 | 21.6 | 21.9 |
| Depreciation and amortization (% of net sales) | 2.6 | 2.2 | 2.7 | 2.5 | 2.5 |
| Tariff refunds (in cost of sales) (% of net sales) | 0.0 | 0.0 | 0.0 | 3.7 | 1.1 |
| Operating income (% of net sales) | 3.8 | 4.5 | 4.5 | 9.6 | 6.2 |
| Adjusted operating income (% of net sales) | 4.4 | 4.8 | 4.5 | 9.6 | 6.2 |
| Line | Q3 FY2025 | Q3 FY2026 | Change |
|---|---|---|---|
| Net sales | 25,270 | 27,067 | 1,797 |
| Gross margin | 7,133 | 8,259 | 1,126 |
| of which tariff refunds | 0 | 301 | 301 |
| SG&A | (5,536) | (5,922) | (386) |
| Depreciation and amortization | (649) | (665) | (16) |
| Operating income | 948 | 1,672 | 724 |
| Net interest and other | (89) | (81) | 8 |
| Provision for income taxes | (170) | (380) | (210) |
| Net earnings | 689 | 1,211 | 522 |
Inventory, debt and equity
- Inventory $16.14bn at 31 Oct 2026 against $14.90bn; accounts payable $15.51bn, 96% of inventory against 93%.
- Debt $15.33bn against $16.50bn a year earlier; $1.11bn repaid in nine months; no commercial paper in 2026 or 2025.
- Shareholders' investment $18.37bn against $14.49bn at 2 Nov 2024, as earnings exceed dividends and buybacks.

6 MD&A & Management Commentary
Q3 FY2026 results: 8-K Ex 99 of 18 Nov 2026
- Net sales $27.07bn, +7.1%; nine months $79.05bn (+6.4%). Merchandise sales +6.9% and non merchandise sales +19.3%; comparable sales +5.6% (nine months +5.0%). Net sales grew in each of the three months of the quarter.
- Profit lines: gross margin $8.26bn (30.5%, incl. 1.1 pts from refunds; about +1.2 pts without them); SG&A $5.92bn (+7.0%), 21.9% of sales against 21.9% GAAP and 21.3% adjusted; net earnings $1.21bn (+75.8%); tax rate 23.9% against 19.8%.
- Reasons given in the release: gross margin benefited from the comparison with last year's markdowns and tariff rates, non merchandise growth and supply chain productivity, offset by freight and fuel costs, price investments and category mix; SG&A rose on incentive pay, store labor hours and new and existing stores.
- Balance sheet items: inventory $16.14bn (+8.4%) against net sales +7.1%; accounts payable $15.51bn (+12.5%); 2,026 stores against 1,995.
- Nine month cash: operating cash flow $5.73bn, capex $3.76bn, debt repaid $1.11bn, dividends $1.56bn, buybacks $253m; cash fell from $5.49bn to $4.46bn.
| Item | Outlook | Source |
|---|---|---|
| FY2026 net sales growth | around 6% (19 Aug: around 5%; 20 May: around 4%; 3 Mar: around 2%); implied FY2026 sales about $111.1bn | 8-K Ex 99; derived |
| FY2026 operating margin | around 6.2% incl. about 1.1 pts of refunds received to date (19 Aug: around 6% incl. about 90 bps; 3 Mar and 20 May: about or more than 20 bps above 4.6%) | 8-K Ex 99 |
| FY2026 GAAP and adjusted EPS | $10.65 to $11.40 incl. about $2.14 of refunds (19 Aug: $9.90 to $10.90; 20 May: near the high end of $7.50 to $8.50; 3 Mar: $7.50 to $8.50); implied Q4 $2.18 to $2.93 | 8-K Ex 99; derived |
| Tariff refunds in guidance | refunds received to date included; any future refunds excluded | 8-K Ex 99 |
| 2027 capital expenditures | $5bn to $6bn; nine month FY2026 capex $3.76bn | 8-K Ex 99 |
| November 2026 trading | month to date net sales in line with guidance, faster than October | 8-K Ex 99 |
| FY2025 guidance against actual | 19 Nov 2025: Q4 sales low single digit decline, GAAP EPS $7.70 to $8.70, adjusted $7.00 to $8.00; actual Q4 (1.5%), $8.13 and $7.57 | 8-K Ex 99, 19 Nov 2025 and 3 Mar 2026 |
Management and CFO commentary
- Target files no separate CFO commentary document; the points below come from statements and guidance in the releases filed as 8-K Ex 99 and from the 10-Q MD&A.
- Q3 FY2026 release (18 Nov 2026), CEO Michael Fiddelke: results reflect progress on priorities centered on style, design and value; November month to date net sales are in line with guidance and faster than October.
- Q2 FY2026 release (19 Aug 2026): prices lowered on more than 10,000 frequently purchased items over the past year; EPS excluding refunds +20%.
- Q1 FY2026 release (20 May 2026): net sales grew 6.7%, well above company expectations; SG&A rose on field hours and training, incentive pay, capital projects and marketing.
- 10-Q Q2 FY2026 MD&A: further tariff refund claims are pursued but their amount and timing cannot be estimated; new tariffs apply to most major trading partners.
| Speaker | Date and source | Statement |
|---|---|---|
| Michael Fiddelke, CEO | 18 Nov 2026, 8-K Ex 99 | “Our investments are building on one another” |
| Michael Fiddelke, CEO | 19 Aug 2026, 8-K Ex 99 | “we've reduced prices on more than 10,000 frequently purchased items” |
| Michael Fiddelke, CEO | 10 Feb 2026, 8-K Ex 99 filed 11 Feb 2026 | “These leadership changes align the right talent and expertise with key roles” |
| Item | Disclosure |
|---|---|
| 10-K FY2025, Item 1 | One segment; stores fulfilled more than 97% of merchandise sales in each of the last three years; owned and exclusive brands about 30% of merchandise sales; about 415,000 team members at 31 Jan 2026. |
| 10-K FY2025, Item 1 (sourcing) | About one half of merchandise is sourced outside the US, with China the largest country of origin; global sourcing offices in 13 countries. |
| 10-K FY2025, Item 1 (partners) | Ulta Beauty shop in shop agreement ends when it expires in August 2026 by mutual agreement; CVS runs pharmacies and clinics under a perpetual operating agreement. |
| 10-K FY2025, Item 1A | 23 risk factors against 20; adds business transformation, Roundel retail media and shareholder activism; trade factor cites the February 2026 Supreme Court ruling on IEEPA tariffs and new Section 122 tariffs. |
| 10-K FY2025, Item 7 and Note 2 | FY2025 net sales $104.78bn ((1.7%)); advertising revenue $915m against $649m; credit card profit sharing $522m against $576m; FY2023 had 53 weeks with $1.7bn of extra sales. |
| 10-K FY2025, notes | FY2025 included $593m of pretax interchange fee settlement gains (Q1) and business transformation costs of $250m pretax (Q3 and Q4). |
| 10-Q Q2 FY2026, MD&A | $994m of IEEPA tariff refunds recognized in cost of sales in Q2 FY2026; further refund claims pursued, effects of any further refunds not estimable; new tariffs instituted against most major trading partners. |
| 10-Q Q2 FY2026, liquidity | $1.0bn of debt repaid in April 2026; new $4.0bn revolving facility to August 2031; no commercial paper or facility borrowings in 2026 or 2025; ratings A2 and A. |
| 10-Q Q2 FY2026, stores | 24 stores opened in H1 FY2026 against 4; 2,019 stores at 1 Aug 2026; Hardlines (Fun 101) 15% of merchandise sales against 14%. |
| 10-Q Q1 and Q2 FY2026, Item 1A | No material change to the risk factors of the FY2025 10-K. The Q3 FY2026 10-Q was not on EDGAR on 19 Nov 2026. |
7 Peer Valuation & Sector Summary
- Sector: US general merchandise, discount and warehouse club retail. The 10-K names omnichannel retailers, department stores, off price retailers, wholesale clubs, category specialists, drug stores, supermarkets, direct to consumer brands and online marketplaces as competitors.
- Net sales growth, latest quarter: COST +11.1% (total revenue), TGT +7.1%, TJX +5.5%, WMT +5.2% (total revenues), DG +5.2%, HD +4.9%. Comparable sales: Costco +9.4% (+6.7% excluding gasoline and foreign exchange), TGT +5.6%, TJX +4%, DG +3.5%, Walmart US +2.9% (excluding fuel), HD +2.2%.
- GAAP operating margin, latest quarter: HD 12.6%, DG 6.8%, TGT 6.2%, WMT 4.1%, COST 4.0%; TJX pretax margin 13.0%. Tariff refunds appear in the latest quarter of TGT, TJX, COST and DG.
- Market value at the close of 18 Nov 2026 (HD 16 Nov 2026): WMT $1.01tn, COST $487bn, HD $347bn, TJX $154bn, TGT $75bn, DG $30bn.
| Company | Revenue growth (%) | Gross margin (%) | Operating margin (%) | Net margin (%) | Market value ($bn) |
|---|---|---|---|---|---|
| TGT | 7.1 | 30.5 | 6.2 | 4.5 | 75 |
| WMT | 5.2 | 24.5 | 4.1 | 2.6 | 1,013 |
| COST | 11.1 | 11.0 | 4.0 | 3.1 | 487 |
| TJX | 5.5 | 32.9 | 13.0 | 9.7 | 154 |
| HD | 4.9 | 32.8 | 12.6 | 8.6 | 347 |
| DG | 5.2 | 32.6 | 6.8 | 4.9 | 30 |

8 Material Events & Contracts
- Thirteen Forms 8-K from 19 Nov 2025 to 18 Nov 2026: five earnings releases, one leadership release that confirmed Q4 FY2025 guidance, five officer and director filings, the 2026 meeting results with the amended incentive plan, and a new credit facility.
- CEO change: Michael Fiddelke, COO from February 2024 to January 2026 and CFO from November 2019 to October 2024 (10-K; the proxy gives September 2024), became CEO on 1 Feb 2026 with a $1.30m salary, 200% bonus target and $12.1m equity target; Brian Cornell stepped down as CEO and serves as Executive Chair at a $1.12m salary, with a $6.0m RSU award, anticipated to serve as Executive Chair or special advisor until 13 Mar 2027.
- Leadership changes from 15 Feb 2026: Cara Sylvester became Chief Merchandising Officer and Lisa Roath COO ($775,000 salary); Rick Gomez, Chief Commercial Officer, stepped down on 15 Feb 2026 and was to depart on 17 Apr 2026 with severance under the Income Continuation Plan; Jill Sando, Chief Merchandising Officer for apparel, home and hardlines, retired.
- Board: John Hoke (former Chief Innovation Officer at NIKE) from 1 Mar 2026, Stephen Bratspies (former CEO of HanesBrands) from 1 Apr 2026, Joe DePinto (former CEO of 7‑Eleven) from 1 Aug 2026 and Sally Grimes (former CEO North America at Diageo) from 1 Dec 2026.
- Financing: a $4.0bn five year revolving credit facility signed 14 Aug 2026 (to 14 Aug 2031, expandable by $1.0bn) replaced $1.0bn and $3.0bn facilities; $1.0bn of notes repaid in April 2026; no commercial paper or facility borrowings in 2026 or 2025 (10-Q).
| Date | Items | Event |
|---|---|---|
| 19 Nov 2025 | 2.02, 9.01 | Q3 FY2025 results (Ex 99): net sales $25.27bn ((1.5%)); comparable sales (2.7%); GAAP EPS $1.51, adjusted $1.78; FY2025 GAAP EPS guidance $7.70 to $8.70 |
| 22 Jan 2026 | 5.02 | Board elects John R. Hoke III (from 1 Mar 2026) and Stephen B. Bratspies (from 1 Apr 2026) as directors |
| 5 Feb 2026 | 5.02 | Pay set for CEO Michael Fiddelke from 1 Feb 2026: $1.30m salary, 200% bonus target, $12.1m equity target; Brian Cornell Executive Chair, $1.12m salary, $6.0m RSU award |
| 10 Feb 2026 | 5.02 | Lisa Roath named EVP and COO from 15 Feb 2026 ($775,000 salary); Rick Gomez, EVP and Chief Commercial Officer, steps down, departs 17 Apr 2026 |
| 11 Feb 2026 | 2.02, 9.01 | Executive leadership changes (Ex 99): Cara Sylvester Chief Merchandising Officer, Lisa Roath COO; Q4 FY2025 sales and FY2025 EPS confirmed in line with guidance |
| 3 Mar 2026 | 2.02, 9.01 | Q4 FY2025 results (Ex 99): net sales $30.45bn ((1.5%)); FY2025 $104.78bn ((1.7%)); GAAP EPS FY2025 $8.13, adjusted $7.57; FY2026 guidance: sales around +2%, EPS $7.50 to $8.50 |
| 20 May 2026 | 2.02, 9.01 | Q1 FY2026 results (Ex 99): net sales $25.44bn (+6.7%); comparable sales +5.6%; EPS $1.71; FY2026 sales guidance raised to around +4% |
| 12 Jun 2026 | 5.02, 5.07, 9.01 | Annual meeting of 10 Jun 2026: 12 directors elected, say on pay 89.0%, amended 2020 LTIP approved (Ex 10.27); three shareholder proposals rejected |
| 22 Jul 2026 | 5.02, 9.01 | Board elects Joe DePinto, former CEO of 7‑Eleven, as a director from 1 Aug 2026 (Ex 99) |
| 14 Aug 2026 | 1.01, 1.02, 2.03, 9.01 | $4.0bn five year unsecured revolving credit facility to 14 Aug 2031 (Ex 10.28), replacing $1.0bn and $3.0bn facilities |
| 19 Aug 2026 | 2.02, 9.01 | Q2 FY2026 results (Ex 99): net sales $26.54bn (+5.3%); comparable sales +3.8%; EPS $4.11 incl. $1.65 of tariff refunds ($994m pretax); FY2026 EPS guidance $9.90 to $10.90 |
| 12 Nov 2026 | 5.02, 9.01 | Board elects Sally Grimes, former CEO North America at Diageo, as a director from 1 Dec 2026 (Ex 99) |
| 18 Nov 2026 | 2.02, 9.01 | Q3 FY2026 results (Ex 99): net sales $27.07bn (+7.1%); comparable sales +5.6%; EPS $2.65 incl. $0.50 of tariff refunds ($301m pretax); FY2026 EPS guidance $10.65 to $11.40 |
| Contract | Terms |
|---|---|
| Five year credit agreement (Ex 10.28) | $4.0bn unsecured revolver with Bank of America as agent, to 14 Aug 2031, two one year extensions, up to $1.0bn more; leverage ratio covenant. |
| Long term debt | Long term debt and other borrowings $14.19bn plus $1.14bn current portion at 31 Oct 2026; ratings A2 and A; no rating downgrade acceleration except change of control put terms (10-Q). |
| CEO and Executive Chair terms | Fiddelke $1.30m salary, 200% target bonus, $12.1m equity; Cornell letter agreement of 2 Feb 2026, $1.12m salary, $6.0m RSUs, no severance under the Income Continuation Plan. |
| Amended 2020 Long Term Incentive Plan (Ex 10.27) | Approved on 10 Jun 2026 with 320.2m votes for and 14.6m against. |
| Share repurchase program | Program of August 2021; about $8.0bn left at 31 Oct 2026 after $251m bought in Q3 FY2026. |
9 Ownership, Voting Power & Annual Meeting
- One class of common stock with one vote per share; 454,176,247 shares at the 13 Apr 2026 record date and 452,734,623 at 31 Oct 2026. The proxy lists State Street (7.9%) and BlackRock (7.2%) from 2024 filings; later Schedules 13G show Vanguard Capital Management at 7.51% and FMR at 5.4%.
- Annual meeting of 10 Jun 2026 (Item 5.07): all 12 directors elected; Michael Fiddelke received 99.1% of votes cast and Brian Cornell 87.2%; say on pay 89.0%; amended incentive plan approved; three shareholder proposals rejected, with an independent chair proposal at 38.3%.
- CEO pay: FY2025 total compensation of the then CEO, Brian Cornell, $21.83m; median team member $27,506 (part time); ratio 794 to 1 (DEF 14A).
- Insiders, Form 4 transactions 18 Nov 2025 to 31 Oct 2026: no open market purchases; nine sale lines worth $26.01m, of which Brian Cornell sold 150,000 shares for $20.76m in March, May and August 2026. Other Forms 4 are award grants and shares withheld for tax.
| Proposal | For (m votes) | Against (m votes) | Abstain (m votes) | For as % of votes cast | Result |
|---|---|---|---|---|---|
| Election of Michael J. Fiddelke | 333.0 | 3.0 | 0.9 | 99.1 | Elected |
| Election of Brian C. Cornell | 292.4 | 43.1 | 1.5 | 87.2 | Elected |
| Election of Christine A. Leahy | 297.7 | 38.6 | 0.7 | 88.5 | Elected |
| Say on pay (advisory) | 298.2 | 36.8 | 2.0 | 89.0 | Approved |
| Amended and Restated 2020 Long Term Incentive Plan | 320.2 | 14.6 | 2.2 | 95.6 | Approved |
| Shareholder proposal: independent board chair | 128.5 | 206.8 | 1.7 | 38.3 | Rejected |
| Shareholder proposal: report on pesticides in private label brands | 57.0 | 275.0 | 5.0 | 17.2 | Rejected |
| Shareholder proposal: report on plastic microfiber shedding | 62.0 | 270.7 | 4.3 | 18.6 | Rejected |
Annual meeting remarks
- No management remarks, presentation or shareholder questions from the virtual meeting of 10 Jun 2026 were filed; the Item 5.07 filing reports vote counts only.
| Holder | Shares (m) | Share of class (%) | Basis |
|---|---|---|---|
| State Street Corporation | 36.0 | 7.9 | 13G/A of 30 Jan 2024, as listed in the DEF 14A (holdings at 31 Dec 2023) |
| BlackRock, Inc. | 32.5 | 7.2 | 13G/A of 26 Jan 2024, as listed in the DEF 14A (holdings at 31 Dec 2023) |
| Vanguard Capital Management LLC | 34.0 | 7.5 | 13G of 30 Apr 2026 (event date 31 Mar 2026) |
| FMR LLC | 24.7 | 5.4 | 13G of 6 Aug 2026 (event date 30 Jun 2026) |
| Person | Shares sold | Value ($m) |
|---|---|---|
| Brian C. Cornell, Executive Chair | 150,000 | 20.76 |
| Melissa K. Kremer, EVP and Chief Human Resources Officer | 15,500 | 2.63 |
| Cara A. Sylvester, EVP and Chief Merchandising Officer | 10,000 | 1.26 |
| Lisa R. Roath, EVP and COO | 7,000 | 0.97 |
| Matthew A. Liegel, Chief Accounting Officer | 2,979 | 0.39 |
10 Risk Factors
- Item 1A of the FY2025 10-K holds 23 risk factors against 20 in the FY2024 10-K (7,907 words against 6,825). Three factors were added (business transformation, Roundel, shareholder activism), none removed and 3 materially reworded. AI is named 12 times against 7 and tariffs 12 times against 3. The Q1 FY2026 10-Q reports no material change; the Q3 10-Q was not filed on 19 Nov 2026.
| Risk | Disclosure and change |
|---|---|
| Tariffs and trade | Factor cites the February 2026 Supreme Court IEEPA ruling and new Section 122 tariffs; refunds of $1.3bn were recognized in nine months of FY2026, and further refund amounts are not estimable (10-Q). |
| Reputation and boycotts | Reworded factor names consumer boycotts during 2025 after changes to diversity, equity and inclusion initiatives; comparable sales were negative in each quarter of FY2025. |
| Roundel advertising | New factor; advertising revenue $296m in Q3 FY2026 (+22.8%) and $915m in FY2025; advertisers have no long term commitments. |
| Business transformation | New factor; business transformation costs of $161m in Q3 FY2025 and $89m in Q4 FY2025; none of significance in H1 FY2026 (10-Q). |
| Inventory | Inventory $16.14bn at 31 Oct 2026 (+8.4%) ahead of the holiday quarter; Q4 is the largest sales quarter (10-K). |
| Leadership transition | New CEO from 1 Feb 2026, new COO and Chief Merchandising Officer from 15 Feb 2026, four new directors in 2026. |
How risk factors changed
- Comparison: 10-K FY2025 filed 11 Mar 2026 acc 0000027419-26-000016 against 10-K FY2024 filed 12 Mar 2025 acc 0000027419-25-000018.
- AI is named 12 times in Item 1A of the FY2025 10-K against 7 a year earlier.
- Tariff is named 12 times against 3.
- Roundel is named 6 times against 0, in a new standalone factor.

| Measure | 10-K FY2024 | 10-K FY2025 |
|---|---|---|
| Risk factors (count) | 20 | 23 |
| Words in Item 1A | 6,825 | 7,907 |
| Change | Risk factor | What changed |
|---|---|---|
| Added | Business transformation may miss its objectives | New factor on the company wide transformation begun in 2025 (role clarity, technology incl. AI, cost reduction); cites 2025 charges for workforce reductions, facility exits and ending a commercial partnership. |
| Added | Roundel may not maintain or grow ad revenue | New factor: advertisers have no long term commitments; revenue depends on vendor and seller base, digital traffic, platform policies and privacy law; AI enabled ad tools named as competition. |
| Added | Shareholder activism | New factor: activist campaigns could raise costs, divert management and cause stock price volatility. |
| Reworded | Reputation and perceptions of Target | Adds that changes to diversity, equity and inclusion initiatives in 2025 led to adverse reactions and consumer boycotts during 2025, and that officials have asserted such initiatives violate laws. |
| Reworded | Vendors, tax and trade policy, supply chain | Adds the February 2026 Supreme Court ruling that IEEPA tariffs were not authorized, the new Section 122 tariffs, uncertainty over refund timing and amount, and names China, India, Vietnam and Bangladesh; body grows from 601 to 860 words. |
| Reworded | Inventory shrink | Text shortened from 126 to 94 words; body similarity 0.85 against the prior year. |
| Filing | Change disclosed |
|---|---|
| 10-Q Q1 FY2026 filed 29 May 2026 | No material changes to the risk factors of the FY2025 10-K. |
| 10-Q Q2 FY2026 filed 28 Aug 2026 | Refers to the FY2025 10-K risk factors without stating changes. |
11 Stock Price, Scenarios & Sensitivity
- TGT closed at $165.93 on 18 Nov 2026, the day of the Q3 FY2026 release, against $159.53 the session before. 52 week closing high $169.89 (24 Aug 2026) and closing low $83.68 (20 Nov 2025). Highest month end close in five years $243.84 in Nov 2021; lowest $89.70 in Sep 2025.
- Valuation: market value $75.1bn on 452.7m shares (31 Oct 2026); enterprise value $86.0bn incl. net debt $10.87bn. P/E 15.4x TTM diluted EPS (which includes about $2.14 of tariff refunds); EV/Sales 0.79x; dividend yield 2.8%.
- Scenario method: implied price equals TTM Q3 FY2029 diluted EPS times an exit P/E. EPS is net sales times GAAP operating margin, less $350m a year of net interest and other, taxed at 23.5%, over 452.7m shares adjusted for buybacks. Net sales grow from TTM Q3 FY2026 $109.5bn for three years. Growth rates, margins, share counts and multiples are this report's own assumptions, not company guidance; no tariff refunds are assumed.

Critical factors and core assumptions
| Factor | Current value | Best case requires | Evidence in filings |
|---|---|---|---|
| Comparable traffic | +5.0% in Q3 FY2026 | traffic growth holds above 2% a year | 8-K Ex 99 releases |
| Digital comparable sales | +9.8% in Q3 FY2026; 19.8% of merchandise sales | digital share rises with same day delivery | 8-K Ex 99; 10-K Item 1 |
| Underlying operating margin | 5.1% in Q3 FY2026 without refunds (derived) | 6.5% by TTM Q3 FY2029 without refunds | 8-K Ex 99; FY2023 margin 5.3% |
| Non merchandise revenue | $618m in Q3 FY2026 (+19.3%) | Roundel and membership keep growing above sales | 8-K Ex 99; 10-K Note 2 |
| Tariffs | Section 122 tariffs in force; refunds excluded from guidance | stable tariff costs | 10-K Item 1A; 10-Q Q2 FY2026 |
| Store investment | 2,026 stores; 2027 capex $5bn to $6bn | new and remodeled stores add sales at current returns | 8-K Ex 99 |
- Base TTM Q3 FY2026 net sales $109.5bn; GAAP operating margin TTM 6.2% incl. refunds and 5.0% without (derived); FY2026 guidance around +6% sales and around 6.2% margin.
- Best case: 5% net sales CAGR as traffic keeps growing and non merchandise revenue rises; GAAP operating margin 6.5%; shares 5% lower; exit P/E 18x against today's 15.4x.
- Base case: 4% CAGR, below the around 6% guided for FY2026; margin 5.5%; shares 3% lower; exit P/E 15x.
- Worst case: 1% CAGR as comparable sales fade; margin 4.0% with higher tariff and labor costs; shares flat; exit P/E 12x.
- Dividends ($4.64 a year at the current rate) are excluded from implied prices; no future tariff refunds are assumed in any case.
Scenarios, three years forward
| Measure | Worst case | Base case | Best case |
|---|---|---|---|
| Revenue CAGR, 3 years (%) | 1.0 | 4.0 | 5.0 |
| Revenue, TTM Q3 FY2029 ($bn) | 112.8 | 123.2 | 126.8 |
| Operating margin, TTM Q3 FY2029 (%) | 4.0 | 5.5 | 6.5 |
| Net income, TTM Q3 FY2029 ($bn) | 3.2 | 4.9 | 6.0 |
| EPS, TTM Q3 FY2029 ($) | 7.03 | 11.19 | 14.03 |
| Exit P/E (x) | 12.0 | 15.0 | 18.0 |
| Implied price ($) | 84 | 168 | 253 |
| Change against $165.93 (%) | (49) | 1 | 52 |
| Implied annual return (%) | (20.2) | 0.4 | 15.0 |
| Description | Comparable sales fade, margin 4.0% | Sales +4% a year, margin 5.5% | Traffic growth holds, margin 6.5% |

Sensitivity analysis
| Revenue CAGR \ Operating margin | 4% | 5% | 5.5% | 6% | 6.5% |
|---|---|---|---|---|---|
| 1% | $109 | $138 | $153 | $168 | $182 |
| 2.5% | $114 | $145 | $160 | $176 | $191 |
| 4% | $120 | $152 | $168 | $184 | $200 |
| 4.5% | $121 | $154 | $170 | $187 | $203 |
| 5% | $123 | $156 | $173 | $190 | $206 |
| Exit P/E \ Operating margin | 4% | 5% | 5.5% | 6% | 6.5% |
|---|---|---|---|---|---|
| 12x | $96 | $121 | $134 | $147 | $160 |
| 13.5x | $108 | $137 | $151 | $166 | $180 |
| 15x | $120 | $152 | $168 | $184 | $200 |
| 16.5x | $132 | $167 | $185 | $202 | $220 |
| 18x | $144 | $182 | $201 | $221 | $240 |
Disclaimer
This analysis is for information only and is not financial advice. It is derived from public SEC filings retrieved via sec-api.io and is not a publication of the U.S. Securities and Exchange Commission. Scenario values are model outputs under stated assumptions and are not forecasts. Data as of 19 November 2026.
Sources
All company and peer figures are read from SEC filings retrieved through the sec-api.io MCP server. Share prices are regular session closes as dated in the text.
| Form | Period | Filed | Accession number |
|---|---|---|---|
| 8-K Ex 99 (Item 2.02) | Q3 FY2026 | 18 Nov 2026 | 0000027419-26-000051 |
| 8-K Item 5.02, Ex 99 | Nov 2026 | 12 Nov 2026 | 0000027419-26-000049 |
| 10-Q | Q2 FY2026 | 28 Aug 2026 | 0000027419-26-000042 |
| 8-K Ex 99 (Item 2.02) | Q2 FY2026 | 19 Aug 2026 | 0000027419-26-000034 |
| 8-K Items 1.01, 1.02, 2.03, Ex 10.28 | Aug 2026 | 14 Aug 2026 | 0000027419-26-000032 |
| 8-K Item 5.02, Ex 99 | Jul 2026 | 22 Jul 2026 | 0000027419-26-000028 |
| 8-K Items 5.02, 5.07, Ex 10.27 | Jun 2026 | 12 Jun 2026 | 0000027419-26-000026 |
| 10-Q | Q1 FY2026 | 29 May 2026 | 0000027419-26-000022 |
| 8-K Ex 99 (Item 2.02) | Q1 FY2026 | 20 May 2026 | 0000027419-26-000020 |
| DEF 14A | 2026 meeting | 27 Apr 2026 | 0001628280-26-027508 |
| 10-K | FY2025 | 11 Mar 2026 | 0000027419-26-000016 |
| 8-K Ex 99 (Item 2.02) | Q4 FY2025 | 3 Mar 2026 | 0000027419-26-000012 |
| 8-K Item 2.02, Ex 99 | Feb 2026 | 11 Feb 2026 | 0000027419-26-000009 |
| 8-K Item 5.02 | Feb 2026 | 10 Feb 2026 | 0000027419-26-000006 |
| 8-K Item 5.02 | Jan 2026 | 5 Feb 2026 | 0000027419-26-000004 |
| 8-K Item 5.02 | Jan 2026 | 22 Jan 2026 | 0000027419-26-000002 |
| 8-K Ex 99 (Item 2.02) | Q3 FY2025 | 19 Nov 2025 | 0000027419-25-000123 |
| 8-K Ex 99 (Item 2.02) | Q2 FY2025 | 20 Aug 2025 | 0000027419-25-000115 |
| 10-K | FY2024 | 12 Mar 2025 | 0000027419-25-000018 |
| Schedule 13G | Jun 2026 | 6 Aug 2026 | 0000315066-26-002137 |
| Schedule 13G | Mar 2026 | 30 Apr 2026 | 0002100119-26-001095 |
| Schedule 13G/A | Mar 2026 | 27 Mar 2026 | 0000102909-26-002418 |
| Company | Form | Filed | Accession number |
|---|---|---|---|
| Costco | 8-K Ex 99.1 | 24 Sep 2026 | 0000909832-26-000084 |
| Dollar General | 8-K Ex 99 | 27 Aug 2026 | 0001104659-26-101918 |
| Home Depot | 8-K Ex 99.1 | 17 Nov 2026 | 0000354950-26-000184 |
| TJX | 8-K Ex 99.1 | 18 Nov 2026 | 0000109198-26-000058 |
| Walmart | 8-K Ex 99.1 and 99.2 | 19 Nov 2026 | 0000104169-26-000168 |
| Filed | Exhibit | Document | Content |
|---|---|---|---|
| 19 Nov 2025 | Ex 99 | Q3 FY2025 earnings release | Net sales $25.27bn ((1.5%)); comparable sales (2.7%), stores (3.8%), digital +2.4%; GAAP EPS $1.51, adjusted $1.78 excl. $161m of business transformation costs |
| 11 Feb 2026 | Ex 99 | Executive leadership changes and Q4 guidance confirmation | Cara Sylvester Chief Merchandising Officer and Lisa Roath COO from 15 Feb 2026; Rick Gomez departs; Jill Sando retires; external search for a chief guest experience and marketing officer |
| 3 Mar 2026 | Ex 99 | Q4 and FY2025 earnings release | Q4 net sales $30.45bn ((1.5%)); comparable sales (2.5%); GAAP EPS $2.30, adjusted $2.44; FY2025 net sales $104.78bn ((1.7%)); GAAP EPS $8.13, adjusted $7.57 |
| 20 May 2026 | Ex 99 | Q1 FY2026 earnings release | Net sales $25.44bn (+6.7%); comparable sales +5.6%, traffic +4.4%; EPS $1.71 against GAAP $2.27 and adjusted $1.30 |
| 12 Jun 2026 | Ex 10.27 | Amended and Restated 2020 Long Term Incentive Plan | Approved by shareholders on 10 Jun 2026 with 95.0% of votes |
| 22 Jul 2026 | Ex 99 | Board appointment of Joe DePinto | Former CEO of 7‑Eleven (2005 to December 2025) joins from 1 Aug 2026; Audit & Risk and Infrastructure & Finance committees |
| 14 Aug 2026 | Ex 10.28 | Five year credit agreement | $4.0bn unsecured revolving facility to 14 Aug 2031, expandable by $1.0bn; two one year extension options; Replaces $1.0bn and $3.0bn facilities due October 2026 and October 2028 |
| 19 Aug 2026 | Ex 99 | Q2 FY2026 earnings release | Net sales $26.54bn (+5.3%); comparable sales +3.8%, stores +2.7%, digital +8.7%; EPS $4.11 incl. $1.65 from $994m of tariff refunds |
| 12 Nov 2026 | Ex 99 | Board appointment of Sally Grimes | Former CEO North America at Diageo and CEO of Clif Bar; joins from 1 Dec 2026 |
| 18 Nov 2026 | Ex 99 | Q3 FY2026 earnings release | Net sales $27.07bn (+7.1%); comparable sales +5.6%, traffic +5.0%; stores +4.6%, digital +9.8%; EPS $2.65 incl. $0.50 from $301m of tariff refunds; gross margin 30.5% |