Chart how a fund's largest positions changed last quarter
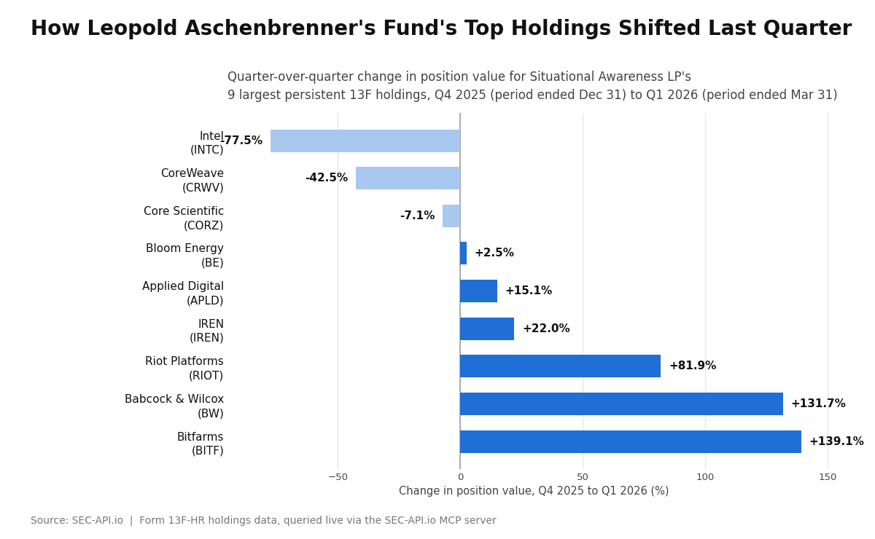
Compares two consecutive Form 13F filings from the same manager and charts the quarter-over-quarter change in position value, ranked, for the holdings present in both quarters.
Prompt
Copy and paste into your assistant
Pull Situational Awareness LP's two most recent Form 13F-HR filings from SEC-API.io. Compare the position values holding by holding, keep the largest positions that appear in both quarters, and chart the quarter-over-quarter percentage change in position value as a horizontal bar chart, sorted from largest decline to largest increase. Label each bar with the company name, its ticker and the percentage change. Use a zero-anchored axis so declines read as negative. Tell me which filings you used.
Output
When to use this prompt
- Tracking what a manager you follow bought and sold, without opening two filings side by side.
- Spotting conviction changes rather than absolute position size.
- Preparing a note on a fund ahead of the next filing date.
What you get back
- A ranked bar chart of percentage change in position value, with declines and increases on a shared zero-anchored axis.
- Only the holdings present in both quarters, so new positions and full exits do not distort the ranking.
- The two filings named in the source line.
Variations
- Change the manager. Any 13F filer works.
- Ask for new positions and full exits as a separate list, which this chart deliberately excludes.
- Compare four quarters instead of two to show a trend rather than a single move.
- Rank by dollar change instead of percentage change to weight the large positions.
Filings used
- Situational Awareness LP Form 13F-HR for Q4 2025, period ended December 31.
- Situational Awareness LP Form 13F-HR for Q1 2026, period ended March 31.
Related prompts
Compare CEO pay against shareholder return
Extracts the Pay versus Performance table required by Item 402(v) from each company's DEF 14A, then charts the year-over-year change in CEO compensation actually paid against the change in total shareholder return.
Turn a quarterly earnings release into a one-page graphic
Extracts headline figures, segment growth, the newest risk factor and forward guidance from a company's most recent earnings release, then renders a 1080 by 1080 graphic: one hero metric, a segment chart, six supporting tiles and two callouts. The prompt carries the full visual template, so the layout is identical across companies and quarters.