Adobe Inc. (ADBE), Financial Analysis
Insights derived from analysing SEC filings. Independent analysis, not a publication of the SEC.
Figures are read from the Forms 10-K for FY2021 to FY2025, the Forms 10-Q for Q1 FY2025 to Q3 FY2026, the Forms 8-K of December 2014 and of December 2021 to September 2026 with their quarterly earnings exhibits 99.1 and compensation exhibits 10.1 and 10.2, the proxy statement of February 2026, Schedules 13G, Forms 13F and Forms 3, 4, 5 and 144 on the record for central index key 796343, together with the comparable filings of seven peers. Accession numbers for every filing used appear in the Sources appendix. Market prices are closing prices of 9 October 2026.
Adobe (ADBE) closed at $242.27 on 9 October 2026, 13.5x trailing twelve month (TTM) diluted GAAP EPS of $17.91 and (30.8)% against its 31 December 2025 close. Q3 FY2026 revenue rose 12.9% year on year to $6.76bn, GAAP operating margin was 34.8% against 36.3% a year earlier, and diluted shares fell 6.7% to 395.5m.
Key findings
- Q3 FY2026 (quarter ended 28 August 2026) revenue was $6.76bn, up 12.9% year on year; GAAP operating margin was 34.8% against 36.3%, non GAAP operating margin 44.0% against 46.3%, and diluted GAAP EPS $4.62, up 10.5% on net income growth of 3.1%.
- Total Adobe ARR (annualized recurring revenue) was $27.50bn, up 11.2% including Semrush, and RPO (remaining performance obligations) was $22.16bn, up 8.4% year on year and $0.36bn below the FY2025 year end figure.
- Net debt was $0.72bn at 28 August 2026 against net cash of $0.39bn at FY2025 year end; nine month repurchases of $6.82bn equalled 91.4% of FCF (free cash flow) of $7.47bn, and $24.55bn of repurchase authority remained.
- At the 9 October 2026 close Adobe traded at 3.7x enterprise value to TTM revenue and 8.9x market cap to TTM FCF, against peer medians of 4.9x and 17.3x; TTM GAAP operating margin was 35.7% against a peer median of 19.9% and TTM revenue growth 12.0% against 17.8%.
- Board appointed Anil Chakravarthy CEO effective 1 December 2026; CFO Daniel Durn resigned effective 15 June 2026 with Steven Day as interim CFO, and David Wadhwani stepped down as President, Creativity & Productivity Business on 27 September 2026.
- Advisory vote on executive pay received 50.7% of votes cast on 15 April 2026 against 80.3% in 2025; Form 13F managers reported 332.8m shares at 30 June 2026, 83.7% of shares outstanding.
- Insiders sold 204,302 shares for $50.8m on open market in 12 months to 10 October 2026 and bought 10,000 shares for $1.9m; a family trust of Shantanu Narayen sold 200,000 shares for $49.6m.
- Three scenarios give implied FY2029 prices of $206 to $221 (worst case), $368 to $389 (base case) and $644 to $668 (best case); each is an arithmetic outcome of the assumptions in Table 9.3.
Table 0.1 Adobe at a glance
| Item | Value | Basis |
|---|---|---|
Share price | $242.27 | Market data, 9 October 2026 close |
Market cap | $94.3bn | Price times 389.2m shares outstanding at 18 September 2026 |
Enterprise value (EV) | $95.0bn | Market cap plus debt of $6.36bn less cash and short term investments of $5.64bn |
TTM revenue | $26.0bn | Four quarters to 28 August 2026, up 12.0% |
Q3 FY2026 revenue growth | 12.9% | Year on year |
TTM GAAP operating margin | 35.7% | Q3 FY2026: 34.8% |
TTM non GAAP operating margin | 45.4% | Sum of four quarterly figures; Q3 FY2026: 44.0% |
TTM FCF margin | 40.8% | FCF of $10.6bn; operating cash flow less purchases of property and equipment |
Net debt | $0.72bn | 28 August 2026 |
RPO | $22.16bn | 28 August 2026, up 8.4% year on year |
EV / sales | 3.7x | TTM revenue |
P / E | 13.5x | Price over TTM diluted GAAP EPS of $17.91 |
P / FCF | 8.9x | Market cap over TTM FCF |
Diluted shares | 395.5m | Q3 FY2026 weighted average, (6.7)% year on year |
Source: 10-Q Q3 FY2026, 10-K FY2025 and 8-K Exhibit 99.1 of 10 September 2026 via SEC-API.io; market data, 9 October 2026.
1 Revenue & Business Model
Adobe revenue rose 12.9% year on year to $6.76bn in Q3 FY2026, and subscriptions supplied 97.4% of it (10-Q). FY2025 revenue was $23.77bn, up 10.5% (10-K).
Adobe business model and revenue sources
Adobe sells cloud software subscriptions for content creation (Creative Cloud, Firefly), documents (Acrobat, Express) and enterprise marketing (Adobe Experience Platform, GenStudio). Subscription revenue is recognised ratably over the contract term. Largest customer share of FY2025 revenue was below 10%.
Adobe revenue by region
Americas supplied 58.8% of Q3 FY2026 revenue; EMEA grew 16.8% year on year, against 11.8% for Americas and 10.3% for APAC.

Table 1.1 Revenue by segment, type and region, FY2021 to FY2025 ($m)
| Line | FY2021 | FY2022 | FY2023 | FY2024 | FY2025 |
|---|---|---|---|---|---|
Total revenue | 15,785 | 17,606 | 19,409 | 21,505 | 23,769 |
Year on year change | n/a | 11.5% | 10.2% | 10.8% | 10.5% |
| By segment | |||||
Digital Media | 11,520 | 12,842 | 14,216 | 15,864 | 17,649 |
Digital Experience | 3,867 | 4,422 | 4,893 | 5,366 | 5,864 |
Publishing and Advertising | 398 | 342 | 300 | 275 | 256 |
| By type | |||||
Subscription | 14,573 | 16,388 | 18,284 | 20,521 | 22,904 |
Product | 555 | 532 | 460 | 386 | 325 |
Services and other | 657 | 686 | 665 | 598 | 540 |
| By region | |||||
Americas | 8,996 | 10,251 | 11,654 | 12,891 | 14,120 |
EMEA | 4,252 | 4,593 | 4,881 | 5,554 | 6,289 |
APAC | 2,537 | 2,762 | 2,874 | 3,060 | 3,360 |
| Subscription by customer group | |||||
Creative & Marketing Professionals | n/a | n/a | 13,425 | 14,749 | 16,303 |
Business Professionals & Consumers | n/a | n/a | 4,744 | 5,662 | 6,495 |
FY2021 was a 53 week year. Source: 10-K FY2025 for FY2023 to FY2025; 10-K FY2023 for FY2021 and FY2022.
Adobe revenue by segment and customer group
Adobe merged its three segments into one in Q1 FY2026. In FY2025 Digital Media (Creative Cloud and Document Cloud) supplied 74.3% of revenue and Digital Experience (enterprise marketing software) 24.7%. Subscription revenue from Business Professionals & Consumers (Acrobat and Express) grew 15.6% in Q3 FY2026 against 13.0% for Creative & Marketing Professionals.


Table 1.2 Revenue by type, region and customer group, FY2026 quarters ($m)
| Line | Q3 FY2025 | Q1 FY2026 | Q2 FY2026 | Q3 FY2026 | Q3 change year on year |
|---|---|---|---|---|---|
Total revenue | 5,988 | 6,398 | 6,618 | 6,760 | 12.9% |
Subscription | 5,791 | 6,198 | 6,416 | 6,582 | 13.7% |
Product | 68 | 90 | 89 | 67 | (1.5)% |
Services and other | 129 | 110 | 113 | 111 | (14.0)% |
Americas | 3,555 | 3,755 | 3,872 | 3,974 | 11.8% |
EMEA | 1,586 | 1,739 | 1,809 | 1,852 | 16.8% |
APAC | 847 | 904 | 937 | 934 | 10.3% |
Creative & Marketing Professionals subscription | 4,117 | 4,389 | 4,537 | 4,651 | 13.0% |
Business Professionals & Consumers subscription | 1,648 | 1,782 | 1,853 | 1,905 | 15.6% |
Other subscription | 26 | 27 | 26 | 26 | 0.0% |
Source: 10-Q filings for Q1 FY2026, Q2 FY2026 and Q3 FY2026.
Adobe ARR, RPO and metric definitions
Total Adobe ARR was $27.50bn at Q3 FY2026, up 11.2%, including Semrush, acquired on 28 April 2026 for $1.87bn. RPO, contracted revenue yet to be recognised, was $22.16bn, up 8.4% year on year.

Table 1.3 ARR and RPO, FY2021 to Q3 FY2026 ($bn)
| Line | FY2021 | FY2022 | FY2023 | FY2024 | FY2025 | Q1 FY2026 | Q2 FY2026 | Q3 FY2026 |
|---|---|---|---|---|---|---|---|---|
Digital Media ARR | 12.24 | 13.97 | 15.17 | 17.33 | 19.20 | n/a | n/a | n/a |
Total Adobe ARR | n/a | n/a | n/a | 22.61 | 25.20 | 26.06 | 27.10 | 27.50 |
Total Adobe ARR growth | n/a | n/a | n/a | n/a | 11.5% | 10.9% | 12.5% | 11.2% |
RPO | 13.99 | 15.19 | 17.22 | 19.96 | 22.52 | 22.22 | 22.27 | 22.16 |
Share of RPO due within 12 months | 72% | 72% | 69% | 67% | 65% | 67% | 67% | 67% |
ARR uses currency rates fixed at the start of each reporting year. Digital Media ARR is shown as first reported each year; FY2024 revalued at FY2025 rates was $17.22bn, the base for 11.5% growth in FY2025. FY2024 Total Adobe ARR is at FY2025 rates; FY2025 Total Adobe ARR is $25.66bn at FY2026 rates, the base for FY2026 growth. Source: 10-K filings for FY2021, FY2022, FY2023, FY2024 and FY2025, and the three FY2026 10-Q filings.
Table 1.4 Changes in segments and reported metrics, FY2025 to FY2026
| Effective | Change | Filing |
|---|---|---|
FY2025 | Subscription revenue split by two customer groups added. Creative revenue and Document Cloud revenue were last reported for FY2024. | 10-K FY2025, 0000796343-26-000003 |
FY2025 year end | Total Adobe ARR introduced: annual value of subscription contracts in both customer groups. Digital Media ARR reported for the last time at $19.20bn. | 10-K FY2025, 0000796343-26-000003 |
Q1 FY2026 | Digital Media, Digital Experience and Publishing and Advertising combined into one operating and reportable segment. Prior periods recast. Single segment table carries consolidated revenue, expenses and net income. | 10-Q Q1 FY2026, 0000796343-26-000056 |
Q1 FY2026 | Subscription revenue of the former Publishing and Advertising segment shown as other subscription revenue outside both customer groups. | 10-Q Q1 FY2026, 0000796343-26-000056 |
Q2 FY2026 | Semrush results consolidated from 28 April 2026 and included in Total Adobe ARR. Adobe states the effect on its financial statements was immaterial. | 10-Q Q3 FY2026, 0000796343-26-000156 |
2 Financial Analysis & Ratios
Q3 FY2026 GAAP operating margin fell to 34.8% from 36.3% and non GAAP operating margin to 44.0% from 46.3%, on revenue growth of 12.9% (10-Q Q3 FY2026, 8-K Exhibit 99.1 of 10 September 2026). Diluted EPS rose 10.5% to $4.62 on net income growth of 3.1%; diluted shares fell 6.7% to 395.5m and effective tax rate rose to 22.5% from 19.0%.
Adobe Q3 FY2026 results year on year
Table 2.1 What changed, Q3 FY2026 and nine months FY2026 against prior year
| Metric | Q3 FY2026 | Q3 FY2025 | Change | 9M FY2026 | 9M FY2025 | Change |
|---|---|---|---|---|---|---|
Revenue, $bn | 6.76 | 5.99 | 12.9% | 19.78 | 17.58 | 12.5% |
Gross profit, $bn | 6.00 | 5.35 | 12.2% | 17.63 | 15.67 | 12.5% |
Operating income, $bn | 2.35 | 2.17 | 8.3% | 7.01 | 6.45 | 8.8% |
Non GAAP operating income, $bn | 2.97 | 2.77 | 7.2% | 8.95 | 8.16 | 9.7% |
Net income, $bn | 1.83 | 1.77 | 3.1% | 5.43 | 5.27 | 2.9% |
Diluted EPS, $ | 4.62 | 4.18 | 10.5% | 13.47 | 12.26 | 9.9% |
Non GAAP diluted EPS, $ | 6.13 | 5.31 | 15.4% | n/a | n/a | n/a |
Gross margin | 88.7% | 89.3% | (0.6) pts | 89.2% | 89.2% | 0.0 pts |
Operating margin | 34.8% | 36.3% | (1.5) pts | 35.4% | 36.7% | (1.3) pts |
Non GAAP operating margin | 44.0% | 46.3% | (2.3) pts | 45.3% | 46.4% | (1.1) pts |
Net margin | 27.0% | 29.6% | (2.6) pts | 27.4% | 30.0% | (2.6) pts |
Effective tax rate | 22.5% | 19.0% | 3.5 pts | 22.6% | 18.5% | 4.1 pts |
Operating cash flow, $bn | 2.52 | 2.20 | 14.8% | 7.65 | 6.87 | 11.3% |
Free cash flow, $bn | 2.44 | 2.13 | 14.7% | 7.47 | 6.73 | 11.0% |
Free cash flow margin | 36.1% | 35.5% | 0.6 pts | 37.8% | 38.3% | (0.5) pts |
Stock based compensation (SBC), $bn | 0.54 | 0.50 | 8.5% | 1.58 | 1.45 | 8.9% |
SBC as % of revenue | 8.0% | 8.3% | (0.3) pts | 8.0% | 8.3% | (0.3) pts |
Share repurchases, $bn | 2.23 | 2.06 | 8.5% | 6.82 | 8.81 | (22.6)% |
Repurchases as % of FCF | 91.6% | 96.8% | (5.2) pts | 91.4% | 130.9% | (39.5) pts |
Diluted shares, m | 395 | 424 | (6.7)% | 403 | 430 | (6.3)% |
9M = nine months. Non GAAP nine month operating income is the sum of three quarterly figures. FCF is operating cash flow less purchases of property and equipment. Q3 change in diluted shares uses filed counts of 395.5m and 424.1m. Source: 10-Q Q3 FY2026, 8-K Exhibit 99.1 of 10 September 2026.

Net cash of $0.39bn at FY2025 year end became net debt of $0.72bn at Q3 FY2026, and current ratio was 0.77x with $7.09bn of deferred revenue in current liabilities.
Table 2.2 Quarterly financials, Q1 FY2025 to Q3 FY2026
| Line | Q1 FY2025 | Q2 FY2025 | Q3 FY2025 | Q4 FY2025 | Q1 FY2026 | Q2 FY2026 | Q3 FY2026 |
|---|---|---|---|---|---|---|---|
Revenue, $bn | 5.71 | 5.87 | 5.99 | 6.19 | 6.40 | 6.62 | 6.76 |
Revenue growth year on year | 10.3% | 10.6% | 10.7% | 10.5% | 12.0% | 12.7% | 12.9% |
Gross profit, $bn | 5.09 | 5.24 | 5.35 | 5.55 | 5.73 | 5.90 | 6.00 |
Operating income, $bn | 2.16 | 2.11 | 2.17 | 2.26 | 2.42 | 2.24 | 2.35 |
Operating margin | 37.9% | 35.9% | 36.3% | 36.5% | 37.8% | 33.8% | 34.8% |
Non GAAP operating margin | 47.5% | 45.5% | 46.3% | 45.6% | 47.4% | 44.5% | 44.0% |
Net income, $bn | 1.81 | 1.69 | 1.77 | 1.86 | 1.89 | 1.71 | 1.83 |
Diluted EPS, $ | 4.14 | 3.94 | 4.18 | 4.45 | 4.60 | 4.25 | 4.62 |
Non GAAP diluted EPS, $ | 5.08 | 5.06 | 5.31 | 5.50 | 6.06 | 5.96 | 6.13 |
Operating cash flow, $bn | 2.48 | 2.19 | 2.20 | 3.16 | 2.96 | 2.17 | 2.52 |
Capital expenditure, $m | 26 | 47 | 72 | 34 | 37 | 58 | 85 |
Free cash flow, $bn | 2.46 | 2.14 | 2.13 | 3.13 | 2.92 | 2.11 | 2.44 |
Stock based compensation, $bn | 0.48 | 0.48 | 0.50 | 0.49 | 0.51 | 0.53 | 0.54 |
Share repurchases, $bn | 3.25 | 3.50 | 2.06 | 2.47 | 2.48 | 2.11 | 2.23 |
Cash and short term investments, $bn | 7.44 | 5.71 | 5.94 | 6.60 | 6.89 | 5.63 | 5.64 |
Debt, $bn | 6.16 | 6.17 | 6.20 | 6.21 | 6.23 | 6.65 | 6.36 |
Stockholders equity, $bn | 13.10 | 11.45 | 11.77 | 11.62 | 11.43 | 11.52 | 11.76 |
Deferred revenue, $bn | 6.49 | 6.33 | 6.53 | 7.03 | 7.37 | 7.25 | 7.20 |
Diluted shares, m | 438 | 429 | 424 | 417 | 411 | 402 | 395 |
Q4 FY2025 flows are full year less nine months. Source: 10-Q filings for Q1 FY2025, Q2 FY2025, Q3 FY2025, Q1 FY2026, Q2 FY2026 and Q3 FY2026; 10-K FY2025; non GAAP figures from 8-K Exhibit 99.1 releases for each quarter.
Adobe income statement, balance sheet and cash flow, five years
FY2025 operating income rose 29.1% to $8.71bn. Adding back the $1.0bn Figma termination fee to FY2024, growth was 12.5% and FY2024 operating margin was 36.0% against 31.3% reported (10-K FY2025).
Table 2.3 Income statement, balance sheet and cash flow, FY2021 to FY2025
| Line | FY2021 | FY2022 | FY2023 | FY2024 | FY2025 |
|---|---|---|---|---|---|
Revenue, $bn | 15.79 | 17.61 | 19.41 | 21.51 | 23.77 |
Gross profit, $bn | 13.92 | 15.44 | 17.06 | 19.15 | 21.22 |
Operating income, $bn | 5.80 | 6.10 | 6.65 | 6.74 | 8.71 |
Net income, $bn | 4.82 | 4.76 | 5.43 | 5.56 | 7.13 |
Diluted EPS, $ | 10.02 | 10.10 | 11.82 | 12.36 | 16.70 |
Operating cash flow, $bn | 7.23 | 7.84 | 7.30 | 8.06 | 10.03 |
Capital expenditure, $m | 348 | 442 | 360 | 183 | 179 |
Free cash flow, $bn | 6.88 | 7.40 | 6.94 | 7.87 | 9.85 |
Stock based compensation, $bn | 1.07 | 1.44 | 1.72 | 1.83 | 1.94 |
Share repurchases, $bn | 3.95 | 6.55 | 4.40 | 9.50 | 11.28 |
Cash and short term investments, $bn | 5.80 | 6.10 | 7.84 | 7.89 | 6.60 |
Debt, $bn | 4.12 | 4.13 | 3.63 | 5.63 | 6.21 |
Stockholders equity, $bn | 14.80 | 14.05 | 16.52 | 14.11 | 11.62 |
Total assets, $bn | 27.24 | 27.17 | 29.78 | 30.23 | 29.50 |
Deferred revenue, $bn | 4.88 | 5.41 | 5.95 | 6.26 | 7.03 |
Diluted shares, m | 481 | 471 | 459 | 450 | 427 |
Source: 10-K filings for FY2021, FY2022, FY2023, FY2024 and FY2025.

Adobe GAAP and non GAAP earnings, one off items
Non GAAP figures exclude SBC and the other items in Figure 2.3; Q3 FY2026 diluted EPS was $4.62 on GAAP and $6.13 on non GAAP figures.
Table 2.4 GAAP and non GAAP results, FY2021 to FY2025 and Q3 FY2026
| Measure | FY2021 | FY2022 | FY2023 | FY2024 | FY2025 | Q3 FY2026 |
|---|---|---|---|---|---|---|
GAAP operating income, $bn | 5.80 | 6.10 | 6.65 | 6.74 | 8.71 | 2.35 |
Non GAAP operating income, $bn | 7.26 | 7.95 | 8.92 | 10.02 | 10.99 | 2.97 |
GAAP operating margin | 36.8% | 34.6% | 34.3% | 31.3% | 36.6% | 34.8% |
Non GAAP operating margin | 46.0% | 45.1% | 45.9% | 46.6% | 46.2% | 44.0% |
GAAP net income, $bn | 4.82 | 4.76 | 5.43 | 5.56 | 7.13 | 1.83 |
Non GAAP net income, $bn | 6.00 | 6.46 | 7.38 | 8.28 | 8.94 | 2.42 |
GAAP diluted EPS, $ | 10.02 | 10.10 | 11.82 | 12.36 | 16.70 | 4.62 |
Non GAAP diluted EPS, $ | 12.48 | 13.71 | 16.07 | 18.42 | 20.94 | 6.13 |
Source: 8-K Exhibit 99.1 for FY2022, FY2024, FY2025 and Q3 FY2026.

Table 2.5 One off items and events affecting comparability
| Period | Item | Amount | Filing |
|---|---|---|---|
FY2024 | Figma acquisition termination fee, an operating expense booked in Q1 | $1.0bn | 10-K FY2025, 8-K Exhibit 99.1, 12 March 2025 |
FY2024 | Tax rate reconciliation line for the termination fee | $210m | 10-K FY2025 |
Q4 FY2024 | Lease related asset impairments and other charges | $100m | 8-K Exhibit 99.1, 11 December 2024 |
FY2024 | Loss contingency reversal on an IP litigation matter | ($44m) | 8-K Exhibit 99.1, 11 December 2024 |
Q1 FY2026 | Loss contingency | $62m | 8-K Exhibit 99.1, 12 March 2026 |
Q2 FY2026 | Loss contingency | $30m | 8-K Exhibit 99.1, 11 June 2026 |
Q2 FY2026 | Impairment of goodwill | $70m | 8-K Exhibit 99.1, 10 September 2026 |
FY2021 | Fiscal year of 53 weeks; other years shown have 52 | 1 week | 8-K Exhibit 99.1, 15 December 2022 |
Adobe ratio analysis: margins, returns, leverage, buybacks
Return on equity (ROE) rose to 55.4% in FY2025 from 36.3% as average equity fell 16.0%. From FY2021 to FY2025 repurchases totalled $35.68bn, 91.6% of FCF of $38.95bn, and SBC totalled $8.00bn. After deducting SBC, FY2025 FCF margin was 33.3% against 41.4% before it.
Table 2.6 Ratio analysis, FY2021 to FY2025
| Group | Ratio | FY2021 | FY2022 | FY2023 | FY2024 | FY2025 |
|---|---|---|---|---|---|---|
Growth | Operating income growth | 36.9% | 5.1% | 9.1% | 1.4% | 29.1% |
Growth | Diluted EPS growth | (7.5)% | 0.8% | 17.0% | 4.6% | 35.1% |
Growth | Free cash flow growth | 29.7% | 7.5% | (6.1)% | 13.4% | 25.1% |
Margin | Gross margin | 88.2% | 87.7% | 87.9% | 89.0% | 89.3% |
Margin | Net margin | 30.5% | 27.0% | 28.0% | 25.9% | 30.0% |
Margin | Free cash flow margin | 43.6% | 42.0% | 35.8% | 36.6% | 41.4% |
Margin | SBC as % of revenue | 6.8% | 8.2% | 8.9% | 8.5% | 8.2% |
Margin | Free cash flow less SBC, % of revenue | 36.8% | 33.8% | 26.9% | 28.1% | 33.3% |
Return | ROE | 34.4% | 33.0% | 35.5% | 36.3% | 55.4% |
Return | Return on invested capital (ROIC) | 27.0% | 26.0% | 27.7% | 27.1% | 37.8% |
Return | Return on assets (ROA) | 18.7% | 17.5% | 19.1% | 18.5% | 23.9% |
Liquidity | Current ratio | 1.25x | 1.11x | 1.34x | 1.07x | 1.00x |
Leverage | Debt to equity | 0.28x | 0.29x | 0.22x | 0.40x | 0.53x |
Leverage | Net debt, $bn | (1.68) | (1.97) | (4.21) | (2.26) | (0.39) |
Leverage | Operating income to interest expense | 51.3x | 54.4x | 58.8x | 39.9x | 33.1x |
Efficiency | Days sales outstanding (DSO), days | 43 | 43 | 42 | 35 | 36 |
Efficiency | Asset turnover | 0.61x | 0.65x | 0.68x | 0.72x | 0.80x |
Per share | Free cash flow per diluted share, $ | 14.31 | 15.70 | 15.12 | 17.50 | 23.07 |
Capital return | Repurchases as % of FCF | 57.4% | 88.6% | 63.4% | 120.7% | 114.5% |
Capital return | Change in diluted shares | (0.9)% | (2.1)% | (2.5)% | (2.0)% | (5.0)% |
ROE, ROA and asset turnover use average balances. ROIC is operating income after the effective tax rate over average debt plus equity. DSO uses year end receivables and 365 days. Net debt in parentheses is net cash. Source: 10-K filings listed under Table 2.3.

3 MD&A & Management Commentary
Q3 FY2026 revenue of $6.76bn exceeded the target midpoint by 1.0%, against 1.3% to 2.5% in the five prior quarters, and management raised FY2026 targets to revenue of $26.576bn to $26.626bn and non GAAP EPS of $24.45 to $24.50 (8-K, 10 September 2026).
Adobe guidance versus actual results

Table 3.1 Quarterly targets and reported results, Q2 FY2025 to Q4 FY2026
| Quarter | Targets issued in | Revenue target | Revenue reported | Versus midpoint | Non GAAP EPS target | Non GAAP EPS reported | Versus midpoint | Non GAAP operating margin assumed | Non GAAP operating margin reported |
|---|---|---|---|---|---|---|---|---|---|
Q2 FY2025 | 8-K 0000796343-25-000052, 12 March 2025 | $5.770bn to $5.820bn | $5.873bn | 1.3% | $4.95 to $5.00 | $5.06 | 1.7% | 45.0% | 45.5% |
Q3 FY2025 | 8-K 0000796343-25-000064, 12 June 2025 | $5.875bn to $5.925bn | $5.988bn | 1.5% | $5.15 to $5.20 | $5.31 | 2.6% | 45.5% | 46.3% |
Q4 FY2025 | 8-K 0000796343-25-000102, 11 September 2025 | $6.075bn to $6.125bn | $6.194bn | 1.5% | $5.35 to $5.40 | $5.50 | 2.3% | 45.5% | 45.6% |
Q1 FY2026 | 8-K 0000796343-25-000135, 10 December 2025 | $6.250bn to $6.300bn | $6.398bn | 2.0% | $5.85 to $5.90 | $6.06 | 3.1% | 47.0% | 47.4% |
Q2 FY2026 | 8-K 0000796343-26-000048, 12 March 2026 | $6.430bn to $6.480bn | $6.618bn | 2.5% | $5.80 to $5.85 | $5.96 | 2.3% | 44.5% | 44.5% |
Q3 FY2026 | 8-K 0000796343-26-000109, 11 June 2026 | $6.670bn to $6.720bn | $6.760bn | 1.0% | $6.05 to $6.10 | $6.13 | 0.9% | 44.0% | 44.0% |
Q4 FY2026 | 8-K 0000796343-26-000147, 10 September 2026 | $6.800bn to $6.850bn | n/a | n/a | $6.30 to $6.35 | n/a | n/a | 44.0% | n/a |
Q2 FY2026 targets excluded Semrush; reported revenue included about $40m from it.

Adobe FY2026 targets and ARR outlook
Table 3.2 FY2026 targets as issued and restated
| Issued | Total revenue | Business Professionals & Consumers subscription revenue | Creative & Marketing Professionals subscription revenue | Total Adobe ending ARR growth | GAAP EPS | Non GAAP EPS | GAAP tax rate | Diluted shares |
|---|---|---|---|---|---|---|---|---|
10 December 2025, reaffirmed 12 March 2026 | $25.900bn to $26.100bn | $7.350bn to $7.400bn | $17.750bn to $17.900bn | 10.2% | $17.90 to $18.10 | $23.30 to $23.50 | 20.5% | 403m |
| $26.500bn to $26.600bn | $7.440bn to $7.480bn | $18.210bn to $18.270bn | 10.2% | $17.90 to $18.00 | $24.35 to $24.45 | 22.5% | 399m | |
| $26.576bn to $26.626bn | $7.470bn to $7.490bn | $18.242bn to $18.272bn | 10.2% | $18.12 to $18.17 | $24.45 to $24.50 | 22.5% | 400m |
Targets exclude Semrush until June 2026 and include it from then. Ending FY2025 ARR was revalued from $25.20bn to $25.66bn in December 2025, primarily for exchange rates.

ARR growth target has been 10.2% since December 2025 and includes Semrush ($0.48bn) since June 2026. Derived from filed balances, the target equals year end ARR of $28.28bn and Q4 net new ARR of $0.78bn against $0.40bn in Q3. On the same derivation growth is 8.3% if Semrush ARR is held at the $0.48bn disclosed for Q2 FY2026 (assumption). On the earnings call of 11 June 2026 management attributed the unchanged target to faster freemium user growth and deferred Creative Cloud price changes.
Trends and risks Adobe management flags
Cost of subscription revenue rose 24% in Q3 FY2026 against revenue growth of 12.9%. Repurchase payments were $6.82bn in nine months of FY2026 against $11.28bn in FY2025, and shares outstanding fell from 413m to 391m over the nine months.
Table 3.3 Trends and risks named by management in MD&A and Item 1A
| Theme | What management states |
|---|---|
| Generative AI products | Firefly models and a partner model ecosystem power Creative Cloud; Acrobat AI Assistant gives conversational answers within and across PDFs; Acrobat Studio, released August 2025, unites Acrobat, Express and AI agents. Subscription revenue growth of 16% in Q3 FY2026 for Business Professionals & Consumers is attributed to Acrobat. |
| AI ARR metrics | AI influenced ARR passed $5bn in Q3 FY2025; AI first ARR exceeded $500m in Q2 FY2026 and grew more than 150% year on year in Q3 FY2026 (8-K, 11 June 2026; 8-K, 10 September 2026). AI influenced ARR covers offerings and tiers "enhanced by AI features" and its scope is updated periodically. |
| AI cost of delivery | Cost of subscription revenue includes AI inferencing costs and R&D includes AI training costs. Q3 FY2026 cost of subscription revenue was $633m, up 24%, of which 22 points from hosting and data center costs; R&D was $1.29bn, up 18%. Nine month G&A rose 30%, of which 8 points loss contingency and 6 points a $70m goodwill impairment. |
| Competition | Management expects competition to continue to intensify, names new entrants and AI or cloud native companies as competitors, and expects more competition as AI changes how solutions "are accessed and used" (Item 1A). |
| Pricing and renewals | Revenue is recognised over terms of 1 to 36 months; Item 1A states that lower sales or higher attrition in a period may reach reported results in future periods. |
| Tax rate | Q3 FY2026 effective tax rate was 22.5% against 19.0% (MD&A rounds to 22% and 19%), attributed to a lower benefit from non US operations and tax expense on SBC. Management anticipates lower cash taxes from FY2026 under the 2025 U.S. Tax Act. |
| Liquidity and debt | Working capital was ($2.73bn) after $1.35bn of senior notes due February and April 2027 moved to current; management intends to refinance. Commercial paper outstanding was $250m at face value ($248m carrying value). |
| Macro and currency | A weaker U.S. dollar added about $40m to Q3 FY2026 revenue and $280m over nine months. Long term effect of inflation, rates and trade regulation is described as uncertain. |
Source: 10-Q Q3 FY2026, MD&A and Item 1A, unless linked in the row.

Adobe earnings call commentary
Table 3.4 Earnings call statements, last three calls
| Earnings call | Speaker | Statement in indirect speech |
|---|---|---|
Q3 FY2026, 10 September 2026 | Shantanu Narayen, CEO | AI first ending ARR exceeds $650m, up more than 150% year on year; more than 1bn monthly active users across all businesses; creative freemium monthly active users passed 100m, up more than 70%. |
Q3 FY2026, 10 September 2026 | Anil Chakravarthy, CEO designate | Firefly ending ARR across Firefly app and credit packs grew 40% quarter on quarter; Acrobat AI Assistant monthly active users doubled quarter on quarter; Topaz Labs has over 1m users. |
Q3 FY2026, 10 September 2026 | Steve Day, interim CFO | Q4 is the seasonally largest quarter with a large enterprise share; Q4 net new ARR is expected above Q3; 10.2% ARR growth target stands; a slight currency headwind enters Q4. |
Q3 FY2026, 10 September 2026 | Shantanu Narayen, CEO | Asked when deferred Creative Cloud pricing actions resume, he stated that priority goes to new user adoption. |
Q2 FY2026, 11 June 2026 | Steve Day, interim CFO | 10.2% ARR target reflects the Semrush book of business, faster freemium user growth and deferral of planned Creative Cloud changes. About $27bn of repurchase authority remained. |
Q2 FY2026, 11 June 2026 | Shantanu Narayen, CEO | About half of the ARR effect comes from deferring pricing actions, with freemium payoff expected over 2027. Aim was a new CEO in place for FY2027 planning. |
Q2 FY2026, 11 June 2026 | David Wadhwani, then President | Firefly ending ARR across app, credit packs and enterprise approached $300m, up about 50% quarter on quarter. |
Q1 FY2026, 12 March 2026 | Dan Durn, then CFO | Firefly ending ARR exceeded $250m; Acrobat AI Assistant ARR grew about 3x; $3.89bn remained of the March 2024 repurchase authority. |
Q1 FY2026, 12 March 2026 | Shantanu Narayen, CEO | More than 850m monthly active users of Acrobat, Creative Cloud, Express and Firefly. |
Source: public earnings call transcripts, outside SEC filings; Q2 FY2026 statements come from a single transcript. On the earnings call of 11 June 2026 an analyst estimated the organic ARR adjustment at about $0.5bn; management gave no figure.
4 Sector & Competitor Analysis
Adobe trades at 3.7x enterprise value to TTM revenue and 8.9x market cap to TTM FCF at the 9 October 2026 close, against peer medians of 4.9x and 17.3x. TTM GAAP operating margin is 35.7% against a peer median of 19.9%, and TTM revenue growth is 12.0% against 17.8%.
Creative, document and digital experience software market size
Table 4.1 Sector size and growth estimates from named public research (CAGR = compound annual growth rate)
| Market | Base size | Forecast | Growth | Source |
|---|---|---|---|---|
Worldwide software spending | $1.25tn (2025) | $1.43tn (2026) | 14.7% in 2026 | Gartner, 3 February 2026 |
Generative AI model spending | n/a | n/a | 80.8% in 2026 | Gartner, 3 February 2026, same release |
Generative AI in content creation | $14.8bn (2024) | $80.1bn (2030) | 32.5% CAGR 2025 to 2030 | Grand View Research |
Digital experience platforms | $15.9bn (2025) | $62.7bn (2033) | 18.3% CAGR 2026 to 2033 | Grand View Research |
Digital signature | $9.9bn (2024) | $70.2bn (2030) | 38.5% CAGR 2024 to 2030 | MarketsandMarkets, 9 January 2025 |
Generative AI image and video tools, pricing and seat trends
Table 4.2 AI usage pricing and seat disclosures in filings
| Company | Disclosure | Figure |
|---|---|---|
Adobe | Creative Cloud and Firefly subscriptions carry a monthly allowance of generative credits by plan | Allowance size is set per plan |
Figma | AI credits added to all seats in 2025; limits enforced from March 2026 with monthly add ons or pay as you go billing | Net dollar retention 136% at 30 June 2026 against 129% a year earlier |
Figma | Paid customers with more than $100,000 of ARR at 30 June 2026 | 1,635 against 1,119 a year earlier |
Figma | Gross margin, Q2 FY2026 against Q2 FY2025; cost of revenue includes AI inference | 83.7% against 88.8% |
Source: Adobe 10-K FY2025; Figma 10-Q for the quarter ended 30 June 2026.
Table 4.3 Private competitors, publicly reported figures
| Company | Revenue measure | Scale | Latest reported valuation | Source |
|---|---|---|---|---|
Canva | ARR of $4bn at end of 2025, stated by its chief operating officer | More than 265m monthly active users, more than 31m paying users | $42bn, share sale of August 2025 | TechCrunch, 18 February 2026 |
OpenAI | Annualized revenue run rate approaching $70bn, press report | n/a | $852bn, funding round of March 2026 | Pulse 2.0, 30 September 2026 |
Figures in Table 4.3 are press reports and are unaudited.
Adobe versus peers on growth, margins and cash flow
Peer set: seven US listed companies selling design, document, electronic signature, productivity or marketing software, the competitor categories named in Adobe's FY2025 10-K.
Table 4.4 Operating comparison, trailing twelve months, GAAP
| Company | Period | Revenue | Growth | Gross margin | Operating margin | FCF margin | SBC % of revenue | RPO | RPO growth | Rule of 40 | Latest filing |
|---|---|---|---|---|---|---|---|---|---|---|---|
Adobe (ADBE) | TTM to 28 Aug 2026 (Q3 FY2026) | $26.0bn | 12.0% | 89.3% | 35.7% | 40.8% | 8.0% | $22.2bn | 8.4% | 52.8 | 10-Q 0000796343-26-000156 |
Figma (FIG) | TTM to 30 Jun 2026 (Q2 FY2026) | $1.3bn | 43.4% | 79.1% | (123.8)% | 17.9% | 130.6% | $687m | 53.1% | 61.3 | 10-Q 0001628280-26-053348 |
Salesforce (CRM) | TTM to 31 Jul 2026 (Q2 FY2027) | $43.9bn | 11.2% | 77.3% | 19.9% | 34.5% | 8.3% | $66.3bn | 10.7% | 45.7 | 10-Q 0001108524-26-000190 |
Microsoft (MSFT) | FY2026 to 30 Jun 2026 | $331.8bn | 17.8% | 67.9% | 46.8% | 20.2% | 3.7% | $684.0bn | 82.4% | 38.0 | 10-K 0001193125-26-323660 |
Autodesk (ADSK) | TTM to 31 Jul 2026 (Q2 FY2027) | $7.8bn | 17.9% | 91.2% | 26.2% | 36.4% | 9.1% | $7.4bn | 1.8% | 54.4 | 10-Q 0000769397-26-000061 |
Intuit (INTU) | FY2026 to 31 Jul 2026 | $21.4bn | 13.9% | 80.2% | 27.4% | 40.2% | 9.6% | n/a | n/a | 54.1 | 10-K 0000896878-26-000037 |
Docusign (DOCU) | TTM to 31 Jul 2026 (Q2 FY2027) | $3.4bn | 8.6% | 79.5% | 12.0% | 35.7% | 18.0% | $2.3bn | 0.0% | 44.2 | 10-Q 0001261333-26-000099 |
HubSpot (HUBS) | TTM to 30 Jun 2026 (Q2 FY2026) | $3.4bn | 21.1% | 83.3% | 3.8% | 19.1% | 14.9% | $1.7bn | 30.8% | 40.2 | 10-Q 0001193125-26-335232 |
Peer median, excluding Adobe | n/a | n/a | 17.8% | 79.5% | 19.9% | 34.5% | 9.6% | n/a | 20.7% | 45.7 | n/a |
FCF = operating cash flow less purchases of property and equipment; capitalized software is also deducted for peers that report it (Intuit, HubSpot). RPO is compared with the same date a year earlier; Docusign and HubSpot report RPO for contracts longer than one year, rounded to $0.1bn, and RPO is n/a in Intuit's FY2026 10-K. Rule of 40 = growth plus FCF margin. Figma's period includes Q3 2025, its IPO quarter.


Adobe valuation multiples versus peers
Table 4.5 Valuation at 9 October 2026 close
| Company | Share price | Market cap | Net debt (net cash) | Enterprise value | EV / sales | Market cap / TTM net income | P / FCF |
|---|---|---|---|---|---|---|---|
Adobe (ADBE) | $242.27 | $94.3bn | $724m | $95.0bn | 3.7x | 12.9x | 8.9x |
Figma (FIG) | $22.50 | $12.0bn | ($1.7bn) | $10.3bn | 8.1x | n/m | 52.3x |
Salesforce (CRM) | $229.13 | $188.6bn | $27.9bn | $216.5bn | 4.9x | 19.5x | 12.4x |
Microsoft (MSFT) | $535.07 | $3.97tn | ($36.5bn) | $3.94tn | 11.9x | 29.7x | 59.3x |
Autodesk (ADSK) | $235.35 | $49.2bn | ($879m) | $48.3bn | 6.2x | 30.0x | 17.3x |
Intuit (INTU) | $302.75 | $80.9bn | $221m | $81.1bn | 3.8x | 17.7x | 9.4x |
Docusign (DOCU) | $71.08 | $13.3bn | ($973m) | $12.3bn | 3.7x | 40.3x | 11.1x |
HubSpot (HUBS) | $228.30 | $11.4bn | ($1.4bn) | $10.0bn | 2.9x | 77.5x | 17.3x |
Peer median, excluding Adobe | n/a | n/a | n/a | n/a | 4.9x | 29.8x | 17.3x |
Market data, 9 October 2026. Enterprise value = market cap on cover page share counts plus borrowings less cash and marketable securities. Market cap / TTM net income uses GAAP net income; n/m marks a net loss. On price over TTM diluted GAAP EPS of $17.91 Adobe is 13.5x, the basis used elsewhere in this report. Salesforce net income includes $3.2bn of upward adjustments on privately held equity securities in H1 FY2027.

5 Material Events & Contracts
Six of Adobe's eight current reports (8-K) filed between 10 October 2025 and 10 October 2026 report officer or pay changes under Item 5.02; the latest appoints Anil Chakravarthy as CEO effective 1 December 2026 (8-K, 8 September 2026). Four reports carry quarterly results and one adds a $25bn repurchase authority, of which $24.55bn remained at 28 August 2026.

Adobe 8-K filings last twelve months
Table 5.1 Adobe 8-K filings, 10 October 2025 to 10 October 2026, newest first
| Filed | Items | Event | Accession number |
|---|---|---|---|
10 Sep 2026 | 2.02, 9.01 | Q3 FY2026 results (Table 2.1); FY2026 revenue target raised to $26.576bn to $26.626bn (Table 3.2). | 0000796343-26-000147 |
8 Sep 2026 | 5.02, 7.01, 9.01 | Board on 2 September 2026 appointed Anil Chakravarthy President, CEO and director effective 1 December 2026. Shantanu Narayen retires as CEO on that date and becomes Executive Chair. David Wadhwani gave notice on 2 September 2026, stepped down as President, Creativity & Productivity Business on 27 September 2026 and stays as senior advisor. Filing states that incoming CEO pay terms follow by amendment. | 0000796343-26-000144 |
17 Jul 2026 | 5.02 | Retention letter for Chief Legal Officer Louise Pentland (terms in Table 5.3). | 0000796343-26-000120 |
11 Jun 2026 | 2.02, 5.02, 9.01 | Q2 FY2026 results; GAAP EPS of $4.25 after a $0.17 per share goodwill impairment. CFO Daniel Durn gave notice on 8 June 2026, effective 15 June 2026; Steven Day, age 58 and at Adobe since 2006, was appointed interim CFO on 11 June 2026. | 0000796343-26-000109 |
21 Apr 2026 | 5.02, 5.07, 8.01, 9.01 | Board approved a repurchase authority of up to $25bn through 30 April 2030. Annual meeting of 15 April 2026 (Tables 6.4 and 6.5); stockholders added 12m shares to 2019 Equity Incentive Plan. | 0000796343-26-000101 |
12 Mar 2026 | 2.02, 5.02, 7.01, 9.01 | Q1 FY2026 results. Shantanu Narayen notified Adobe on 9 March 2026 of his decision to transition from CEO role; a special committee chaired by Frank Calderoni directs a search covering internal and external candidates. | 0000796343-26-000048 |
27 Jan 2026 | 5.02, 9.01 | 2026 Performance Share Program, FY2026 cash bonus plan and cash severance policy (terms in Table 5.3). | 0000796343-26-000019 |
10 Dec 2025 | 2.02, 9.01 | Q4 FY2025 and FY2025 results; initial FY2026 revenue target of $25.90bn to $26.10bn; reporting moves to customer group subscription revenue and Total Adobe ARR from FY2026. | 0000796343-25-000135 |
8-K/A filings with incoming CEO pay terms on file at 10 October 2026: 0.
Adobe acquisitions, debt and legal events in 10-K and 10-Q
Table 5.2 Events disclosed in periodic reports, newest first
| Event date or filing date | Where disclosed | Event summary | Accession number |
|---|---|---|---|
22 Sep 2026 | 10-Q, Note 14 | $1.35bn of senior notes due February and April 2027 moved to current liabilities; $250m of commercial paper outstanding at a 3.77% weighted average rate. | 0000796343-26-000156 |
22 Sep 2026 | 10-Q, Part II Item 2 | March 2024 repurchase authority of $25bn fully used during Q3 FY2026; $24.55bn remained under the April 2026 authority at 28 August 2026. | 0000796343-26-000156 |
24 Jun 2026 | 10-Q, Note 13 | Definitive agreement to acquire Topaz Labs Inc., a privately held AI video and image enhancement company, for about $340m, primarily cash; closing expected in Q4 FY2026. | 0000796343-26-000156 |
28 Apr 2026 | 10-Q, Note 3 | Semrush Holdings acquisition completed for $1.87bn; purchase price allocation: $1.25bn goodwill, $582m identifiable intangibles, $262m cash acquired. | 0000796343-26-000156 |
12 Mar 2026 | 10-Q, Note 12 | Agreement reached to settle the Department of Justice civil action on subscription cancellation practices; stipulation of dismissal filed 13 March 2026. | 0000796343-26-000056 |
18 Nov 2025 | 10-K, Note 16 | Definitive agreement to acquire Semrush Holdings for about $1.9bn in cash, at $12.00 per share under the merger agreement Semrush filed. | 0000796343-26-000003 |
Adobe material contracts
Financing contracts total $6.15bn of senior notes, an undrawn $1.5bn revolving facility maturing 30 June 2027 and a $3bn commercial paper program. Semrush filed the merger agreement as Exhibit 2.1 to its own 8-K. Non cancellable purchase obligations, primarily hosting and data center services, were $6.82bn at 28 November 2025, of which 58% falls due in FY2026 and FY2027.
Table 5.3 Material contracts: counterparty, key terms and source
| Contract and date | Counterparty | Key terms | Source filing |
|---|---|---|---|
Revolving credit agreement, 30 June 2022 | Bank of America, N.A. as administrative agent, and lenders | Senior unsecured revolving facility of $1.5bn, with a $500m lender option to a $2bn maximum. Margin over SOFR of 0.460% to 0.900% and facility fee of 0.040% to 0.100% a year, set by debt rating. Matures 30 June 2027 unless extended. Undrawn at 28 August 2026. Events of default include a change of control. | Exhibit 10.1 to 8-K 0001193125-22-186450; 10-Q |
Commercial paper program, 8 September 2023 | Commercial paper dealers | Short term unsecured notes of up to $3bn outstanding at any time, each maturing within 397 days of issue. $250m outstanding at face value on 28 August 2026 at a 3.77% weighted average rate. | 8-K 0000796343-23-000198; 10-Q |
Senior notes issued January 2025 | Computershare Trust Company, N.A. as trustee | $800m of 4.750% notes due 2028, $700m of 4.950% notes due 2030 and $500m of 5.300% notes due 2035; net proceeds about $1.99bn. Redeemable at a make whole price of Treasury Rate plus 5 to 10 basis points, and at par from 17 December 2027, 17 December 2029 and 17 October 2034. | 8-K 0001193125-25-008409 |
Senior notes issued February 2020 and April 2024 | Trustee under the 2010 form of indenture | $850m of 2.15% notes due 2027 and $1.3bn of 2.30% notes due 2030 (2020); $500m of 4.85% notes due 2027, $750m of 4.80% notes due 2029 and $750m of 4.95% notes due 2034 (2024). 2020 notes carry a repurchase offer at 101% of principal on a change of control triggering event. | 10-K Note 17; 8-K 0001193125-24-087244 |
Agreement and Plan of Merger, 18 November 2025 | Semrush Holdings, Inc. and Fenway Merger Sub, Inc. | Each Semrush Class A and Class B share converted into $12.00 in cash; unvested employee awards converted into Adobe restricted stock units (RSUs). Holders of about 75% of Semrush votes signed voting agreements. Semrush termination fee of $63m. Closed 28 April 2026 for $1.87bn. | Exhibit 2.1 to Semrush 8-K 0000950103-25-014983; 10-Q Note 3 |
Topaz Labs definitive agreement, 24 June 2026 | Topaz Labs Inc. | Purchase of a privately held AI video and image enhancement company for about $340m, primarily cash, subject to regulatory approvals; closing expected in Q4 FY2026. | 10-Q Note 13 |
Repurchase authorities and repurchase agreements | Board of Directors; financial institutions | March 2024 authority of $25bn was fully used in Q3 FY2026; April 2026 authority of $25bn had $24.55bn left at 28 August 2026. FY2025: $6.25bn under accelerated share repurchase agreements for 16.8m shares and $5.03bn on open market for 14.0m shares. Nine months of FY2026: 26.1m shares for $6.82bn, all open market. | 8-K; 10-K Note 14; 10-Q Note 11 |
Retention Agreement, effective 5 December 2014 | Shantanu Narayen | On termination without cause or resignation for good reason within two years of a change in control: salary plus target bonus times a multiple of 2 plus one twelfth per completed year of service (maximum 12 years), plus a pro rata target bonus. | Exhibit 10.2 to 8-K 0000796343-14-000112 |
2023 Executive Severance Plan in the Event of a Change of Control, 13 December 2023 | Senior vice presidents and above (Group I); vice presidents (Group II) | Salary plus target bonus times 2.0x (Group I) or 1.5x (Group II) and full vesting of equity awards on a qualifying termination from three months before a change of control to its first anniversary. | Exhibit 10.1 to 8-K 0000796343-23-000252 |
Form of Retention Letter, approved 14 July 2026 | Louise Pentland, Chief Legal Officer | Retention RSUs plus, on a qualifying termination, 12 months of base salary, 100% of target bonus, health premiums for up to 12 months and 50% of retention RSUs if before 15 July 2027. Protections end 12 months after the permanent CEO starts, set for 1 December 2026. | Exhibit 10.1 to 10-Q; 8-K |
Executive Officer Cash Severance Policy, 26 January 2026 | Section 16 executive officers | Adobe seeks stockholder ratification before any new or amended arrangement gives an executive officer cash severance above 2.99 times base salary plus target bonus. | Exhibit 10.6 to 8-K |
2026 Performance Share Program and FY2026 Executive Annual Incentive Plan, 26 January 2026 | Executive officers; targets of 106,672 shares (Narayen), 42,200 each (Chakravarthy, Wadhwani) and 27,631 (Durn) | Performance shares earned 50% on total stockholder return relative to NASDAQ 100 companies over calendar 2026 to 2028 and 50% on Net New Sales, measured as growth in ending ARR in each of FY2026 to FY2028; payout 0% to 200% of target. Cash bonus funds once revenue and EPS each reach 95% of target and pays up to 155% of target. | Exhibit 10.1 and Exhibit 10.5 to 8-K |
2019 Equity Incentive Plan, as amended 15 April 2026 | Employees, executives and directors | Governs all RSU and performance share grants. Stockholders added 12m shares, for a lifetime maximum of 88m shares. Each share issued under a full value award counts as 1.77 shares against the reserve. | Exhibit 10.1 to 8-K |


6 Ownership, Voting Power & Annual Meeting
Advisory vote on executive pay received 50.7% of votes cast at the 15 April 2026 annual meeting, against 80.3% a year earlier (8-K, 21 April 2026; 8-K, 24 April 2025). Adobe has one class of common stock with one vote per share, so economic ownership equals voting power. Latest Schedule 13G filings show three holders above 5%: BlackRock 9.4%, Vanguard Capital Management 7.61% and State Street 5.2%. Directors and executive officers hold 0.20%.
Adobe major shareholders and voting power
Table 6.1 Beneficial ownership at 17 February 2026, 407.6m shares outstanding
| Holder | Shares | % of class and of votes | Voting power reported by holder |
|---|---|---|---|
The Vanguard Group | 41,472,249 | 10.17% | Shared over 4,225,772 shares |
BlackRock, Inc. | 37,969,080 | 9.31% | Sole over 34,333,454 shares |
Shantanu Narayen, Chair and CEO | 438,975 | 0.11% | Sole, 430,352 shares held in family trust |
Four other named executive officers | 153,104 | 0.04% | Sole |
Ten non employee directors | 150,476 | 0.04% | Sole |
All directors and executive officers, 18 persons | 803,767 | 0.20% | Sole |
Source: DEF 14A, 27 February 2026. Percentages for individuals and groups are computed on 407,636,918 shares; the proxy shows them as below 1%. BlackRock row in the proxy cites a Schedule 13G/A for 31 December 2023. Shares pledged by directors or officers: 0, per the proxy.
Adobe 13F institutional holders
Managers filing Form 13F reported 332.8m Adobe shares at 30 June 2026, 83.7% of the 397.5m shares outstanding on 11 June 2026 (10-Q cover), with a reported value of $68.5bn. 13F-HR filings listing the stock fell 21% in two quarters, from 2,550 to 2,016, and the ten largest holders reported 146.4m shares, 36.8% of shares outstanding.

Tracked holders are the ten largest at 30 June 2026 excluding BlackRock, whose 31 March 2026 figure is n/a. Filing counts for the three earlier quarters are index totals.
Table 6.2 Ten largest 13F holders at 30 June 2026 and their prior three quarters, shares
| Manager | 30 Sep 2025 | 31 Dec 2025 | 31 Mar 2026 | 30 Jun 2026 | % of shares outstanding |
|---|---|---|---|---|---|
BlackRock | 40,521,996 | 40,430,222 | n/a | 41,156,085 | 10.4% |
Vanguard Group | 41,369,395 | 41,283,446 | n/a | n/a | n/a |
Vanguard Capital Management | n/a | n/a | 26,679,971 | 26,405,210 | 6.6% |
State Street | 20,632,009 | 20,473,733 | 19,913,187 | 20,515,508 | 5.2% |
Invesco | 4,821,688 | 14,523,362 | 14,126,834 | 14,654,959 | 3.7% |
Geode Capital Management | 11,117,629 | 11,531,678 | 11,726,888 | 11,615,763 | 2.9% |
Vanguard Portfolio Management | n/a | n/a | 9,972,632 | 9,363,848 | 2.4% |
Arrowstreet Capital | 5,617,145 | 6,228,503 | 6,792,275 | 6,787,022 | 1.7% |
Morgan Stanley | 6,912,991 | 6,195,038 | 5,676,933 | 5,390,521 | 1.4% |
Amundi | 4,888,283 | 4,670,678 | 4,724,102 | 5,242,464 | 1.3% |
Primecap Management | 3,857,505 | 3,676,206 | 4,730,846 | 5,227,139 | 1.3% |
All 2,016 managers | n/a | n/a | n/a | 332,770,525 | 83.7% |
Source: Form 13F-HR and 13F-HR/A filings reporting CUSIP 00724F101, share rows excluding puts and calls; each figure links to its filing. Invesco figures for 31 December 2025 and 31 March 2026 add its new holdings amendments (0000914208-26-000214, 0000914208-26-000216) to the linked originals. All manager total counts the latest filing of each manager; amendments that add holdings to an original filing cover up to about 1.6m further shares, 0.4% of shares outstanding. Vanguard reported through The Vanguard Group until 31 December 2025 and through two successor filers from 31 March 2026.

Adobe Schedule 13D and 13G filings
Table 6.3 Schedule 13G filings on Adobe, 10 October 2024 to 10 October 2026
| Filed | Form | Holder | Event date | Shares | % of class | Sole and shared voting power |
|---|---|---|---|---|---|---|
7 Aug 2026 | SC 13G | State Street Corporation | 30 Jun 2026 | 20,538,520 | 5.2% | 0 sole, 12,808,817 shared |
27 Jul 2026 | SC 13G/A | BlackRock, Inc. | 30 Jun 2026 | 37,230,155 | 9.4% | 34,313,193 sole, 0 shared |
29 Apr 2026 | SC 13G | Vanguard Capital Management | 31 Mar 2026 | 30,765,197 | 7.61% | 4,085,226 sole, 0 shared |
26 Mar 2026 | SC 13G/A | The Vanguard Group | 13 Mar 2026 | 0 | 0% | 0 sole, 0 shared |
5 Feb 2026 | SC 13G/A | The Vanguard Group | 30 Jan 2026 | 41,472,249 | 10.1% | 0 sole, 4,225,772 shared |
30 Oct 2025 | SC 13G/A | The Vanguard Group | 30 Sep 2025 | 41,365,193 | 9.88% | 0 sole, 2,562,263 shared |
Source: Schedule 13G filings with Adobe as subject company. Schedule 13D filings on Adobe in the period: 0. The Vanguard Group's 26 March 2026 amendment reports zero shares; Vanguard Capital Management filed an initial statement 34 days later. State Street's filing is its first above 5% in the period.
Adobe 2026 annual meeting voting results and CEO pay
Shares represented were 336.4m, 82.5% of those entitled to vote. All four stockholder proposals, each opposed by the board, failed. Golden parachute proposal received 8.2% support against 47.7% for a similar proposal in 2025, and director Daniel Rosensweig received 69.2% against 94.3%.

Table 6.4 Proposals 2 to 8 at the 15 April 2026 annual meeting
| No. | Proposal | Proponent | Board position | For | Against | Abstain | Broker non votes | % for |
|---|---|---|---|---|---|---|---|---|
2 | Amend 2019 Equity Incentive Plan, add 12m shares | Management | FOR | 269,926,547 | 23,610,400 | 981,795 | 41,927,404 | 92.0% |
3 | Ratify KPMG LLP as auditor for fiscal 2026 | Management | FOR | 304,073,299 | 31,540,619 | 832,228 | n/a | 90.6% |
4 | Advisory vote on named executive officer pay | Management | FOR | 148,837,167 | 144,993,886 | 687,689 | 41,927,404 | 50.7% |
5 | Stockholder vote on golden parachutes | John R. Chevedden | AGAINST | 23,956,990 | 269,589,945 | 971,807 | 41,927,404 | 8.2% |
6 | Board matrix disclosure | Comptroller of the City of New York for three New York City pension funds | AGAINST | 38,813,057 | 253,504,241 | 2,201,444 | 41,927,404 | 13.3% |
7 | Report on civil liberties in digital services | Ridgeline Research LLC for the American Conservative Values ETF | AGAINST | 1,501,051 | 290,666,105 | 2,351,586 | 41,927,404 | 0.5% |
8 | Retirement plan climate risk | As You Sow for the Pleiades Trust and co filers | AGAINST | 26,993,426 | 249,732,648 | 17,792,668 | 41,927,404 | 9.8% |
Source: 8-K Item 5.07; proponents and board positions from the DEF 14A. % for is votes for divided by for plus against. Ratification of the auditor is a routine matter, so broker non votes are n/a.
Table 6.5 Proposal 1, election of eleven directors, 15 April 2026
| Nominee | For | Against | Abstain | Broker non votes | % for 2026 | % for 2025 |
|---|---|---|---|---|---|---|
Daniel Rosensweig | 203,314,252 | 90,650,276 | 554,214 | 41,927,404 | 69.2% | 94.3% |
Amy Banse | 251,492,697 | 42,599,149 | 426,896 | 41,927,404 | 85.5% | 89.6% |
Frank Calderoni | 260,547,648 | 33,532,812 | 438,282 | 41,927,404 | 88.6% | 90.6% |
Shantanu Narayen | 269,218,851 | 24,752,304 | 547,587 | 41,927,404 | 91.6% | 90.3% |
David Ricks | 280,254,563 | 13,829,972 | 434,207 | 41,927,404 | 95.3% | 98.7% |
Cristiano Amon | 282,005,411 | 12,079,030 | 434,301 | 41,927,404 | 95.9% | 98.8% |
Melanie Boulden | 282,311,182 | 11,809,775 | 397,785 | 41,927,404 | 96.0% | 98.8% |
Laura Desmond | 284,342,411 | 9,748,316 | 428,015 | 41,927,404 | 96.7% | 96.5% |
Kathleen Oberg | 288,120,843 | 5,970,573 | 427,326 | 41,927,404 | 98.0% | 97.9% |
Spencer Neumann | 291,249,899 | 2,830,574 | 438,269 | 41,927,404 | 99.0% | 99.6% |
Dheeraj Pandey | 291,705,655 | 2,379,367 | 433,720 | 41,927,404 | 99.2% | 99.6% |
Source: 8-K Item 5.07, 2026 and 8-K Item 5.07, 2025. All eleven nominees were elected. Amy Banse chairs the Executive Compensation Committee and Frank Calderoni is Lead Director, per the proxy.

Table 6.6 Executive compensation headline figures
| Measure | FY2025 | FY2024 |
|---|---|---|
CEO total compensation, Shantanu Narayen | $51,173,935 | $52,390,182 |
of which stock awards | $45,376,110 | $46,349,135 |
of which salary | $1,500,000 | $1,500,000 |
of which non equity incentive | $3,120,000 | $2,940,000 |
Median employee total compensation | $235,989 | n/a |
CEO pay ratio | 217 to 1 | n/a |
Source: DEF 14A, summary compensation table and CEO pay ratio section. FY2025 stock awards represent 88.7% of CEO total compensation.
7 Insider Activity
Adobe insiders sold 204,302 shares for $50.8m on open market in 12 months to 10 October 2026 and bought 10,000 shares for $1.9m, a buy to sell ratio of 0.04 by value on open market transactions (codes S and P). A family trust of Chair and CEO Shantanu Narayen sold 200,000 shares for $49.6m, 97.7% of sale value, and its holding moved from 391,921 shares on 15 October 2025 to 238,724 on 17 September 2026. Forms 4 with the Rule 10b5-1 box checked or a plan footnote: 0. Footnotes to both Narayen filings state that the sales were primarily made for tax and estate planning purposes.
Insider buying and selling by transaction type
Shares withheld by Adobe for tax at vesting (code F) totalled 121,333, worth $34.7m, and are excluded from the ratio; the largest such item was 34,483 shares ($10.4m) for Mr Narayen on 24 January 2026.
Table 7.1 Reported insider transactions by type, 10 October 2025 to 10 October 2026
| Transaction type | Lines | Shares | Value | Counted as open market |
|---|---|---|---|---|
S, open market sale | 20 | 204,302 | $50.8m | Yes |
P, open market purchase | 1 | 10,000 | $1.9m | Yes |
F, shares withheld for tax | 124 | 121,333 | $34.7m | No |
M, RSU or performance share vesting | 134 | 256,594 | n/a | No |
G, gift | 1 | 550 | n/a | No |
W, inheritance | 2 | 9.038 | n/a | No |
A, RSU grants (derivative table) | 42 | 442,654 | n/a | No |
Source: Forms 3, 4 and 5 via SEC-API.io. Value = shares × reported price; vestings, grants and gifts carry no price.

Table 7.2 Open market activity by month
| Month | Shares sold | Sale value | Shares bought | Purchase value | Net shares | Net value | Shares withheld for tax |
|---|---|---|---|---|---|---|---|
Oct 2025 | 149 | $0.05m | 0 | $0 | (149) | ($0.05m) | 8,824 |
Nov 2025 | 0 | $0 | 0 | $0 | 0 | $0 | 0 |
Dec 2025 | 0 | $0 | 0 | $0 | 0 | $0 | 228 |
Jan 2026 | 1,646 | $0.49m | 0 | $0 | (1,646) | ($0.49m) | 80,367 |
Feb 2026 | 0 | $0 | 0 | $0 | 0 | $0 | 0 |
Mar 2026 | 0 | $0 | 0 | $0 | 0 | $0 | 158 |
Apr 2026 | 77,091 | $18.8m | 0 | $0 | (77,091) | ($18.8m) | 13,032 |
May 2026 | 0 | $0 | 0 | $0 | 0 | $0 | 0 |
Jun 2026 | 0 | $0 | 10,000 | $1.9m | 10,000 | $1.9m | 4,104 |
Jul 2026 | 416 | $0.11m | 0 | $0 | (416) | ($0.11m) | 11,236 |
Aug 2026 | 0 | $0 | 0 | $0 | 0 | $0 | 28 |
Sep 2026 | 125,000 | $31.3m | 0 | $0 | (125,000) | ($31.3m) | 3,356 |
Total | 204,302 | $50.8m | 10,000 | $1.9m | (194,302) | ($48.8m) | 121,333 |
Insider selling by officer and director
Three of nine reporting officers sold on open market. Director David A. Ricks made the single purchase, 10,000 shares at $194.51 on 25 June 2026.
Table 7.3 Activity by insider, 12 months to 10 October 2026
| Insider | Role on latest filing | Shares sold | Sale value | Average sale price | Shares bought | Shares withheld for tax | Shares held after latest filing |
|---|---|---|---|---|---|---|---|
Shantanu Narayen | Chair and CEO | 200,000 | $49.6m | $248.05 | 0 | 48,740 | 239,123 |
Daniel Durn | EVP & CFO | 2,982 | $0.82m | $273.87 | 0 | 13,887 | 42,833 |
Jillian Forusz | SVP & CAO | 1,320 | $0.35m | $262.29 | 0 | 2,917 | 5,381 |
David A. Ricks | Director | 0 | $0 | n/a | 10,000 | 0 | 20,430 |
Anil Chakravarthy | President, CXO | 0 | $0 | n/a | 0 | 17,200 | 61,893 |
Gloria Chen | EVP, Chief People Officer | 0 | $0 | n/a | 0 | 10,161 | 51,101 |
David Wadhwani | President, C&P | 0 | $0 | n/a | 0 | 16,704 | 43,216 |
Amy Banse | Director | 0 | $0 | n/a | 0 | 0 | 34,517 |
Frank Calderoni | Director | 0 | $0 | n/a | 0 | 0 | 32,717 |
Laura Desmond | Director | 0 | $0 | n/a | 0 | 0 | 32,633 |
Daniel Rosensweig | Director | 0 | $0 | n/a | 0 | 0 | 19,934 |
Adele Louise Pentland | Chief Legal Officer & EVP | 0 | $0 | n/a | 0 | 5,734 | 7,042 |
Steven Day | Interim CFO and SVP | 0 | $0 | n/a | 0 | 1,500 | 6,229 |
Dheeraj Pandey | Director | 0 | $0 | n/a | 0 | 0 | 5,920 |
Lara Balazs | Chief Marketing Officer & EVP | 0 | $0 | n/a | 0 | 4,490 | 5,647 |
Kathleen K. Oberg | Director | 0 | $0 | n/a | 0 | 0 | 5,250 |
Melanie Boulden | Director | 0 | $0 | n/a | 0 | 0 | 3,965 |
Spencer Adam Neumann | Director | 0 | $0 | n/a | 0 | 0 | 3,288 |
Cristiano R. Amon | Director | 0 | $0 | n/a | 0 | 0 | 1,822 |
Source: Forms 4 via SEC-API.io. Holdings combine direct and indirect common shares on each insider's latest filing and exclude unvested RSUs. C&P = Creativity & Productivity; CXO = Customer Experience Orchestration; CAO = Chief Accounting Officer.


Insider transactions on open market
Table 7.4 All open market transactions, grouped by insider and trade date
| Date | Insider | Role | Code | Shares | Average price | Value | Holding after | Form 4 |
|---|---|---|---|---|---|---|---|---|
17 Sep 2026 | Shantanu Narayen | Chair and CEO | S | 50,500 | $249.57 | $12.6m | 238,724 | 0001224154-26-000003 |
16 Sep 2026 | Shantanu Narayen | Chair and CEO | S | 74,500 | $251.56 | $18.7m | 289,224 | 0001224154-26-000003 |
29 Jul 2026 | Jillian Forusz | SVP & CAO | S | 416 | $264.33 | $0.11m | 3,824 | 0000796343-26-000137 |
25 Jun 2026 | David A. Ricks | Director | P | 10,000 | $194.51 | $1.9m | 17,655 | 0000796343-26-000118 |
30 Apr 2026 | Jillian Forusz | SVP & CAO | S | 755 | $246.25 | $0.19m | 3,521 | 0000796343-26-000107 |
28 Apr 2026 | Shantanu Narayen | Chair and CEO | S | 75,000 | $243.54 | $18.3m | 359,538 | 0000796343-26-000105 |
20 Apr 2026 | Daniel Durn | EVP & CFO | S | 1,336 | $248.02 | $0.33m | 42,833 | 0000796343-26-000103 |
27 Jan 2026 | Daniel Durn | EVP & CFO | S | 1,646 | $294.85 | $0.49m | 41,995 | 0000796343-26-000030 |
31 Oct 2025 | Jillian Forusz | SVP & CAO | S | 149 | $337.88 | $0.05m | 3,426 | 0000796343-25-000133 |
Source: Forms 4 via SEC-API.io. Narayen sales were reported in 15 lines at weighted average prices of $243.19 to $253.64; holding shown is family trust. Other holdings are direct.
Form 144 notices and Form 3 filings
Nine Form 144 notices covered 247,035 shares, of which 200,000 for the Narayen Family Trust in notices of 125,000 and 75,000 shares, the amounts sold on 16 and 17 September and on 28 April 2026 (Table 7.4). Daniel Durn filed his last Form 4 on 22 April 2026. Interim CFO Steven Day filed the single Form 3 on 17 June 2026: 4,618.689 common shares and 20,250 RSUs.
Table 7.5 Form 144 notices of proposed sale
| Filed | Seller | Shares | Aggregate market value | Note from filing | Form 144 |
|---|---|---|---|---|---|
16 Sep 2026 | Narayen Family Trust (Shantanu Narayen, trustee) | 125,000 | $31.4m | RSU and employee stock purchase plan (ESPP) shares acquired 2014 to 2026 | 0001969223-26-001025 |
8 Sep 2026 | Daniel Durn | 33 | $8,479 | Stock award shares acquired 15 May 2022 | 0001965301-26-000137 |
29 Jul 2026 | Jillian Forusz | 416 | $0.11m | Restricted stock acquired 15 July 2026 | 0001950047-26-007418 |
16 Jun 2026 | Daniel Durn | 42,700 | $9.6m | Remarks list a 16 October 2026 put (strike 200) and calls (strikes 210 to 240) and state that each "does not represent a sale" | 0001965301-26-000076 |
30 Apr 2026 | Jillian Forusz | 755 | $0.19m | Restricted stock acquired March and April 2026 | 0001950047-26-003868 |
28 Apr 2026 | Narayen Family Trust (Shantanu Narayen, trustee) | 75,000 | $18.3m | RSU shares acquired 2020 to 2025 | 0001969223-26-000474 |
20 Apr 2026 | Daniel Durn | 1,336 | $0.33m | Stock award shares acquired 15 April 2026 | 0001965301-26-000043 |
27 Jan 2026 | Daniel Durn | 1,646 | $0.49m | Stock award shares acquired January 2026 | 0001965301-26-000004 |
31 Oct 2025 | Jillian Forusz | 149 | $0.05m | Restricted stock acquired September and October 2025 | 0001950047-25-008332 |
Source: Forms 144 via SEC-API.io, as filed.
8 Risk Factors
Adobe's Q3 FY2026 10-Q carries 23 risk factors in 10,125 words, the same 23 as the FY2025 10-K and the FY2024 10-K, with 7 updated since the annual report. Against FY2024, the FY2025 10-K added or removed zero risk factors, materially reworded 12, lightly edited 7 and left 4 unchanged; total length rose 4.4% from 9,592 to 10,013 words.
Adobe risk factors by category
Table 8.1 Risk factor count and word count by category as filed
| Category | Count FY2024 | Count FY2025 | Count Q3 FY2026 | Words FY2024 | Words FY2025 | Words Q3 FY2026 | Change FY2025 | Change Q3 FY2026 |
|---|---|---|---|---|---|---|---|---|
Ability to grow | 5 | 5 | 5 | 2,235 | 2,436 | 2,483 | 201 | 47 |
Operations | 6 | 6 | 6 | 3,131 | 3,317 | 3,341 | 186 | 24 |
Laws and regulations | 6 | 6 | 6 | 2,504 | 2,759 | 2,760 | 255 | 1 |
Financial performance | 4 | 4 | 4 | 997 | 946 | 981 | (51) | 35 |
General | 2 | 2 | 2 | 725 | 555 | 560 | (170) | 5 |
Total | 23 | 23 | 23 | 9,592 | 10,013 | 10,125 | 421 | 112 |
Word counts cover risk headings and body text under Item 1A.


Adobe risk factor changes in FY2025 and FY2026
Table 8.2 Item 1A risk factors in the FY2025 10-K and change against the FY2024 10-K
| Category | Risk factor | Words FY2025 | Change in words | Status | What changed |
|---|---|---|---|---|---|
Ability to grow | Innovation | 308 | (41) | Reworded | Heading now ends "suffer materially"; agentic AI added and the named Adobe Firefly example removed. |
Ability to grow | Competition | 429 | 19 | Reworded | Competitor description now lists new entrants and AI or cloud native companies, plus agentic AI products such as AI agents built for a single purpose. |
Ability to grow | AI development and use | 696 | 131 | Reworded | Adds US state AI laws, EU AI Act obligations now in effect with administrative fines, third party model liability and "challenges accessing AI models, datasets or hardware". |
Ability to grow | Reputation and brands | 410 | 26 | Reworded | Adds reduced customer demand and customer attrition as outcomes, plus sustainability commitments moved from the catastrophic events risk. |
Ability to grow | Acquisitions and investments | 593 | 66 | Reworded | Scope widened to "other strategic transactions"; two bullets added on foreign transaction risk and brand harm from deals. |
Operations | Key personnel | 289 | 0 | Unchanged | Text identical. Moved from last to first position in the operations category. |
Operations | Service interruptions | 553 | 8 | Minor edits | Adds the enterprise resource planning system and customer and sales support to the systems that rely on hosted services. |
Operations | Security incidents | 1,039 | 162 | Reworded | Adds open source vulnerabilities, AI enabled attack methods and a supply chain scenario affecting "a large portion or, in some instances, all of our customers". |
Operations | Sales channels and third parties | 535 | 6 | Minor edits | Heading leads with the direct sales force; paragraphs reordered and large language models added to the third party technology list. |
Operations | Multinational operations | 548 | 37 | Reworded | Heading adds geopolitical conditions; tariffs, consumer protection laws and data flows "including into the United States" added to the list. |
Operations | Enterprise sales cycles | 353 | (27) | Reworded | Names "trade disputes and tariffs" as a cause of delayed purchasing, "particularly for larger and more complex deals"; product names removed. |
Laws and regulations | Litigation and inquiries | 421 | (6) | Minor edits | Heading adds investigations; employment practices and competitor initiated intellectual property disputes added. |
Laws and regulations | Global legal compliance | 350 | 8 | Minor edits | Adds immigration, employment practices and sustainability to the list of regulated areas. |
Laws and regulations | Privacy and security regulation | 950 | 199 | Reworded | Adds the EU Digital Services Act, Digital Operational Resilience Act and Data Act and a US Department of Justice data transfer rule. |
Laws and regulations | Intellectual property | 388 | 20 | Minor edits | Extends the generative AI caveat from copyright in source code to patents and "other materials or inventions". |
Laws and regulations | Tax rules | 393 | 15 | Minor edits | States tax law changes "have in the past" had a material impact; future rates "may be" affected, previously "are likely to be". |
Laws and regulations | Government contracting | 257 | 19 | Minor edits | Adds "changes in governmental administrations and policies" and executive orders to procurement risks. |
Financial performance | Subscriptions and renewals | 339 | (3) | Unchanged | Terminology changes; subscription terms range from 1 to 36 months in both years. |
Financial performance | Foreign currency | 168 | (48) | Reworded | Tariffs added as a currency driver; sentence on annualized recurring revenue measured at constant currency removed. |
Financial performance | Goodwill impairment | 115 | 0 | Unchanged | Text identical at 115 words. |
Financial performance | Debt obligations | 324 | 0 | Unchanged | Senior notes figure updated from $5.65bn to $6.15bn; $3bn commercial paper program with nil outstanding in both years. |
General | Catastrophic events | 235 | (186) | Reworded | Paragraphs on climate regulation costs and on pandemics removed; "cloud service provider outages" added as a trigger. |
General | Stock price volatility | 320 | 16 | Reworded | Heading changed from "may be volatile" to "has been volatile"; "changes to our key performance metrics" added as a price driver. |
Status labels and word counts are this report's classification of the filed text.

In the Q3 FY2026 10-Q the competition risk describes AI as "transforming how digital work is performed or automated", and the goodwill risk states that an impairment was booked in Q2 FY2026.
Table 8.3 Item 1A changes in the Q3 FY2026 10-Q against the FY2025 10-K
| Risk factor | Change in words | What changed |
|---|---|---|
Introduction | 47 | Adds "the trading price of our common stock" to the items risks could affect. |
Competition | 45 | Adds AI agents and workflows embedded within or operating across AI platforms of third parties, and pricing described as "aggressive or different pricing strategies". |
AI development and use | 2 | Adds privacy claims to the liabilities linked to third party AI models. |
Security incidents | 24 | Adds a sentence on large language models focused on cyber attacks raising frequency, speed and severity of threats. |
Global legal compliance | 0 | Share of employees outside the United States updated from approximately 50% to approximately 52%. |
Goodwill impairment | 35 | States a goodwill impairment was recorded in Q2 FY2026 for the Publishing & Advertising reporting unit; the notes give $70m. |
Debt obligations | 0 | Commercial paper outstanding moves from $0 to $250m under the $3bn program; senior notes stay at $6.15bn. |
Stock price volatility | 5 | Economic conditions bullet now reads "geopolitical conditions, including armed conflicts and wars". |
Adobe legal proceedings and FTC subscription cancellation case
A Department of Justice case on subscription cancellation, referred by the Federal Trade Commission (FTC), settled on 12 March 2026; the notes give no settlement amount. Legal notes in the three FY2026 10-Q filings describe accrued legal provisions as immaterial to the financial statements.
Table 8.4 Legal proceedings disclosed in the financial statement notes
| Matter | Status in FY2025 10-K, Note 16 | Status in Q3 FY2026 10-Q, Note 13 |
|---|---|---|
United States v. Adobe, subscription disclosure and cancellation under the Restore Online Shoppers' Confidence Act (ROSCA) | Complaint filed 17 June 2024; motion to dismiss denied 2 May 2025; discovery ongoing | Settlement agreed 12 March 2026; stipulation of dismissal filed 13 March 2026 |
In Re Adobe Inc. Securities Litigation, class period 23 July 2021 to 22 September 2022, statements on competition from Figma | Dismissed in full 27 March 2025; leave to amend denied 7 November 2025; plaintiff appealing | Plaintiff appealing |
Five shareholder derivative actions based on the same facts | Stayed | Stayed; amended complaint filed 16 March 2026 in the consolidated California action |
Source: 10-K FY2025 and 10-Q filings for Q1 FY2026, Q2 FY2026 and Q3 FY2026.
Adobe market risk sensitivity and cybersecurity governance
Interest rate swaps on $2.70bn of senior notes created a fair value sensitivity of $71m per 50 basis points in FY2025; in FY2024 all $5.65bn of notes carried fixed rates. Q3 FY2026 10-Q reports market risk exposures materially unchanged since.
Table 8.5 Item 7A market risk disclosures as filed
| Measure | FY2025, 28 Nov 2025 | FY2024, 29 Nov 2024 |
|---|---|---|
Gross notional of foreign exchange contracts | $6.54bn | $5.89bn |
Of which Euro | $3.27bn | $2.73bn |
Of which Japanese Yen | $884m | $791m |
Of which British Pound | $741m | $714m |
Of which Indian Rupee | $668m | $609m |
Fair value change of hedges for a 10% move in the US Dollar | $456m | $434m |
Unhedged long term investment exposure in foreign subsidiaries | $1.32bn | $1.19bn |
Euro revenue exposure for the year | €3.43bn | €3.15bn |
Japanese Yen revenue exposure for the year | ¥163.8bn | ¥144.8bn |
Short term investments in debt securities | $1.16bn | $273m |
Market value change for a 150 basis point rate move | $4m | $1m |
Senior notes outstanding | $6.15bn | $5.65bn |
Senior notes swapped to floating rate | $2.70bn | $0 |
Fair value change of hedged debt for a 50 basis point rate move | $71m | n/a |
Fair value of senior notes | $6.18bn | $5.51bn |
Table 8.6 Item 1C cybersecurity disclosure, FY2025 against FY2024
| Topic | FY2025 10-K | FY2024 10-K |
|---|---|---|
Board oversight | Audit Committee receives regular updates from the Chief Security Officer (CSO) and reports them to the Board | Audit Committee receives regular updates from the CSO and the Chief Cybersecurity Legal and Privacy Officer |
CSO reporting line | Chief Financial Officer | Chief Financial Officer |
Legal lead | Cyber legal professionals reporting to the Chief Legal Officer | Chief Cybersecurity Legal and Privacy Officer reporting to the General Counsel |
Incident escalation | Members of management "depending on the circumstances" | Eight named executive roles including the Chief Executive Officer |
Employee training | General security awareness training required annually | General security awareness training required annually |
9 Stock Price, Scenarios & Sensitivity
ADBE closed at $242.27 on 9 October 2026, 13.5x TTM diluted GAAP EPS of $17.91 and (63.8)% from its November 2021 month end close of $669.85. Three scenarios built on an FY2026 estimate give FY2029 diluted EPS of $22.13, $28.80 and $35.18 and implied prices of $206 to $668. Each implied price is an arithmetic outcome of the stated assumptions.
ADBE stock price history and valuation multiples

Table 9.1 Price range, balance sheet items and TTM multiples at 9 October 2026
| Item | Value | Basis |
|---|---|---|
52 week range | $190.12 to $363.70 | Market data, 9 October 2026 |
Change since 31 December 2025 | (30.8)% | Against 31 December 2025 close of $349.99 |
Shares outstanding | 389.2m | Cover page at 18 September 2026, 10-Q |
Debt | $6.4bn | Current $1.6bn plus non current $4.8bn at 28 August 2026, 10-Q |
Cash and short term investments | $5.6bn | 28 August 2026, 10-Q |
TTM operating income | $9.3bn | FY2025 less 9M FY2025 plus 9M FY2026, GAAP |
TTM FCF | $10.6bn | Operating cash flow $10.8bn less capex $214m |
P / E | 13.5x | Price over TTM diluted GAAP EPS of $17.91 |
EV / operating income | 10.2x | TTM, GAAP |
EV / FCF | 9.0x | TTM |
FCF yield | 11.2% | TTM FCF over market cap; P / FCF 8.9x |
Price, market cap, enterprise value and EV / sales are in Table 4.5.
Adobe FY2026 estimate and three year scenario analysis
FY2026 estimate adds Q4 target midpoints from the 8-K of 10 September 2026 to nine months as filed.
Table 9.2 FY2026 estimate, nine months as filed plus Q4 FY2026 company targets
| Metric | 9M FY2026 as filed | Q4 FY2026 target midpoint | FY2026E |
|---|---|---|---|
Revenue | $19.8bn | $6.825bn | $26.6bn |
GAAP operating income | $7.0bn | $2.3bn at 34.0% margin | $9.3bn |
GAAP operating margin | 35.4% | 34.0% | 35.1% |
Diluted GAAP EPS | $13.47 | $4.675 | $18.145 |
Diluted shares | 402.9m | 389m | 400m |
FCF | $7.5bn | $2.6bn at 9M margin of 37.8% | $10.0bn |
Table 9.3 Scenario assumptions and outcomes, FY2027 to FY2029
| Line | Worst case | Base case | Best case |
|---|---|---|---|
| Assumption, each year | |||
Revenue growth | 6% | 10% | 13% |
GAAP operating margin | 32% | 35% | 37% |
FCF margin | 35% | 39% | 42% |
Annual reduction in diluted shares from 389m | 3% | 5% | 7% |
GAAP tax rate | 22.5% | 22.5% | 22.5% |
Exit P / E on FY2029 diluted GAAP EPS | 10.0x | 13.5x | 19.0x |
Exit P / FCF on FY2029 FCF per share | 6.6x | 8.9x | 12.5x |
| Revenue | |||
FY2027 | $28.2bn | $29.3bn | $30.1bn |
FY2028 | $29.9bn | $32.2bn | $34.0bn |
FY2029 | $31.7bn | $35.4bn | $38.4bn |
| GAAP operating income | |||
FY2027 | $9.0bn | $10.2bn | $11.1bn |
FY2028 | $9.6bn | $11.3bn | $12.6bn |
FY2029 | $10.1bn | $12.4bn | $14.2bn |
| FCF | |||
FY2027 | $9.9bn | $11.4bn | $12.6bn |
FY2028 | $10.5bn | $12.6bn | $14.3bn |
FY2029 | $11.1bn | $13.8bn | $16.1bn |
| Diluted shares | |||
FY2029 | 355m | 334m | 313m |
| Diluted GAAP EPS | |||
FY2027 | $18.53 | $21.48 | $23.83 |
FY2028 | $20.25 | $24.87 | $28.95 |
FY2029 | $22.13 | $28.80 | $35.18 |
| Implied FY2029 share price | |||
At exit P / FCF | $206 | $368 | $644 |
At exit P / E | $221 | $389 | $668 |
Implied price range | $206 to $221 | $368 to $389 | $644 to $668 |
Exit P / E price against $242.27 | (8.7)% | 60.5% | 175.9% |
Net income is operating income less tax at 22.5%, the company's FY2026 GAAP tax rate assumption. Base case exit multiples equal current TTM multiples.

Best case critical factors, core assumptions and demand drivers
Table 9.4 Best case assumptions and the filed data point behind each
| Best case assumption | Filed data point | Source |
|---|---|---|
Revenue growth 13% | Q3 FY2026 revenue $6.76bn, up 12.9% year on year; customer group subscription revenue up 14% | 10-Q, 8-K |
AI products add to growth | AI first ARR up more than 150% year on year; 1bn monthly active users | 8-K |
GAAP operating margin 37% | FY2025 margin 36.6% on operating income of $8.7bn | 10-K |
FCF margin 42% | FY2025 FCF margin 41.4%; TTM 40.8% | 10-K, 10-Q |
Share count reduction 7% a year | Q3 FY2026 diluted shares 395.5m, (6.7)% year on year; 9M repurchases 26.1m shares for $6.82bn; $24.55bn of authority remains, 26% of market cap | 10-Q |
Exit P / E 19.0x | 19.2x at November 2025 month end close of $320.13 on FY2025 EPS of $16.70 | 10-K; market data |
Total Adobe ARR rose 7.2% in nine months from $25.66bn, against a company target of 10.2% for FY2026. RPO was 1.6% below the $22.52bn of Q4 FY2025 and 8.4% above the Q3 FY2025 figure; base case revenue growth input is 10%.
Table 9.5 Scenario inputs against five years of filed history
| Fiscal year | Revenue growth | GAAP operating margin | FCF margin | Change in diluted shares | P / E at fiscal year end month |
|---|---|---|---|---|---|
FY2021 | 22.7% | 36.8% | 43.6% | (0.9)% | 66.9x |
FY2022 | 11.5% | 34.6% | 42.0% | (2.1)% | 34.2x |
FY2023 | 10.2% | 34.3% | 35.8% | (2.5)% | 51.7x |
FY2024 | 10.8% | 31.3% | 36.6% | (2.0)% | 41.7x |
FY2025 | 10.5% | 36.6% | 41.4% | (5.0)% | 19.2x |
FY2026E | 11.9% | 35.1% | 37.8% | (6.3)% | 13.5x at 9 October 2026 |
Worst case | 6% | 32% | 35% | (3)% | 10.0x |
Base case | 10% | 35% | 39% | (5)% | 13.5x |
Best case | 13% | 37% | 42% | (7)% | 19.0x |
Sensitivity analysis of FY2029 EPS and implied price
Exit P / E moves the FY2029 base case most: $288 at 10.0x and $547 at 19.0x, against $348 to $421 across the revenue growth range. GAAP tax rate is 22.5% in all three cases; Figure 9.4 moves it 2 points either side, to 24.5% and 20.5%.


Sources and method
- Filings used: 10-K FY2025 and 10-K filings for FY2021 to FY2024; 10-Q filings for Q1 FY2025 to Q3 FY2026; DEF 14A of 27 February 2026; 8-K filings of 10 September 2026, 8 September 2026, 11 June 2026 and 21 April 2026; Forms 3, 4, 5 and 144; Form 13F and Schedule 13G filings; peer 10-K and 10-Q filings.
- SEC filing data retrieved through SEC-API.io.
- Market data as of 9 October 2026.
- Earnings call material from public transcripts; third party research is credited to its named publisher in Table 4.1 and Table 4.3.
- Scenario figures are arithmetic outcomes of stated assumptions.
Sources appendix
Every filing referenced in this analysis, sorted by form and then by date. Each accession number links to the filing on sec.gov. Count: 138 filings.
Table A.1 Adobe Inc. filings, with ownership filings by holders and insiders
Table A.2 Filings of peers and other companies
| Company | Form | Period or filing date | Accession number |
|---|---|---|---|
| Autodesk (ADSK) | 10-K | 31 Jan 2026 | 0000769397-26-000015 |
| Autodesk (ADSK) | 10-Q | 31 Jul 2026 | 0000769397-26-000061 |
| Autodesk (ADSK) | 10-Q | 31 Jul 2025 | 0000769397-25-000117 |
| Docusign (DOCU) | 10-K | 31 Jan 2026 | 0001261333-26-000021 |
| Docusign (DOCU) | 10-Q | 31 Jul 2026 | 0001261333-26-000099 |
| Docusign (DOCU) | 10-Q | 31 Jul 2025 | 0001261333-25-000132 |
| Figma (FIG) | 10-K | 31 Dec 2025 | 0001628280-26-009228 |
| Figma (FIG) | 10-Q | 30 Jun 2026 | 0001628280-26-053348 |
| Figma (FIG) | 10-Q | 30 Jun 2025 | 0001579878-25-000027 |
| HubSpot (HUBS) | 10-K | 31 Dec 2025 | 0001193125-26-046646 |
| HubSpot (HUBS) | 10-Q | 30 Jun 2026 | 0001193125-26-335232 |
| HubSpot (HUBS) | 10-Q | 30 Jun 2025 | 0000950170-25-104104 |
| Intuit (INTU) | 10-K | 31 Jul 2026 | 0000896878-26-000037 |
| Intuit (INTU) | 10-K | 31 Jul 2025 | 0000896878-25-000035 |
| Microsoft (MSFT) | 10-K | 30 Jun 2026 | 0001193125-26-323660 |
| Microsoft (MSFT) | 10-K | 30 Jun 2025 | 0000950170-25-100235 |
| Salesforce (CRM) | 10-K | 31 Jan 2026 | 0001108524-26-000060 |
| Salesforce (CRM) | 10-Q | 31 Jul 2026 | 0001108524-26-000190 |
| Salesforce (CRM) | 10-Q | 31 Jul 2025 | 0001108524-25-000088 |
| Semrush | 8-K | 18 Nov 2025 | 0000950103-25-014983 |
This report is for information only and is not financial advice.
Read next
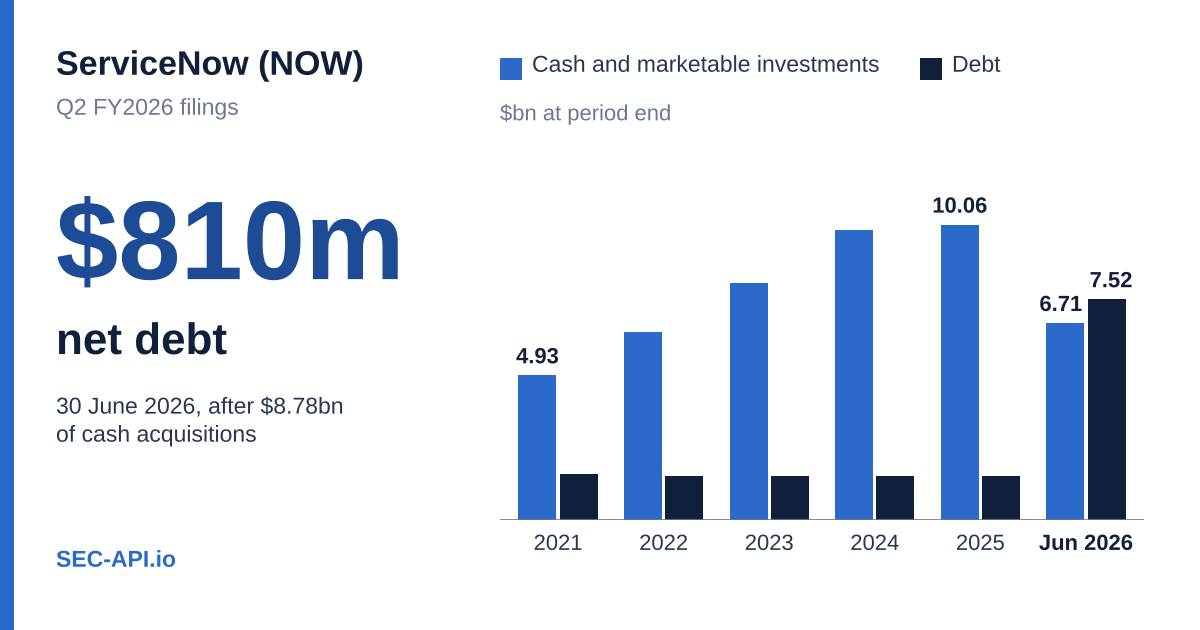
ServiceNow (NOW) financial analysis Q2 2026: revenue growth, Armis acquisition debt, ratios and price scenarios to FY2029
October 10, 2026·52 min read
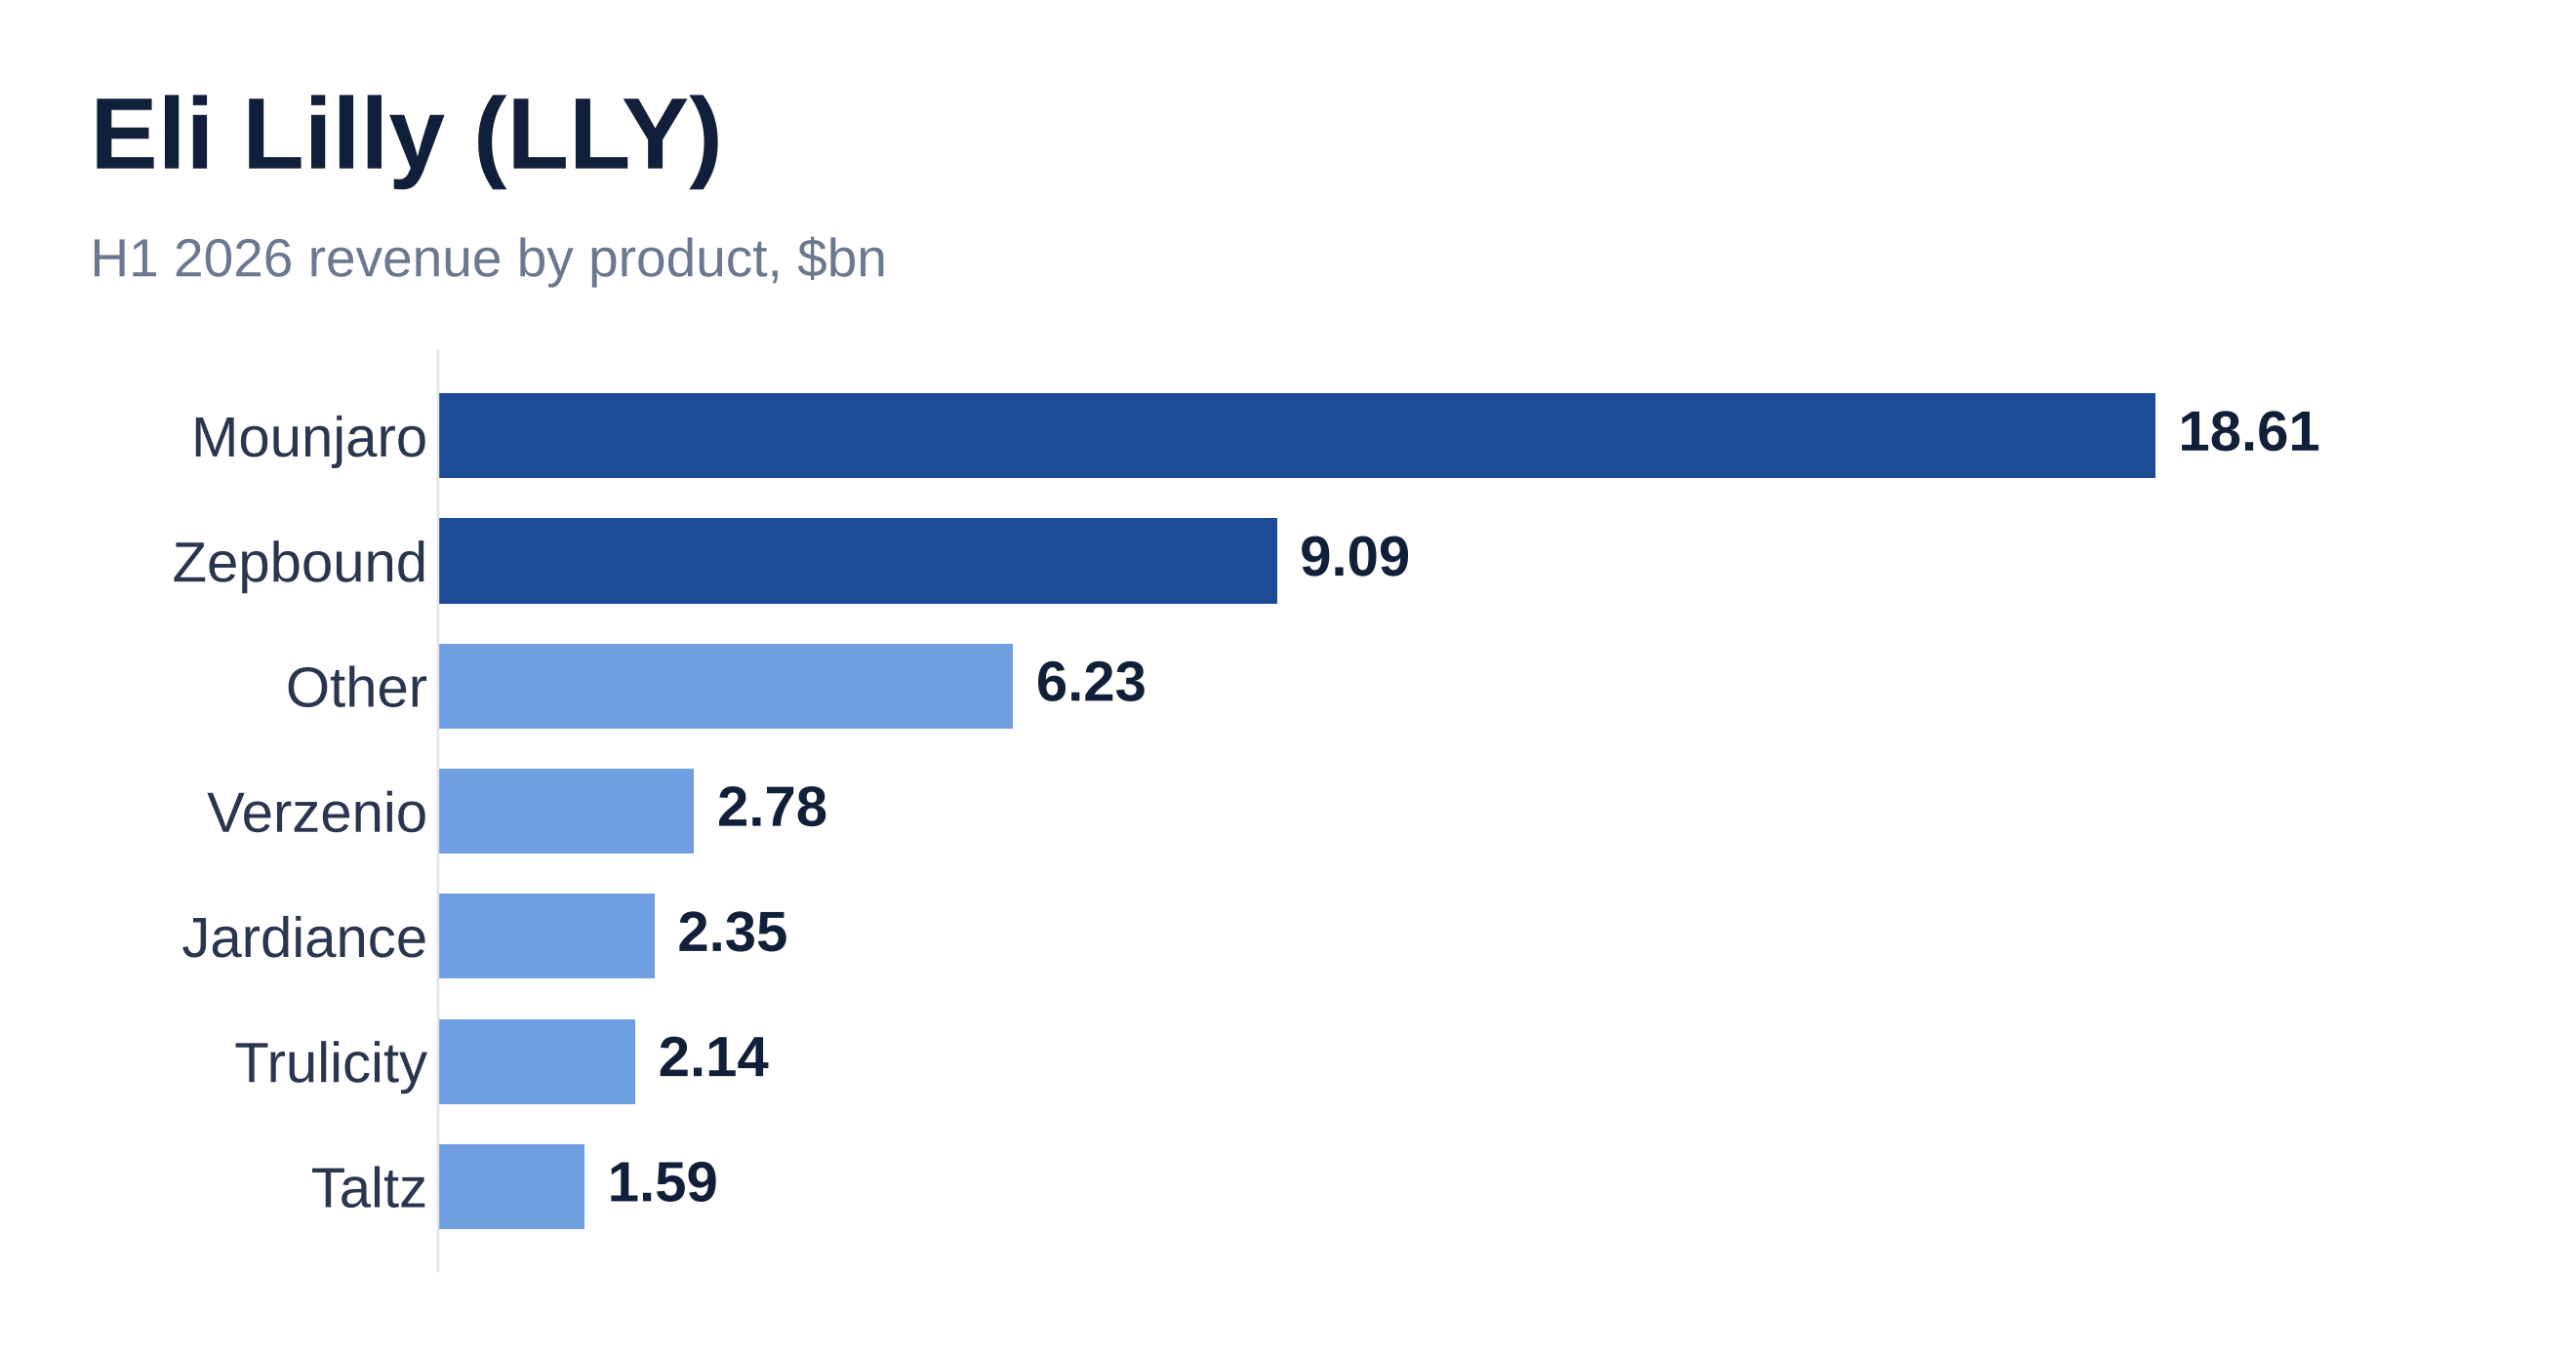
Eli Lilly and Company (LLY) financial and ratio analysis: Q2 2026 filings, Mounjaro and Zepbound revenue, peers and scenarios to 2029
October 8, 2026·29 min read