Eli Lilly and Company (LLY), Financial Analysis
Insights derived from analysing SEC filings. Independent analysis, not a publication of the SEC.
Q2 2026 revenue rose 48% to $22.97bn as volume rose 60% and realized prices fell 13%. Mounjaro and Zepbound supplied 65% of H1 revenue; 2026 guidance is revenue of $85bn to $87bn and adjusted EPS of $35.50 to $36.50. Five years of 10-K data, quarterly filings to 30 June 2026, current reports to 5 August 2026, scenarios to 2029.
Figures are read from the Forms 10-K for 2021 to 2025, the Forms 10-Q for Q1 2024 to Q2 2026, the Forms 8-K filed from October 2025 to August 2026 and their quarterly earnings exhibits 99.1, the proxy statement of 2026, Schedules 13G, Forms 13F and Forms 4 on the record for central index key 59478, together with the comparable filings of seven peers. Accession numbers for every filing used appear in the Sources appendix. Lilly share price is close of 5 October 2026; peer market data were captured on 6 October 2026.
Share price $1,143.12 52 week range $783.85 to $1,292.65 | Market value $1.08tn 941.4m shares on 10-Q cover; net debt $45.96bn | Price to earnings 38.4x EPS $29.79, four quarters to Q2 2026; 31.8x on 2026E adjusted EPS | Q2 2026 revenue $22.97bn 47.7% against Q2 2025 | Gross margin 85.8% 84.3% in Q2 2025; 74.2% in 2021 | Free cash flow $18.19bn Four quarters to Q2 2026, 22.8% of revenue |
- Stock: Shares closed at $1,143.12 on 5 October 2026, 11.6% below 52 week high and 46% above 52 week low. Price equals 38.4 times EPS of $29.79 for four quarters to 30 June 2026, 36.3 times adjusted EPS of $31.50 for same period and 31.8 times midpoint of adjusted EPS guidance for calendar 2026. Market value of $1.08tn uses 941.4m shares outstanding on 10-Q cover.
- Latest quarter: Q2 2026 revenue was $22.97bn, up 48% on Q2 2025 and 16% on Q1 2026. Revenue of Mounjaro (tirzepatide, approved for type 2 diabetes) rose 91% to $9.94bn and Zepbound (tirzepatide, approved for obesity) rose 46% to $4.93bn. EPS was $7.94 against $6.29; adjusted EPS was $8.38 against $6.31, after charges of $3.03 and $0.14 a share for acquired in process research and development (IPR&D), research projects bought and expensed at purchase.
- Price and volume: US revenue rose 33% on volume up 37% and price down 3%; 8-K puts US price decline at about 9% before changes to rebate estimates. Revenue outside US rose 80% on volume up 113% and price down 36%, which 10-Q attributes to Mounjaro entering China's national reimbursement list.
- Guidance: Company raised 2026 revenue guidance twice, from $80bn to $83bn in February to $85bn to $87bn in August. Midpoint implies H2 revenue of $43.2bn, 17% above H2 2025, after 51% growth in H1.
- Investment: Capital expenditures were $5.26bn in H1 2026 against $3.21bn a year earlier. Company paid $13.3bn for business development (acquisitions and licensing) in H1 and issued $9.0bn of notes in May 2026; total debt was $54.9bn at 30 June 2026 against $42.5bn at end of 2025.
- Cash: Operating cash flow was $28.08bn and free cash flow $18.19bn for four quarters to June 2026. Dividends paid were $5.79bn and share repurchases $6.17bn; quarterly dividend is $1.73 a share.
- Scenarios: 2029 adjusted EPS is $31.37 in worst case, $51.29 in base case and $62.90 in best case. At 18, 26 and 30 times earnings, implied value per share is $565, $1,334 and $1,887. Earnings multiple and revenue growth move base case value most.
1 Revenue & Business Model
Eli Lilly discovers, makes and sells medicines and reports one segment. Tirzepatide, sold as Mounjaro for type 2 diabetes and as Zepbound for obesity, produced $14.87bn of Q2 2026 revenue, 65% of total, against 16% of 2023 revenue. Verzenio (breast cancer), Jardiance (type 2 diabetes, in collaboration with Boehringer Ingelheim), Trulicity (type 2 diabetes) and Taltz (psoriasis and related immune conditions), each named with an approved use listed in 10-K, together produced $4.78bn. 10-K reports about 50,000 employees, of whom 12,000 work in research and development, and three US wholesalers that each supplied 16% to 24% of 2025 revenue.


Mounjaro revenue outside US was $5.15bn in Q2 2026 against $1.90bn a year earlier and exceeded US Mounjaro revenue of $4.79bn for a second quarter. Trulicity revenue was $4.28bn in 2025 against $7.44bn in 2022. Jardiance revenue of $1.23bn in Q2 2026 includes a sales based milestone of $250m from Boehringer Ingelheim. Foundayo (orforglipron), a pill approved for obesity by US Food and Drug Administration (FDA) in April 2026, had revenue of $98m in Q2.
| Table 1. Revenue by product by quarter, $bn | ||||||||
|---|---|---|---|---|---|---|---|---|
| Product | Q3 2024 | Q4 2024 | Q1 2025 | Q2 2025 | Q3 2025 | Q4 2025 | Q1 2026 | Q2 2026 |
| Mounjaro | 3.11 | 3.53 | 3.84 | 5.20 | 6.52 | 7.41 | 8.66 | 9.94 |
| Zepbound | 1.26 | 1.91 | 2.31 | 3.38 | 3.59 | 4.26 | 4.16 | 4.93 |
| Verzenio | 1.37 | 1.56 | 1.16 | 1.49 | 1.47 | 1.60 | 1.30 | 1.47 |
| Jardiance | 0.69 | 1.20 | 1.01 | 0.69 | 0.96 | 0.77 | 1.11 | 1.23 |
| Trulicity | 1.30 | 1.25 | 1.09 | 1.09 | 1.05 | 1.04 | 0.92 | 1.22 |
| Taltz | 0.88 | 0.95 | 0.76 | 0.85 | 0.90 | 1.05 | 0.73 | 0.86 |
| Other products and collaboration revenue | 2.83 | 3.14 | 2.54 | 2.86 | 3.12 | 3.16 | 2.91 | 3.32 |
| Total revenue | 11.44 | 13.53 | 12.73 | 15.56 | 17.60 | 19.29 | 19.80 | 22.97 |
| US | 7.81 | 9.03 | 8.49 | 10.81 | 11.30 | 12.88 | 12.12 | 14.41 |
| Outside US | 3.63 | 4.50 | 4.24 | 4.74 | 6.30 | 6.41 | 7.68 | 8.56 |
| Revenue growth against prior year | 20.4% | 44.7% | 45.2% | 37.6% | 53.9% | 42.6% | 55.5% | 47.7% |
| Mounjaro and Zepbound, % of revenue | 38.2% | 40.2% | 48.3% | 55.1% | 57.4% | 60.5% | 64.8% | 64.7% |
| Table 2. Q2 2026 revenue by product, US and outside US, $bn | ||||
|---|---|---|---|---|
| Product | US | Change | Outside US | Change |
| Mounjaro | 4.79 | 45.1% | 5.15 | 171.6% |
| Zepbound | 4.87 | 44.2% | 0.06 | n/a |
| Verzenio | 0.84 | (9.0%) | 0.63 | 12.3% |
| Jardiance | 0.62 | 61.3% | 0.61 | 99.7% |
| Trulicity | 0.91 | 22.0% | 0.31 | (10.3%) |
| Taltz | 0.54 | (1.8%) | 0.32 | 6.0% |
| Other | 1.84 | 20.5% | 1.48 | 11.4% |
| Total | 14.41 | 33.3% | 8.56 | 80.5% |
| Table 3. Revenue by geography, $bn | |||||
|---|---|---|---|---|---|
| Region | 2023 | 2024 | 2025 | Q2 2026 | Share of Q2 2026 |
| United States | 21.79 | 30.38 | 43.48 | 14.41 | 62.7% |
| Europe | 6.17 | 6.92 | 11.56 | 4.12 | 17.9% |
| China | 1.54 | 1.66 | 1.95 | 0.94 | 4.1% |
| Japan | 1.67 | 1.81 | 2.13 | 0.63 | 2.7% |
| Rest of world | 2.95 | 4.27 | 6.06 | 2.88 | 12.5% |
| Total | 34.12 | 45.04 | 65.18 | 22.97 | 100.0% |
2 Financial Analysis & Ratios
Gross margin was 85.8% in Q2 2026 against 84.3% in Q2 2025; 10-Q cites improved cost of production and product mix, partly offset by lower realized prices. R&D expense rose 14% and marketing, selling and administrative expense rose 25% while revenue rose 48%. Gross margin less those two expense lines, which company calls performance margin, was 54.2% of revenue against 45.1%. Operating income rose 31% after acquired IPR&D charges of $2.78bn and special charges of $703m.
| Table 4. What changed: Q2 2026 and H1 against prior year, $bn | ||||||
|---|---|---|---|---|---|---|
| Line | Q2 2026 | Q2 2025 | Change | H1 2026 | H1 2025 | Change |
| Revenue | 22.97 | 15.56 | 47.7% | 42.77 | 28.29 | 51.2% |
| US | 14.41 | 10.81 | 33.3% | 26.53 | 19.30 | 37.5% |
| Outside US | 8.56 | 4.74 | 80.5% | 16.24 | 8.98 | 80.8% |
| Mounjaro | 9.94 | 5.20 | 91.2% | 18.61 | 9.04 | 105.8% |
| Zepbound | 4.93 | 3.38 | 45.8% | 9.09 | 5.69 | 59.6% |
| Gross margin | 19.71 | 13.11 | 50.3% | 35.93 | 23.61 | 52.1% |
| R&D expense | 3.82 | 3.34 | 14.5% | 7.33 | 6.07 | 20.7% |
| Marketing, selling and administrative | 3.43 | 2.75 | 24.6% | 6.36 | 5.22 | 21.9% |
| Acquired IPR&D | 2.78 | 0.15 | n/a | 3.36 | 1.73 | 94.7% |
| Asset impairment, restructuring and other special charges | 0.70 | 0.00 | n/a | 0.98 | 0.04 | n/a |
| Operating income | 8.98 | 6.87 | 30.7% | 17.89 | 10.56 | 69.4% |
| Net income | 7.09 | 5.66 | 25.3% | 14.49 | 8.42 | 72.1% |
| Diluted EPS, $ | 7.94 | 6.29 | 26.2% | 16.19 | 9.35 | 73.2% |
| Adjusted EPS, $ | 8.38 | 6.31 | 32.8% | 16.94 | 9.65 | 75.5% |
| Operating cash flow | 10.69 | 3.09 | 246.3% | 16.02 | 4.75 | 237.1% |
| Capital expenditures | 2.93 | 1.70 | 72.8% | 5.26 | 3.21 | 64.0% |
| Free cash flow | 7.76 | 1.39 | 458.1% | 10.76 | 1.55 | 596.2% |
| Gross margin, % of revenue | 85.8% | 84.3% | 1.5 pts | 84.0% | 83.5% | 0.5 pts |
| Performance margin | 54.2% | 45.1% | 9.1 pts | 52.0% | 43.6% | 8.4 pts |
| Effective tax rate | 23.3% | 16.5% | 6.8 pts | 19.9% | 17.7% | 2.2 pts |


| Table 5. Five year financial summary, $bn | ||||||
|---|---|---|---|---|---|---|
| Calendar year | 2021 | 2022 | 2023 | 2024 | 2025 | TTM |
| Revenue | 28.32 | 28.54 | 34.12 | 45.04 | 65.18 | 79.67 |
| Gross margin | 21.01 | 21.91 | 27.04 | 36.62 | 54.13 | 66.44 |
| R&D expense | 6.93 | 7.19 | 9.31 | 10.99 | 13.34 | 14.60 |
| Marketing, selling and administrative | 6.43 | 6.44 | 7.40 | 8.59 | 11.09 | 12.24 |
| Acquired IPR&D | 0.97 | 0.91 | 3.80 | 3.28 | 2.91 | 4.54 |
| Operating income | 6.36 | 7.13 | 6.46 | 12.90 | 26.30 | 33.63 |
| Net income | 5.58 | 6.24 | 5.24 | 10.59 | 20.64 | 26.71 |
| Diluted EPS, $ | 6.12 | 6.90 | 5.80 | 11.71 | 22.95 | 29.79 |
| Dividends declared per share, $ | 3.53 | 4.07 | 4.69 | 5.40 | 6.23 | 6.69 |
| Depreciation and amortization | 1.55 | 1.52 | 1.53 | 1.77 | 2.00 | 2.10 |
| Operating cash flow | 7.37 | 7.59 | 4.24 | 8.82 | 16.81 | 28.08 |
| Capital expenditures | 1.31 | 1.85 | 3.45 | 5.06 | 7.84 | 9.89 |
| Free cash flow | 6.06 | 5.73 | 0.79 | 3.76 | 8.97 | 18.19 |
| Purchases of IPR&D and cash paid for acquisitions | 1.42 | 1.46 | 4.99 | 4.29 | 3.67 | 15.10 |
| Share repurchases | 1.25 | 1.50 | 0.75 | 2.50 | 4.11 | 6.17 |
| Dividends paid | 3.09 | 3.54 | 4.07 | 4.68 | 5.38 | 5.79 |
| Cash and short term investments | 3.91 | 2.21 | 2.93 | 3.42 | 7.27 | 8.95 |
| Inventories | 3.89 | 4.31 | 5.77 | 7.59 | 13.74 | 16.79 |
| Property and equipment, net | 8.99 | 10.14 | 12.91 | 17.10 | 24.68 | 29.29 |
| Goodwill and other intangibles | 11.58 | 11.28 | 11.85 | 11.94 | 12.42 | 26.96 |
| Total assets | 48.81 | 49.49 | 64.01 | 78.72 | 112.48 | 142.28 |
| Sales rebates and discounts liability | 6.85 | 8.78 | 11.69 | 11.54 | 17.38 | 21.12 |
| Total debt | 16.88 | 16.24 | 25.23 | 33.64 | 42.50 | 54.91 |
| Shareholders' equity | 8.98 | 10.65 | 10.77 | 14.27 | 26.54 | 33.88 |


Capital expenditures were 12.4% of revenue in four quarters to June 2026 against 4.6% in 2021, and net property and equipment rose from $8.99bn to $29.29bn. Inventories rose from $5.77bn at end of 2023 to $16.79bn, equal to 463 days of cost of sales. Liability for sales rebates and discounts was $21.12bn, 27% of trailing revenue; 10-K states that a 5% change in that liability at end of 2025 would change revenue by about $897m.
| Table 6. Ratio analysis | ||||||
|---|---|---|---|---|---|---|
| Ratio | 2021 | 2022 | 2023 | 2024 | 2025 | TTM |
| Growth and mix | ||||||
| Revenue growth | n/a | 0.8% | 19.6% | 32.0% | 44.7% | 49.6% |
| Mounjaro and Zepbound, share of revenue | 0.0% | 1.7% | 15.6% | 36.6% | 56.0% | 62.1% |
| Margin | ||||||
| Gross margin | 74.2% | 76.8% | 79.2% | 81.3% | 83.0% | 83.4% |
| Performance margin | 27.0% | 29.0% | 30.3% | 37.8% | 45.6% | 49.7% |
| Operating margin | 22.4% | 25.0% | 18.9% | 28.6% | 40.4% | 42.2% |
| Net margin | 19.7% | 21.9% | 15.4% | 23.5% | 31.7% | 33.5% |
| R&D to revenue | 24.5% | 25.2% | 27.3% | 24.4% | 20.5% | 18.3% |
| Marketing, selling and administrative to revenue | 22.7% | 22.6% | 21.7% | 19.1% | 17.0% | 15.4% |
| Acquired IPR&D to revenue | 3.4% | 3.2% | 11.1% | 7.3% | 4.5% | 5.7% |
| Effective tax rate | 9.3% | 8.3% | 20.0% | 16.5% | 19.8% | 20.5% |
| Return | ||||||
| Return on average equity | n/a | 63.6% | 48.9% | 84.6% | 101.2% | 102.4% |
| Operating income to average debt plus equity | n/a | 27.0% | 20.5% | 30.7% | 45.0% | 45.8% |
| Cash | ||||||
| Free cash flow margin | 21.4% | 20.1% | 2.3% | 8.3% | 13.8% | 22.8% |
| Free cash flow per share, $ | 6.64 | 6.34 | 0.88 | 4.16 | 9.98 | 20.35 |
| Capital expenditures to revenue | 4.6% | 6.5% | 10.1% | 11.2% | 12.0% | 12.4% |
| Buybacks and dividends to free cash flow | 72% | 88% | 608% | 191% | 106% | 66% |
| Leverage and liquidity | ||||||
| Debt to equity, times | 1.88 | 1.52 | 2.34 | 2.36 | 1.60 | 1.62 |
| Net debt to EBITDA, times | 1.64 | 1.62 | 2.79 | 2.06 | 1.25 | 1.29 |
| Operating income to interest expense, times | 18.7 | 21.5 | 13.3 | 16.5 | 29.4 | n/a |
| Current ratio, times | 1.23 | 1.05 | 0.94 | 1.15 | 1.58 | 1.35 |
| Efficiency | ||||||
| Days of inventory | 194 | 237 | 298 | 329 | 454 | 463 |
| Days sales outstanding | 86 | 88 | 97 | 89 | 99 | 92 |
| Sales rebates and discounts liability to revenue | 24.2% | 30.8% | 34.3% | 25.6% | 26.7% | 26.5% |
| Revenue to average total assets, times | n/a | 0.58 | 0.60 | 0.63 | 0.68 | 0.66 |


3 MD&A & Management Commentary
10-Q for Q2 2026 attributes revenue growth to volume, led by Mounjaro and Zepbound, partly offset by lower realized prices. It states that near term results depend on timing of further approvals for orforglipron and on uptake in new channels, among them Medicare, US federal health insurance for people aged 65 and over, and that volume swings from channel dynamics can have a disproportionate effect in any period. On 5 August 2026 call, management said H2 lacks rebate estimate adjustments and sales milestones that helped H1, and reported that Lilly medicines were about 60% of US prescriptions in Q2 for incretin medicines, company's term for class that includes Mounjaro, Zepbound and Trulicity.
| Table 7. Full year guidance against reported results | |||||
|---|---|---|---|---|---|
| Year | Issued | Revenue, $bn | Adjusted EPS, $ | Performance margin | Comparison |
| 2025 | 30 Oct 2025 | 63.0 to 63.5 | 23.00 to 23.70 | 45.0% to 46.0% | Reported: revenue 65.18, adjusted EPS 24.21 |
| 2026 | 4 Feb 2026 | 80 to 83 | 33.50 to 35.00 | 46.0% to 47.5% | Tax rate 18% to 19% |
| 2026 | 30 Apr 2026 | 82 to 85 | 35.50 to 37.00 | 47.0% to 48.5% | After Q1 revenue of 19.80 |
| 2026 | 5 Aug 2026 | 85 to 87 | 35.50 to 36.50 | 49.0% to 50.5% | H1 reported: revenue 42.77, adjusted EPS 16.94 |
| Table 8. Pricing agreements and government programs as filed | |
|---|---|
| Item | Disclosure |
| US government agreements | Finalized in Q1 2026: lower prices for Medicaid (joint federal and state health program for people on low incomes) and certain other prices; new medicines to launch with more balanced pricing across developed nations (10-Q) |
| Medicare Bridge program | Medicare beneficiaries have access to discounted Lilly obesity medicines from 1 July 2026 to 31 December 2027; state Medicaid programs may opt in. 10-Q describes uptake as unknown |
| Inflation Reduction Act | Law of 2022 under which US government sets Medicare prices for selected medicines: Jardiance from 2026; Trulicity and Verzenio from 2028 (10-Q) |
| China reimbursement list | Mounjaro added in Q1 2026; realized price outside US fell 25% in Q1 and 36% in Q2 (10-Q) |
| US realized price | Down 7% in Q1 and 3% in Q2; about 9% in Q2 before changes to rebate estimates (8-K). Cash pay prices for Zepbound were reduced (10-Q) |
| Tariffs | Lilly and pharmaceuticals are exempt from certain tariffs; 10-Q states exemptions may expire or be terminated |
| Table 9. Pipeline and recent approvals with regulatory status as filed | |||
|---|---|---|---|
| Medicine | Indication as filed | Status | Source |
| Orforglipron (Foundayo) | Obesity | FDA approval April 2026; launched in US in Q2 2026; submitted in European Union (EU) and Japan | 10-Q Q1 and Q2 2026 |
| Orforglipron | Type 2 diabetes | Submitted in US, EU and Japan | 10-Q Q2 2026 |
| Retatrutide | Obesity; type 2 diabetes | Phase 3 (late stage clinical trials); 10-Q lists company announcements of trial results. Application to FDA planned for Q1 2027 for obesity, obstructive sleep apnea and knee osteoarthritis pain (8-K) | 10-Q Q2 2026; 8-K 5 Aug 2026 |
| Tirzepatide | Cardiovascular outcomes in type 2 diabetes | Submitted in US | 10-K 2025 |
| Insulin efsitora alfa | Type 2 diabetes | Submitted in US, EU and Japan (10-K); positive opinion from European Medicines Agency committee (10-Q) | 10-K 2025; 10-Q Q2 2026 |
| Eloralintide | Obesity | Phase 3 trials started | 10-K 2025; 10-Q Q2 2026 |
| Imlunestrant (Inluriyo) | Breast cancer, defined subtype | Approved in US, EU and Japan; Q2 2026 revenue $75m | 10-K 2025; 8-K 5 Aug 2026 |
4 Sector & Competitor Analysis
Morgan Stanley Research, research unit of an investment bank, put 2025 sales of incretin medicines for diabetes and obesity at $79bn and forecast $190bn for 2035, within a range of $170bn to $240bn (22 April 2026). Lilly's tirzepatide revenue of $36.5bn in 2025 equals 46% of that 2025 figure. IQVIA, a health data company that counts sales before manufacturer rebates, reported $132bn for the class in 2025, up 33.5%. Novo Nordisk reported H1 2026 adjusted sales down 2% in Danish kroner (DKK), with obesity care sales up 19% at constant exchange rates, and guides to 2026 adjusted sales growth of 0% to (6)% at constant exchange rates; Lilly revenue rose 51% in same period. Peer comparison uses margin after R&D and selling, general and administrative expense (SG&A).


| Table 10. Eli Lilly against seven pharmaceutical peers, fiscal 2025 | ||||||||||||
|---|---|---|---|---|---|---|---|---|---|---|---|---|
| Company | Revenue | Growth | Growth, H1 2026 | Gross margin | R&D to revenue | Margin after R&D and SG&A | Pretax margin | Capital expenditures to revenue | Free cash flow margin | Net debt | Market value | Forward P/E |
| Eli Lilly | $65.2bn | 44.7% | 51.2% | 83.0% | 20.5% | 45.6% | 39.5% | 12.0% | 13.8% | $35.2bn | $1.08tn | 27.4 |
| Novo Nordisk | DKK 309.1bn | 6.4% | 13.1% | 81.0% | 16.8% | 41.4% | 42.2% | 19.5% | 19.1% | DKK 104.5bn | $162bn | 11.6 |
| Pfizer | $62.6bn | (1.6%) | 3.9% | 74.3% | 16.7% | 35.6% | 12.0% | 4.2% | 14.5% | $51.2bn | $157bn | 9.9 |
| Merck | $65.0bn | 1.3% | 5.0% | 74.8% | 24.3% | 34.0% | 32.4% | 6.3% | 19.0% | $34.8bn | $350bn | 16.4 |
| AbbVie | $61.2bn | 8.6% | 11.2% | 70.2% | 14.9% | 32.5% | 10.8% | 2.0% | 29.1% | $62.2bn | $471bn | 17.6 |
| J&J | $94.2bn | 6.0% | 8.2% | 67.9% | 15.6% | 27.2% | 34.6% | 5.1% | 20.9% | $27.8bn | $614bn | 23.1 |
| Amgen | $36.8bn | 10.0% | 7.8% | 67.2% | 19.8% | 28.3% | 24.4% | 5.1% | 22.0% | $45.5bn | $218bn | 17.2 |
| AstraZeneca | $58.7bn | 8.6% | 9.4% | 81.9% | 24.2% | 23.7% | 21.1% | 4.8% | 20.0% | $22.1bn | $250bn | 14.7 |

| Table 11. Incretin indicators disclosed by Lilly and Novo Nordisk | |||
|---|---|---|---|
| Company | Indicator | Latest | Source |
| Lilly | Tirzepatide revenue, H1 2026 | $27.7bn, up 88% on H1 2025 | 10-Q |
| Lilly | Orforglipron (Foundayo) revenue, Q2 2026 | $98m | 8-K |
| Novo Nordisk | Obesity care adjusted sales, H1 2026 | DKK 44.1bn, up 19% at constant rates | 6-K |
| Novo Nordisk | Wegovy pill sales, H1 2026 | DKK 5.5bn | 6-K |
| Novo Nordisk | Adjusted gross margin, H1 2026 | 79.3% against 83.1% | 6-K |
Lilly's margin after R&D and SG&A of 45.6% in 2025 was highest in group; its capital expenditures of 12.0% of revenue compare with 19.5% at Novo Nordisk and 6.3% at Merck. A share bought at end of October 2021 was worth 475 at end of September 2026 on a base of 100, against 136 for a US health care sector fund, dividends included in both.
5 Material Events & Contracts
| Table 12. Form 8-K filings, 1 October 2025 to 6 October 2026 | |||
|---|---|---|---|
| Filed | Item | Event | Accession number |
| 30 Oct 2025 | 2.02 | Q3 2025 revenue $17.60bn, EPS $6.21, adjusted EPS $7.02. 2025 guidance raised. New plants announced in Virginia ($5bn) and Texas ($6.5bn); Puerto Rico expansion of more than $1.2bn. | 0000059478-25-000251 |
| 21 Nov 2025 | 5.02 | Carolyn Bertozzi elected to board from 8 December 2025. | 0000059478-25-000271 |
| 4 Feb 2026 | 2.02 | Q4 2025 revenue $19.29bn, EPS $7.39. 2026 guidance issued. Agreement with US government on access to obesity medicines. Plants announced in Alabama ($6bn), Europe ($3bn) and Pennsylvania. | 0000059478-26-000008 |
| 30 Apr 2026 | 2.02 | Q1 2026 revenue $19.80bn, EPS $8.26, adjusted EPS $8.55. Guidance raised. FDA approval of Foundayo (orforglipron) for obesity. | 0000059478-26-000043 |
| 7 May 2026 | 5.07 | Annual meeting voting results. | 0000059478-26-000048 |
| 20 May 2026 | 8.01 | $9.0bn of notes issued in eight series due 2028 to 2066, at fixed rates of 4.150% to 5.700% and two floating rate series. | 0001193125-26-232707 |
| 5 Aug 2026 | 2.02 | Q2 2026 revenue $22.97bn, EPS $7.94, adjusted EPS $8.38. Guidance raised to revenue of $85bn to $87bn. Additional $4.5bn committed to Indiana manufacturing sites. | 0000059478-26-000077 |
| Table 13. Acquisitions in 2026 as filed, $bn | |||||
|---|---|---|---|---|---|
| Target | Date | Value or charge | Cash paid, net | Maximum contingent payments | Field |
| Centessa Pharmaceuticals | 24 Jun 2026 | 6.59 | 5.96 | 1.54 | Sleep and wake disorders |
| Kelonia Therapeutics | 25 Jun 2026 | 4.90 | 3.09 | 3.75 | Cell therapy |
| Ventyx Biosciences | 4 Mar 2026 | 1.18 | 1.06 | n/a | Inflammatory diseases |
| Orna Therapeutics | May 2026 | 1.23 | n/a | n/a | Cell therapy, autoimmune |
| Ajax Therapeutics | Jun 2026 | 0.91 | n/a | n/a | Blood cancers |
| Three infectious disease companies | Jul 2026 | Up to 3.9 | About 2.0 | n/a | Infectious disease |
| AtaiBeckley (pending) | n/a | n/a | About 2.8 | n/a | Mental health |
| Table 14. Material contracts and commitments | |
|---|---|
| Contract | Terms as filed |
| Debt | Total debt $54.91bn at 30 June 2026: $7.05bn short term and current, $47.86bn long term. $10.1bn of committed credit facilities unused. |
| Supply agreements | Contract manufacturing and supply agreements for medicines in development could require up to about $10bn if specified purchases are not made, over terms of up to 8 years (10-K). |
| Manufacturing | Sites announced since October 2025: Texas $6.5bn, Alabama $6bn, Virginia $5bn, Indiana additional $4.5bn, Europe $3bn, Puerto Rico more than $1.2bn (8-K exhibits). |
| Boehringer Ingelheim | Jardiance family stays in collaboration to 31 December 2028; up to $410m of further sales based milestones available in 2026. |
| Buyback authorization | $15bn program of December 2024; $6.99bn remaining at 30 June 2026 after $3.96bn repurchased in H1. |
6 Ownership, Voting Power & Annual Meeting
941.4m common shares were outstanding at 3 August 2026 (10-Q cover), and market value in this report uses that count. Diluted weighted average shares used for EPS were 893.7m in Q2 2026; difference of 47.7m compares with 50.0m shares held in employee benefit trust at end of 2025 (10-K). Market data pages show 891.4m shares and a value of $1.03tn. Each share carries one vote. Lilly Endowment, a private foundation, held 90.4m shares, 9.6%, at 30 June 2026. At annual meeting of 4 May 2026, 847.3m shares voted, about 90% of shares outstanding, and four directors were elected to terms ending in 2029 with 726.3m to 761.9m votes for.
| Table 15. 2026 annual meeting: votes on proposals, m shares | |||||
|---|---|---|---|---|---|
| Proposal | Proponent | For | Against | For, % of cast | Outcome |
| Advisory vote on executive pay | Board | 732.0 | 30.5 | 96.0% | Approved |
| Ratify Ernst & Young as auditor for 2026 | Board | 802.7 | 43.5 | 94.9% | Approved |
| Amend articles to end classified board | Board | 665.4 | 97.7 | 87.2% | Below required 80% of shares outstanding |
| Amend articles to end supermajority voting | Board | 664.5 | 98.6 | 87.1% | Below required 80% of shares outstanding |
| Require independent board chair | Shareholder | 257.3 | 505.1 | 33.7% | Defeated |
| Annual lobbying report | Shareholder | 113.4 | 645.4 | 14.9% | Defeated |
| Table 16. Largest holders of Lilly common stock, latest filings | |||
|---|---|---|---|
| Holder | Shares, m | Form and date | % of shares |
| Lilly Endowment | 90.4 | 13G/A, 30 Jun 2026 | 9.6% |
| BlackRock | 67.5 | 13F, 30 Jun 2026 | 7.2% |
| Vanguard Capital Management | 61.3 | 13G, 31 Mar 2026 | 6.5% |
| PNC Financial Services | 51.3 | 13F, 30 Jun 2026 | 5.5% |
| State Street | 36.2 | 13F, 30 Jun 2026 | 3.8% |
| FMR (Fidelity) | 28.5 | 13F, 30 Jun 2026 | 3.0% |
| Capital Research Global Investors | 20.9 | 13F, 30 Jun 2026 | 2.2% |
| Geode Capital Management | 20.3 | 13F, 30 Jun 2026 | 2.2% |
| Capital World Investors | 15.9 | 13F, 30 Jun 2026 | 1.7% |
| T. Rowe Price | 13.9 | 13F, 30 Jun 2026 | 1.5% |
7 Insider Activity
Lilly Endowment, a holder of 9.6%, sold 2.79m shares for about $2.77bn between 7 October 2025 and 6 May 2026. Four officers sold 17,000 shares for about $19.8m. All five officer sale filings cite Rule 10b5-1 plans, which set trades in advance, and open market purchases reported in period were zero. 126 Forms 4 were filed by 27 reporting persons.
| Table 17. Open market sales reported on Forms 4, 12 months to 6 October 2026 | |||||
|---|---|---|---|---|---|
| Person | Role | Shares sold | Proceeds | Average price, $ | Dates |
| Lilly Endowment | Holder of 9.6% | 2.79m | $2.77bn | 989.86 | 7 Oct 2025 to 6 May 2026 |
| Patrik Jonsson | Executive vice president; president, Lilly International | 6,500 | $7.6m | 1,175.10 | 17 Aug 2026 |
| Anat Hakim | Executive vice president, general counsel | 5,000 | $6.0m | 1,190.00 | 7 Aug 2026 |
| Donald Zakrowski | Senior vice president, chief accounting officer | 3,000 | $3.4m | 1,126.84 | 13 Nov 2025 and 10 Aug 2026 |
| Ilya Yuffa | Executive vice president; president, Lilly USA | 2,500 | $2.9m | 1,150.77 | 10 Jun 2026 |
8 Risk Factors
10-Q for Q2 2026 reports no material change to risk factors in 2025 10-K. Table lists disclosed risks with figures from both filings.
| Table 18. Disclosed risks and changes since 2025 10-K | ||
|---|---|---|
| Risk | Disclosure with figures | Change in 2026 filings |
| Product concentration | Mounjaro and Zepbound were 56% of 2025 revenue. 10-K states that incretin volume swings can have a disproportionate effect on results in any period. | 65% of H1 2026 revenue. |
| Pricing and government programs | US realized price fell 10% in 2025. US rebate, discount and return liabilities rose from $10.31bn to $15.15bn in 2025, with $62.14bn deducted from sales. | US price down 7% in Q1 and 3% in Q2 2026; Medicare Bridge program from 1 July 2026. |
| Government price setting | Jardiance price set from 2026. 10-K expects other major products to be selected in future years. | Trulicity and Verzenio selected in January 2026, effective 2028. |
| Patents and generic challenges | Tirzepatide compound patent expires in 2036 in US; US data protection ends in 2027. Trulicity compound patent expires in 2027. | Generic applications for tirzepatide notified in July 2026; Verzenio application notified in April 2026. |
| Manufacturing and supply | Capital expenditures were $7.84bn in 2025. 10-K cites reliance on complex supply chains and on new plants coming online. | $5.26bn in H1 2026; inventories $16.79bn. |
| Research and acquisitions | 10-K states a high rate of failure in drug development and that some acquired IPR&D assets are likely to become impaired. | $11.73bn of IPR&D intangibles added in H1; intangibles $18.11bn at 30 June 2026. |
| Debt | Total debt $42.50bn at end of 2025 against $16.88bn at end of 2021. | $54.91bn at 30 June 2026 after $9.0bn of notes in May 2026. |
| Litigation | 10-K lists cases on insulin pricing, on 340B program (federal drug discounts for certain hospitals and clinics) and on incretin product liability; Lilly is largely self insured for product liability. | Special charges in H1 2026 include litigation charges. |
9 Stock Price, Scenarios & Sensitivity
Three cases cover 2027 to 2029 on adjusted EPS. All start from 2026 revenue of $86.0bn and adjusted EPS of $36.00, midpoints of company guidance of 5 August 2026; analyst consensus for 2026 is $88.5bn and $36.95. Base case revenue of $106.6bn in 2028 and $117.0bn in 2029 equals analyst consensus of $106.6bn (22 analysts) and $117.0bn (15 analysts). Worst case holds revenue flat in 2028 and lowers adjusted performance margin to 44%, against company's adjusted guidance of 45.0% to 46.0% for 2025 and 49.0% to 50.5% for 2026. Best case reaches 55%, against 54.8% that management gave on adjusted basis for Q2 2026 (call), and 2029 revenue of $126.1bn, above top of analyst range of $125.2bn. Company guidance extends to 2026 only. Each case is an estimate under assumptions in table below.
| Table 19. Scenario assumptions and results, 2027 to 2029 | ||||||||||
|---|---|---|---|---|---|---|---|---|---|---|
| Worst case | Base case | Best case | ||||||||
| 2026E | 2027 | 2028 | 2029 | 2027 | 2028 | 2029 | 2027 | 2028 | 2029 | |
| Assumptions | ||||||||||
| Revenue growth | 31.9% | 5.0% | 0.0% | 2.0% | 12.5% | 10.2% | 9.7% | 18.0% | 13.0% | 10.0% |
| Performance margin, adjusted | 49.75% | 46.0% | 44.0% | 44.0% | 50.0% | 50.5% | 51.0% | 52.0% | 53.5% | 55.0% |
| Acquired IPR&D, % of revenue | 3.9% | 4.0% | 4.0% | 4.0% | 2.5% | 2.5% | 2.5% | 2.0% | 2.0% | 2.0% |
| Net other expense, $bn | n/a | 1.5 | 1.5 | 1.5 | 1.0 | 1.0 | 1.0 | 0.5 | 0.5 | 0.5 |
| Tax rate | 18.5% | 21% | 21% | 21% | 19% | 19% | 19% | 18% | 18% | 18% |
| Diluted shares, m | 894 | 890 | 890 | 890 | 890 | 885 | 880 | 885 | 875 | 865 |
| Capital expenditures to revenue | n/a | 14% | 11% | 9% | 13% | 11% | 9% | 13% | 11% | 9% |
| Results | ||||||||||
| Revenue, $bn | 86.0 | 90.3 | 90.3 | 92.1 | 96.8 | 106.6 | 117.0 | 101.5 | 114.7 | 126.1 |
| Gross margin less R&D and selling expense, $bn | 42.8 | 41.5 | 39.7 | 40.5 | 48.4 | 53.8 | 59.6 | 52.8 | 61.3 | 69.4 |
| Net income, adjusted, $bn | 32.2 | 28.8 | 27.3 | 27.9 | 36.4 | 40.6 | 45.1 | 41.2 | 48.0 | 54.4 |
| Adjusted EPS, $ | 36.00 | 32.33 | 30.73 | 31.37 | 40.92 | 45.92 | 51.29 | 46.55 | 54.88 | 62.90 |
| Free cash flow per share, $ | n/a | 20.99 | 23.40 | 25.54 | 28.42 | 34.85 | 41.76 | 32.38 | 42.18 | 52.31 |
| Price to earnings multiple applied, times | 18 | 26 | 30 | |||||||
| Implied value per share, $ | 1,143.12 | 565 | 1,334 | 1,887 | ||||||


Critical factors behind best case
| Table 20. Critical factors, evidence and best case assumption | |||
|---|---|---|---|
| Factor | Evidence in filings and company statements | Best case assumes | Indicator |
| Volume growth | Volume rose 60% in Q2 2026. Morgan Stanley Research forecasts incretin sales of $190bn in 2035 against $79bn in 2025. | Revenue growth of 18%, 13% and 10%; 2029 revenue $126.1bn | Volume and price components in each 10-Q |
| Realized price | Realized price fell 13% in Q2 2026; management guided in February 2026 to a price drag in low to mid teens % for 2026 (call). | Price declines slow after 2026 | US price change in each earnings release |
| Orforglipron and retatrutide | Foundayo revenue was $98m in its first quarter. Submissions for type 2 diabetes are filed; retatrutide application is planned for Q1 2027. | Launches add to tirzepatide revenue | Regulatory decisions; product revenue lines |
| Medicare and Medicaid access | Medicare Bridge program began on 1 July 2026 and runs to end of 2027; management reported volume about doubling within a month (call). | Access continues after 2027 | Outcome of talks with Medicare agency cited in 10-Q |
| Margin | Adjusted performance margin was 54.8% in Q2 2026 and 50.0% in Q1 2026 (calls); guidance for 2026 is 49.0% to 50.5%. | 52% in 2027 rising to 55% in 2029 | Gross margin and expense ratios each quarter |
| Manufacturing capacity | Capital expenditures were $9.89bn in four quarters to June 2026; 10-K expects added capacity to come online over several years. | Supply meets demand in each year | Capital expenditures and inventories |
Sensitivity of base case


| Table 21. Base case 2029 adjusted EPS of $51.29: effect of each input | |||
|---|---|---|---|
| Input and range | At low end, $ | At high end, $ | Change from base, $ |
| Performance margin, 3 points either way | 48.06 | 54.52 | (3.23) to 3.23 |
| Revenue growth, 3 points lower or higher | 47.17 | 55.65 | (4.13) to 4.36 |
| Acquired IPR&D, 5% to 0% of revenue | 48.60 | 53.98 | (2.69) to 2.69 |
| Tax rate, 21% to 17% | 50.03 | 52.56 | (1.27) to 1.27 |
| Diluted shares, 2% higher or lower | 50.29 | 52.34 | (1.01) to 1.05 |
Alternative views
- Range of analyst estimates: Consensus for 2028 is revenue of $106.6bn and EPS of $49.14 within $43.23 to $56.41; for 2029, revenue of $117.0bn within $107.3bn to $125.2bn and EPS of $55.27. Base case EPS is $45.92 for 2028 and $51.29 for 2029. Base case deducts acquired IPR&D at 2.5% of revenue; company guidance excludes acquired IPR&D after its date of issue. With that charge at zero, base case 2029 EPS is $53.98. Quarterly estimates from five analysts sum to 2027 revenue of $91.7bn, below base case $96.8bn.
- Price targets: Average target of 30 analysts is $1,329, within $930 to $1,600. Base case implied value of $1,334 refers to 2029 earnings.
- Management view: 2026 revenue guidance rose from $80bn to $83bn in February to $82bn to $85bn in April and $85bn to $87bn in August; adjusted EPS guidance moved from $33.50 to $35.00 to $35.50 to $37.00 and then $35.50 to $36.50. Management told August call that dollar growth continues in H2. Guidance midpoint implies H2 revenue of $43.2bn, 1.1% above H1; analyst consensus for 2026 of $88.5bn is above top of guided range.
- Price and competition: Realized prices fell 13% in each of last two quarters. Novo Nordisk reported lower realized prices and adjusted gross margin of 79.3% against 83.1% in H1 2026. Worst case applies flat revenue in 2028, year when Medicare Bridge program has ended and government prices for Trulicity and Verzenio take effect.
- Valuation: Shares trade at 31.8 times guidance midpoint for calendar 2026 and 27.4 times in market data, which implies EPS of about $42.19 for 12 months ahead. Base case applies 26 times to 2029 adjusted EPS; at 22 times implied value is $1,128 and at 30 times $1,539. Peers in section 4 trade at 9.9 to 23.1 times forward earnings.
Sources
SEC filings, retrieved through sec-api.io: 10-K 2021 0000059478-22-000068, 10-K 2022 0000059478-23-000082, 10-K 2023 0000059478-24-000065, 10-Q Q1 2024 0000059478-24-000118, 10-Q Q2 2024 0000059478-24-000187, 10-Q Q3 2024 0000059478-24-000245, 10-K 2024 0000059478-25-000067, 10-Q Q1 2025 0000059478-25-000132, 10-Q Q2 2025 0000059478-25-000204, 10-Q Q3 2025 0000059478-25-000254, 10-K 2025 0000059478-26-000013, 10-Q Q1 2026 0000059478-26-000045, 10-Q Q2 2026 0000059478-26-000081, 8-K Q3 2025 0000059478-25-000251, 8-K Q4 2025 0000059478-26-000008, 8-K Q1 2026 0000059478-26-000043, 8-K Q2 2026 0000059478-26-000077. Forms 8-K, DEF 14A, Schedule 13G/A, 13F and Forms 4 as cited in tables. Peer filings: Novo Nordisk 20-F 0000353278-26-000012 and 6-K 0000353278-26-000023; Pfizer 10-K 0000078003-26-000026 and 10-Q 0000078003-26-000095; Merck 10-K 0000310158-26-000063 and 10-Q 0000310158-26-000212; AbbVie 10-K 0001551152-26-000008 and 10-Q 0001551152-26-000026; J&J 10-K 0000200406-26-000016 and 10-Q 0000200406-26-000153; Amgen 10-K 0000318154-26-000010 and 10-Q 0000318154-26-000126; AstraZeneca 20-F 0001104659-26-019130 and 6-K 0001104659-26-086846.
Company statements outside SEC filings: Earnings call transcripts of 30 October 2025, 4 February 2026, 30 April 2026 and 5 August 2026, read from public transcript pages and paraphrased. Market size figures in section 4 are from Morgan Stanley Research (22 April 2026) and IQVIA (15 April 2026).
Read next
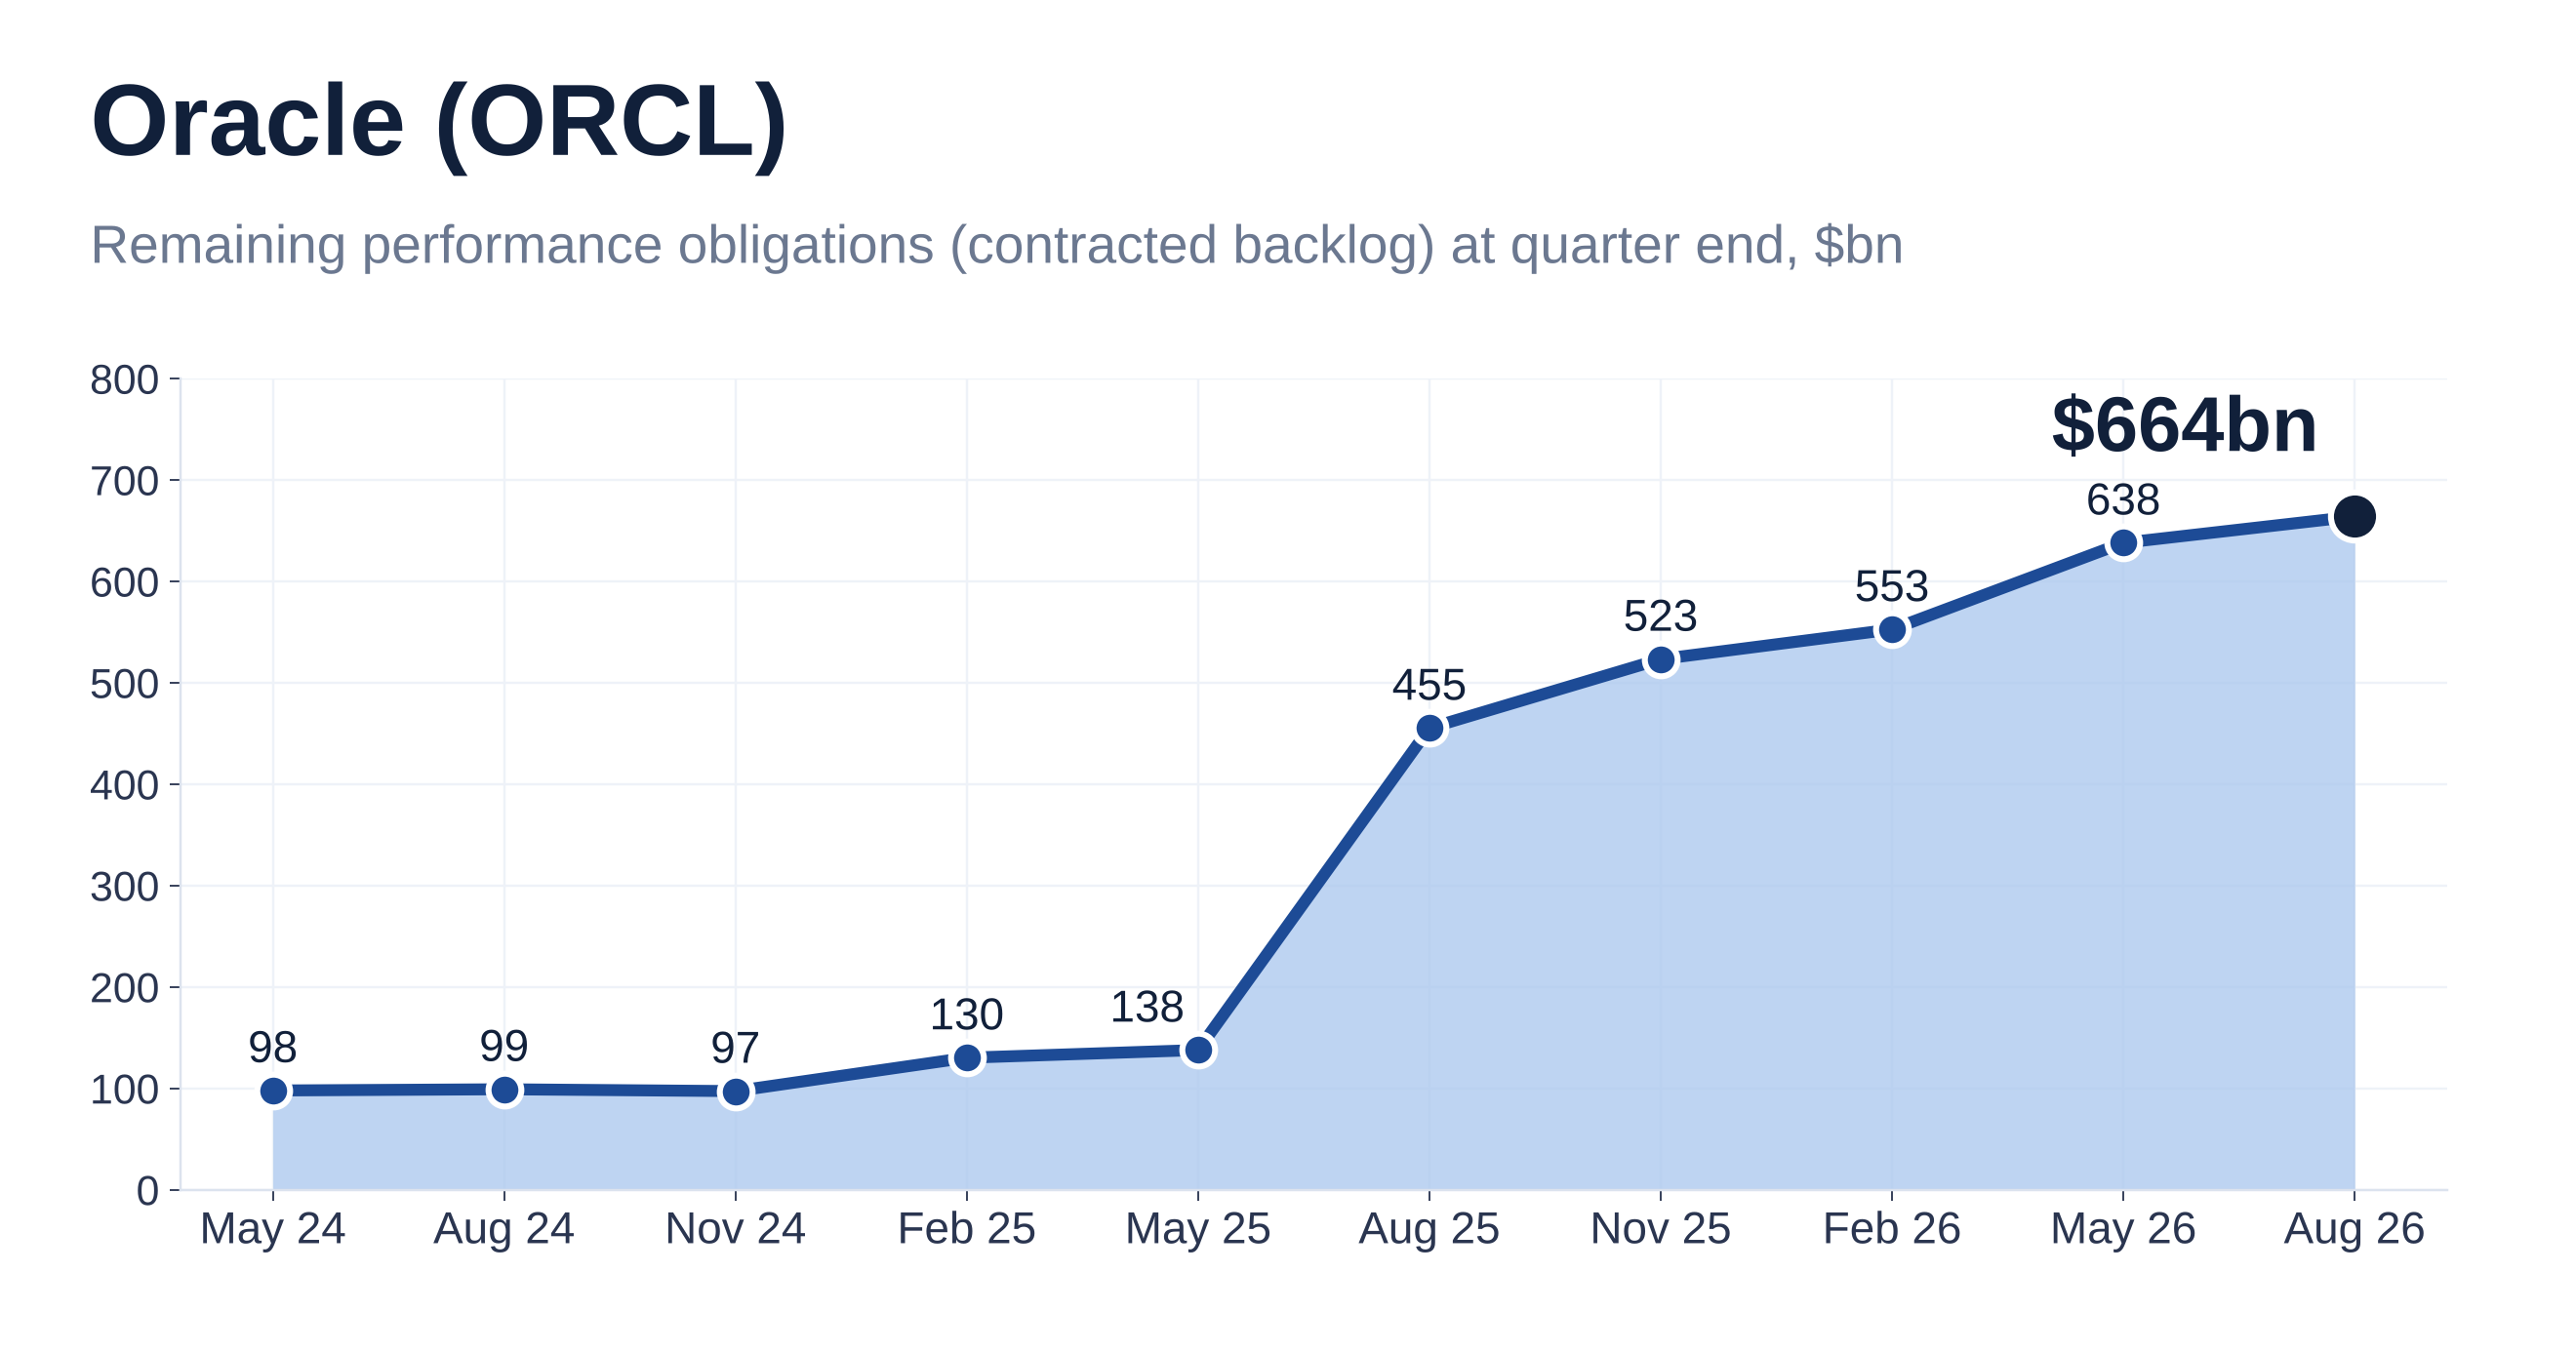
Oracle Corporation (ORCL) financial and ratio analysis: Q1 FY2027 filings, cloud backlog, debt and capital spending, scenarios to FY2030
October 8, 2026·29 min read
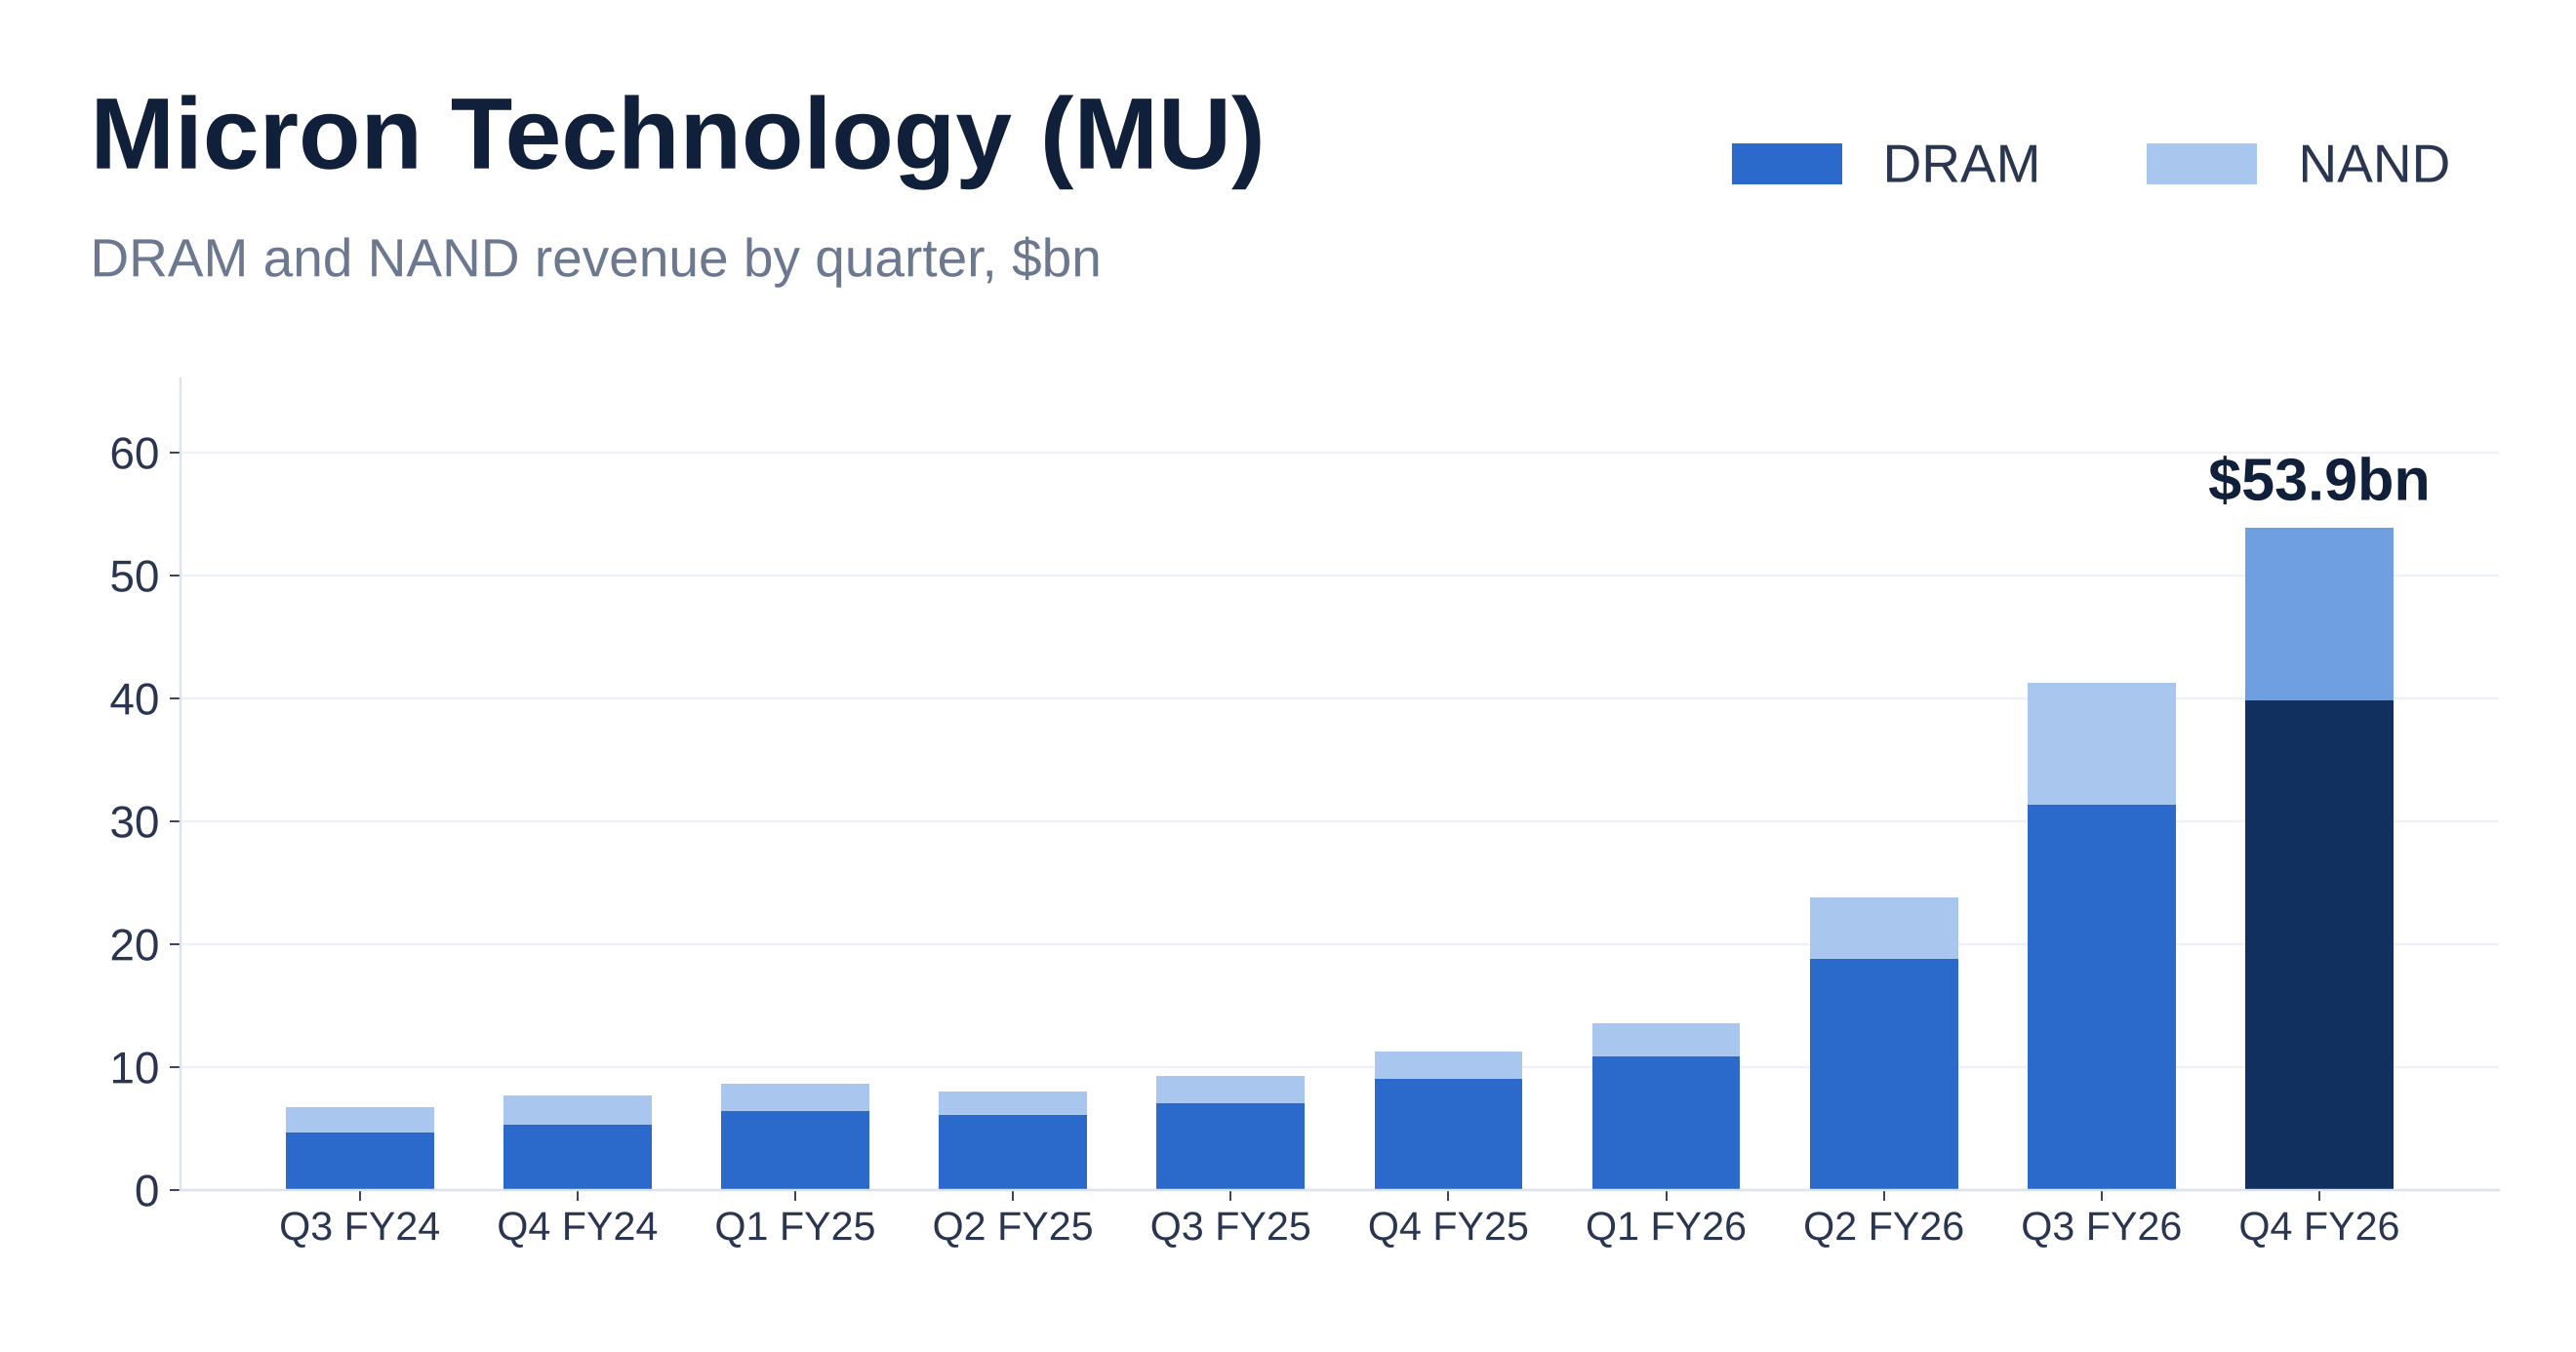
Micron Technology (MU) financial and ratio analysis: Q4 FY2026 results, DRAM and NAND pricing, peer comparison and scenarios to FY2029
October 8, 2026·28 min read