Alphabet Inc. (GOOGL), Financial Analysis
Insights derived from analysing SEC filings. Independent analysis, not a publication of the SEC.
- Two businesses at two speeds. Google Services earned $96.3bn of revenue (+11%) and $39.2bn of operating income in Q3 2026; Google Cloud grew 103% to $30.7bn with a $560.8bn backlog, incl. Wiz since Mar 2026.
- Search growth slowed to 12%. Search and other $63.4bn after +17% in Q2 2026; Google advertising +10.6% against Meta advertising +25.9% (Q3 2026), Amazon advertising +26.2% (Q2 2026) and Microsoft search and advertising +10.3%.
- Cloud doubles. Google Cloud +103% against Oracle cloud infrastructure +121% (Aug quarter), Azure +48% (Sep quarter) and AWS +37% (Q2 2026); operating margin 36.2% against AWS 39.4%. TPU systems are now sold to third parties.
- The build out costs cash. Capex $51.4bn, 40.3% of revenue; free cash flow ($9.1bn); purchase commitments $924.4bn. 9M 2026 funding: $80.8bn of notes, about $62.0bn of new equity incl. $12.4bn sold at the market, no buybacks.
- Net income follows investment marks. Q3 2026 net income $26.5bn, (24%), after an $8.7bn loss on equity securities, mainly SpaceX; 9M 2026 gains of $127.3bn sit in EPS.
- Shares (11.0%) before the open on 29 Oct 2026 at $289.20, 15.1x TTM EPS incl. gains, about 26.6x excluding them (estimate). Base case $324 in three years; best $547; worst $155.
Figures are read from the Forms 10-K for FY2021 to FY2025, the Forms 10-Q for Q1 2025 to Q3 2026, the Forms 8-K with all their exhibits, incl. the quarterly earnings releases (Ex 99.1), the June 2026 equity distribution agreement (Ex 1.1) and equity raise releases (Ex 99.1, 99.2), the certificates of designations for the mandatory convertible preferred stock (Ex 3.1, 3.2), the capped call forms (Ex 10.1, 10.2), the 2021 Stock Plan (Ex 10.01) and the forms of notes and legal opinions for eight notes offerings (Ex 4, 5), the proxy statement of 2026 and the Form 8-K Item 5.07 vote results, Schedules 13G and Forms 4 on the record for central index key 1652044, together with the comparable filings of five peers and the segment filings of 14 companies used in chapters 2 to 4. Accession numbers for every filing used appear in the Sources appendix. Market prices are the last trades of 29 October 2026 before the market open.
1 Revenue & Business Model
- Storyline: the revenue mix moves from advertising to cloud and AI infrastructure. Advertising was 64.3% of Q3 2026 revenue against 72.5% in Q3 2025; Cloud rose to 24.1% of revenue from 14.8%. Chapters 2 to 4 cover the three revenue drivers: Search and advertising, YouTube and subscriptions, and Google Cloud.
- Three segments: Google Services (Search, YouTube, Network, subscriptions, platforms and devices) earned $342.7bn in FY2025, 85.1% of revenue, with a 40.7% operating margin; Google Cloud $58.7bn (14.6%), 23.7% margin; Other Bets $1.5bn with a $7.5bn operating loss. Shared AI research at Google DeepMind sits in Alphabet level activities ($16.8bn cost in FY2025).
- Revenue FY2021 $257.6bn to FY2025 $402.8bn, an 11.8% CAGR; TTM Q3 2026 $471.1bn.
- Regions FY2025: United States $194.2bn (48.2%), EMEA $117.2bn (29.1%), APAC $67.7bn (16.8%), Other Americas $23.9bn (5.9%).
- Headcount 204,757 at 30 Sep 2026, +7.7% year on year.


| Segment | FY2021 | FY2022 | FY2023 | FY2024 | FY2025 |
|---|---|---|---|---|---|
| Google Services revenue ($bn) | 237.5 | 253.5 | 272.5 | 304.9 | 342.7 |
| Google Services operating income ($bn) | 88.1 | 82.7 | 95.9 | 121.3 | 139.4 |
| Google Cloud revenue ($bn) | 19.2 | 26.3 | 33.1 | 43.2 | 58.7 |
| Google Cloud operating income ($bn) | (2.3) | (1.9) | 1.7 | 6.1 | 13.9 |
| Other Bets revenue ($bn) | 0.8 | 1.1 | 1.5 | 1.6 | 1.5 |
| Other Bets operating income ($bn) | (4.1) | (4.6) | (4.1) | (4.4) | (7.5) |
| Alphabet level activities ($bn) | (3.1) | (1.3) | (9.2) | (10.5) | (16.8) |
| Segment | Q3 2025 | Q4 2025 | Q1 2026 | Q2 2026 | Q3 2026 |
|---|---|---|---|---|---|
| Google Services revenue ($bn) | 87.05 | 95.86 | 89.64 | 94.54 | 96.30 |
| Google Services operating income ($bn) | 33.53 | 40.13 | 40.59 | 39.54 | 39.16 |
| Google Cloud revenue ($bn) | 15.16 | 17.66 | 20.03 | 24.77 | 30.71 |
| Google Cloud operating income ($bn) | 3.59 | 5.31 | 6.60 | 8.81 | 11.12 |
| Other Bets revenue ($bn) | 0.34 | 0.37 | 0.41 | 0.38 | 0.37 |
| Other Bets operating income ($bn) | (1.43) | (3.62) | (2.10) | (1.80) | (2.05) |
| Alphabet level activities ($bn) | (4.47) | (5.89) | (5.39) | (5.79) | (7.66) |
| Google Cloud operating margin (%) | 23.7 | 30.1 | 32.9 | 35.6 | 36.2 |
2 Search & Advertising: AI Changes the Query
- Google advertising $82.0bn in Q3 2026, +10.6%, 64.3% of revenue; TTM $323.2bn, +13.4%. Google Services operating income $39.2bn, 40.7% margin, against Google Cloud $11.1bn.
- Search and other $63.4bn, +12.0%, after +19.1% in Q1 2026 and +16.8% in Q2 2026. Paid clicks +8% (+13% in Q1 and Q2), cost per click +4%. The 10-Q names more queries from user adoption and mobile use, advertiser spending and ad format and delivery improvements as drivers.
- Google Network $7.5bn, +1.4%, with impressions (14%) and cost per impression +14%; TTM Network revenue (1.2%). Traffic acquisition costs $16.4bn, 20.0% of advertising revenue.
- Management on AI in Search (8-K Ex 99.1 and Q3 2026 call): query growth the highest in five years, incl. commercial queries; the Gemini app has 1bn users. The filings give no separate revenue or usage figures for AI Overviews or AI Mode.
How the advertising industry is changing
- AI assistants and agents sit between users and ads. Amazon merged Rufus and Alexa+ into an agentic shopping assistant whose US users spend over 40% more per order; its AI Ads Agent reports 8% lower cost per impression. Meta reports a 14% higher price per ad on higher ad demand, which it believes is mostly due to better targeting and measurement tools.
- Growth rates differ by model: Amazon advertising +26.2% (Q2 2026) and Meta advertising +25.9% (Q3 2026) against Google advertising +10.6%; Reddit advertising +64.0% (Q2 2026) from a $0.8bn base. Microsoft search and advertising excluding TAC +12% across LinkedIn, Edge and Bing.
- Regulation changes search distribution: the Dec 2025 judgment requires Google to share certain search data and offer syndication to qualified competitors and restricts distribution agreements; both sides appealed.

| Company and line | Period | Revenue | Growth (%) | TTM revenue |
|---|---|---|---|---|
| Google advertising (Alphabet) | Q3 2026 | 82.01 | 10.6 | 323.18 |
| Search and other | Q3 2026 | 63.35 | 12.0 | 250.09 |
| YouTube ads | Q3 2026 | 11.21 | 9.2 | 43.53 |
| Google Network | Q3 2026 | 7.46 | 1.4 | 29.56 |
| Meta advertising | Q3 2026 | 63.06 | 25.9 | 235.59 |
| Amazon advertising services | Q2 2026 | 19.81 | 26.2 | 76.07 |
| Microsoft search and advertising | Sep 2026 quarter | 6.55 | 10.3 | n/a |
| Snap revenue | Q2 2026 | 1.60 | 18.9 | 6.35 |
| Pinterest revenue | Q2 2026 | 1.18 | 18.2 | n/a |
| Reddit advertising | Q2 2026 | 0.76 | 64.0 | n/a |
| Revenue line | Q3 2025 | Q4 2025 | Q1 2026 | Q2 2026 | Q3 2026 |
|---|---|---|---|---|---|
| Google Search and other ($bn) | 56.57 | 63.07 | 60.40 | 63.27 | 63.35 |
| YouTube ads ($bn) | 10.26 | 11.38 | 9.88 | 11.06 | 11.21 |
| Google Network ($bn) | 7.35 | 7.83 | 6.97 | 7.30 | 7.46 |
| Google subscriptions, platforms and devices ($bn) | 12.87 | 13.58 | 12.38 | 12.91 | 14.29 |
| Google Cloud ($bn) | 15.16 | 17.66 | 20.03 | 24.77 | 30.71 |
| Other Bets ($bn) | 0.34 | 0.37 | 0.41 | 0.38 | 0.37 |
| Hedging gains (losses) ($bn) | (0.21) | (0.07) | (0.18) | 0.11 | 0.19 |
| Metric | Q3 2025 | FY2025 | Q1 2026 | Q2 2026 | Q3 2026 |
|---|---|---|---|---|---|
| Paid clicks growth (%) | 7 | 6 | 13 | 13 | 8 |
| Cost per click growth (%) | 7 | 7 | 5 | 3 | 4 |
| TAC rate (%) | 20.1 | 20.3 | 19.7 | 19.8 | 20.0 |
| Employees (thousands) | 190.2 | 190.8 | 194.7 | 198.9 | 204.8 |
3 YouTube & Subscriptions: Ad Video and Paid Tiers
- YouTube ads $11.2bn in Q3 2026, +9.2%, after +12.9% in Q2 2026; TTM $43.5bn, +10.3%. The 10-Q attributes growth to brand advertising, then direct response.
- Subscriptions, platforms and devices $14.3bn, +11.0%; TTM $53.2bn, +15.4%, from paid subscriptions across YouTube services and Google One, plus Pixel and other devices. YouTube Music and Premium have over 150m subscribers incl. trials.
- Together YouTube ads and subscriptions, platforms and devices earned $25.5bn in Q3 2026, 20.0% of revenue, against $23.1bn (22.6%) in Q3 2025.
How video and subscriptions are changing
- Ads and subscriptions grow at different rates by company: Disney streaming subscription revenue +15% against ad revenue +2.5%; Spotify Premium +17.0% against ad supported +10.3%; Netflix guides FY2026 ad revenue to about $2.7bn (cut from $3.0bn; FY2025 over $1.5bn), and ads plans took over 60% of Q1 2026 signups in ad markets.
- Short video: Meta says Reels grows in usage but monetizes below Feed and Stories for the foreseeable future.
- TV platforms: Roku platform revenue +25.2% in Q2 2026, with platform advertising +24.8%; Roku is adding AI to its search.

| Company and line | Period | Revenue | Growth (%) | Operating margin (%) | Filed detail |
|---|---|---|---|---|---|
| YouTube ads (Alphabet) | Q3 2026 | $11.21bn | 9.2 | n/a | brand ads, then direct response |
| Subscriptions, platforms and devices (Alphabet) | Q3 2026 | $14.29bn | 11.0 | n/a | over 150m YouTube Music and Premium subscribers incl. trials |
| Netflix | Q3 2026 | $12.87bn | 11.8 | 34.6 | FY2026 ad revenue guidance about $2.7bn, cut from $3.0bn |
| Spotify | Q3 2026 | EUR 4.97bn | 16.3 | 13.5 | 306m Premium subscribers; ad supported revenue +10.3% |
| Disney streaming (Disney+, Hulu) | Quarter to 27 Jun 2026 | $5.53bn | 11.3 | 12.9 | subscription revenue +15%; ad revenue +2.5% |
| Roku platform | Q2 2026 | $1.22bn | 25.2 | n/a | platform advertising +24.8% |
| Amazon subscription services | Q2 2026 | $13.73bn | 12.5 | n/a | Prime, video and music |
4 Google Cloud: Backlog, TPUs and the Compute Race
- Google Cloud revenue $30.7bn in Q3 2026, +102.6%; operating income $11.1bn, 36.2% margin against 23.7% a year earlier. TTM revenue $93.2bn, operating income $31.8bn. Cloud was 24.1% of Alphabet revenue against 14.8% in Q3 2025.
- Backlog $560.8bn at 30 Sep 2026, against $462.3bn at Q1 and $513.9bn at Q2 2026 (total backlog $242.8bn at FY2025; from Q1 2026 the figure includes contracts of one year or less); just over 55% of Alphabet's $567.7bn backlog is expected within 24 months; $16.8bn is with Crux AI, a related party joint venture with Blackstone.
- TPU systems are sold to third parties: hardware, software and support under a limited number of on premises supply agreements, some with repurchase options at pre set prices; revenue began in Q2 2026, with most expected in 2027. No dollar amount is disclosed; the release calls TPU system sales a meaningful contributor to Q3 growth.
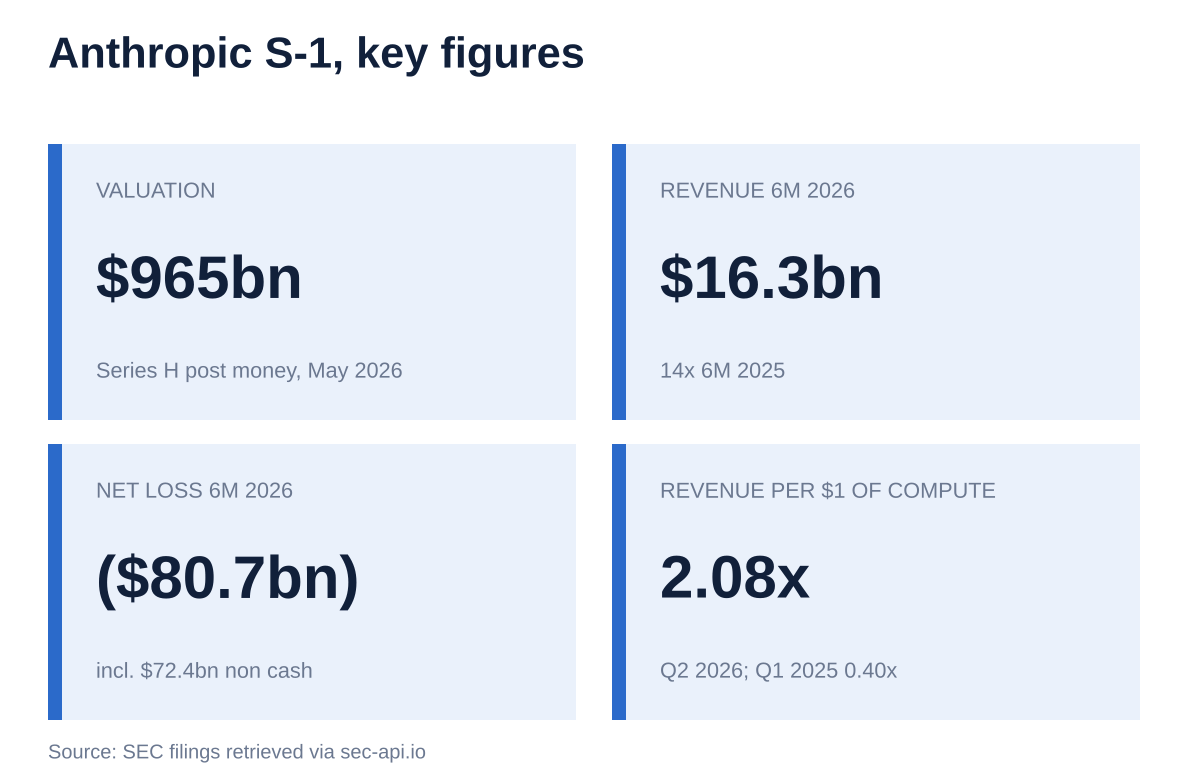
- Customers: Anthropic's S-1 commits at least $114.5bn of spend with Google from Apr 2026 to Jul 2033; management cited nearly 100 TPU system customers and 18 Cloud product lines above $1bn of annual revenue (Q3 2026 call). Wiz ($29.5bn, closed Mar 2026) reports in Google Cloud.
- Margin pressure: the 10-Q names inventory costs of TPU systems sold and usage costs for technical infrastructure as partial offsets; on the call management added third party compute used while supply is short.

How the cloud and AI infrastructure market is changing
- Capex race: TTM capex Amazon $173.0bn (to Q2 2026), Alphabet $159.8bn, Microsoft $135.9bn, Meta $108.0bn incl. finance leases, Oracle $75.7bn, CoreWeave $20.6bn. Nvidia data center revenue TTM $277.8bn, +116.6% in the Jul 2026 quarter.
- Custom chips compete with GPUs: Alphabet sells TPU systems; Amazon's chips business, incl. Trainium, runs above a $25bn annual rate; Microsoft cites Maia 200 and Cobalt 200. Anthropic runs on TPUs, Trainium and Nvidia GPUs, has contracted AMD MI450 systems from 2027, and sells Claude through all three large clouds.
- Large contracted backlogs: Microsoft commercial RPO $677bn (+73%, Sep 2026), Oracle $664bn (Aug 2026), Google Cloud $560.8bn (Sep 2026), Amazon $496bn (Jun 2026), CoreWeave about $104bn (Jun 2026). Anthropic's minimum compute commitments are $114.5bn with Google, $110.0bn with Amazon and $44.9bn with Microsoft.
- Financing broadens: Nvidia cites partnerships to mobilize over $500bn of third party capital for AI infrastructure over time, subject to definitive agreements; Oracle caps further capital raises at $20bn through FY2030; Alphabet backstops third party data centers ($75.7bn) and raised debt and equity in 2026.


| Business | Period | Revenue | Growth (%) | Operating margin (%) | Backlog or RPO | Company capex TTM |
|---|---|---|---|---|---|---|
| Google Cloud | Q3 2026 | 30.71 | 102.6 | 36.2 | 560.8 | 159.8 |
| Amazon Web Services | Q2 2026 | 42.23 | 36.8 | 39.4 | 496.0 | 173.0 |
| Microsoft Azure | Sep 2026 quarter | 33.17 | 48.2 | n/a | 677.0 | 135.9 |
| Microsoft Agents and Infra segment | Sep 2026 quarter | 76.80 | 24.5 | 52.8 | see above | see above |
| Oracle cloud infrastructure | Aug 2026 quarter | 7.39 | 120.7 | n/a | 664.0 | 75.7 |
| CoreWeave | Q2 2026 | 2.58 | 112.5 | (1.9) | 104.0 | 20.6 |
| Nvidia data center | Jul 2026 quarter | 89.02 | 116.6 | n/a | n/a | 7.4 |
5 Financial Analysis & Ratios
- The cost of the build out shows first in cash flow, not in operating margin. Operating margin 32.0% in FY2025 and 33.3% TTM, against 26.5% in FY2022; Q3 2026 31.8% against 30.5% in Q3 2025, which included the $3.5bn EU ad tech fine.
- Net income TTM $235.7bn, 50.0% of revenue, includes $129.6bn of pre tax gains on equity securities; GAAP P/E of 15.1x reflects these gains.
- Capex TTM $159.8bn, 33.9% of revenue, against $91.4bn (22.7%) in FY2025 and $24.6bn in FY2021. Free cash flow fell from $73.3bn in FY2025 to $19.7bn TTM.
- Balance sheet at 30 Sep 2026: cash and short term marketable securities $265.1bn, incl. $90.4bn of marketable equity securities of which $75.2bn are SpaceX shares under short term sale restrictions; debt $126.1bn against $11.9bn at FY2024; non marketable equity securities $135.2bn.
- Capital returns: buybacks $45.7bn in FY2025 and none in 9M 2026; $69.5bn of authorization unused; dividends $0.22 per quarter, $2.7bn in Q3 2026; preferred dividends $234m paid in Q3 2026.
| Line item | FY2021 | FY2022 | FY2023 | FY2024 | FY2025 | TTM Q3 2026 |
|---|---|---|---|---|---|---|
| Revenue | 257.6 | 282.8 | 307.4 | 350.0 | 402.8 | 471.1 |
| Gross profit | 146.7 | 156.6 | 174.1 | 203.7 | 240.3 | 286.7 |
| Research and development | 31.6 | 39.5 | 45.4 | 49.3 | 61.1 | 74.5 |
| Selling, general and administrative | 36.4 | 42.3 | 44.3 | 42.0 | 50.2 | 55.3 |
| Operating income | 78.7 | 74.8 | 84.3 | 112.4 | 129.0 | 157.0 |
| Net income | 76.0 | 60.0 | 73.8 | 100.1 | 132.2 | 235.7 |
| Diluted EPS ($) | 5.61 | 4.56 | 5.80 | 8.04 | 10.81 | 19.16 |
| Operating cash flow | 91.7 | 91.5 | 101.7 | 125.3 | 164.7 | 179.6 |
| Capital expenditure | (24.6) | (31.5) | (32.3) | (52.5) | (91.4) | (159.8) |
| Free cash flow | 67.0 | 60.0 | 69.5 | 72.8 | 73.3 | 19.7 |
| Stock based compensation | 15.4 | 19.4 | 22.5 | 22.8 | 25.0 | 30.4 |
| Cash and investments | 139.6 | 113.8 | 110.9 | 95.7 | 126.8 | 265.1 |
| Total debt | 14.8 | 14.7 | 13.3 | 11.9 | 48.5 | 126.1 |
| Total equity | 251.6 | 256.1 | 283.4 | 325.1 | 415.3 | 677.5 |

| Metric | Q3 2025 | Q3 2026 | Change |
|---|---|---|---|
| Revenue ($bn) | 102.35 | 127.58 | 24.7% |
| Gross profit ($bn) | 60.98 | 76.16 | 24.9% |
| Operating income ($bn) | 31.23 | 40.58 | 29.9% |
| Net income ($bn) | 34.98 | 26.47 | (24.3%) |
| Diluted EPS ($) | 2.87 | 2.12 | (26.1%) |
| Operating cash flow ($bn) | 48.41 | 42.29 | (12.6%) |
| Free cash flow ($bn) | 24.46 | (9.07) | (137.1%) |
| Operating margin (%) | 30.5 | 31.8 | 1.3 pts |
| Net margin (%) | 34.2 | 20.7 | (13.4 pts) |
| Ratio | FY2021 | FY2022 | FY2023 | FY2024 | FY2025 | TTM Q3 2026 |
|---|---|---|---|---|---|---|
| Growth and margins | ||||||
| Revenue growth (%) | n/a | 9.8 | 8.7 | 13.9 | 15.1 | n/a |
| Gross margin (%) | 56.9 | 55.4 | 56.6 | 58.2 | 59.7 | 60.9 |
| Operating margin (%) | 30.6 | 26.5 | 27.4 | 32.1 | 32.0 | 33.3 |
| Net margin (%) | 29.5 | 21.2 | 24.0 | 28.6 | 32.8 | 50.0 |
| FCF margin (%) | 26.0 | 21.2 | 22.6 | 20.8 | 18.2 | 4.2 |
| Cost and investment intensity | ||||||
| R&D (%) revenue | 12.3 | 14.0 | 14.8 | 14.1 | 15.2 | 15.8 |
| SBC (%) revenue | 6.0 | 6.8 | 7.3 | 6.5 | 6.2 | 6.5 |
| Capex (%) revenue | 9.6 | 11.1 | 10.5 | 15.0 | 22.7 | 33.9 |
| Effective tax rate (%) | 16.2 | 15.9 | 13.9 | 16.4 | 16.8 | 18.1 |
| Returns | ||||||
| ROE (%) | 30.2 | 23.6 | 27.4 | 32.9 | 35.7 | 34.8 |
| ROA (%) | 21.2 | 16.6 | 19.2 | 23.5 | 25.3 | 23.5 |
| ROIC (%) | 52.0 | 40.1 | 39.1 | 38.9 | 31.9 | 23.9 |
| Asset turnover (x) | 0.72 | 0.77 | 0.76 | 0.78 | 0.68 | 0.47 |
| Liquidity and leverage | ||||||
| Current ratio (x) | 2.93 | 2.38 | 2.10 | 1.84 | 2.01 | 2.79 |
| Debt to equity (x) | 0.06 | 0.06 | 0.05 | 0.04 | 0.12 | 0.19 |
| Net cash ($bn) | 124.8 | 99.1 | 97.7 | 83.8 | 78.3 | 139.0 |
| Efficiency and cash quality | ||||||
| Days sales outstanding | 56 | 52 | 57 | 55 | 57 | 56 |
| FCF to net income (x) | 0.88 | 1.00 | 0.94 | 0.73 | 0.55 | 0.08 |
| Shareholder returns (%) FCF | 75 | 99 | 89 | 96 | 76 | 84 |


| Measure | Value |
|---|---|
| Market cap ($bn) | 3,543.4 |
| Enterprise value ($bn) | 3,404.4 |
| P/E (TTM) (x) | 15.1 |
| EV/Sales (TTM) (x) | 7.2 |
| EV/EBITDA (TTM) (x) | 18.4 |
| FCF yield (%) | 0.6 |
| Price/Book (x) | 5.2 |
Cost structure and profitability
- Cost of revenue 40.3% of Q3 2026 revenue, back to the Q3 2025 level after 37.6% in Q1 2026; the 10-Q names inventory costs of TPU system sales, depreciation, TAC and content as drivers.
- Depreciation $8.4bn in Q3 2026, +49%, 6.6% of revenue against 5.5% a year earlier; servers and networking are about 65% of Q3 capex, with an estimated useful life of about six years (CFO).
- R&D $20.6bn, +36%, 16.2% of revenue; Alphabet level activities, mainly shared AI research, cost $7.7bn in Q3 2026 against $4.5bn a year earlier.
- Operating margin 31.8% in Q3 2026 against 30.5% a year earlier and 34.0% in Q2 2026; Cloud operating income rose $7.5bn to $11.1bn and Google Services operating income rose $5.6bn to $39.2bn.
- Capex 40.3% of Q3 2026 revenue against 23.4% in Q3 2025; operating cash flow $42.3bn, (13%), after the $5.2bn EU Android fine payment and TPU inventory build.
- Gains on equity securities explain the gap between operating income and net income: $36.9bn in Q1 2026 and $99.0bn in Q2 2026, then ($8.7bn) in Q3 2026; 9M 2026 net income $201.2bn against operating income $121.0bn.


| Line | Q3 2025 | Q4 2025 | Q1 2026 | Q2 2026 | Q3 2026 |
|---|---|---|---|---|---|
| Cost of revenue (% of revenue) | 40.4 | 40.2 | 37.6 | 38.4 | 40.3 |
| Research and development (% of revenue) | 14.8 | 16.3 | 15.5 | 15.2 | 16.2 |
| Sales and marketing (% of revenue) | 7.0 | 7.2 | 6.9 | 7.0 | 6.9 |
| General and administrative (% of revenue) | 7.2 | 4.7 | 3.9 | 5.4 | 4.8 |
| Depreciation (incl. in lines above) (% of revenue) | 5.5 | 5.3 | 5.9 | 5.9 | 6.6 |
| Stock based compensation (incl. in lines above) (% of revenue) | 6.2 | 6.2 | 6.1 | 6.6 | 6.8 |
| Operating income (% of revenue) | 30.5 | 31.6 | 36.1 | 34.0 | 31.8 |
| Capex (% of revenue) | 23.4 | 24.5 | 32.5 | 37.5 | 40.3 |
| Line | Q3 2025 | Q3 2026 | 9M 2026 |
|---|---|---|---|
| Revenue | 102.35 | 127.58 | 357.27 |
| Operating income | 31.23 | 40.58 | 121.04 |
| Gains (losses) on equity securities | 10.73 | (8.66) | 127.28 |
| Other income and expense excl. equity securities | 2.03 | 0.44 | 0.20 |
| Income taxes | (9.01) | (5.89) | (47.28) |
| Net income | 34.98 | 26.47 | 201.24 |
| Item | $bn | % of annualized revenue |
|---|---|---|
| Purchase commitments | 924.4 | 181 |
| of which due within 12 months | 213.4 | 42 |
| Leases not yet commenced | 130.5 | 26 |
| Data center backstops | 75.7 | 15 |
| Financial guarantees | 22.8 | 4 |
| Equity funding commitments | 21.9 | 4 |
| Revenue backlog (for comparison) | 567.7 | 111 |
6 MD&A & Management Commentary
Q3 2026 earnings call and results release
- Q3 2026 (28 Oct 2026): revenue $127.6bn, +25% reported and in constant currency; operating income $40.6bn, +30%; diluted EPS $2.12 against $2.87; effective tax rate 18.2%.
- Costs: cost of revenue $51.4bn, +24%, led by inventory costs of TPU system sales, depreciation, TAC and YouTube content; R&D $20.6bn, +36%; G&A $6.1bn, (17%), as Q3 2025 included the $3.5bn EU fine; Q3 2026 includes a $1.0bn charge for EU Digital Markets Act fines.
- Capex composition (CFO): about 65% servers and networking and about 35% data centers in Q3 2026; FY2026 guidance $195bn to $205bn kept (February: $175bn to $185bn; April: $180bn to $190bn).
- Cloud: backlog $561bn against $514bn at Q2 2026; 18 product lines above $1bn of annual revenue; nearly 100 TPU system customers; management expects use of third party compute while supply is short to weigh on near term Cloud margin.
- AI usage: Gemini app 1bn users; first party model APIs about 32bn tokens per minute against 22bn in Q2 2026; over 2,600 customers used at least 100bn tokens in 12 months.
- Search: management said query growth was the highest in five years; Search and other revenue grew 12% in Q3 2026 after 17% in Q2 2026, which management attributed to currency and to retail and media factors; total revenue grew 25% in constant currency.
- Q2 2026 call (22 Jul 2026): revenue $119.8bn, +24%; Cloud +82%, 35.6% margin; capex guidance raised to $195bn to $205bn; CFO said the company remained supply constrained.
| Item | Outlook | Source |
|---|---|---|
| FY2026 capex | $195bn to $205bn; 9M 2026 actual $132.0bn implies $63bn to $73bn in Q4 | Q3 2026 call, 28 Oct 2026 |
| FY2027 capex | expected to increase on 2026; figures with Q4 2026 results | Q3 2026 call |
| Depreciation | expected to increase with infrastructure investment | Q3 2026 call |
| TPU system sales | revenue recognition began in 2026; most expected in 2027 | 10-Q Q3 2026 MD&A |
| Revenue backlog | just over 55% of $567.7bn expected within 24 months | 10-Q Q3 2026 Note 2 |
| Common dividend | $0.22 per share payable 14 Dec 2026 | 8-K 28 Oct 2026, Ex 99.1 |
Management and CFO commentary
- CFO Anat Ashkenazi, Q3 2026 call: FY2026 capex $195bn to $205bn unchanged; 2027 capex to increase further, with figures on the Q4 2026 call; Q3 capex about 65% servers and networking.
- CFO, Q3 2026 call: Cloud backlog $561bn, just over 55% within 24 months; TPU system sales grow in Q4 and ramp in 2027; third party compute used while supply is short weighs on near term Cloud margin.
- CFO, Q3 2026 call: free cash flow ($9.1bn) after capex, TPU inventory and the $5.2bn EU Android fine payment; other income and expense ($8.2bn), mainly an unrealized loss on SpaceX shares.
- CFO, Q2 2026 call: capex guidance raised to $195bn to $205bn on faster capacity delivery; no plan to return to equity markets beyond the at the market program for stock compensation tax obligations.
- CEO Sundar Pichai, 8-K Ex 99.1 of 28 Oct 2026: Alphabet is on a half trillion dollar revenue run rate; Search query growth highest in five years; Cloud +103% with TPU system demand.
- Chief Business Officer Philipp Schindler, Q3 2026 call: Search revenue +12% to $63bn; slower growth than in Q2 attributed mainly to currency and to retail and media factors.
- Google Cloud CEO Thomas Kurian, Q3 2026 call: 18 Cloud product lines above $1bn of annual revenue; over 2,600 customers used at least 100bn tokens; more than 100m knowledge worker seats sold.
| Speaker | Date and source | Statement |
|---|---|---|
| Sundar Pichai, CEO | 4 Feb 2026, 8-K Ex 99.1 | “annual revenues exceeded $400 billion for the first time” |
| Sundar Pichai, CEO | 22 Jul 2026, 8-K Ex 99.1 | “Our AI investments are redefining what’s possible across every part of our business.” |
| Anat Ashkenazi, CFO | 28 Oct 2026, Q3 2026 call | “We continue to expect our CapEx to increase significantly in 2027” |
| Item | Disclosure |
|---|---|
| 10-Q Q3 2026, commitments | Material purchase commitments $924.4bn ($213.4bn within 12 months), against $811.0bn at 30 Jun 2026; leases not yet commenced $130.5bn; data center backstops $75.7bn; financial guarantees $22.8bn; equity funding commitments $21.9bn. |
| 10-Q Q3 2026, backlog | Revenue backlog $567.7bn, Cloud $560.8bn; includes $16.8bn with Crux AI, a related party joint venture with Blackstone formed in May 2026. |
| 10-Q Q3 2026, equity investments | Non marketable securities $135.2bn, incl. $128.2bn under the measurement alternative that primarily consist of one private company; cumulative upward adjustments $88.8bn. 9M 2026 non marketable unrealized net gains $116.3bn. |
| 10-Q Q1 to Q3 2026, private company commitment | In March 2026 Alphabet committed $40.0bn to a private company, partly contingent on operational and financial milestones through 2030; $20.0bn of future funding commitments remained at 30 Sep 2026. Anthropic's S-1 discloses Google purchases of $10.0bn of Series G-2 (Mar 2026) and $10.0bn of Series H (May 2026) and a note purchase agreement of up to $30.0bn, reduced to $20.0bn. |
| 10-Q Q3 2026, financing | Long term debt $125.1bn; $45.0bn of US dollar notes and $35.8bn of foreign currency notes issued in 9M 2026; at the market program $40.0bn with $27.6bn unused; 6.25% mandatory convertible preferred convert into about 43m to 54m common shares. |
| 10-Q Q3 2026, legal | Ad tech remedies decision of Sep 2026 imposed behavioral remedies and denied divestiture; Search final judgment of Dec 2025 under appeal by both sides; EU Android fine final, $5.2bn paid in Jul 2026; accrued fines and settlements $13.8bn. |
| 10-Q Q2 2026, PriceRunner | Stockholm court decision of Jul 2026: about $2.1bn recognized in Q2 2026 ($1.5bn in G&A, $581m in other income and expense); under appeal. |
| 10-Q Q1 2026, acquisitions | Wiz ($29.5bn) and Intersect ($5.9bn) closed on 11 and 10 Mar 2026; Wiz reports in Google Cloud. |
7 Peer Valuation & Sector Summary
- Summary across drivers: Alphabet's Q3 2026 revenue growth of 24.7% sits between Microsoft (18.8%) and Meta (26.1%); operating margin TTM 33.3% against Microsoft 47.1% and Meta 32.9%.
- Free cash flow margin 4.2% TTM against Microsoft 17.3%, Meta 10.4%, Amazon (1.5%) and Oracle (40.0%), after the capex step up.
- Valuation: GOOGL 7.2x EV/Sales and 15.1x P/E (about 26.6x excluding TTM equity gains, estimate) against MSFT 11.5x and 28.2x, NVDA 17.0x and 26.8x, META 6.6x and 21.1x, AMZN 3.5x and 19.9x, ORCL 7.2x and 22.8x.
| Company | Revenue TTM ($bn) | Revenue growth (%) | Gross margin (%) | Operating margin (%) | Net margin (%) | FCF margin (%) | ROE (%) | Net cash ($bn) | Market value ($bn) | EV/Sales (x) | P/E TTM (x) |
|---|---|---|---|---|---|---|---|---|---|---|---|
| GOOGL | 471.1 | 24.7 | 60.9 | 33.3 | 50.0 | 4.2 | 44.3 | 139.0 | 3,543 | 7.2 | 15.1 |
| META | 241.6 | 26.1 | 81.0 | 32.9 | 31.1 | 10.4 | 32.3 | (1.2) | 1,581 | 6.6 | 21.1 |
| MSFT | 346.4 | 18.8 | 67.7 | 47.1 | 41.2 | 17.3 | 34.2 | 29.0 | 4,008 | 11.5 | 28.2 |
| AMZN | 775.7 | 19.6 | 50.8 | 12.1 | 17.4 | (1.5) | 32.3 | (9.2) | 2,697 | 3.5 | 19.9 |
| ORCL | 71.8 | 29.6 | 64.0 | 32.1 | 26.4 | (40.0) | 43.4 | (88.3) | 431 | 7.2 | 22.8 |
| NVDA | 303.0 | 105.9 | 74.7 | 65.2 | 63.7 | 41.9 | 117.2 | 23.2 | 5,165 | 17.0 | 26.8 |

8 Material Events & Contracts
- 17 Forms 8-K in twelve months: five earnings releases, five notes 8-Ks ($17.5bn and EUR 6.5bn in Nov 2025, $20.0bn and GBP 5.5bn in Feb 2026, EUR 9.0bn and CAD 8.5bn in May 2026, JPY 576.9bn in May 2026, $25.0bn in Aug 2026), the June 2026 equity raise and preferred issue, four officer and pay notices and the annual meeting results.
- June 2026 equity raise: announced as an $80bn AI infrastructure raise on 1 Jun 2026 and upsized to $84.75bn on 2 Jun 2026, comprising common stock, a $10.0bn Berkshire Hathaway private placement, mandatory convertible preferred depositary shares and a $40bn at the market program.
| Date | Items | Event |
|---|---|---|
| 29 Oct 2025 | 2.02, 9.01 | Q3 2025 results: revenue $102.3bn (+16%), first $100bn quarter; operating income $31.23bn including $3.5bn EC ad tech fine; net income $34.98bn; diluted EPS $2.87; Google Cloud revenue $15.16bn (+34%); capex $23.95bn. |
| 6 Nov 2025 | 8.01, 9.01 | Closed $17.5bn US dollar senior notes (eight tranches, floating 2028 to 5.700% 2075) and EUR 6.5bn euro senior notes (six tranches, 2.375% 2028 to 4.375% 2064). |
| 4 Feb 2026 | 2.02, 9.01 | Q4 2025 results: revenue $113.8bn (+18%); operating income $35.93bn; net income $34.46bn; diluted EPS $2.82; Google Cloud revenue $17.66bn (+48%); FY2025 revenue $402.8bn, net income $132.2bn; FY2026 capex guided at $175bn to $185bn on the call. |
| 13 Feb 2026 | 8.01, 9.01 | Closed $20.0bn US dollar senior notes (seven tranches, 3.700% 2029 to 5.750% 2066) and GBP 5.5bn Sterling notes (five tranches, 4.125% 2029 to 6.125% 2126). |
| 6 Mar 2026 | 5.02 | Compensation committee approved CEO Sundar Pichai pay: salary $2.0m unchanged, no annual bonus, triennial equity award of Alphabet PSUs (TSR based, 2026 to 2027 and 2026 to 2028), GSUs over three years, and Waymo and Wing performance units. |
| 2 Apr 2026 | 5.02 | Amie Thuener O'Toole resigned as Vice President, Corporate Controller and Principal Accounting Officer effective April 9 2026, to pursue another opportunity; no disagreements. |
| 10 Apr 2026 | 5.02 | Equity awards for executive officers after discontinuing the SVP bonus program: Ashkenazi PSUs $10.0m target, GSUs $20.0m, transitional $6.0m; Porat $9.0m / $20.0m / $5.0m; Schindler $16.0m / $26.0m / $5.67m; Walker $9.0m / $20.0m / $5.0m. |
| 29 Apr 2026 | 2.02, 9.01 | Q1 2026 results: revenue $109.9bn (+22%); operating income $39.70bn (36% margin); net income $62.58bn including $36.9bn equity securities gains; diluted EPS $5.11; Google Cloud $20.03bn (+63%); capex $35.67bn; FY2026 capex guidance raised to $180bn to $190bn on the call; quarterly dividend raised 5% to $0.22. |
| 11 May 2026 | 8.01, 9.01 | Closed EUR 9.0bn euro notes (six tranches, 3.200% 2030 to 4.800% 2063) and CAD 8.5bn Canadian dollar notes (four tranches; the 8-K headline states CAD 9.5bn, 3.650% 2031 to 5.000% 2056). |
| 21 May 2026 | 8.01, 9.01 | Closed JPY 576.9bn yen notes (seven tranches, 1.965% 2029 to 4.599% 2066). |
| 4 Jun 2026 | 1.01, 7.01, 8.01, 9.01 | Underwritten offering of 25,459,689 Class A at $355.1982 and 25,459,689 Class C at $351.8018 plus over allotment of 3,818,953 each (exercised in full; net $20.5bn); private placement to a Berkshire Hathaway affiliate of 14,212,035 Class A at about $351.81 and 14,359,656 Class C at about $348.20 for $10.0bn; underwriters of the depositary share offering exercised options for 50m additional depositary shares. |
| 5 Jun 2026 | 1.01, 3.03, 5.03, 9.01 | Issued 6.25% Series A and Series B mandatory convertible preferred stock (certificates of designations filed), 385m depositary shares in total, net proceeds $19.0bn; capped call transactions entered (cost about $1.0bn). |
| 5 Jun 2026 | 5.02 | Marsida Saraci (Vice President and Controller, at Alphabet since 2011) appointed Principal Accounting Officer; GSU grants of $280,000 and $440,000. |
| 11 Jun 2026 | 5.02, 5.07, 9.01 | 2026 annual meeting results: all 10 directors elected; Ernst & Young ratified; 2021 Stock Plan amended to add 200m Class C shares (11.17bn for, 1.18bn against); say on pay approved (9.99bn for, 2.33bn against); all ten shareholder proposals failed, including equal shareholder voting (3.85bn for, 8.50bn against). |
| 22 Jul 2026 | 2.02, 9.01 | Q2 2026 results: revenue $119.8bn (+24%); operating income $40.77bn (34%); net income $112.2bn including $99.0bn equity securities gains (SpaceX and a private company); diluted EPS $9.11; Google Cloud $24.77bn (+82%); capex $44.92bn; FY2026 capex guidance raised to $195bn to $205bn on the call. |
| 10 Aug 2026 | 8.01, 9.01 | Closed $25.0bn US dollar senior notes in ten tranches: floating 2028 and 2029, 4.500% 2028 to 6.500% 2066 (largest $4.5bn 5.450% 2036 and $4.5bn 6.375% 2056). |
| 28 Oct 2026 | 2.02, 9.01 | Q3 2026 results: revenue $127.6bn (+25%); operating income $40.58bn (31.8%); OI&E -$8.22bn (SpaceX unrealized loss); net income to common $26.17bn; diluted EPS $2.12; Google Cloud $30.71bn (+103%), Cloud OI $11.12bn; capex $51.35bn; FCF -$9.06bn; ATM sales $12.4bn; notes issued $28.7bn net; common dividend $0.22 and preferred dividend $15.63 declared. |
| Contract | Terms |
|---|---|
| Senior notes | Debt $126.1bn at 30 Sep 2026, incl. $1.0bn current; 2026 issues in US dollars, sterling, Swiss francs, euros, Canadian dollars, yen and Australian dollars; no commercial paper outstanding. |
| 6.25% mandatory convertible preferred (Series A and B) | 19m preferred shares, 385m depositary shares, net $19.0bn; convert into about 43m to 54m Class A and Class C shares; capped calls cost $1.0bn with caps at $532.67 and $527.80. |
| At the market program (Ex 1.1, 1 Jun 2026) | Up to $40bn of Class A and Class C stock via Goldman Sachs, J.P. Morgan and Morgan Stanley; $12.4bn sold in Q3 2026, $27.6bn left. |
| Private company commitment (Mar 2026) | $40.0bn, partly contingent on milestones through 2030; $20.0bn of future funding commitments remaining at 30 Sep 2026; the contingent part is accounted for as an equity derivative. |
| Crux AI (Blackstone joint venture) | Formed May 2026; Blackstone up to $5.0bn of capital, Alphabet up to $10.0bn of backstops; $16.8bn of Alphabet revenue backlog. |
| Waymo term loan (Oct 2026) | $5.0bn senior secured, SOFR plus 5.25%, due Oct 2032, not guaranteed by Alphabet; Waymo raised $16.0bn in Feb 2026, mostly from Alphabet. |
9 Ownership, Voting Power & Annual Meeting
- Three share classes: Class B carries ten votes and is held mainly by Larry Page (27.4% of voting power) and Sergey Brin (25.3%); directors and executive officers hold 54.3% of voting power. Class C has no votes.
- 2026 annual meeting (5 Jun 2026, virtual): all 10 directors elected with 85.2% to 99.0% of votes cast; say on pay approved with 81.1%; 200m more Class C shares for the 2021 Stock Plan approved with 90.4%; all 10 shareholder proposals rejected, the highest being equal voting at 31.2%.
- Insiders, 12 months: no open market purchases; sales about $132.2m by six insiders, all under Rule 10b5-1 plans. CEO Sundar Pichai sold 325,000 shares for about $100.7m between Nov 2025 and Mar 2026; Kent Walker about $25.6m. Sergey Brin reported gifts only.
- CEO pay: salary $2.0m and no annual bonus; triennial equity award approved in Mar 2026 with two PSU tranches of $63m target each, GSUs, and Waymo and Wing performance units.
| Proposal | For (bn votes) | Against (bn votes) | Abstain (bn votes) | For as % of votes cast | Result |
|---|---|---|---|---|---|
| Elect Sundar Pichai | 12.220 | 0.138 | 0.012 | 98.9 | Elected |
| Elect John L. Hennessy | 10.516 | 1.833 | 0.021 | 85.2 | Elected; lowest director support |
| Elect R. Martin Chávez | 12.239 | 0.118 | 0.013 | 99.0 | Elected; highest director support |
| Ratify Ernst & Young LLP for FY2026 | 12.452 | 0.486 | 0.013 | 96.2 | Approved |
| Amend 2021 Stock Plan (200m more Class C shares) | 11.172 | 1.181 | 0.017 | 90.4 | Approved |
| Advisory vote on executive compensation | 9.989 | 2.334 | 0.048 | 81.1 | Approved |
| Shareholder: enhanced climate goal disclosure | 0.907 | 11.427 | 0.036 | 7.4 | Rejected |
| Shareholder: water usage and AI development report | 0.185 | 12.131 | 0.054 | 1.5 | Rejected |
| Shareholder: equal shareholder voting | 3.847 | 8.503 | 0.020 | 31.2 | Rejected |
| Shareholder: viewpoint diversity risk report | 0.019 | 12.325 | 0.026 | 0.2 | Rejected |
| Shareholder: politicized content moderation report | 0.026 | 12.299 | 0.045 | 0.2 | Rejected |
| Shareholder: impact of US immigration policy report | 0.225 | 12.098 | 0.047 | 1.8 | Rejected |
2026 annual meeting
- Virtual meeting of 5 Jun 2026 with 14 proposals; record date 6 Apr 2026; Class B held 58.9% of voting power on 6.9% of shares (proxy based).
- Directors: R. Martin Chávez 99.0%, Sundar Pichai 98.9%, Larry Page 97.9%, John Hennessy 85.2% of votes cast for.
- Shareholder proposals: equal voting 31.2%, AI data usage oversight 12.3%, AI misinformation 9.3%, climate goals 7.4%; all rejected.
| Holder | Class A (m) | Class B (m) | Voting power (%) |
|---|---|---|---|
| Larry Page | 0.0 | 389.1 | 27.4 |
| Sergey Brin, incl. charitable trusts | 0.0 | 358.9 | 25.3 |
| L. John Doerr | 0.5 | 22.3 | 1.6 |
| BlackRock (Schedule 13G/A, Feb 2024) | 356.9 | 0.0 | 2.5 |
| Directors and executive officers (14 persons) | 2.6 | 770.3 | 54.3 |
10 Risk Factors
- Item 1A of the FY2025 Form 10-K holds 28 risk factors, as in FY2024 (12,478 words against 12,241); the Forms 10-Q of 2026 repeat the factors that changed, eight in Q3 2026.
| Risk | Disclosure and change |
|---|---|
| Search antitrust remedies | Dec 2025 final judgment requires sharing certain search data and offering syndication to qualified competitors and restricts distribution agreements; appealed by Alphabet in Jan 2026 and by the DOJ and states in Feb 2026. |
| Ad tech remedies | Sep 2026 decision denied divestiture and imposed behavioral remedies; the Q3 2026 risk factor names a sale of ad tech assets as a possible remedy; Texas led state case pending. |
| EU fines and DMA | EUR 3.0bn ad tech fine under appeal; DMA fines of EUR 430m and EUR 460m in Jul 2026; Android fine paid, $5.2bn in Jul 2026; accrued fines and settlements $13.8bn. |
| Infrastructure commitments | Purchase commitments $924.4bn, leases not yet commenced $130.5bn and data center backstops $75.7bn at 30 Sep 2026; 10-Q risk factors add hardware buyback obligations below original cost and power agreements. |
| Financing and dilution | Debt $126.1bn; new risk factor in Q2 2026 on dilution from the $40bn at the market program and the mandatory convertible preferred; buybacks may pause while shares are sold. |
| Equity investment volatility | Q3 2026 equity securities loss of $8.7bn after $135.9bn of gains in 1H 2026; $75.2bn of SpaceX shares under sale restrictions; $128.2bn mainly in one private company. |
| AI agents | Q3 2026 10-Q adds text on agents acting beyond intended scope in testing, prompt injection, possible orders to withdraw or retrain models and AI written code in production. |
| Customer concentration in Cloud backlog | Revenue backlog $567.7bn, of which Cloud $560.8bn, incl. $16.8bn with the Crux AI related party; Anthropic's S-1 discloses at least $114.5bn of committed spend with Google from Apr 2026 to Jul 2033. |
How risk factors changed
- Comparison: 10-K FY2025 filed 4 Feb 2026 acc 0001652044-26-000018 against 10-K FY2024 filed 4 Feb 2025 acc 0001652044-25-000014.
- AI appears in 13 of 28 risk factors in the FY2025 10-K against 10 a year earlier, with mentions up from 43 to 58.
- Infrastructure capacity became a stated constraint: the FY2025 10-K adds power, water, land and AI chip supplier limits, and each 2026 10-Q extends the related commitments, from third party leases to custom hardware supply, backstops for data centres and power, and hardware repurchase obligations below original cost.
- Financing risk moved into the text: a new FY2025 10-K factor covers debt and lease financing, Q2 2026 adds the $40bn ATM Program and Mandatory Convertible Preferred Stock, and buybacks may be suspended during ATM sales.
- Competition litigation advanced from a liability finding (Aug 2024 Search ruling) to a Dec 2025 final judgment requiring search data sharing and syndication, with appeals by both sides in Jan and Feb 2026, and the Q3 2026 10-Q lists divestiture of ad tech assets as a possible remedy.
- AI agents are not mentioned in the FY2025 10-K and appear 10 times in the Q3 2026 10-Q, across the AI liability and cybersecurity factors.

| Measure | 10-K FY2024 | 10-K FY2025 |
|---|---|---|
| Risk factors (count) | 28 | 28 |
| Words in Item 1A | 12,241 | 12,478 |
| Change | Risk factor | What changed |
|---|---|---|
| Added | Access to financing and managing indebtedness | New factor stating Alphabet may access capital markets for debt or enter other financing such as leases, and that current and future indebtedness, including obligations under leases, backstops, guarantees and potential liabilities from large commercial agreements, could reduce financial and business flexibility. |
| Removed | Class A and Class C stock price may stay volatile | Factor on trading price volatility of Class A and nonvoting Class C stock, citing repurchase and dividend programs, peer activity and economic conditions, no longer appears as a separate factor. |
| Reworded | Advertising revenue concentration | Heading adds shifts in online advertising and new advertising formats; body adds that AI is reshaping how ads are delivered online with no assurance Alphabet adapts effectively, and drops the Jul 2024 third party cookies user choice example. |
| Reworded | Increasing investment in new businesses is risky | Heading changes 'ongoing' to 'increasing' investment; body adds AI optimized infrastructure and custom TPUs, leasing arrangements with third party operators to meet AI training and inference demand, large long duration commercial agreements with possible excess capacity and counterparty nonpayment, and new contingent liabilities in Google Cloud. |
| Reworded | Revenue growth may slow, operating margin pressure | Margin pressure text rewritten to lead with higher technical infrastructure investment, regulation and competition, adds that some costs are fixed and efficiencies may not continue at past rates, and changes demand risk from 'new technologies' to 'competing technologies'. |
| Reworded | Protecting intellectual property | Adds copyright and patent protection for AI innovations and shortens text on patent scope and on the risk of 'Google' becoming a generic term. |
| Reworded | Manufacturing and supply chain risks | Adds that technical infrastructure growth is constrained by power, water and land, that global energy supply is constrained by AI compute demand, that specialised AI chips come from a small number of suppliers, and that capacity shortfalls would limit model training and serving Cloud customers; adds equipment quality issues and excess or obsolete inventory. |
| Reworded | Fair value of investments, subjective valuation | Drops assets and liabilities acquired in business combinations from fair value measurement, states that changes in fair value of Other Bet SBC awards are recognised mainly through operating expenses, and moves the statement that investment values could decline to the start of the factor. |
| Reworded | New, existing and changing laws worldwide | Adds Japan's smartphone software competition act, AI regulation in Brazil, India, Japan, South Korea, Singapore and Vietnam, more than 1,000 AI bills in US state legislatures in 2025 including frontier model safety and reporting laws passed in California and New York, the US executive order Removing Barriers to American Leadership in AI and the AI Action Plan in place of the prior AI executive order, laws limiting data use for AI training, court challenges to the EU text and data mining exception, and AI energy and water demand complicating emissions goals. |
| Reworded | Claims, lawsuits, investigations including competition | Updates the DOJ Search case to the Dec 2025 final judgment requiring search data sharing and syndication to competitors, Alphabet's Jan 2026 appeal and the DOJ and states' Feb 2026 appeal; updates the ad tech case to the Apr 2025 mixed ruling, Nov 2025 closing arguments on remedies including DOJ structural proposals and a pending judgment; removes the Epic Games v. Google verdict paragraph; adds product design, tort and nuisance, content moderation and AI claims. |
| Filing | Change disclosed |
|---|---|
| 10-Q Q1 2026 filed 29 Apr 2026 | Restates 1 factor (investment in new businesses): the 10-K text on leasing arrangements with third party operators is replaced by the supply of Alphabet's custom hardware to meet customers' AI compute demand, and large commercial agreements now include financial guarantees such as backstops for third party data centres and power infrastructure; no factor added or removed. |
| 10-Q Q2 2026 filed 22 Jul 2026 | Repeats 5 factors, of which 1 is new: new factor on dilution from the ATM Program set up in Jun 2026 to sell up to $40bn of Class A and Class C stock and from conversion of, or share settled dividends on, Mandatory Convertible Preferred Stock; the financing factor adds equity raising through the ATM Program; the repurchase and dividend factor adds required preferred dividends and possible suspension of buybacks during ATM sales; the DMA text now covers search data sharing with third party search engines and Android interoperability for third party AI companies; custom hardware supply is now named TPU systems. |
| 10-Q Q3 2026 filed 28 Oct 2026 | Restates 8 factors, 3 more than Q2 2026: AI agent risks enter the AI liability and security factors (autonomous agents acting beyond intended scope in testing, compounding errors across multistep workflows, prompt injection, possible orders to withdraw or retrain models, AI written code in production); the investment factor adds long term supply, energy service and leasing agreements and contingent repurchase obligations for hardware at prices below original cost; the litigation factor replaces case by case updates with possible remedies including divestiture of ad tech assets and adds youth related trials and Computer Fraud and Abuse Act claims. |
11 Stock Price, Scenarios & Sensitivity
- GOOGL traded at $289.20 before the open on 29 Oct 2026, (11.0%) on the 28 Oct close of $324.89, 29.2% below the 52 week high of $408.36 and 7.0% above the low of $270.16.
- Valuation: 15.1x TTM diluted EPS of $19.16, which includes equity securities gains; about 26.6x excluding them (estimate); 7.2x EV/Sales; free cash flow yield 0.6% on TTM free cash flow of $19.7bn.
- Scenario model: revenue grows from TTM Q3 2026 $471.1bn for three years; operating margin as stated; no investment gains; 18% tax rate; price equals TTM Q3 2029 EPS times exit P/E.

Critical factors and core assumptions
| Factor | Current value | Best case requires | Evidence in filings and calls |
|---|---|---|---|
| Google Cloud growth | Q3 2026 $30.7bn, +103%; backlog $560.8bn | Cloud revenue above $200bn a year by 2029 as backlog converts | 10-Q Q3 2026 Note 2; Q3 2026 call |
| Cloud margin with TPU sales | 36.2% in Q3 2026 | margin at or above 35% as hardware sales scale | Segment note; CFO comments on TPU inventory costs |
| Capex and depreciation | 9M 2026 capex $132.0bn; Q3 depreciation $8.4bn, +49% | capex growth slows after 2027; depreciation below 10% of revenue | 10-Q cash flow; Q3 2026 call |
| Search monetization | Q3 2026 Search +12%; paid clicks +8%, CPC +4% | Search grows near 10% a year with AI Mode and AI Overviews | 10-Q Q3 2026 MD&A |
| Legal remedies | Search and ad tech remedies behavioral; appeals pending | no structural divestiture; fines within accruals | 10-Q Q3 2026 Note 10 |
| Dilution | $27.6bn of at the market capacity; preferred converts into 43m to 54m shares | share count flat as cash flow funds capex after 2027 | 10-Q Q3 2026 equity note |
- Revenue base TTM Q3 2026 $471.1bn; operating income $157.0bn (33.3% margin).
- Best case: 20% revenue CAGR, 36% operating margin, 28x P/E, share count unchanged.
- Base case: 14% revenue CAGR, 32% margin, 22x P/E, share count +1%.
- Worst case: 7% revenue CAGR, 26% margin, 16x P/E, share count +3% from equity issuance and preferred conversion.
- Tax rate 18% (9M 2026: 19.0%); no gains or losses on equity securities; net interest set to zero.
Scenarios, three years forward
| Measure | Worst case | Base case | Best case |
|---|---|---|---|
| Revenue CAGR, 3 years (%) | 7.0 | 14.0 | 20.0 |
| Revenue, TTM Q3 2029 ($bn) | 577.1 | 698.0 | 814.1 |
| Operating margin, TTM Q3 2029 (%) | 26.0 | 32.0 | 36.0 |
| Net income, TTM Q3 2029 ($bn) | 123.0 | 183.1 | 240.3 |
| EPS, TTM Q3 2029 ($) | 9.72 | 14.75 | 19.55 |
| Exit P/E (x) | 16.0 | 22.0 | 28.0 |
| Implied price ($) | 155 | 324 | 547 |
| Change against $289.20 (%) | (46) | 12 | 89 |
| Implied annual return (%) | (18.7) | 3.9 | 23.7 |

Sensitivity analysis
| Revenue CAGR \ Operating margin | 26% | 29% | 32% | 34% | 36% |
|---|---|---|---|---|---|
| 7% | $218 | $243 | $268 | $285 | $302 |
| 10% | $237 | $264 | $292 | $310 | $328 |
| 14% | $264 | $294 | $324 | $345 | $365 |
| 17% | $285 | $318 | $351 | $373 | $395 |
| 20% | $308 | $343 | $378 | $402 | $426 |
| Exit P/E \ Operating margin | 26% | 29% | 32% | 34% | 36% |
|---|---|---|---|---|---|
| 16x | $192 | $214 | $236 | $251 | $265 |
| 19x | $228 | $254 | $280 | $298 | $315 |
| 22x | $264 | $294 | $324 | $345 | $365 |
| 25x | $300 | $334 | $369 | $392 | $415 |
| 28x | $336 | $374 | $413 | $439 | $465 |
Disclaimer
This analysis is for information only and is not financial advice. It is derived from public SEC filings retrieved via sec-api.io and is not a publication of the U.S. Securities and Exchange Commission. Scenario values are model outputs under stated assumptions and are not forecasts. Data as of 29 October 2026.
Sources
All company figures are read from SEC filings retrieved through the sec-api.io MCP server. Call statements are taken from the Q3 2026 and Q2 2026 earnings calls held by the company.
| Form | Period | Filed | Accession number |
|---|---|---|---|
| 10-Q | Q3 2026 | 28 Oct 2026 | 0001652044-26-000084 |
| 8-K (2.02) Ex 99.1 | Q3 2026 | 28 Oct 2026 | 0001652044-26-000080 |
| 10-Q | Q2 2026 | 22 Jul 2026 | 0001652044-26-000071 |
| 10-Q | Q1 2026 | 29 Apr 2026 | 0001652044-26-000048 |
| 10-K | FY2025 | 4 Feb 2026 | 0001652044-26-000018 |
| 10-Q | Q3 2025 | 29 Oct 2025 | 0001652044-25-000091 |
| 10-Q | Q2 2025 | 23 Jul 2025 | 0001652044-25-000062 |
| 10-Q | Q1 2025 | 24 Apr 2025 | 0001652044-25-000043 |
| 10-K | FY2023 | 30 Jan 2024 | 0001652044-24-000022 |
| 10-K | FY2022 | 3 Feb 2023 | 0001652044-23-000016 |
| DEF 14A | 2026 annual meeting | 24 Apr 2026 | 0001308179-26-000342 |
| 8-K (5.07) | 2026 annual meeting | 11 Jun 2026 | 0001193125-26-267578 |
| AMZN 10-Q | Q2 2026 | 30 Jul 2026 | 0001018724-26-000026 |
| Filed | Exhibit | Document | Content |
|---|---|---|---|
| 29 Oct 2025 | EX-99.1 | Q3 2025 earnings press release | Revenue $102.35bn, up 16% (15% constant currency), first $100bn quarter; operating income $31.23bn, up 9%, margin 30.5% (33.9% excluding the $3.5bn European Commission fine).; Google Services revenue $87.05bn, up 14%; Search and other $56.57bn; YouTube ads $10.26bn; Google Cloud revenue $15.16bn, up 34%, operating income $3.59bn; Cloud backlog $155bn. |
| 6 Nov 2025 | EX-4.2 to EX-4.7 | Forms of global notes for €6.5bn euro senior notes (closed 6 Nov 2025) | Six euro series: €1.0bn 2.375% 2028, €1.0bn 2.875% 2031, €1.0bn 3.125% 2034, €1.0bn 3.500% 2038, €1.25bn 4.000% 2044, €1.25bn 4.375% 2064; all mature 6 Nov.; Annual interest each 6 Nov from 2026; held through Euroclear and Clearstream via The Bank of New York Mellon, London Branch. |
| 6 Nov 2025 | EX-4.8 to EX-4.15 | Forms of global notes for $17.5bn US dollar senior notes (closed 6 Nov 2025) | Eight series: $500m floating rate 2028 (Compounded SOFR plus 0.52%), $1.0bn 3.875% 2028, $2.5bn 4.100% 2030, $1.25bn 4.375% 2032, $3.5bn 4.700% 2035, $2.0bn 5.350% 2045, $4.0bn 5.450% 2055, $2.75bn 5.700% 2075.; Maturities 15 Nov; fixed rate interest semiannually 15 May and 15 Nov from 15 May 2026; floating rate notes reset quarterly from 15 Feb 2026. |
| 6 Nov 2025 | EX-5.1 and EX-5.2 | Legality opinions of Cleary Gottlieb Steen & Hamilton (euro and US dollar notes, with consents Ex 23.1 and 23.2) | Opines the notes are validly issued, valid, binding and enforceable obligations of Alphabet, entitled to the benefits of the indenture, subject to customary bankruptcy and equity exceptions. |
| 4 Feb 2026 | EX-99.1 | Q4 and FY2025 earnings press release | Q4 2025 revenue $113.83bn, up 18% (17% constant currency); FY2025 revenue $402.84bn, up 15%, first year above $400bn; FY2025 net income $132.17bn, diluted EPS $10.81.; Q4 operating income $35.93bn, up 16%, margin 31.6%, after a $2.1bn Waymo employee compensation charge; net income $34.46bn, up 30%; diluted EPS $2.82, up 31%. |
| 13 Feb 2026 | EX-4.2 to EX-4.6 | Forms of global notes for £5.5bn sterling senior notes (closed 13 Feb 2026) | Five sterling series: £750m 4.125% 2029, £1.25bn 4.625% 2032, £1.25bn 5.500% 2041, £1.25bn 5.875% 2058 and £1.0bn 6.125% notes due 13 Feb 2126 (a 100 year tenor).; Annual interest, held through Euroclear and Clearstream; make whole before par call at comparable government bond rate plus 10 bp (20 bp on the 2126 notes, par call from 13 Aug 2125). |
| 13 Feb 2026 | EX-4.7 to EX-4.13 | Forms of global notes for $20bn US dollar senior notes (closed 13 Feb 2026) | Seven series: $2.5bn 3.700% 2029, $3.0bn 4.100% 2031, $3.0bn 4.400% 2033, $4.25bn 4.800% 2036, $1.5bn 5.500% 2046, $4.0bn 5.650% 2056, $1.75bn 5.750% 2066; maturities 15 Feb.; Make whole before par call at Treasury rate plus 5 bp (2029) to 15 bp (2046 to 2066); DTC global notes. |
| 13 Feb 2026 | EX-5.1 and EX-5.2 | Legality opinions of Cleary Gottlieb Steen & Hamilton (sterling and US dollar notes) | Notes validly issued and valid, binding and enforceable obligations of Alphabet, subject to customary exceptions; consents included as Ex 23.1 and 23.2. |
| 6 Mar 2026 | Item 5.02 (no exhibit) | CEO Sundar Pichai triennial equity award (approved 4 Mar 2026) | Salary unchanged at $2.0m since 2020; no annual bonus.; Two tranches of PSUs at $63m target each, vesting 0% to 200% on relative TSR against S&P 100 companies over 2026 to 2027 and 2026 to 2028. |
| 2 Apr 2026 | Item 5.02 (no exhibit) | Resignation of Corporate Controller and Principal Accounting Officer | Amie Thuener O'Toole resigned as VP, Corporate Controller and Principal Accounting Officer effective 9 Apr 2026 for another opportunity; no disagreement with the company. |
| 10 Apr 2026 | Item 5.02 (no exhibit) | Executive officer equity awards (granted 8 Apr 2026) | Anat Ashkenazi (CFO): PSUs $10m target and GSUs $20m; Ruth Porat: PSUs $9m and GSUs $20m; Philipp Schindler: PSUs $16m and GSUs $26m; Kent Walker: PSUs $9m and GSUs $20m.; GSUs include transitional amounts after the SVP bonus program ended in 2025 ($6m Ashkenazi, $5m Porat and Walker, $5.67m Schindler); 2026 is the final transition year. |
| 29 Apr 2026 | EX-99.1 | Q1 2026 earnings press release | Revenue $109.90bn, up 22% (19% constant currency); operating income $39.70bn, up 30%, margin 36.1%, up 2 points.; Google Services revenue $89.64bn, up 16% (Search and other $60.40bn, up 19%; YouTube ads $9.88bn, up 11%); Google Cloud revenue $20.03bn, up 63%, operating income $6.60bn; Cloud backlog above $460bn, nearly doubled quarter on quarter. |
| 11 May 2026 | EX-4.2 to EX-4.7 | Forms of global notes for €9.0bn euro senior notes (closed 11 May 2026) | Six series: €1.5bn 3.200% 2030, €1.75bn 3.450% 2032, €1.5bn 3.625% 2034, €1.75bn 4.100% 2039, €1.25bn 4.500% 2045, €1.25bn 4.800% 2063; maturities 11 May.; Make whole before par call at comparable government bond rate plus 10 to 20 bp; Euroclear and Clearstream. |
| 11 May 2026 | EX-4.8 to EX-4.11 | Forms of global notes for Canadian dollar senior notes (tranches total C$8.5bn; the 8-K headline states C$9.5bn) (closed 11 May 2026) | Four series: C$1.5bn 3.650% 2031, C$2.0bn 4.000% 2033, C$2.25bn 4.350% 2036, C$2.75bn 5.000% 2056; maturities 15 May; semiannual interest from 15 Nov 2026.; Held through CDS Clearing and Depository Services; make whole before par call at Government of Canada yield plus 12.5 bp (2031) to 27.5 bp (2056). |
| 11 May 2026 | EX-5.1 and EX-5.2 | Legality opinions of Cleary Gottlieb Steen & Hamilton (euro and Canadian dollar notes) | Notes validly issued and valid, binding and enforceable obligations, subject to customary exceptions; consents included. |
| 21 May 2026 | EX-4.2 to EX-4.8 | Forms of global notes for ¥576.9bn yen senior notes (closed 21 May 2026) | Seven series: ¥135.5bn 1.965% 2029, ¥200.5bn 2.412% 2031, ¥123.2bn 2.822% 2033, ¥64.9bn 3.189% 2036, ¥19.1bn 3.713% 2041, ¥9.3bn 4.395% 2056, ¥24.0bn 4.599% 2066.; Semiannual interest 16 May and 16 Nov from 16 Nov 2026; not redeemable except for US tax law changes; no sinking fund; Euroclear and Clearstream. |
| 21 May 2026 | EX-5.1 | Legality opinion of Cleary Gottlieb Steen & Hamilton (yen notes) | Notes validly issued and valid, binding and enforceable obligations, subject to customary exceptions; consent included as Ex 23.1. |
| 4 Jun 2026 | EX-1.1 | Equity Distribution Agreement for $40bn at the market program (1 Jun 2026) | Managers Goldman Sachs, J.P. Morgan Securities and Morgan Stanley may sell up to $40bn of Class A and Class C stock from time to time.; Commission up to 0.5% of gross proceeds; Alphabet may suspend or terminate at any time; no obligation to sell. |
| 4 Jun 2026 | EX-5.1 and EX-5.2 | Validity opinions of Cleary Gottlieb Steen & Hamilton (ATM shares and underwritten stock offering) | Shares validly issued, fully paid and nonassessable (ATM shares once issued and paid for under the Distribution Agreement). |
| 4 Jun 2026 | EX-99.1 | Press release 1 Jun 2026: proposed $80bn equity capital raise for AI infrastructure | Planned $15bn common stock, $15bn mandatory convertible preferred depositary shares, a $40bn ATM program from Q3 2026 and a $10bn private placement with Berkshire Hathaway ($5bn Class A at $351.81, $5bn Class C at $348.20).; Use of proceeds: capex to scale AI infrastructure and compute; about $30bn of ATM proceeds to cover 2026 employee equity tax obligations under a sell to cover style change. |
| 4 Jun 2026 | EX-99.2 | Press release 2 Jun 2026: upsized and priced $84.75bn equity raise | Priced 25,459,689 Class A shares at $355.1982 and 25,459,689 Class C shares at $351.8018 (upsized to $18bn), plus 167.5m Series A and 167.5m Series B depositary shares at $50 (upsized to $16.75bn).; Preferred: 6.25% Series A and B mandatory convertible, $1,000 liquidation preference, quarterly dividends from 15 Aug 2026, converting about 15 May 2029 into 2.2520 to 2.8160 Class A shares (Series A) or 2.2740 to 2.8420 Class C shares (Series B). |
| 5 Jun 2026 | EX-10.1 and EX-10.2 | Forms of capped call confirmations (Series A on Class A, Series B on Class C) | European style call options in components, with premium, strike and cap left blank in the forms; strike tied to the preferred threshold appreciation price.; 8-K body: entered 2 and 3 Jun 2026 with underwriters or affiliates; initial cap prices $532.6704 (Class A) and $527.7974 (Class C); Alphabet may elect cash settlement; intended to limit dilution on conversion. |
| 5 Jun 2026 | EX-3.1 and EX-3.2 | Certificates of Designations, 6.25% Series A (Class A linked) and Series B (Class C linked) Mandatory Convertible Preferred Stock | Each series 9,625,000 shares, liquidation preference $1,000, i.e. $9.625bn per series and $19.25bn in total after full overallotment (192.5m depositary shares per series).; Initial price $355.1136 (Series A) and $351.8649 (Series B); threshold appreciation price $444.0497 and $439.7537. |
| 5 Jun 2026 | EX-4.3 and EX-4.4 | Deposit Agreements for Series A and Series B depositary shares (with forms of certificate and receipt) | Dated 5 Jun 2026 with Computershare Inc. and Computershare Trust Company as joint depositary; each depositary share is a 1/20th interest in one preferred share.; Depositary share holders receive proportional conversion, dividend, liquidation and voting rights. |
| 5 Jun 2026 | EX-5.1 and EX-5.2 | Validity opinions of Cleary Gottlieb Steen & Hamilton (Series A and Series B preferred and depositary shares) | Preferred duly authorized, validly issued, fully paid and nonassessable; depositary receipts validly issued; underlying Class A or Class C shares reserved for conversion. |
| 5 Jun 2026 | Item 5.02 (no exhibit) | Appointment of Marsida Saraci as Principal Accounting Officer | Marsida Saraci, 47, VP and Controller, at Alphabet since April 2011 after over 8 years at KPMG, named Principal Accounting Officer on 5 Jun 2026.; GSU grants of $280,000 and $440,000 vesting monthly from July 2026. |
| 11 Jun 2026 | EX-10.01 | Amended and Restated 2021 Stock Plan (approved at the 5 Jun 2026 annual meeting) | Share reserve raised by 200m Class C shares; plan maximum 1,650,200,040 shares in aggregate.; Board amended 22 Apr 2026; shareholders approved 5 Jun 2026 with 90.4% of votes cast for; no grants after 5 Jun 2036. |
| 22 Jul 2026 | EX-99.1 | Q2 2026 earnings press release | Revenue $119.80bn, up 24% (23% constant currency); operating income $40.77bn, up 30%, margin 34%.; Google Services revenue $94.54bn, up 15% (Search and other $63.27bn, up 17%; YouTube ads $11.06bn, up 13%); Google Cloud revenue $24.77bn, up 82%, operating income $8.81bn. |
| 10 Aug 2026 | EX-4.2 to EX-4.11 | Forms of global notes for $25bn US dollar senior notes (closed 10 Aug 2026) | Ten series: $750m floating 2028 (Compounded SOFR plus 0.44%), $1.25bn 4.500% 2028, $500m floating 2029 (SOFR plus 0.60%), $2.0bn 4.625% 2029, $3.5bn 4.875% 2031, $2.5bn 5.200% 2033, $4.5bn 5.450% 2036, $3.0bn 6.250% 2046, $4.5bn 6.375% 2056, $2.5bn 6.500% 2066.; Issued under new S-3 shelf 333-296395 and the 2016 indenture with The Bank of New York Mellon Trust Company; DTC global notes. |
| 10 Aug 2026 | EX-5.1 | Legality opinion of Cleary Gottlieb Steen & Hamilton ($25bn notes) | Notes validly issued and valid, binding and enforceable obligations, subject to customary exceptions; consent included as Ex 23.1. |
| 28 Oct 2026 | EX-99.1 | Q3 2026 earnings press release | Revenue $127.58bn, up 25% (25% constant currency), 13th consecutive quarter of double digit growth; operating income $40.58bn, up 30%, margin 31.8%.; Google Services revenue $96.30bn, up 11% (Search and other $63.35bn, up 12%; YouTube ads $11.21bn; subscriptions, platforms and devices $14.29bn); Services operating income $39.16bn. |