Amazon (AMZN), Financial Analysis
Insights derived from analysing SEC filings. Independent analysis, not a publication of the SEC.
- AWS earns most of the profit. AWS net sales $46.0bn, +39.3%, and operating income $17.8bn, 63.3% of Amazon's $28.1bn in Q3 2026; North America and International together earned $10.3bn on $156.0bn of net sales. Consolidated operating margin 13.9%.
- Backlog tied to AI labs. Contract backlog, mainly AWS, $578bn at 30 Sep 2026 against $200bn a year earlier; OpenAI expanded its AWS commitment by $100bn over 8 years and Anthropic by more than $100bn over 10 years, both with Trainium capacity.
- Retail and advertising growth reflect the Prime Day move to Q2. Online stores +2% and advertising +12% excl. FX (Q2 2026: +15% and +26%); the release puts the effect at about 400 bp on total net sales growth. North America margin 7.7% against 4.5%, when Q3 2025 carried the $2.5bn FTC settlement; Q4 advertising guided to growth in the high teens.
- Capex funded with debt. Capex $75.9bn in Q3 2026 and $172.2bn in 9M 2026; 2026 guidance about $220bn. TTM free cash flow ($42.4bn); long term debt proceeds $115.1bn in 9M 2026; long term debt $173.1bn against $65.6bn at Dec 2025.
- Net income follows Anthropic marks. Q3 2026 net income $20.7bn, (2.4%), while operating income rose 61%: Q3 2025 included $9.5bn of pre tax Anthropic gains. 9M 2026 other income $68.4bn; Anthropic stake carried at $238.7bn and OpenAI preferred at $50.0bn at 30 Sep 2026.
- Shares $240.35 on 30 Oct 2026, (1.4%) after results, 19.4x TTM EPS incl. investment gains and about 32.8x excluding them (estimate); 3.3x EV/Sales. Base case $353 in three years; best $586; worst $147.
Figures are read from the Forms 10-K for FY2022 to FY2025, the Forms 10-Q for Q1 2025 to Q3 2026, the Forms 8-K with all their exhibits, incl. the quarterly earnings releases with their financial appendices (Ex 99.1) and non GAAP statements (Ex 99.2), the 2025 letter to shareholders and its free cash flow table (Ex 99.1, 99.2), the OpenAI equity commitment letter and partnership release (Ex 10.1, 99.1), the $17.5bn term loan agreement (Ex 10.1), the Globalstar merger release (Ex 99.1) and the underwriting agreements, officers' certificates and legal opinions for six notes offerings (Ex 1.1, 4.1, 5.1), the proxy statement of 2026 and the Form 8-K Item 5.07 vote results, and Forms 4 for central index key 1018724, together with the filings of 13 companies used in chapters 2 to 4 and 7 and Anthropic's Form S-1. CFO commentary comes from the CFO remarks on the 2026 earnings calls and at the annual meeting, as Amazon files no separate CFO commentary document; call content is labelled as stated on the call. Accession numbers for every filing used appear in the Sources appendix. Market prices are closing prices of 30 October 2026.
1 Revenue & Business Model
- Storyline: AWS earns most operating income, retail and advertising bring most net sales, and the AI build out is funded with debt. AWS was 22.8% of Q3 2026 net sales against 18.3% a year earlier, and 63.3% of operating income. Chapters 2 to 4 cover the three revenue drivers: AWS, online stores and third party sellers, and advertising.
- Three segments in FY2025: North America $426.3bn of net sales (59.5%), 6.9% operating margin; International $161.9bn (22.6%), 2.9%; AWS $128.7bn (18.0%), 35.4%, and 57.0% of operating income of $80.0bn.
- Revenue by type FY2025: online stores $269.3bn, third party seller services $172.2bn, AWS $128.7bn, advertising $68.6bn, subscriptions $49.6bn, physical stores $22.6bn.
- Net sales FY2021 $469.8bn to FY2025 $716.9bn, a 11.1% CAGR; TTM Q3 2026 $797.5bn.
- Customer location FY2025: United States $489.7bn (68.3%), Germany $45.9bn, United Kingdom $43.2bn, Japan $30.7bn, rest of world $107.5bn (15.0%).
- Employees 1.638m at 30 Sep 2026, +3.8% year on year.


| Segment | FY2021 | FY2022 | FY2023 | FY2024 | FY2025 |
|---|---|---|---|---|---|
| North America net sales ($bn) | 279.8 | 315.9 | 352.8 | 387.5 | 426.3 |
| North America operating income ($bn) | 7.3 | (2.8) | 14.9 | 25.0 | 29.6 |
| North America operating margin (%) | 2.6 | (0.9) | 4.2 | 6.4 | 6.9 |
| International net sales ($bn) | 127.8 | 118.0 | 131.2 | 142.9 | 161.9 |
| International operating income ($bn) | (0.9) | (7.7) | (2.7) | 3.8 | 4.8 |
| International operating margin (%) | (0.7) | (6.6) | (2.0) | 2.7 | 2.9 |
| AWS net sales ($bn) | 62.2 | 80.1 | 90.8 | 107.6 | 128.7 |
| AWS operating income ($bn) | 18.5 | 22.8 | 24.6 | 39.8 | 45.6 |
| AWS operating margin (%) | 29.8 | 28.5 | 27.1 | 37.0 | 35.4 |
| Segment | Q3 2025 | Q4 2025 | Q1 2026 | Q2 2026 | Q3 2026 |
|---|---|---|---|---|---|
| North America net sales ($bn) | 106.27 | 127.08 | 104.14 | 116.18 | 112.85 |
| North America operating income ($bn) | 4.79 | 11.47 | 8.27 | 9.12 | 8.72 |
| North America growth excl. FX (%) | 11 | 10 | 12 | 16 | 6 |
| International net sales ($bn) | 40.90 | 50.72 | 39.79 | 42.20 | 43.11 |
| International operating income ($bn) | 1.20 | 1.04 | 1.42 | 1.72 | 1.58 |
| International growth excl. FX (%) | 10 | 11 | 11 | 15 | 8 |
| AWS net sales ($bn) | 33.01 | 35.58 | 37.59 | 42.23 | 45.98 |
| AWS operating income ($bn) | 11.43 | 12.47 | 14.16 | 16.62 | 17.77 |
| AWS growth excl. FX (%) | 20 | 24 | 28 | 37 | 39 |
| AWS operating margin (%) | 34.6 | 35.0 | 37.7 | 39.4 | 38.7 |
| Revenue line | Q3 2025 | Q4 2025 | Q1 2026 | Q2 2026 | Q3 2026 |
|---|---|---|---|---|---|
| Online stores ($bn) | 67.41 | 82.99 | 64.25 | 70.43 | 68.47 |
| Physical stores ($bn) | 5.58 | 5.86 | 5.79 | 5.79 | 5.71 |
| Third party seller services ($bn) | 42.49 | 52.82 | 41.58 | 46.78 | 46.49 |
| Advertising services ($bn) | 17.70 | 21.32 | 17.24 | 19.81 | 19.64 |
| Subscription services ($bn) | 12.57 | 13.12 | 13.43 | 13.73 | 14.01 |
| AWS ($bn) | 33.01 | 35.58 | 37.59 | 42.23 | 45.98 |
| Other ($bn) | 1.42 | 1.71 | 1.65 | 1.83 | 1.65 |
2 AWS: Backlog, Custom Chips and the AI Capacity Race
- AWS net sales $46.0bn in Q3 2026, +39.3%; operating income $17.8bn, 38.7% margin against 34.6% a year earlier. TTM net sales $161.4bn, +32.4%; TTM operating income $61.0bn, 37.8% margin. AWS was 22.8% of Amazon net sales and 63.3% of operating income in Q3 2026.
- Backlog $578bn at 30 Sep 2026 against $244bn at Dec 2025 and $200bn a year earlier; weighted average remaining life 6.1 years against 3.8 years a year earlier. OpenAI expanded its $38bn AWS commitment by $100bn over 8 years in Q1 2026; Anthropic expanded its commitment by more than $100bn over 10 years in Q2 2026.
- Custom chips: the chips business (Graviton, Trainium, Nitro) ran above a $25bn annual revenue rate in Q2 2026, against above $10bn for Trainium and Graviton in Q4 2025; OpenAI is to consume about 2 GW of Trainium from 2027 and Anthropic up to 5 GW. Stated on the call: most Bedrock inference runs on Trainium; external Trainium chip sales planned from late 2027.
- Capacity: AWS property additions $57.1bn in Q3 2026 and $147.2bn in 9M 2026, 74.8% of Amazon's $196.9bn (accrual basis incl. finance leases); AWS added 3.9 GW of power in 2025 and plans to double total power capacity by end of 2027 (2025 shareholder letter).
- Management run rates (8-K Ex 99.1): AWS annualized revenue $184bn in Q3 2026 against $169bn in Q2; AI business above a $25bn run rate in Q2 2026, growing at triple digit rates. The CEO projects AWS growth over 40% in both 2027 and 2028.

How cloud and AI infrastructure are changing
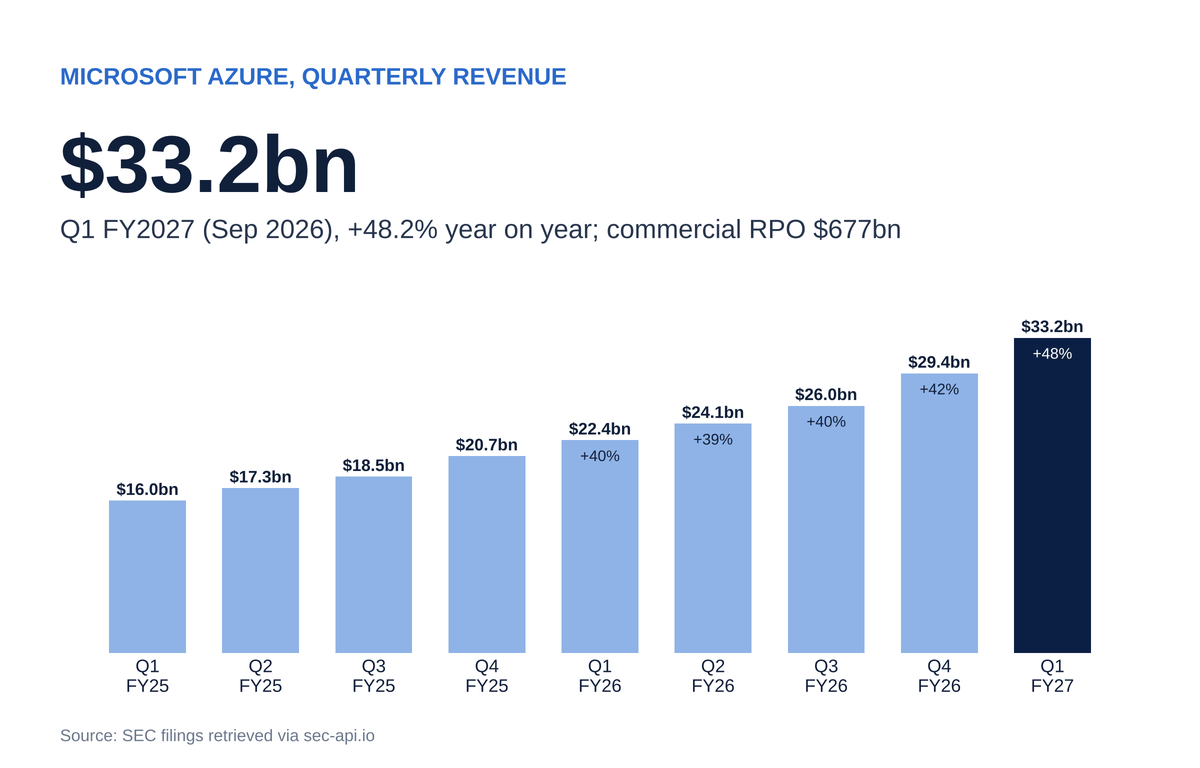
- Backlogs grow across large clouds: Microsoft commercial RPO $677bn (+73%, Sep 2026), Oracle RPO $664bn (Aug 2026), Amazon $578bn and Google Cloud $560.8bn (Sep 2026). Definitions differ.
- Growth rates differ: Google Cloud +102.6% in Q3 2026 and Azure +48.2% in the Sep 2026 quarter against AWS +39.3%; Oracle cloud infrastructure +120.7% (Aug quarter); Alibaba AI Cloud and Compute Services +45.0% (Jun quarter); CoreWeave revenue +112.5% (Q2 2026).
- AI developers buy from several clouds: Anthropic's S-1 lists minimum compute spend of $114.5bn with Google, $110.0bn with Amazon and $44.9bn with Microsoft. Amazon also holds equity in both labs: Anthropic at $238.7bn and OpenAI preferred at $50.0bn at 30 Sep 2026.
- Custom accelerators: Alphabet sells TPU systems to third parties from Q2 2026; Alibaba's Zhenwu chips are used by over 650 external customers (Jun 2026 quarter); Amazon's chips business ran above a $25bn rate in Q2 2026.
- Capex: Amazon TTM net capex $210.7bn, +81.8%; Alphabet $159.8bn (Q3 2026); Microsoft $135.9bn (Sep 2026); Oracle $75.7bn (Aug 2026). Amazon holds energy contracts of about 690m MWh under derivative accounting, with a weighted average of about 18 years remaining.

| Business | Period | Revenue | Growth (%) | Operating margin (%) | Backlog or RPO | Company capex TTM |
|---|---|---|---|---|---|---|
| Amazon Web Services | Q3 2026 | 45.98 | 39.3 | 38.7 | 578.0 | 210.7 |
| Google Cloud (Alphabet) | Q3 2026 | 30.71 | 102.6 | 36.2 | 560.8 | 159.8 |
| Microsoft Azure | Sep 2026 quarter | 33.17 | 48.2 | not filed | 677.0 | 135.9 |
| Oracle cloud infrastructure | Aug 2026 quarter | 7.39 | 120.7 | not filed | 664.0 | 75.7 |
| Alibaba AI Cloud and Compute Services | Jun 2026 quarter | 7.14 | 45.0 | not filed | not filed | not filed |
| CoreWeave | Q2 2026 | 2.58 | 112.5 | (1.9) | 104.0 | not filed |
3 Online Stores and Third Party Sellers: Speed, Selection and Margin
- Online stores $68.5bn in Q3 2026, +1.6% (+2% excl. FX), and third party seller services $46.5bn, +9.4%, after +14.6% and +15.9% in Q2 2026, when Prime Day fell; the release puts the timing effect at about 400 bp on total net sales growth. TTM online stores plus third party seller services $473.8bn, +10.5%.
- Segment margins: North America operating income $8.7bn, 7.7% margin, against $4.8bn (4.5%) in Q3 2025, which included the $2.5bn FTC settlement; International $1.6bn, 3.7%, against 2.9%. TTM margins 8.2% and 3.3%.
- Units and costs: paid units +12%; third party sellers 61% of units; shipping costs $28.3bn, +11.5%; physical stores $5.7bn, +2.4%; subscription services $14.0bn, +11.4%.
- Delivery and shopping tools (8-K Ex 99.1): more than 1.5bn items arrived same day or overnight for Prime members in Q3 2026, and fresh groceries and everyday essentials were about half of all units sold; Amazon Now delivery in over 450 towns and cities, with items ordered up 10x; Alexa for Shopping used by over 400m customers in 12 months, with interactions +570%.

| Metric | Q3 2025 | Q4 2025 | Q1 2026 | Q2 2026 | Q3 2026 |
|---|---|---|---|---|---|
| Paid units growth (%) | 11 | 12 | 15 | 17 | 12 |
| Third party share of paid units (%) | 62 | 61 | 60 | 61 | 61 |
| Shipping costs ($bn) | 25.38 | 31.49 | 25.71 | 27.87 | 28.30 |
| Shipping costs (% of net sales) | 14.1 | 14.8 | 14.2 | 13.9 | 14.0 |
| Employees (thousands) | 1,578 | 1,576 | 1,575 | 1,595 | 1,638 |
How retail and marketplaces are changing
- Marketplaces grow at different rates: MercadoLibre GMV +43.7% and Shopify GMV +31.6% (Q2 2026), eBay GMV +15.0% (Q3 2026); Alibaba China ecommerce customer management revenue fell 7% in the Jun 2026 quarter.
- Store based rivals push online: Walmart global eCommerce sales +23% in the quarter to Jul 2026, led by store fulfilled pickup and delivery and marketplace; Walmart US operating income $8.1bn, 6.5% margin; membership fee revenue +17%.
- Trade policy: the US suspended duty free de minimis treatment of low value imports for all countries from 29 Aug 2025 (US Customs and Border Protection); Amazon's Q3 2026 10-Q lists trade restrictions and tariff changes affecting China based sellers, whom it names as a source of third party seller services and advertising revenue, as a risk to operating results.
- Litigation: private class actions in the US, Canada and the UK allege anticompetitive pricing policies, Featured Offer selection, use of seller data and Prime structure; three UK class actions and one US class action are certified.

| Company and line | Period | Value ($bn) | Growth (%) | Operating margin (%) |
|---|---|---|---|---|
| Amazon online stores | Q3 2026 | 68.47 | 1.6 | not filed |
| Amazon third party seller services | Q3 2026 | 46.49 | 9.4 | not filed |
| Amazon North America segment | Q3 2026 | 112.85 | 6.2 | 7.7 |
| Amazon International segment | Q3 2026 | 43.11 | 5.4 | 3.7 |
| Walmart total revenue | Quarter to 31 Jul 2026 | 187.90 | 5.9 | 5.0 |
| Shopify GMV | Q2 2026 | 115.57 | 31.6 | 13.6 |
| MercadoLibre GMV | Q2 2026 | 21.93 | 43.7 | 6.7 |
| eBay GMV | Q3 2026 | 23.20 | 15.0 | 19.2 |
| Coupang Product Commerce net revenue | Q2 2026 | 7.40 | 1.0 | not filed |
| Alibaba group revenue | Jun 2026 quarter | 39.64 | 9.0 | 6.0 |
4 Advertising: Retail Media, Prime Video and AI Agents
- Advertising services $19.6bn in Q3 2026, +10.9% (+12% excl. FX), after +26% excl. FX in Q2 2026; stated on the call: Prime Day timing took 850 bp off growth. TTM $78.0bn, +20.7%, 9.8% of net sales. Q4 2026 guidance: growth in the high teens.
- Subscription services $14.0bn, +11.4% (+12% excl. FX). Prime Video sports inventory: Thursday Night Football averaged 17.7m viewers over six games in 2026, +16% on the prior season average; NBA on Prime started its second season in over 200 countries (8-K Ex 99.1).
- AI in ad buying: Amazon introduced Amazon Ads Agent and launched Full Funnel Campaigns in it for all US advertisers in Q3 2026, combining sponsored ads, display, video and streaming TV in one campaign.
- Regulation: in Aug 2026 the FTC with 22 state Attorneys General, and Texas separately, filed complaints alleging Amazon harmed advertisers through reserve prices in sponsored ad auctions; they seek injunctive relief and civil penalties.

How advertising is changing
- Retail media: Walmart global advertising +38.0% in the quarter to Jul 2026, incl. Walmart Connect +43% excl. VIZIO; eBay first party advertising +16.0% (Q3 2026); Amazon advertising +26.2% in Q2 2026 and +10.9% in Q3 2026.
- Social and search platforms, Q3 2026: Meta advertising +25.9% with impressions +10% and price per ad +14%; Google advertising +10.6% with paid clicks +8%; Reddit ad revenue +54.0%; Pinterest revenue +11.9%.
- Scale in Q3 2026: Google advertising $82.0bn, Meta advertising $63.1bn, Amazon advertising $19.6bn, Microsoft search and advertising $6.6bn (Sep 2026 quarter).

| Company and line | Period | Revenue ($bn) | Growth (%) |
|---|---|---|---|
| Amazon advertising services | Q3 2026 | 19.64 | 10.9 |
| Google advertising (Alphabet) | Q3 2026 | 82.01 | 10.6 |
| Meta advertising | Q3 2026 | 63.06 | 25.9 |
| Microsoft search and advertising | Sep 2026 quarter | 6.55 | 10.3 |
| Walmart global advertising | Quarter to 31 Jul 2026 | not filed | 38.0 |
| Reddit ad revenue | Q3 2026 | 0.85 | 54.0 |
| Pinterest revenue | Q3 2026 | 1.17 | 11.9 |
| eBay first party advertising | Q3 2026 | 0.58 | 16.0 |
5 Financial Analysis & Ratios
- Operating margin 13.9% in Q3 2026 against 9.7% in Q3 2025, which carried the $2.5bn FTC settlement and $1.8bn of severance; TTM 13.1% against 11.2% in FY2025 and 2.4% in FY2022.
- Net income TTM $134.8bn, 16.9% of net sales, includes $69.5bn of other income, mainly Anthropic marks; the GAAP P/E of 19.4x reflects these gains.
- Capex TTM $210.7bn, 26.4% of net sales, against $128.3bn (17.9%) in FY2025 and $55.4bn in FY2021. Operating cash flow TTM $168.3bn, +28.8%; free cash flow ($42.4bn) TTM against $11.2bn in FY2025.
- Balance sheet at 30 Sep 2026: cash and marketable securities $114.2bn; debt $180.3bn carrying value, incl. the $17.5bn term loan; finance leases $14.5bn, financing obligations $9.7bn, operating leases $100.3bn; total assets $1.24tn against $818.0bn at Dec 2025.
- Capital returns: no dividends; no buybacks since $6.0bn in FY2022; $6.1bn of authorization remains.
| Line item | FY2021 | FY2022 | FY2023 | FY2024 | FY2025 | TTM Q3 2026 |
|---|---|---|---|---|---|---|
| Revenue | 469.8 | 514.0 | 574.8 | 638.0 | 716.9 | 797.5 |
| Gross profit | 197.5 | 225.2 | 270.0 | 311.7 | 360.5 | 409.7 |
| Research and development | 56.1 | 73.2 | 85.6 | 88.5 | 108.5 | 126.9 |
| Selling, general and administrative | 41.4 | 54.1 | 56.2 | 55.3 | 58.3 | 58.7 |
| Operating income | 24.9 | 12.2 | 36.9 | 68.6 | 80.0 | 104.4 |
| Net income | 33.4 | (2.7) | 30.4 | 59.2 | 77.7 | 134.8 |
| Diluted EPS ($) | 3.24 | (0.27) | 2.90 | 5.53 | 7.17 | 12.37 |
| Operating cash flow | 46.3 | 46.8 | 84.9 | 115.9 | 139.5 | 168.3 |
| Capital expenditure | (55.4) | (58.3) | (48.1) | (77.7) | (128.3) | (210.7) |
| Free cash flow | (9.1) | (11.6) | 36.8 | 38.2 | 11.2 | (42.4) |
| Stock based compensation | 12.8 | 19.6 | 24.0 | 22.0 | 19.5 | 19.9 |
| Cash and investments | 96.0 | 70.0 | 86.8 | 101.2 | 123.0 | 114.2 |
| Total debt | 50.2 | 70.1 | 67.0 | 57.8 | 68.9 | 180.3 |
| Total equity | 138.2 | 146.0 | 201.9 | 286.0 | 411.1 | 613.6 |

| Metric | Q3 2025 | Q3 2026 | Change |
|---|---|---|---|
| Revenue ($bn) | 180.17 | 201.94 | 12.1% |
| Gross profit ($bn) | 91.50 | 107.37 | 17.3% |
| Operating income ($bn) | 17.42 | 28.08 | 61.2% |
| Net income ($bn) | 21.19 | 20.69 | (2.4%) |
| Diluted EPS ($) | 1.95 | 1.89 | (3.1%) |
| Operating cash flow ($bn) | 35.53 | 42.42 | 19.4% |
| Free cash flow ($bn) | 1.30 | (33.46) | n/a |
| Operating margin (%) | 9.7 | 13.9 | 4.2 pts |
| Net margin (%) | 11.8 | 10.2 | (1.5 pts) |
| Ratio | FY2021 | FY2022 | FY2023 | FY2024 | FY2025 | TTM Q3 2026 |
|---|---|---|---|---|---|---|
| Growth and margins | ||||||
| Revenue growth (%) | n/a | 9.4 | 11.8 | 11.0 | 12.4 | n/a |
| Gross margin (%) | 42.0 | 43.8 | 47.0 | 48.9 | 50.3 | 51.4 |
| Operating margin (%) | 5.3 | 2.4 | 6.4 | 10.8 | 11.2 | 13.1 |
| Net margin (%) | 7.1 | (0.5) | 5.3 | 9.3 | 10.8 | 16.9 |
| FCF margin (%) | (1.9) | (2.3) | 6.4 | 6.0 | 1.6 | (5.3) |
| Cost and investment intensity | ||||||
| R&D (%) revenue | 11.9 | 14.2 | 14.9 | 13.9 | 15.1 | 15.9 |
| SBC (%) revenue | 2.7 | 3.8 | 4.2 | 3.5 | 2.7 | 2.5 |
| Capex (%) revenue | 11.8 | 11.3 | 8.4 | 12.2 | 17.9 | 26.4 |
| Effective tax rate (%) | 12.6 | n/a | 19.0 | 13.5 | 19.6 | 22.3 |
| Returns | ||||||
| ROE (%) | 24.1 | (1.9) | 17.5 | 24.3 | 22.3 | 22.0 |
| ROA (%) | 7.9 | (0.6) | 6.1 | 10.3 | 10.8 | 10.8 |
| ROIC (%) | 23.5 | 6.9 | 16.4 | 24.5 | 18.0 | 11.9 |
| Asset turnover (x) | 1.12 | 1.11 | 1.09 | 1.02 | 0.88 | 0.64 |
| Liquidity and leverage | ||||||
| Current ratio (x) | 1.14 | 0.94 | 1.05 | 1.06 | 1.05 | 0.99 |
| Debt to equity (x) | 0.36 | 0.48 | 0.33 | 0.20 | 0.17 | 0.29 |
| Net cash ($bn) | 45.8 | (0.1) | 19.8 | 43.4 | 54.2 | (66.1) |
| Efficiency and cash quality | ||||||
| Days sales outstanding | 26 | 30 | 33 | 32 | 34 | 45 |
| Inventory days | 44 | 43 | 40 | 38 | 39 | 40 |
| FCF to net income (x) | (0.27) | n/a | 1.21 | 0.65 | 0.14 | (0.31) |


| Measure | Value |
|---|---|
| Market cap ($bn) | 2,598.9 |
| Enterprise value ($bn) | 2,665.0 |
| P/E (TTM) (x) | 19.4 |
| EV/Sales (TTM) (x) | 3.3 |
| EV/EBITDA (TTM) (x) | 14.5 |
| FCF yield (%) | (1.6) |
| Price/Book (x) | 4.2 |
Cost structure and profitability
- Cost of sales 46.8% of Q3 2026 net sales against 49.2% a year earlier, as AWS and advertising grew faster than online stores.
- Technology and infrastructure $34.8bn, +20.2%, 17.2% of net sales; it holds AWS infrastructure costs and depreciation. Depreciation and amortization in the cash flow statement $20.9bn, +24.7%.
- Fulfillment $30.0bn, 14.9% of net sales against 15.4%; shipping costs $28.3bn, +11.5%.
- Other operating expense $134m against $2.9bn in Q3 2025, which included the FTC settlement; interest expense $1.7bn against $0.5bn on new debt.
- Investment gains explain the gap between operating income and net income: other income $15.6bn in Q1 2026, $53.4bn in Q2 2026 and ($0.7bn) in Q3 2026; 9M 2026 net income $113.6bn against operating income $79.4bn; 9M 2026 tax $33.9bn incl. $15.2bn of discrete expense on these gains.
- Free cash flow as filed ($42.4bn) TTM. Amazon stopped presenting its two lease adjusted free cash flow measures after the FY2024 10-K; the measure less principal repayments of finance leases and financing obligations is computed here with Amazon's former formula: ($44.4bn) TTM and $9.3bn in FY2025.


| Line | Q3 2025 | Q4 2025 | Q1 2026 | Q2 2026 | Q3 2026 |
|---|---|---|---|---|---|
| Cost of sales (% of net sales) | 49.2 | 51.5 | 48.2 | 47.7 | 46.8 |
| Fulfillment (% of net sales) | 15.4 | 14.4 | 15.0 | 14.8 | 14.9 |
| Technology and infrastructure (% of net sales) | 16.1 | 13.8 | 16.3 | 16.5 | 17.2 |
| Sales and marketing (% of net sales) | 6.5 | 6.7 | 5.7 | 5.8 | 5.8 |
| General and administrative (% of net sales) | 1.6 | 1.3 | 1.4 | 1.4 | 1.3 |
| Depreciation and amortization (incl. in lines above) (% of net sales) | 9.3 | 9.1 | 10.4 | 10.0 | 10.4 |
| Stock based compensation (incl. in lines above) (% of net sales) | 2.7 | 2.1 | 2.2 | 3.0 | 2.7 |
| Operating income (% of net sales) | 9.7 | 11.7 | 13.1 | 13.7 | 13.9 |
| Capex (% of net sales) | 19.0 | 18.0 | 23.8 | 26.5 | 37.6 |
| Line | Q3 2025 | Q3 2026 | 9M 2026 |
|---|---|---|---|
| Net sales | 180.17 | 201.94 | 584.07 |
| Operating income | 17.42 | 28.08 | 79.39 |
| Interest income | 1.10 | 1.19 | 3.62 |
| Interest expense | (0.54) | (1.69) | (3.81) |
| Upward adjustments to private equity investments, mainly Anthropic preferred | 7.23 | 0.04 | 62.85 |
| Gains reclassified from AOCI on note conversions | 2.31 | (0.01) | 4.47 |
| Other items in other income (warrants, marketable equity, other) | 0.65 | (0.74) | 1.03 |
| Income taxes | (6.91) | (6.18) | (33.94) |
| Equity method investment activity | (0.07) | 0.00 | (0.03) |
| Net income | 21.19 | 20.69 | 113.59 |
| Holding | 31 Dec 2025 | 30 Sep 2026 |
|---|---|---|
| Anthropic nonvoting preferred stock (carrying value) | 14.8 | 92.5 |
| Anthropic convertible notes (fair value) | 45.8 | 146.2 |
| of which unrealized gain in AOCI | 39.5 | 140.3 |
| OpenAI Series C preferred stock (invested) | 0.0 | 50.0 |
| All private equity investments without readily determinable fair value | 16.2 | 143.7 |
| Equity warrants (fair value) | 2.7 | 4.3 |
| Measure | FY2021 | FY2022 | FY2023 | FY2024 | FY2025 | TTM Q3 2026 |
|---|---|---|---|---|---|---|
| Operating cash flow | 46.3 | 46.8 | 84.9 | 115.9 | 139.5 | 168.3 |
| Capex, net of proceeds and incentives | (55.4) | (58.3) | (48.1) | (77.7) | (128.3) | (210.7) |
| Free cash flow, as filed | (9.1) | (11.6) | 36.8 | 38.2 | 11.2 | (42.4) |
| Principal repayments of finance leases | (11.2) | (7.9) | (4.4) | (2.0) | (1.6) | (1.7) |
| Principal repayments of financing obligations | (0.2) | (0.2) | (0.3) | (0.7) | (0.3) | (0.3) |
| Free cash flow less principal repayments, computed | (20.4) | (19.8) | 32.2 | 35.5 | 9.3 | (44.4) |
| Item | $bn | % of TTM net sales |
|---|---|---|
| Total contractual obligations | 883.6 | 111 |
| of which purchase obligations for property and equipment | 159.6 | 20 |
| of which leases not yet commenced | 164.9 | 21 |
| of which media, energy and software | 94.8 | 12 |
| Contract backlog, for comparison | 578.0 | 72 |
6 MD&A & Management Commentary
Q3 2026 earnings call and results release
- Q3 2026 (29 Oct 2026): net sales $201.9bn, +12.1% (+13% excl. a $0.9bn FX headwind); operating income $28.1bn, +61.2%, above the guided $22.5bn to $26.5bn; diluted EPS $1.89 against $1.95; effective tax rate 23.0%.
- Segments: North America $112.9bn, +6.2%, 7.7% margin; International $43.1bn, +8% excl. FX, 3.7%; AWS $46.0bn, +39.3%, 38.7%. 9M 2026 AWS net sales $125.8bn, +35.1%.
- Stated on the call: AWS added $3.8bn of revenue against Q2; AI revenue grows at triple digit rates, with inference well over half; Bedrock spend by Fortune 500 customers nearly 7x year on year; Graviton and Trainium revenue commitments each up more than 20x; external Trainium chip sales planned from late 2027.
- Stated on the call: reserved capacity blocks range from hundreds of MW to about 1 GW, with visibility into 2027, 2028 and part of 2029; more than 1 million robots in the fulfillment network; 1.5bn items delivered same day or overnight to Prime members in Q3; about 85% of global IT spend still on premises (CEO).
- Stated on the call: shipping costs +11%, about 8% excluding fuel and line haul inflation; advertising growth carried an 850 bp Prime Day timing headwind; Amazon Leo costs mostly expensed in Q4 2026 before capitalization starts in Q1 2027.
- Q2 2026 call (30 Jul 2026), stated on the call: operating income $27.5bn incl. about $1.2bn of one time benefits (tariff refunds and an energy contract gain, about $0.6bn each); backlog $496bn; the CEO put 2026 capex at about $220bn against about $200bn, citing memory costs; plan to double 2025 power capacity by end of 2027.
| Item | Outlook | Source |
|---|---|---|
| Q4 2026 net sales | $240.0bn to $247.0bn, +12% to +16% on Q4 2025 ($213.4bn); about 60 bp FX headwind | 8-K Ex 99.1, 29 Oct 2026 |
| Q4 2026 operating income | $28.5bn to $33.5bn against $25.0bn in Q4 2025; assumes no energy derivative remeasurement impact | 8-K Ex 99.1, 29 Oct 2026 |
| Q4 2026 advertising | growth in the high teens | 8-K Ex 99.1, 29 Oct 2026 |
| 2026 cash capex | about $220bn; 9M 2026 cash capex $172.2bn | 8-K Ex 99.1, 29 Oct 2026; 10-Q Q3 2026 |
| 2026 cash capex, earlier statements | about $220bn, stated by the CEO on the Q2 2026 call; about $200bn in the Q4 2025 release and the 2025 shareholder letter | Q2 2026 call, 30 Jul 2026; 8-K Ex 99.1, 5 Feb and 8 Apr 2026 |
| 2027 capex | expected to increase meaningfully, mainly technology infrastructure; no figure | 10-Q Q3 2026 MD&A; Q3 2026 call |
| Financing | additional financing expected in 2026 | 10-Q Q3 2026 |
| AWS growth | over 40% in both 2027 and 2028 (CEO projection) | 8-K Ex 99.1, 29 Oct 2026 |
| Amazon Leo | initial service later in 2026; capitalization of certain costs from Q1 2027 (stated on the call) | 8-K Ex 99.1, 29 Oct 2026; Q3 2026 call |
| Q3 2026 guidance and actual | $197.0bn to $202.0bn and $22.5bn to $26.5bn; actual $201.9bn and $28.1bn | 8-K Ex 99.1, 30 Jul 2026 |
| Q2 2026 guidance and actual | $194.0bn to $199.0bn and $20.0bn to $24.0bn; actual $200.6bn and $27.5bn | 8-K Ex 99.1, 29 Apr 2026 |
| Q1 2026 guidance and actual | $173.5bn to $178.5bn and $16.5bn to $21.5bn incl. about $1bn higher Amazon Leo costs; actual $181.5bn and $23.9bn | 8-K Ex 99.1, 5 Feb 2026 |
Management and CFO commentary
- CFO Brian Olsavsky, Q3 2026 call (stated on the call): gave no AWS margin guidance and said the AI mix pressures margins; Q3 cash capex $75.9bn; 2027 capex to be meaningfully higher, with no figure.
- CFO, Q2 2026 call (stated on the call): about $1.2bn of one time benefits in Q2 operating income, mostly in AWS; AWS margin about 39%, up 650 bp year on year (520 bp excl. the energy contract gain); AWS margins will fluctuate; Amazon issued debt in 2026 and has many funding options.
- CFO, Q1 2026 call (stated on the call): Q1 operating margin 13.1%, the highest reported at that time; Q1 cash capex $43.2bn, mainly for AWS and generative AI; outbound shipping +12% and fulfillment +9% excl. FX against 15% unit growth; about $1bn higher Amazon Leo costs in Q2.
- CFO, 2026 annual meeting (20 May 2026): FY2025 free cash flow $11bn against $38bn in 2024; called free cash flow the most important long term financial metric.
- CEO Andy Jassy, 8-K Ex 99.1 of 29 Oct 2026: AWS grew over 39% to a $184bn run rate; projects AWS growth over 40% in both 2027 and 2028; says Amazon may have two trillion dollar revenue businesses in the next 5 to 10 years.
- CEO, 2025 shareholder letter (8-K Ex 99.1, 8 Apr 2026): customer commitments cover a substantial portion of 2026 AWS capex, much of it monetized in 2027 to 2028; free cash flow is pressured while capex growth outpaces revenue growth; Trainium at scale expected to save tens of billions of capex dollars per year.
| Speaker | Date and source | Statement |
|---|---|---|
| Andy Jassy, President and CEO | 29 Oct 2026, 8-K Ex 99.1 Q3 2026 results release | “There has never been a trillion dollar revenue business” |
| Andy Jassy, President and CEO | 8 Apr 2026, 8-K Ex 99.1, 2025 letter to shareholders | “We’re not investing approximately $200 billion in capex in 2026 on a hunch” |
| Andy Jassy, President and CEO | 29 Oct 2026, Q3 2026 earnings call, stated on the call | “We're installing an AI accelerator about every 14 seconds” |
| Item | Disclosure |
|---|---|
| 10-Q Q3 2026, results | Cost of sales 46.8% of net sales against 49.2%; technology and infrastructure 17.2% against 16.1%; Q3 2025 had $2.9bn of other operating expense incl. the FTC settlement. |
| 10-Q Q3 2026, liquidity | Cash and marketable securities $114.2bn; 9M 2026 acquisitions and investments $63.8bn incl. $50.0bn of OpenAI Series C preferred and $10.0bn of Anthropic preferred; proceeds from short and long term debt $135.8bn; capex expected to increase meaningfully in 2027; additional financing expected in 2026. |
| 10-Q Q3 2026, balance sheet | Total assets $1.24tn against $818.0bn at Dec 2025; other assets $358.8bn incl. private equity investments $143.7bn and Anthropic notes $146.2bn; equity $613.6bn incl. AOCI $102.3bn, mainly the unrealized gain on Anthropic notes. |
| 10-Q Q3 2026, backlog | Commitments in contracts over one year not yet recognized, mainly AWS: $578bn (Dec 2025 $244bn), weighted average remaining life 6.1 years. |
| 10-Q Q3 2026, commitments | Total contractual obligations $883.6bn incl. purchase obligations for property and equipment $159.6bn and leases not yet commenced $164.9bn; energy contracts of about 690m MWh under derivative accounting, about 18 years remaining. |
| 10-Q Q3 2026, legal | Aug 2026 complaints by the FTC with 22 state Attorneys General, and by Texas, over reserve prices in sponsored ad auctions; Xockets ITC investigation over AWS GB200 servers instituted Jun 2026; Audible credit expiration class actions in the US and Canada. |
| 10-Q Q3 2026, tax | An IRS notice of 2026 applied retroactively to 2025 is expected to reduce 2024 and 2025 cash taxes; 9M 2026 cash taxes $5.3bn; income tax contingencies $7.3bn. |
| 10-K FY2025, non GAAP | A single free cash flow measure is presented; the two lease adjusted free cash flow measures of the FY2024 10-K were dropped. |
| 10-K FY2025, estimates | Server and networking equipment useful lives 5 to 6 years; FY2025 depreciation of property and equipment $41.9bn, of which AWS $21.5bn. |
| 10-K FY2025, tax | 2025 tax law (100% bonus depreciation, R&D expensing) cut cash taxes to $8.3bn from $12.3bn. |
7 Peer Valuation & Sector Summary
- Summary across drivers: Amazon's Q3 2026 net sales growth of 12.1% (about 16% excl. the Prime Day shift, per the company) sits below ORCL 29.6%, META 26.1%, GOOGL 24.7%, MSFT 18.8% and above WMT 5.9% (Jul quarter).
- Operating margin TTM: MSFT 47.1%, GOOGL 33.3%, META 32.9%, ORCL 32.1%, AMZN 13.1%; Amazon's margin includes low margin first party retail sales booked gross.
- Free cash flow margin TTM: MSFT 17.3%, META 10.4%, GOOGL 4.2%, AMZN (5.3)%, ORCL (40.0)%.
- Valuation: AMZN 3.3x EV/Sales and 19.4x P/E (about 32.8x excluding TTM investment gains, estimate) against MSFT 11.1x and 27.2x, GOOGL 7.0x and 14.7x, META 6.5x and 20.9x, ORCL 6.8x and 20.9x.
| Company | Revenue TTM ($bn) | Revenue growth (%) | Gross margin (%) | Operating margin (%) | Net margin (%) | FCF margin (%) | ROE (%) | Net cash ($bn) | Market value ($bn) | EV/Sales (x) | P/E TTM (x) |
|---|---|---|---|---|---|---|---|---|---|---|---|
| AMZN | 797.5 | 12.1 | 51.4 | 13.1 | 16.9 | (5.3) | 26.3 | (66.1) | 2,599 | 3.3 | 19.4 |
| MSFT | 346.4 | 18.8 | 67.7 | 47.1 | 41.2 | 17.3 | 34.2 | 29.0 | 3,884 | 11.1 | 27.2 |
| GOOGL | 471.1 | 24.7 | 60.9 | 33.3 | 50.0 | 4.2 | 44.3 | 139.0 | 3,449 | 7.0 | 14.7 |
| META | 241.6 | 26.1 | 81.0 | 32.9 | 31.1 | 10.4 | 32.3 | (1.2) | 1,570 | 6.5 | 20.9 |
| ORCL | 71.8 | 29.6 | 64.0 | 32.1 | 26.4 | (40.0) | 43.4 | (88.3) | 396 | 6.8 | 20.9 |
| WMT | n/a | 5.9 | 26.1 | 5.0 | n/a | n/a | n/a | n/a | 981 | n/a | n/a |

8 Material Events & Contracts
- 17 Forms 8-K from 30 Oct 2025 to 29 Oct 2026: five earnings releases, seven financing filings ($15.0bn notes in Nov 2025; $37.0bn and EUR 14.5bn in Mar 2026; the $17.5bn term loan and CAD 14.0bn in Jun 2026; $25.0bn in Jul 2026; GBP 4.25bn in Sep 2026), the OpenAI agreements, the 2025 shareholder letter, the Globalstar merger agreement, the annual meeting results and one director election.
- OpenAI (8-K of 27 Feb 2026): a $15.0bn initial Series C preferred purchase plus a $35.0bn equity commitment letter guaranteed by Amazon; $50.0bn invested by Q3 2026. OpenAI expanded its $38bn AWS agreement by $100bn over 8 years with about 2 GW of Trainium capacity; AWS is to be exclusive third party cloud distribution provider for OpenAI Frontier.
- Debt: long term debt proceeds $115.1bn in 9M 2026; long term debt face value $180.9bn at 30 Sep 2026, incl. $162.5bn of senior notes and the $17.5bn term loan; weighted average remaining life of the notes 13.9 years; $15bn revolver and $5bn short term facility undrawn; no commercial paper outstanding. Interest expense $1.7bn in Q3 2026 against $0.5bn.
| Date | Items | Event |
|---|---|---|
| 30 Oct 2025 | 2.02, 9.01 | Q3 2025 results: net sales $180.2bn (+13%); operating income $17.4bn incl. $2.5bn FTC settlement and $1.8bn severance; net income $21.2bn ($1.95 per share) incl. $9.5bn pre tax Anthropic gains; AWS $33.0bn (+20%). |
| 20 Nov 2025 | 8.01, 9.01 | Closed $15.0bn senior notes in six tranches (3.900% 2028 to 5.550% 2065); net proceeds about $14.93bn. |
| 5 Feb 2026 | 2.02, 9.01 | Q4 2025 results: net sales $213.4bn (+14%); operating income $25.0bn incl. about $2.4bn special charges; net income $21.2bn ($1.95); FY2025 net sales $716.9bn, operating income $80.0bn, FCF $11.2bn; 2026 capex plan about $200bn. |
| 27 Feb 2026 | 1.01, 7.01, 8.01, 9.01 | OpenAI agreements: $15.0bn Series C preferred purchase plus $35.0bn equity commitment letter (Ex 10.1) guaranteed by Amazon; AWS commercial arrangement and joint collaboration agreement; commitment ends if not invested by Dec 31 2028. |
| 13 Mar 2026 | 8.01, 9.01 | Closed $37.0bn US dollars notes in 11 tranches incl. floating 2028/2029 and fixed 3.850% 2028 to 6.050% 2076; net proceeds about $36.81bn. |
| 16 Mar 2026 | 8.01, 9.01 | Closed EUR 14.5bn notes in eight tranches (floating 2028; 2.800% 2028 to 4.850% 2064); net proceeds about EUR 14.45bn. |
| 8 Apr 2026 | 7.01, 9.01 | Furnished 2025 Letter to Shareholders (Ex 99.1) and non GAAP free cash flow table (Ex 99.2). |
| 14 Apr 2026 | 7.01, 9.01 | Definitive merger agreement to acquire Globalstar ($90.00 in cash or 0.3210 Amazon shares per Globalstar share) for Amazon Leo direct to device services; subject to regulatory approvals. |
| 29 Apr 2026 | 2.02, 9.01 | Q1 2026 results: net sales $181.5bn (+17%); operating income $23.9bn; net income $30.3bn ($2.78) incl. $16.8bn pre tax Anthropic gains; AWS $37.6bn (+28%); OpenAI 2 GW and Anthropic up to 5 GW Trainium commitments. |
| 22 May 2026 | 5.07 | Annual meeting May 20 2026: all 11 directors elected, EY ratified, say on pay approved; five shareholder proposals rejected (independent chair 14.2% support, data center climate report 18.4%). |
| 10 Jun 2026 | 1.01, 2.03, 9.01 | Entered $17.5bn senior unsecured delayed draw term loan with Citibank as agent; 3 year maturity; SOFR plus 0.625% to 0.875%; fully drawn by Sep 30 2026. |
| 12 Jun 2026 | 8.01, 9.01 | Closed CAD 14.0bn notes in five tranches (3.400% 2029 to 5.000% 2056). |
| 9 Jul 2026 | 8.01, 9.01 | Closed $25.0bn US dollars notes in eight tranches (floating 2029; 4.600% 2029 to 6.250% 2066); net proceeds about $24.87bn. |
| 30 Jul 2026 | 2.02, 9.01 | Q2 2026 results: net sales $200.6bn (+20%); operating income $27.5bn; net income $62.6bn ($5.75) incl. $53.4bn non operating income mainly Anthropic; AWS $42.2bn (+37%), $169bn run rate. |
| 9 Sep 2026 | 5.02 | Kevin R. Mandia elected director (Audit and Security Committees); RSU award of 4,086 shares vesting 2027 to 2029. |
| 14 Sep 2026 | 8.01, 9.01 | Closed GBP 4.25bn notes in four tranches (5.200% 2029 to 6.650% 2045). |
| 29 Oct 2026 | 2.02, 9.01 | Q3 2026 results: net sales $201.9bn (+12%); operating income $28.1bn (13.9% margin); net income $20.7bn ($1.89); AWS $46.0bn (+39%); TTM free cash flow ($42.4bn); Q4 guide $240bn to $247bn sales, $28.5bn to $33.5bn operating income; 2026 capex about $220bn. |
| Contract | Terms |
|---|---|
| OpenAI equity commitment letter (Ex 10.1, 27 Feb 2026) | Commitment to buy 50,895,254 further Series C preferred shares for $35.0bn after an initial 21,812,252 shares; guaranteed by Amazon.com, Inc.; ends at full funding, termination of the AWS and OpenAI Joint Collaboration Agreement or 31 Dec 2028; fully funded in Q3 2026, $50.0bn invested in total. |
| AWS commitments of AI labs | OpenAI: +$100bn over 8 years, about 2 GW of Trainium from 2027 (Q1 2026). Anthropic: more than $100bn over 10 years, up to 5 GW of Trainium (Q2 2026). Anthropic's S-1 lists minimum compute spend of $110.0bn with Amazon from May 2026 to Apr 2036. |
| Anthropic investments and financing facility | $8.0bn of convertible notes (Q3 2023 to Q4 2025) and $10.0bn of nonvoting preferred (Series G and H, Q2 2026); 164m preferred shares held; facility of up to $20.0bn tied to AWS compute delivery milestones, $15.0bn remaining; ownership cap 12%. |
| Term loan (Ex 10.1, 8 Jun 2026) | $17.5bn senior unsecured delayed draw facility, Citibank as agent; each loan matures three years after borrowing; Term SOFR plus 0.625% to 0.875% by rating; no financial covenants; fully drawn by 30 Sep 2026. |
| Senior notes (Ex 4.1) | $15.0bn (Nov 2025, 3.900% 2028 to 5.550% 2065); $37.0bn (Mar 2026, up to 6.050% 2076); EUR 14.5bn (Mar 2026, 2028 to 2064); CHF notes (May 2026, $3.4bn carrying); CAD 14.0bn (Jun 2026, 3.400% 2029 to 5.000% 2056); $25.0bn (Jul 2026, 4.600% 2029 to 6.250% 2066); GBP 4.25bn (Sep 2026, 5.200% 2029 to 6.650% 2045). |
| Globalstar merger agreement (Ex 99.1, 14 Apr 2026) | $90.00 in cash or 0.3210 Amazon shares (capped at $90.00) per Globalstar share, cash elections capped at 40% of shares; downward adjustment of up to $110m on missed milestones; closing expected in 2027; Amazon Leo to power satellite services for iPhone 14 and later and Apple Watch Ultra 3. |
9 Ownership, Voting Power & Annual Meeting
- One class of common stock, one vote per share (proxy statement); 10.81bn shares outstanding at 21 Oct 2026. Jeff Bezos holds 879.3m shares, 8.13%, after gifts in Aug 2026 (Form 4); no holder above 10%. Holders of 25% can call a special meeting; proxy access is in place.
- 2026 annual meeting (20 May 2026, virtual): all 11 directors elected with 90.0% to 99.3% of votes cast; say on pay 94.0% (78% in 2025, per the proxy); Ernst & Young ratified; all four shareholder proposals and one floor proposal rejected, the highest being data center climate reporting at 18.4% and an independent chair at 14.2%.
- Insiders, 12 months to Oct 2026: no open market purchases. Bezos sold 1,209,649 shares on 3 Aug 2026 at a weighted $286.41, about $346.5m, under a prearranged trading plan adopted 14 Nov 2025, and gifted about 2.7m shares to non profits. Six executives sold about 64,800 shares (about $16.8m) on 21 to 24 Aug 2026 after quarterly RSU vesting; sales on other vest dates are not totalled here.
- Board and pay: Kevin R. Mandia joined the board on 8 Sep 2026 (Audit and Security Committees). The proxy states no equity awards to the CEO or named executives in 2025; the CEO was last granted an award in 2021.
| Proposal | For (bn votes) | Against (bn votes) | Abstain (bn votes) | For as % of votes cast | Result |
|---|---|---|---|---|---|
| Elect Jeffrey P. Bezos | 7.471 | 0.393 | 0.024 | 95.0 | Elected |
| Elect Andrew R. Jassy | 7.803 | 0.066 | 0.019 | 99.2 | Elected |
| Elect Jamie S. Gorelick | 7.298 | 0.566 | 0.023 | 92.8 | Elected |
| Elect Jonathan J. Rubinstein | 7.078 | 0.785 | 0.025 | 90.0 | Elected; lowest director support |
| Ratify Ernst & Young as auditors for 2026 | 8.403 | 0.523 | 0.027 | 94.1 | Approved |
| Advisory vote on executive compensation | 7.392 | 0.470 | 0.026 | 94.0 | Approved |
| Shareholder: report on charitable partnerships | 0.073 | 7.742 | 0.073 | 0.9 | Rejected |
| Shareholder: reporting on data center impact on climate commitments | 1.436 | 6.373 | 0.080 | 18.4 | Rejected |
| Shareholder: report on impact of climate commitments | 0.096 | 7.732 | 0.060 | 1.2 | Rejected |
| Shareholder: mandatory independent board chair | 1.113 | 6.730 | 0.046 | 14.2 | Rejected |
| Floor: worker oriented AI advisory council | 0.000 | 7.888 | 0.000 | 0.0 | Rejected |
2026 annual meeting
- CFO review: FY2025 net sales $716.9bn, operating income $80bn, operating cash flow $140bn, cash capex $128.3bn, free cash flow $11bn; advertising $69bn, +22%.
- CEO remarks: AI revenue run rate above $15bn; chips business at a $20bn run rate growing at triple digit rates; Trainium commitments above $225bn; Amazon Leo with over 300 satellites in orbit, 20 launches planned in 2026 and 30 in 2027.
- Questions: on dividends the CEO said investing in AWS, retail infrastructure and Amazon Leo is the best long term use of cash, while staying open to other options; on third party chip sales he said it is possible later, though Trainium is largely committed.
| Holder | Shares (m) | % of shares outstanding | Filing |
|---|---|---|---|
| Jeffrey P. Bezos, Executive Chair | 879.3 | 8.13 | Form 4 filed 27 Aug 2026, direct holdings after gifts |
| Andrew R. Jassy, President and CEO | 2.24 | 0.02 | Form 4 of 25 Aug 2026, direct holdings; 900,000 unvested RSUs |
10 Risk Factors
- Item 1A of the FY2025 Form 10-K holds 24 risk factors (8,567 words). 19 were compared in full with the FY2024 10-K and none was added, removed or materially reworded; the other 5 were checked against the Q3 2025 10-Q. The Q3 2026 10-Q keeps 24 factors (8,561 words); FY2024 totals are shown as n/a because that Item 1A was retrieved only in part.
| Risk | Disclosure and change |
|---|---|
| AI lab concentration and investment marks | Backlog $578bn incl. OpenAI and Anthropic expansions of $100bn or more each; Anthropic stake $238.7bn and OpenAI preferred $50.0bn, both Level 3 or measurement alternative; marks drove 9M 2026 other income of $68.4bn. The Q1 2026 10-Q adds that Amazon does not control investees' strategy, operations, governance or compliance. |
| Capex and financing | TTM capex $210.7bn, TTM free cash flow ($42.4bn); long term debt $173.1bn; interest expense $1.7bn in Q3 2026; the Q2 2026 10-Q adds exchange rate exposure on foreign currency notes. |
| FTC and state antitrust cases | Pending cases filed since Mar 2020 cover pricing policies, Featured Offer selection, seller data, advertising and Prime structure. |
| Sponsored ad auctions | Aug 2026 complaints by the FTC with 22 state Attorneys General, and by Texas, over reserve prices; they seek civil penalties, restitution and injunctive relief. |
| Private antitrust class actions | UK: three certified; US: one certified, three before certification; Canada: certification denied in Federal Court, under appeal, three before certification; claims of billions of dollars. |
| Patents | Xockets suits filed in Jun 2025 and an ITC investigation instituted in Jun 2026 over AWS Nitro and GB200 and GB300 servers. |
| Trade and tariffs | Tariff named 8 times in the first 19 FY2025 risk factors against 2 in FY2024; covers China based sellers and suppliers, which the 10-K links to third party seller services and advertising revenue. |
| Tax | Q1 2026 10-Q adds tax and other challenges in Italy after a $1.1bn Q4 2025 charge; income tax contingencies $7.3bn; the Q3 2026 10-Q removes the Indian cloud services tax example. |
How risk factors changed
- Comparison: 10-K FY2025 filed 5 Feb 2026 acc 0001018724-26-000004 against 10-K FY2024 filed 6 Feb 2025 acc 0001018724-25-000004 (first 19 of the factors compared in full; see notes).
- No risk factor was added or removed between the FY2024 and FY2025 10-K in the 19 factors compared, and all 24 headings are unchanged through the Q3 2026 10-Q.
- AI is named 13 times in the first 19 factors of the FY2025 10-K against 6 times in the same factors of the FY2024 10-K; across all 24 factors AI appears 16 times in 11 factors, against 9 times in 6 factors in the Q3 2025 10-Q.
- Tariff is named 8 times in the first 19 factors of the FY2025 10-K against 2 times in the FY2024 10-K, covering international trade, China based sellers, retail demand, inventory pricing and operating results.
- Edits in 2026 track transactions and disputes: investee control risk (Q1 2026, the quarter of the OpenAI investment), Italian tax challenges (Q1 2026), foreign currency notes (Q2 2026, after euro, Swiss franc and Canadian dollar note issues), and removal of the Indian cloud services tax example (Q3 2026).

| Measure | 10-K FY2025 |
|---|---|
| Risk factors (count) | 24 |
| Words in Item 1A | 8,567 |
| Filing | Change disclosed |
|---|---|
| 10-Q Q1 2026 filed 29 Apr 2026 | Full Item 1A restated with two edits: the acquisitions and investments factor adds that investees may have different strategic priorities and Amazon does not control their strategy, operations, governance or compliance (filed in the quarter Amazon invested $15.0bn in OpenAI preferred stock), and the government regulation factor adds that Amazon faces a number of tax and other challenges in Italy. |
| 10-Q Q2 2026 filed 30 Jul 2026 | Foreign exchange factor adds that Amazon issues notes in foreign currencies and that foreign denominated note balances and payments are exposed to exchange rates; no other changes. |
| 10-Q Q3 2026 filed 29 Oct 2026 | Tax factor removes the example that the Indian tax authority asserts tax applies to cloud services fees paid to Amazon in the US (56 words); no other changes. Factor count stays at 24; word count 8,561 against 8,567 in the FY2025 10-K. |
11 Stock Price, Scenarios & Sensitivity
- AMZN closed at $240.35 on 30 Oct 2026, (1.4%) on the 29 Oct close of $243.79 after results, 16.3% below the 52 week high of $287.20 and 22.6% above the low of $196.00; +4.3% year to date.
- Valuation: 19.4x TTM diluted EPS of $12.37, which includes investment gains; about 32.8x excluding them (estimate); 3.3x EV/Sales; free cash flow yield (1.6%) on TTM free cash flow of ($42.4bn).
- Scenario model: net sales grow from TTM Q3 2026 $797.5bn for three years; operating margin as stated; no investment gains; 20% tax rate; price equals TTM Q3 2029 EPS times exit P/E.

Critical factors and core assumptions
| Factor | Current value | Best case requires | Evidence in filings and calls |
|---|---|---|---|
| AWS growth | +39.3% in Q3 2026; $184bn run rate | above 40% in 2027 and 2028 | CEO projection, 8-K Ex 99.1 of 29 Oct 2026; backlog $578bn |
| AWS margin as depreciation rises | 38.7% in Q3 2026; TTM 37.8% | at or above 35% | AWS property additions $57.1bn in Q3 2026; no margin guidance (stated on the call) |
| Capex and free cash flow | TTM capex $210.7bn; TTM free cash flow ($42.4bn) | capex growth slows after 2027; free cash flow positive by 2028 | 2026 capex about $220bn; 2027 to increase meaningfully; $115.1bn of debt proceeds in 9M 2026 |
| Advertising growth | +12% excl. FX in Q3 2026; TTM $78.0bn | growth in the high teens sustained | Q4 2026 guidance high teens; 22% to 26% in Q4 2025 to Q2 2026 |
| Retail margins | North America 7.7%, International 3.7% in Q3 2026 | North America near 10%, International above 5% | TTM 8.2% and 3.3%; over 1 million robots (stated on the call) |
| AI lab commitments and marks | Anthropic $238.7bn; OpenAI $50.0bn | commitments convert to revenue; no write downs | Level 3 marks drove $62.8bn of 9M 2026 gains on Anthropic preferred |
- Revenue base TTM Q3 2026 $797.5bn; operating income $104.4bn (13.1% margin).
- Best case: 16% revenue CAGR, 19% operating margin, 34x P/E, share count +1.5%.
- Base case: 12% revenue CAGR, 15.5% margin, 28x P/E, share count +2%.
- Worst case: 7% revenue CAGR, 10.5% margin, 20x P/E, share count +3%.
- Tax rate 20% excluding discrete items; no investment gains or losses; net interest set to zero; no buybacks or equity issuance.
Scenarios, three years forward
| Measure | Worst case | Base case | Best case |
|---|---|---|---|
| Revenue CAGR, 3 years (%) | 7.0 | 12.0 | 16.0 |
| Revenue, TTM Q3 2029 ($bn) | 976.9 | 1,120.4 | 1,244.7 |
| Operating margin, TTM Q3 2029 (%) | 10.5 | 15.5 | 19.0 |
| Net income, TTM Q3 2029 ($bn) | 82.1 | 138.9 | 189.2 |
| EPS, TTM Q3 2029 ($) | 7.37 | 12.60 | 17.24 |
| Exit P/E (x) | 20.0 | 28.0 | 34.0 |
| Implied price ($) | 147 | 353 | 586 |
| Change against $240.35 (%) | (39) | 47 | 144 |
| Implied annual return (%) | (15.0) | 13.6 | 34.6 |

Sensitivity analysis
| Revenue CAGR \ Operating margin | 11% | 13% | 15% | 17% | 19% |
|---|---|---|---|---|---|
| 7% | $218 | $258 | $298 | $337 | $377 |
| 10% | $237 | $280 | $323 | $366 | $410 |
| 12% | $250 | $296 | $341 | $387 | $432 |
| 14% | $264 | $312 | $360 | $408 | $456 |
| 16% | $278 | $329 | $379 | $430 | $480 |
| Exit P/E \ Operating margin | 11% | 13% | 15% | 17% | 19% |
|---|---|---|---|---|---|
| 20x | $179 | $211 | $244 | $276 | $309 |
| 24x | $215 | $254 | $293 | $332 | $371 |
| 28x | $250 | $296 | $341 | $387 | $432 |
| 31x | $277 | $327 | $378 | $428 | $479 |
| 34x | $304 | $359 | $414 | $470 | $525 |
Disclaimer
This analysis is for information only and is not financial advice. It is derived from public SEC filings retrieved via sec-api.io and is not a publication of the U.S. Securities and Exchange Commission. Scenario values are model outputs under stated assumptions and are not forecasts. Data as of 30 October 2026.
Sources
All company figures are read from SEC filings retrieved through the sec-api.io MCP server. Earnings call content is labelled as stated on the call and is taken from published coverage of the Q1, Q2 and Q3 2026 calls held by the company; Amazon files no call transcript or CFO commentary with the SEC.
| Form | Period | Filed | Accession number |
|---|---|---|---|
| 10-Q | Q3 2026 | 29 Oct 2026 | 0001018724-26-000040 |
| 8-K | Q3 2026 | 29 Oct 2026 | 0001018724-26-000038 |
| 10-Q | Q2 2026 | 30 Jul 2026 | 0001018724-26-000026 |
| 8-K | Q2 2026 | 30 Jul 2026 | 0001018724-26-000024 |
| 10-Q | Q1 2026 | 29 Apr 2026 | 0001018724-26-000014 |
| 8-K | Q1 2026 | 29 Apr 2026 | 0001018724-26-000012 |
| 10-K | FY2025 | 5 Feb 2026 | 0001018724-26-000004 |
| 8-K | Q4 2025 | 5 Feb 2026 | 0001018724-26-000002 |
| 10-Q | Q3 2025 | 30 Oct 2025 | 0001018724-25-000123 |
| 10-Q | Q2 2025 | 31 Jul 2025 | 0001018724-25-000086 |
| 10-Q | Q1 2025 | 1 May 2025 | 0001018724-25-000036 |
| 10-K | FY2024 | 6 Feb 2025 | 0001018724-25-000004 |
| 10-K | FY2023 | 1 Feb 2024 | 0001018724-24-000008 |
| 10-K | FY2022 | 2 Feb 2023 | 0001018724-23-000004 |
| DEF 14A | 2026 meeting | 8 Apr 2026 | 0001104659-26-041026 |
| 8-K 5.07 | 2026 meeting | 22 May 2026 | 0001104659-26-065717 |
| 8-K 1.01 | OpenAI | 27 Feb 2026 | 0001104659-26-021050 |
| 8-K 1.01 | Term loan | 10 Jun 2026 | 0001104659-26-072140 |
| 10-Q (peer) | WMT Q2 FY2027 | 28 Aug 2026 | 0000104169-26-000154 |
| Company | Form | Filed | Accession number |
|---|---|---|---|
| Alibaba | 6-K Ex 99.1 | 20 Aug 2026 | 0001104659-26-099220 |
| Alphabet | 10-Q | 28 Oct 2026 | 0001652044-26-000084 |
| Anthropic | S-1 | 26 Oct 2026 | 0001628280-26-067168 |
| CoreWeave | 8-K Ex 99.1 | 11 Aug 2026 | 0001769628-26-000362 |
| Coupang | 8-K Ex 99.1 | 4 Aug 2026 | 0001834584-26-000070 |
| MercadoLibre | 8-K Ex 99.1 | 5 Aug 2026 | 0001099590-26-000021 |
| Meta | 10-Q | 21 Oct 2026 | 0001628280-26-066773 |
| Microsoft | 10-Q | 28 Oct 2026 | 0001193125-26-436133 |
| Oracle | 10-Q | 11 Sep 2026 | 0001193125-26-389274 |
| 8-K Ex 99.1 | 29 Oct 2026 | 0001506293-26-000151 | |
| 8-K Ex 99.1 | 29 Oct 2026 | 0001713445-26-000114 | |
| Shopify | 8-K Ex 99.1 | 5 Aug 2026 | 0001594805-26-000046 |
| Walmart | 8-K Ex 99.1 | 20 Aug 2026 | 0000104169-26-000145 |
| eBay | 8-K Ex 99.1 | 28 Oct 2026 | 0001065088-26-000209 |
| Filed | Exhibit | Document | Content |
|---|---|---|---|
| 20 Nov 2025 | EX-1.1 | Underwriting agreement, Nov 17, 2025, for six series of senior notes | Managers: Goldman Sachs, J.P. Morgan and Morgan Stanley; Notes issued off the Form S 3 shelf (prospectus dated Feb 3, 2023); Gibson Dunn as company counsel, Davis Polk as underwriters' counsel, Ernst & Young comfort letters |
| 20 Nov 2025 | EX-4.1 | Officers' certificate setting terms of $15.0bn senior notes | $15.0bn in six series: $2.5bn 3.900% due 2028, $2.5bn 4.100% due 2030, $1.5bn 4.350% due 2033, $3.5bn 4.650% due 2035, $3.0bn 5.450% due 2055, $2.0bn 5.550% due 2065; Issued Nov 20, 2025 under the 2012 indenture; Computershare Trust Company is successor trustee |
| 20 Nov 2025 | EX-5.1 | Gibson, Dunn & Crutcher legal opinion on the $15.0bn notes | Opines the $15.0bn notes are legal, valid and binding obligations under New York law |
| 5 Feb 2026 | EX-99.1 | Q4 2025 and full year 2025 results release with Q1 2026 guidance and financial appendix | Q4 2025 net sales $213.4bn, up 14% (12% excluding a $2.8bn favorable FX impact); AWS $35.6bn, up 24%; North America $127.1bn, up 10%; International $50.7bn, up 17%; Q4 2025 operating income $25.0bn after three special charges: $1.1bn for Italy tax disputes and a lawsuit settlement, $730m estimated severance, $610m asset impairments mainly in physical stores; $27.4bn without them |
| 27 Feb 2026 | EX-10.1 | Equity commitment letter with OpenAI Group PBC (Series C Preferred Stock), guaranteed by Amazon.com, Inc. | Amazon.com NV Investment Holdings LLC commits to buy 50,895,254 additional OpenAI Series C Preferred shares after an initial purchase of 21,812,252 shares; Commitment Amount for the additional shares is $35.0bn ($34,999,999,447.98); Amazon.com, Inc. guarantees the holder's obligations |
| 27 Feb 2026 | EX-99.1 | Press release: OpenAI and Amazon announce strategic partnership | Amazon to invest $50bn in OpenAI: an initial $15bn, followed by $35bn in coming months when certain conditions are met; OpenAI and AWS expand their existing $38bn multiyear agreement by $100bn over 8 years, with OpenAI committing to consume about 2 GW of Trainium capacity (Trainium3 and Trainium4) |
| 13 Mar 2026 | EX-1.1 | Underwriting agreement, Mar 10, 2026, for eleven series of US dollars notes | Managers: J.P. Morgan, Citigroup, Goldman Sachs and HSBC; First takedown under the new shelf prospectus dated Feb 6, 2026 |
| 13 Mar 2026 | EX-4.1 | Officers' certificate setting terms of $37.0bn US dollars notes | $37.0bn in eleven series maturing 2028 to 2076, including $1.75bn and $1.0bn floating rate notes at Compounded SOFR plus 0.44% and 0.59%; Fixed coupons from 3.850% (2028) to 6.050% (2076); largest tranches $6.0bn 4.875% due 2036 and $5.5bn 5.800% due 2056; $5.0bn 4.250% due 2031 |
| 13 Mar 2026 | EX-5.1 | Gibson, Dunn & Crutcher legal opinion on the $37.0bn notes | Opines the $37.0bn notes are valid and binding; prospectus supplement dated Mar 10, 2026 |
| 16 Mar 2026 | EX-1.1 | Underwriting agreement, Mar 11, 2026, for euro notes | Euro denominated offering settled through Euroclear and Clearstream, with J.P. Morgan Securities plc as settlement bank |
| 16 Mar 2026 | EX-4.1 | Officers' certificate setting terms of EUR 14.5bn notes | EUR 14.5bn in eight series maturing 2028 to 2064, including EUR 1.75bn floating rate notes at EURIBOR plus 0.35%; Fixed coupons from 2.800% (2028) to 4.850% (2064); largest tranche EUR 2.5bn 3.700% due 2035 |
| 16 Mar 2026 | EX-5.1 | Gibson, Dunn & Crutcher legal opinion on the euro notes | Standard validity opinion on the EUR notes |
| 8 Apr 2026 | EX-99.1 | 2025 letter to shareholders from CEO Andy Jassy (with 1997 letter reprinted) | 2025 revenue grew 12% to $717bn; operating income rose 17% to $80bn (margin 11.2% from 10.8%); free cash flow fell to $11bn from $38bn on a $50.7bn rise in net capex, primarily for AI; AWS AI revenue run rate above $15bn in Q1 2026; AWS added 3.9 GW of power capacity in 2025 and expects to double total power capacity by end of 2027; AWS at a $142bn run rate in Q4 2025 |
| 8 Apr 2026 | EX-99.2 | Free cash flow table appended to the 2025 shareholder letter | TTM operating cash flow $139.5bn in Q4 2025 versus $115.9bn in Q4 2024, up 20%; TTM purchases of property and equipment net of proceeds and incentives $128.3bn versus $77.7bn, up 65% |
| 14 Apr 2026 | EX-99.1 | Press release: Amazon to acquire Globalstar; Amazon Leo to power Apple satellite features | Globalstar holders elect $90.00 cash or 0.3210 Amazon shares (value capped at $90.00) per share; cash elections capped at 40% of shares; Consideration subject to a downward adjustment of up to $110m if Globalstar misses operational milestones |
| 29 Apr 2026 | EX-99.1 | Q1 2026 results release with Q2 2026 guidance and financial appendix | Q1 2026 net sales $181.5bn, up 17% (15% excluding a $2.9bn favorable FX impact); AWS $37.6bn, up 28%; North America $104.1bn, up 12%; International $39.8bn, up 19%; Operating income $23.9bn versus $18.4bn, above the $16.5bn to $21.5bn guided range; AWS operating income $14.2bn |
| 10 Jun 2026 | EX-10.1 | Term loan agreement, Jun 8, 2026: $17.5bn delayed draw term loan facility (Citibank, N.A. administrative agent) | Aggregate commitments $17.5bn, senior unsecured delayed draw term loan; commitments expired Sep 30, 2026 unless fully drawn; each loan matures three years after borrowing; Interest at base rate plus 0% or Term SOFR plus 0.625% to 0.875%, depending on credit ratings; prepayable without premium; no financial covenants |
| 12 Jun 2026 | EX-1.1 | Underwriting agreement, Jun 8, 2026, for Canadian dollar notes | C$ offering placed in Canada on a private placement basis, settled through CDS; Osler, Hoskin & Harcourt as Canadian company counsel |
| 12 Jun 2026 | EX-4.1 | Officers' certificate setting terms of C$14.0bn notes | C$14.0bn in five series: C$1.25bn 3.400% due 2029, C$2.5bn 3.700% due 2031, C$2.0bn 4.000% due 2033, C$3.5bn 4.350% due 2036, C$4.75bn 5.000% due 2056 |
| 12 Jun 2026 | EX-5.1 | Gibson, Dunn & Crutcher legal opinion on the Canadian dollar notes | Standard validity opinion |
| 9 Jul 2026 | EX-1.1 | Underwriting agreement, Jul 7, 2026, for eight series of US dollars notes | Managers: Barclays, Goldman Sachs, J.P. Morgan and Morgan Stanley |
| 9 Jul 2026 | EX-4.1 | Officers' certificate setting terms of $25.0bn US dollars notes | $25.0bn in eight series maturing 2029 to 2066, including $750m floating rate notes at Compounded SOFR plus 0.58%; Fixed coupons from 4.600% (2029) to 6.250% (2066); largest tranches $4.5bn 5.300% due 2036 and $4.25bn 4.800% due 2031 |
| 9 Jul 2026 | EX-5.1 | Gibson, Dunn & Crutcher legal opinion on the $25.0bn notes | Standard validity opinion |
| 30 Jul 2026 | EX-99.1 | Q2 2026 results release with Q3 2026 guidance and financial appendix | Q2 2026 net sales $200.6bn, up 20%; AWS $42.2bn, up 37%, a $169bn annualized run rate; North America $116.2bn, up 16%; International $42.2bn, up 15%; Operating income $27.5bn, up 43%, above the $20.0bn to $24.0bn guided range; AWS operating income $16.6bn versus $10.2bn |
| 14 Sep 2026 | EX-1.1 | Underwriting agreement, Sep 9, 2026, for sterling notes | Sterling offering settled through Euroclear and Clearstream |
| 14 Sep 2026 | EX-4.1 | Officers' certificate setting terms of GBP 4.25bn notes | GBP 4.25bn in four series: GBP 1.25bn 5.200% due 2029, GBP 1.0bn 5.550% due 2032, GBP 1.0bn 6.250% due 2038, GBP 1.0bn 6.650% due 2045 |
| 14 Sep 2026 | EX-5.1 | Gibson, Dunn & Crutcher legal opinion on the sterling notes | Opines the GBP 4.25bn notes are valid and binding; prospectus supplement dated Sep 9, 2026 |
| 29 Oct 2026 | EX-99.1 | Q3 2026 results release with Q4 2026 guidance and financial appendix | Q3 2026 net sales $201.9bn, up 12% (13% excluding a $0.9bn FX headwind; about 400 basis points higher excluding Prime Day timing); AWS $46.0bn, up 39%, a $184bn annualized run rate; Operating income $28.1bn versus $17.4bn, above the $22.5bn to $26.5bn guided range; operating margin 13.9%, which the release calls Amazon's highest ever; AWS operating margin 38.7% |
| 29 Oct 2026 | EX-99.2 | Non GAAP financial measures statement (free cash flow and FX effect) | Defines free cash flow as operating cash flow less purchases of property and equipment net of proceeds from sales and incentives; States the financial focus is on long term, sustainable growth in free cash flow |