Microsoft Corporation (MSFT), Financial Analysis
Insights derived from analysing SEC filings. Independent analysis, not a publication of the SEC.
- Two segments since 2 Sep 2026. Agents and Infra earned $76.8bn in Q1 FY2027 (quarter to 30 Sep 2026), +24.5% and 83.2% of revenue, with a 52.8% operating margin; Devices and Consumer $15.5bn, (3.2%). Earlier periods are restated to the new basis from Q1 FY2025.
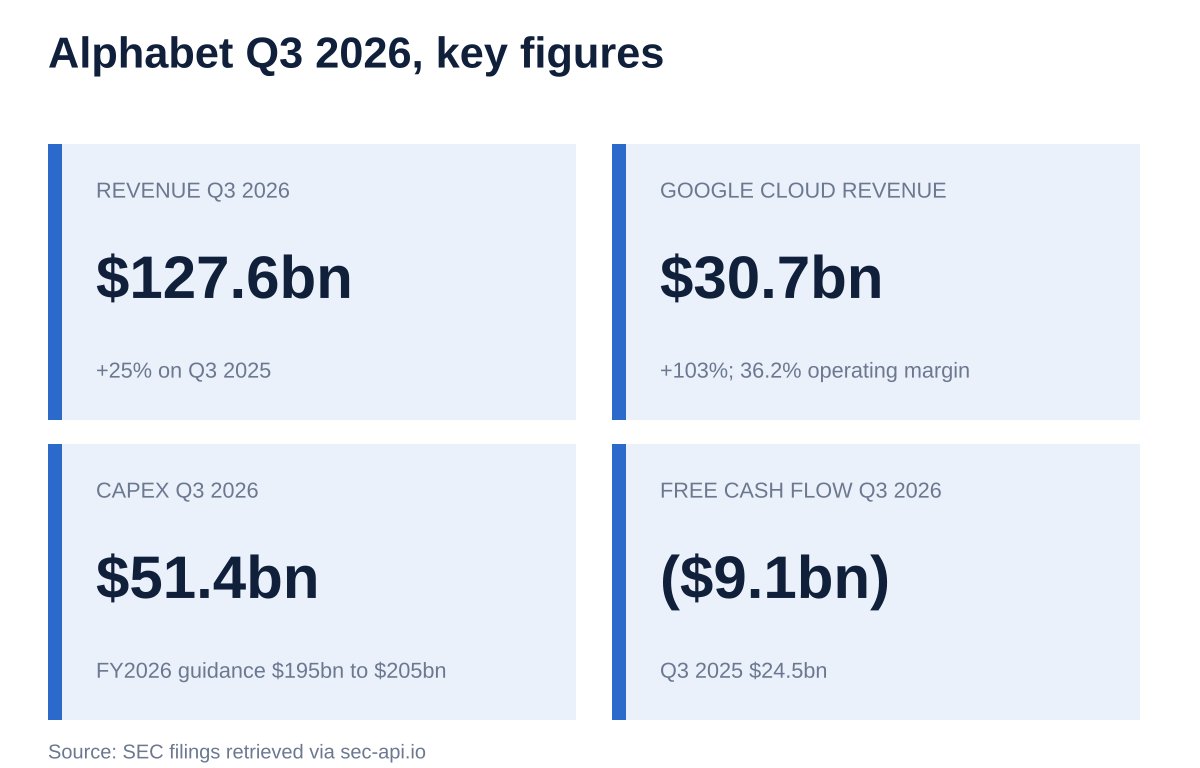
- Azure is Microsoft's fastest growing line. Azure $33.2bn, +48.2%, against AWS +39.3% and Google Cloud +102.6% in Q3 2026; commercial RPO $677bn, +73%; revenue from OpenAI $10.0bn in the quarter (10-Q). Q2 FY2027 Azure guidance 49% to 50% in constant currency, stated on the call.
- Microsoft 365 cloud +17.2% to $27.8bn while commercial seats grew 5%; Microsoft 365 Copilot passed 30m paid seats in FY2026 (Q4 FY2026 release); no seat count was given for Q1 FY2027.
- Consumer revenue falls. Windows OEM and devices (22.0%) and XBOX (2.3%); search and advertising +10.3%. Segment operating margin rose to 34.6%.
- Capex doubles, free cash flow falls. Cash capex $39.4bn, +103.0% and 42.7% of revenue; capex incl. finance leases $45.2bn, stated on the call; free cash flow $18.6bn, (27.4%); datacenter leases not yet commenced $364.6bn; finance lease liabilities $71.0bn.
- Shares at $522.99 on 30 Oct 2026, 27.3x TTM diluted EPS of $19.16, which includes OpenAI and Anthropic investment gains; 11.1x EV/Sales. Base case $705 in three years; best $1,013; worst $392.
Figures are read from the Forms 10-K for FY2023 to FY2026, the Forms 10-Q for Q3 FY2025 to Q1 FY2027, the Forms 8-K with all their exhibits, incl. the quarterly earnings releases with their financial statement appendices (Ex 99.1), the FY27 segments and investor metrics presentation of 2 Sep 2026 with the restated FY2025 and FY2026 history (Ex 99.1), the FY2026 annual report recast for the new segments (Ex 99.1) with the auditor consent (Ex 23.1) and the director appointment release (Ex 99.1), the proxy statement of 21 Oct 2026, the Form 8-K Item 5.07 vote results, Schedules 13G and Forms 4 on the record for central index key 789019, together with the filings of five peers and the segment filings of 12 companies used in chapters 2 to 5. Microsoft files no CFO commentary exhibit; the CFO commentary used is the CFO's prepared remarks on the Q1 FY2027 and Q4 FY2026 earnings calls, and figures found only on a call are marked as stated on the call. Accession numbers for every filing used appear in the Sources appendix. Market prices are the last trades of 30 Oct 2026.
1 Revenue & Business Model
- Storyline: revenue moves to Azure and AI infrastructure. Azure was 35.9% of Q1 FY2027 revenue against 28.8% a year earlier; Agents and Infra 83.2% against 79.4%. Chapters 2 to 4 cover the three revenue drivers: Azure, Microsoft 365 and Copilot, and the Devices and Consumer segment.
- Two segments from Q1 FY2027: Agents and Infra (Azure, Microsoft 365 cloud, productivity and server licensing, Industry solutions, Frontier and support services) earned $268.1bn in FY2026 (year to 30 Jun 2026), 80.8% of revenue, with a 50.9% operating margin; Devices and Consumer (search and advertising incl. LinkedIn Marketing Solutions and Premium, XBOX, Windows OEM and devices) $63.7bn, 29.6% margin.
- Product lines were redefined: Azure now excludes GitHub cloud, Security Copilot (moved to Microsoft 365 commercial cloud) and Healthcare and Life Sciences cloud (moved to Industry solutions); LinkedIn is split between Industry solutions and search and advertising. New basis history covers FY2024 to FY2026 and Q1 FY2025 onward; figures on the retired three segment basis are labelled old basis.
- Revenue FY2022 $198.3bn to FY2026 $331.8bn, a 13.7% CAGR; TTM Q1 FY2027 $346.4bn.
- Regions FY2026: United States $170.8bn (51.5%), other countries $161.0bn; in Q1 FY2027 United States revenue grew 23.4% and other countries 13.9%.
- Headcount fell 2% year on year at 30 Sep 2026 (10-Q MD&A).


| Segment | FY2024 | FY2025 | FY2026 |
|---|---|---|---|
| Agents and Infra revenue ($bn) | 186.9 | 218.8 | 268.1 |
| Agents and Infra operating income ($bn) | 94.5 | 110.8 | 136.4 |
| Agents and Infra operating margin (%) | 50.5 | 50.7 | 50.9 |
| Devices and Consumer revenue ($bn) | 58.2 | 62.9 | 63.7 |
| Devices and Consumer operating income ($bn) | 15.0 | 17.7 | 18.9 |
| Devices and Consumer operating margin (%) | 25.7 | 28.1 | 29.6 |
| Segment | Q1 FY2026 | Q2 FY2026 | Q3 FY2026 | Q4 FY2026 | Q1 FY2027 |
|---|---|---|---|---|---|
| Agents and Infra revenue ($bn) | 61.67 | 64.44 | 67.44 | 74.58 | 76.80 |
| Agents and Infra operating income ($bn) | 32.72 | 33.17 | 33.75 | 36.73 | 40.56 |
| Agents and Infra operating margin (%) | 53.1 | 51.5 | 50.0 | 49.3 | 52.8 |
| Devices and Consumer revenue ($bn) | 16.00 | 16.83 | 15.45 | 15.43 | 15.48 |
| Devices and Consumer operating income ($bn) | 5.24 | 5.11 | 4.65 | 3.87 | 5.36 |
| Devices and Consumer operating margin (%) | 32.8 | 30.3 | 30.1 | 25.1 | 34.6 |
| Product line | Q1 FY2026 | Q2 FY2026 | Q3 FY2026 | Q4 FY2026 | Q1 FY2027 | Growth (%) |
|---|---|---|---|---|---|---|
| Azure ($bn) | 22.38 | 24.13 | 26.01 | 29.42 | 33.17 | 48.2 |
| Microsoft 365 cloud ($bn) | 23.69 | 24.47 | 25.42 | 26.72 | 27.78 | 17.2 |
| Productivity and server licensing ($bn) | 8.68 | 8.81 | 8.76 | 11.03 | 8.41 | (3.1) |
| Search and advertising ($bn) | 5.94 | 6.39 | 6.07 | 6.44 | 6.55 | 10.3 |
| XBOX ($bn) | 5.51 | 5.96 | 5.34 | 4.98 | 5.38 | (2.3) |
| Industry solutions ($bn) | 4.89 | 4.99 | 5.17 | 5.29 | 5.34 | 9.1 |
| Windows OEM and devices ($bn) | 4.55 | 4.48 | 4.04 | 4.01 | 3.55 | (22.0) |
| Frontier and support services ($bn) | 2.02 | 2.04 | 2.09 | 2.11 | 2.11 | 4.3 |
| Segment, old basis | FY2023 | FY2024 | FY2025 | FY2026 |
|---|---|---|---|---|
| Productivity and Business Processes revenue ($bn) | 94.2 | 106.8 | 120.8 | 140.0 |
| Productivity and Business Processes operating income ($bn) | 50.1 | 59.7 | 69.8 | 83.9 |
| Intelligent Cloud revenue ($bn) | 72.9 | 87.5 | 106.3 | 137.8 |
| Intelligent Cloud operating income ($bn) | 28.4 | 37.8 | 44.6 | 57.0 |
| More Personal Computing revenue ($bn) | 44.8 | 50.8 | 54.6 | 54.1 |
| More Personal Computing operating income ($bn) | 10.0 | 12.0 | 14.2 | 14.4 |
2 Azure: Capacity, Backlog and the AI Buildout
- Azure revenue $33.2bn in Q1 FY2027, +48.2%, after +42.0% in Q4 FY2026 (restated); FY2026 $101.9bn, +40.4%. Microsoft disclosed Azure in dollars for the first time with the FY2027 segments. On the old definition, Azure and other cloud services grew 43% in Q4 FY2026.
- Agents and Infra operating income $40.6bn, 52.8% margin against 53.1% a year earlier; Microsoft Cloud revenue $63.9bn, +30%, gross margin 66%.
- Backlog: commercial RPO $677bn at 30 Sep 2026 against $392bn a year earlier; it rose to $625bn at Dec 2025 after OpenAI's recapitalization, when OpenAI contracted an additional $250bn of Azure services (Microsoft announcement, 28 Oct 2025). OpenAI was about 45% of commercial RPO at Dec 2025, stated on the call.
- OpenAI as a customer: revenue from OpenAI $10.0bn in Q1 FY2027, 10.8% of revenue, and $24.1bn in FY2026 (10-Q and 10-K related party note); receivable $7.2bn.
- Capacity: cash capex $39.4bn in Q1 FY2027, +103%; leases signed but not yet commenced $364.6bn; 24 new datacenters on five continents in the quarter, stated on the call. Q2 FY2027 capex guidance above $50bn.

How the cloud and AI infrastructure market is changing
- Cloud growth accelerated across providers: AWS +39% in Q3 2026 against +20% in Q3 2025, and Amazon projects AWS growth above 40% in 2027 and 2028 (8-K Ex 99.1); Google Cloud +102.6%; Oracle cloud infrastructure +120.7% (Aug 2026 quarter).
- Market share: Synergy Research Group puts cloud infrastructure spending at $143bn in Q2 2026, with AWS 28%, Microsoft 20% and Google 15%, and generative AI cloud services +165%.
- Model labs buy from several clouds: Anthropic's S-1 lists minimum commitments of $114.5bn with Google, $110.0bn with Amazon and $44.9bn with Microsoft.
- Capex race: TTM purchases of property and equipment Amazon $215.2bn, Alphabet $159.8bn, Microsoft $135.9bn in cash plus $364.6bn of datacenter leases not yet commenced; Oracle $75.7bn.

| Business | Period | Revenue | Growth (%) | Operating margin (%) | Backlog or RPO | Company capex TTM |
|---|---|---|---|---|---|---|
| Microsoft Azure | Sep 2026 quarter | 33.17 | 48.2 | n/a | 677.0 | 135.9 |
| Microsoft Agents and Infra segment | Sep 2026 quarter | 76.80 | 24.5 | 52.8 | see above | see above |
| Amazon Web Services | Q3 2026 | 45.98 | 39.3 | 38.7 | n/a | 215.2 |
| Google Cloud | Q3 2026 | 30.71 | 102.6 | 36.2 | 560.8 | 159.8 |
| Oracle cloud infrastructure | Aug 2026 quarter | 7.39 | 120.7 | n/a | 664.0 | 75.7 |
| CoreWeave | Q2 2026 | 2.58 | 112.5 | (1.9) | about 104 | n/a |
3 Microsoft 365 and Copilot: Seats, Price and Agents
- Microsoft 365 cloud $27.8bn in Q1 FY2027, +17.2%; Microsoft 365 commercial cloud +17% (+18% adjusted for a prior year one point benefit); commercial seats +5%, so revenue grew 12 points faster than seats. The 10-Q names Microsoft 365 Copilot, E5 and E7 upsell and GitHub Copilot usage.
- Productivity and server licensing $8.4bn, (3.1%); Industry solutions (Dynamics 365, LinkedIn Talent and Sales Solutions, Healthcare) $5.3bn, +9.1%; Microsoft 365 consumer cloud +17% with subscribers +7%.
- Copilot (releases and calls): over 30m paid Microsoft 365 Copilot seats in FY2026 (Q4 FY2026 release); Q1 FY2027 gives no seat count; daily users up nearly 50% quarter on quarter; customers with over 50,000 seats up over 8x, stated on the call.
- AI business annual revenue run rate above $37bn, +123%, in Q3 FY2026 (CEO, 8-K Ex 99.1 of 29 Apr 2026); Foundry has over 120,000 customers with revenue more than tripled, stated on the Q1 FY2027 call.
How productivity and business software is changing
- Bundles and prices: the 10-Q names Microsoft 365 E7 as a premium seat offering next to E5 and Microsoft 365 Copilot; list prices rose on 1 Jul 2026 (Microsoft price announcement), Microsoft 365 E3 from $36 to $39 and E5 from $57 to $60 per user per month.
- Agents become a revenue line at peers: Salesforce Agentforce ARR above $1.5bn, +240%; ServiceNow targets $1.7bn of AI ACV in 2026; Workday reports AI in over 25% of new ACV; Adobe AI first ARR +150% (8-K Ex 99.1, Aug to Oct 2026).
- Subscription growth at peers ranges from 12% to 21% (Salesforce 12%, Adobe 14%, Workday 13.9%, ServiceNow 21%) against Microsoft 365 cloud +17.2%.


| Company and line | Period | Revenue | Growth (%) | Operating margin (%) | Filed detail |
|---|---|---|---|---|---|
| Microsoft 365 cloud (Microsoft) | Sep 2026 quarter | $27.78bn | 17.2 | n/a | commercial seats +5%; Copilot, E5 and E7 upsell |
| Salesforce subscription and support | Jul 2026 quarter | $10.80bn | 12.0 | 20.5 | Agentforce ARR over $1.5bn, +240% |
| ServiceNow subscription | Q3 2026 | $3.99bn | 21.0 | 9.5 | RPO $29.7bn, +22%; 2026 AI ACV target $1.7bn |
| Adobe total revenue | Aug 2026 quarter | $6.76bn | 13.0 | 34.8 | ARR $27.5bn |
| Workday subscription | Jul 2026 quarter | $2.47bn | 13.9 | 11.8 | AI over 25% of new ACV |
| Google Cloud incl. Workspace | Q3 2026 | $30.71bn | 102.6 | 36.2 | Workspace not disclosed separately |
4 Devices and Consumer: Windows, XBOX and Search
- Devices and Consumer revenue $15.5bn in Q1 FY2027, (3.2%), 16.8% of revenue; operating income $5.4bn, +2.2%, 34.6% margin, helped by lower Activision intangibles amortization (10-Q).
- Windows OEM and devices $3.6bn, (22.0%): the 10-Q names prior year demand from the Windows 10 end of support, OEM and channel inventory drawdowns and weaker PC demand. Q2 FY2027 guidance: decline in the mid 30s %, stated on the call.
- XBOX $5.4bn, (2.3%): content and services (2%) as third party content and Game Pass declined and first party grew; hardware (14%) after (29%) in FY2026.
- Search and advertising $6.6bn, +10.3%; +12% excluding TAC on higher rate and volume across LinkedIn, Edge and Bing. The line now includes LinkedIn Marketing Solutions and Premium.

How PCs, gaming and advertising are changing
- PC units fell: the Microsoft 10-Q cites weaker PC market demand and OEM and channel inventory drawdowns; HP Personal Systems units fell 16% in the Jul 2026 quarter.
- Prices rise as units fall: HP Personal Systems revenue +18.5% in the Jul 2026 quarter on units (16%).
- Gaming: XBOX hardware fell in FY2026 and Q1 FY2027; Roblox bookings fell 12% in Q3 2026; Take Two Interactive sets Grand Theft Auto VI for 19 Nov 2026.
- Advertising growth differs by platform: Meta +25.9%, Google Search +12.0%, Amazon advertising +10.9% in Q3 2026 against Microsoft search and advertising +10.3%.

| Company and line | Period | Revenue | Growth (%) | Operating margin (%) | Filed detail |
|---|---|---|---|---|---|
| Microsoft search and advertising | Sep 2026 quarter | $6.55bn | 10.3 | n/a | +12% excl. TAC; incl. LinkedIn Marketing Solutions |
| Microsoft XBOX | Sep 2026 quarter | $5.38bn | (2.3) | n/a | content and services (2%); hardware (14%) |
| Microsoft Windows OEM and devices | Sep 2026 quarter | $3.55bn | (22.0) | n/a | prior year Windows 10 end of support demand |
| Alphabet Search and other | Q3 2026 | $63.35bn | 12.0 | n/a | paid clicks +8%; cost per click +4% |
| Meta advertising | Q3 2026 | $63.06bn | 25.9 | n/a | impressions +10%; price per ad +14% |
| Amazon advertising services | Q3 2026 | $19.64bn | 10.9 | n/a | +12% excl. currency |
| HP Personal Systems | Jul 2026 quarter | $11.77bn | 18.5 | 4.6 | units (16%) |
| Roblox revenue | Q3 2026 | $1.57bn | 15.6 | (18.0) | bookings (12%); 138m daily users |
| Take Two Interactive revenue | Jun 2026 quarter | $1.53bn | 2.3 | (2.3) | Grand Theft Auto VI set for 19 Nov 2026 |
5 Financial Analysis & Ratios
- Operating margin rose while capex doubled. Operating margin 49.8% in Q1 FY2027 against 48.9% a year earlier; FY2026 46.8% against 42.1% in FY2022. From FY2027 datacenters and office buildings are depreciated over 25 years instead of 15; the 10-Q does not quantify the effect and the CFO said on the Q4 FY2026 call the FY2027 operating income benefit is minimal.
- Net income $36.6bn, +32.0%, includes a $272m pre tax gain from OpenAI against a $4.1bn loss a year earlier; non GAAP diluted EPS, which excludes OpenAI only, was $4.89, +18%.
- Cash capex TTM $135.9bn, 39.2% of revenue, against $64.6bn (22.9%) in FY2025 and $23.9bn in FY2022. Free cash flow fell from $71.6bn in FY2025 to $60.0bn TTM; finance lease additions of $20.7bn TTM come on top.
- Balance sheet at 30 Sep 2026: cash and short term investments $64.5bn against $76.8bn at 30 Jun 2026; debt $35.5bn at carrying value (face $41.3bn); finance lease liabilities $71.0bn against $54.4bn at 30 Sep 2025; property and equipment $346.8bn net against $230.9bn a year earlier.
- Capital returns Q1 FY2027: dividends paid $6.8bn and buybacks of $4.4bn in cash; quarterly dividend raised to $0.98 from $0.91 (+7.7%); $37.7bn of the $60bn authorization unused.
| Line item | FY2022 | FY2023 | FY2024 | FY2025 | FY2026 | TTM Q1 FY2027 |
|---|---|---|---|---|---|---|
| Revenue | 198.3 | 211.9 | 245.1 | 281.7 | 331.8 | 346.4 |
| Gross profit | 135.6 | 146.1 | 171.0 | 193.9 | 225.5 | 234.4 |
| Research and development | 24.5 | 27.2 | 29.5 | 32.5 | 35.6 | 36.5 |
| Selling, general and administrative | 27.7 | 30.3 | 32.1 | 32.9 | 34.7 | 34.7 |
| Operating income | 83.4 | 88.5 | 109.4 | 128.5 | 155.2 | 163.2 |
| Net income | 72.7 | 72.4 | 88.1 | 101.8 | 133.7 | 142.6 |
| Diluted EPS ($) | 9.65 | 9.68 | 11.80 | 13.64 | 17.95 | 19.16 |
| Operating cash flow | 89.0 | 87.6 | 118.5 | 136.2 | 182.9 | 195.9 |
| Capital expenditure | (23.9) | (28.1) | (44.5) | (64.6) | (115.9) | (135.9) |
| Free cash flow | 65.1 | 59.5 | 74.1 | 71.6 | 67.0 | 60.0 |
| Stock based compensation | 7.5 | 9.6 | 10.7 | 12.0 | 12.4 | 12.6 |
| Cash and investments | 104.8 | 111.3 | 75.5 | 94.6 | 76.8 | 64.5 |
| Total debt | 49.8 | 47.2 | 44.9 | 43.2 | 40.3 | 35.5 |
| Total equity | 166.5 | 206.2 | 268.5 | 343.5 | 442.4 | 470.5 |

| Metric | Q1 FY2026 | Q1 FY2027 | Change |
|---|---|---|---|
| Revenue ($bn) | 77.67 | 92.28 | 18.8% |
| Gross profit ($bn) | 53.63 | 62.56 | 16.6% |
| Operating income ($bn) | 37.96 | 45.92 | 21.0% |
| Net income ($bn) | 27.75 | 36.63 | 32.0% |
| Diluted EPS ($) | 3.72 | 4.92 | 32.3% |
| Operating cash flow ($bn) | 45.06 | 58.00 | 28.7% |
| Free cash flow ($bn) | 25.66 | 18.63 | (27.4%) |
| Operating margin (%) | 48.9 | 49.8 | 0.9 pts |
| Net margin (%) | 35.7 | 39.7 | 4.0 pts |
| Ratio | FY2022 | FY2023 | FY2024 | FY2025 | FY2026 | TTM Q1 FY2027 |
|---|---|---|---|---|---|---|
| Growth and margins | ||||||
| Revenue growth (%) | n/a | 6.9 | 15.7 | 14.9 | 17.8 | n/a |
| Gross margin (%) | 68.4 | 68.9 | 69.8 | 68.8 | 67.9 | 67.7 |
| Operating margin (%) | 42.1 | 41.8 | 44.6 | 45.6 | 46.8 | 47.1 |
| Net margin (%) | 36.7 | 34.1 | 36.0 | 36.1 | 40.3 | 41.2 |
| FCF margin (%) | 32.9 | 28.1 | 30.2 | 25.4 | 20.2 | 17.3 |
| Cost and investment intensity | ||||||
| R&D (%) revenue | 12.4 | 12.8 | 12.0 | 11.5 | 10.7 | 10.5 |
| SBC (%) revenue | 3.8 | 4.5 | 4.4 | 4.3 | 3.7 | 3.6 |
| Capex (%) revenue | 12.0 | 13.3 | 18.1 | 22.9 | 34.9 | 39.2 |
| Effective tax rate (%) | 13.1 | 19.0 | 18.2 | 17.6 | 19.4 | 19.7 |
| Returns | ||||||
| ROE (%) | 43.7 | 38.8 | 37.1 | 33.3 | 34.0 | 30.3 |
| ROA (%) | 19.9 | 18.6 | 19.1 | 18.0 | 19.4 | 18.3 |
| ROIC (%) | 64.9 | 50.4 | 37.6 | 36.2 | 30.8 | 29.7 |
| Asset turnover (x) | 0.54 | 0.51 | 0.48 | 0.46 | 0.44 | 0.44 |
| Liquidity and leverage | ||||||
| Current ratio (x) | 1.78 | 1.77 | 1.27 | 1.35 | 1.23 | 1.22 |
| Debt to equity (x) | 0.30 | 0.23 | 0.17 | 0.13 | 0.09 | 0.08 |
| Net cash ($bn) | 55.0 | 64.0 | 30.6 | 51.4 | 36.5 | 29.0 |
| Efficiency and cash quality | ||||||
| FCF to net income (x) | 0.90 | 0.82 | 0.84 | 0.70 | 0.50 | 0.42 |
| Shareholder returns (%) FCF | 78 | 71 | 53 | 59 | 73 | 80 |


| Measure | Value |
|---|---|
| Market cap ($bn) | 3,883.8 |
| Enterprise value ($bn) | 3,854.8 |
| P/E (TTM) (x) | 27.3 |
| EV/Sales (TTM) (x) | 11.1 |
| EV/EBITDA (TTM) (x) | 18.8 |
| FCF yield (%) | 1.5 |
| Price/Book (x) | 8.3 |
Cost structure and profitability
- Cost of revenue 32.2% of Q1 FY2027 revenue against 31.0% a year earlier; Agents and Infra cost of revenue rose 35%, which the 10-Q links to AI infrastructure.
- Depreciation of property and equipment $11.1bn, +56.3%, 12.0% of revenue against 9.1% a year earlier; property and equipment rose to $346.8bn net.
- Operating expenses $16.6bn, +6.2%: R&D +11.1%, sales and marketing flat, G&A +4.2%; operating expenses fell to 18.0% of revenue from 20.2%.
- Microsoft Cloud gross margin 66% in Q1 FY2027 and FY2026 against 69% in FY2025 (10-K and 10-Q); Q2 FY2027 guidance about 65%, stated on the call.
- Cash capex 42.7% of revenue against 25.0% a year earlier; operating cash flow $58.0bn, +28.7%; free cash flow $18.6bn, 32% of operating cash flow.
- Investment results move net income: other income $10.0bn in Q2 FY2026 from the OpenAI recapitalization gain and $3.4bn in Q4 FY2026 incl. the $3.2bn Anthropic gain (Q4 FY2026 release), against $(3.7)bn in Q1 FY2026 after OpenAI losses.


| Line | Q1 FY2026 | Q2 FY2026 | Q3 FY2026 | Q4 FY2026 | Q1 FY2027 |
|---|---|---|---|---|---|
| Cost of revenue (% of revenue) | 31.0 | 32.0 | 32.4 | 32.8 | 32.2 |
| Research and development (% of revenue) | 10.5 | 10.5 | 10.8 | 11.1 | 9.8 |
| Sales and marketing (% of revenue) | 7.4 | 8.1 | 8.2 | 8.4 | 6.2 |
| General and administrative (% of revenue) | 2.3 | 2.4 | 2.3 | 2.5 | 2.0 |
| Depreciation of property and equipment (incl. in lines above) (% of revenue) | 9.1 | 9.7 | 10.9 | 11.4 | 12.0 |
| Stock based compensation (incl. in lines above) (% of revenue) | 3.8 | 4.0 | 3.7 | 3.5 | 3.4 |
| Operating income (% of revenue) | 48.9 | 47.1 | 46.3 | 45.1 | 49.8 |
| Cash capex (% of revenue) | 25.0 | 36.8 | 37.3 | 39.8 | 42.7 |
| Line | Q1 FY2026 | Q1 FY2027 | TTM Q1 FY2027 |
|---|---|---|---|
| Revenue | 77.67 | 92.28 | 346.45 |
| Operating income | 37.96 | 45.92 | 163.19 |
| Other income and expense, incl. OpenAI | (3.66) | 0.04 | 14.40 |
| Income taxes | (6.55) | (9.32) | (34.96) |
| Net income | 27.75 | 36.63 | 142.63 |
| Diluted EPS ($) | 3.72 | 4.92 | 19.16 |
| Measure | Q2 FY2026 | Q3 FY2026 | Q4 FY2026 | Q1 FY2027 |
|---|---|---|---|---|
| Cash additions to property and equipment (filed) | 29.9 | 30.9 | 35.8 | 39.4 |
| Finance lease right of use assets obtained (filed) | 6.3 | 4.0 | 5.1 | 5.2 |
| Sum of the two filed lines | 36.2 | 34.9 | 40.9 | 44.6 |
| Capex incl. finance leases, stated on the call | 37.5 | 31.9 | 41.0 | 45.2 |
| Item | $bn | % of annualized revenue |
|---|---|---|
| Remaining performance obligation, total | 683.0 | 185 |
| of which commercial | 677.0 | 183 |
| Datacenter leases signed, not yet commenced | 364.6 | 99 |
| Finance lease liabilities | 71.0 | 19 |
| Unearned revenue | 69.6 | 19 |
| Long term debt incl. current portion (carrying value) | 35.5 | 10 |
6 MD&A & Management Commentary
Q1 FY2027 results release and earnings call
- Q1 FY2027 (28 Oct 2026): revenue $92.3bn, +18.8%, above the $89.85bn to $90.95bn guidance range; operating income $45.9bn, +21.0%; diluted EPS $4.92; effective tax rate 20.3%.
- Costs (10-Q): cost of revenue $29.7bn, +23.6%, with Agents and Infra cost of revenue +35%; operating expenses +6%; total headcount (2%).
- Microsoft Cloud revenue $63.9bn, +30%, gross margin 66%; the 10-Q attributes the lower margin to the mix shift to Azure, partly offset by Azure efficiency. Commercial bookings (12%) against large prior year Azure commitments, stated on the call.
- Capex (stated on the call): $45.2bn incl. finance leases, about three quarters on short lived assets such as CPUs and GPUs; some third party capacity deliveries moved out of the quarter. The filed cash figure is $39.4bn.
- Commercial RPO $677bn, +73%; about 30% to be recognized within 12 months and weighted average duration about 2.3 years, stated on the call.
- Q4 FY2026 call (29 Jul 2026): revenue $90.0bn, +18%; commercial RPO $678bn, +84%, +25% excluding OpenAI; Microsoft Cloud revenue in FY2026 nearly 90% from customers other than frontier model companies; useful life change announced.
| Item | Outlook | Source |
|---|---|---|
| Q2 FY2027 revenue | $96.0bn to $97.1bn (+18% to +19%); Agents and Infra $80.1bn to $80.7bn; Devices and Consumer $15.9bn to $16.4bn | Q1 FY2027 call, 28 Oct 2026 |
| Q2 FY2027 product lines | Azure +49% to +50% in constant currency; Microsoft 365 commercial cloud about +19%; search and advertising excl. TAC low double digit growth; XBOX content and services mid to high single digit growth; Windows OEM and devices decline in the mid 30s % | Q1 FY2027 call |
| Q2 FY2027 costs and margin | cost of revenue $32.7bn to $32.9bn; operating expenses $18.5bn to $18.6bn (about +9%, incl. a voluntary employee exit offer); Microsoft Cloud gross margin about 65%; tax rate about 20% | Q1 FY2027 call |
| Q2 FY2027 capex | more than $50bn | Q1 FY2027 call |
| Calendar 2026 capex | about $170bn, weighted to the second half (Oct 2026); about $175bn after reclassification of leases (Jul 2026); about $190bn incl. about $25bn of higher component prices (Apr 2026) | Q1 FY2027, Q4 FY2026 and Q3 FY2026 calls |
| FY2027 operating margin | down less than 1 point (Jul 2026); slight decline year on year (Oct 2026) | Q4 FY2026 and Q1 FY2027 calls |
| FY2027 revenue, costs and cash | double digit revenue and operating income growth; operating expenses up mid to high single digits; capex to grow; free cash flow positive | Q4 FY2026 and Q1 FY2027 calls |
| Q1 FY2027 outlook (met) | revenue $89.85bn to $90.95bn, actual $92.3bn; Azure +44% to +45% in constant currency, actual +48%; remapped to new segments on 2 Sep 2026 with total unchanged | Q4 FY2026 call; 8-K Ex 99.1 of 2 Sep 2026 |
| Quarterly dividend | $0.98 per share, raised from $0.91 in Sep 2026 | 10-Q Q1 FY2027 |
Management and CFO commentary
- CFO Amy Hood, Q1 FY2027 call: capex $45.2bn incl. finance leases, about three quarters on short lived assets; Q2 FY2027 capex above $50bn; calendar 2026 about $170bn; FY2027 free cash flow to stay positive.
- CFO, Q1 FY2027 call: commercial bookings (12%) against large prior year Azure commitments; commercial RPO weighted average duration 2.3 years; Microsoft Cloud gross margin about 65% in Q2 FY2027.
- CFO, Q1 FY2027 call: Q2 FY2027 operating expenses about +9% incl. a new voluntary employee exit offer; leasing and debt markets are used alongside cash flow.
- CFO, Q4 FY2026 call: demand continued to exceed capacity; FY2027 operating margin down less than 1 point; useful life change affects only the timing of depreciation.
- CEO Satya Nadella, 8-K Ex 99.1 of 2 Sep 2026: the two segments follow how the business is run and resources are allocated; quarterly revenue given for Azure, Microsoft 365 cloud, Industry solutions and advertising.
- CEO, Q1 FY2027 release and call: over 50m agents in the registry, +30% quarter on quarter; over 44,000 paid Fabric customers; LinkedIn above 1.4bn members.
| Speaker | Date and source | Statement |
|---|---|---|
| Satya Nadella, Chairman and CEO | 28 Jan 2026, 8-K Ex 99.1 | “We are only at the beginning phases of AI diffusion” |
| Satya Nadella, Chairman and CEO | 29 Jul 2026, 8-K Ex 99.1 | “Microsoft 365 Copilot reached over 30 million paid seats” |
| Amy Hood, EVP and CFO | 28 Oct 2026, 8-K Ex 99.1 | “Results exceeded expectations across revenue, operating income, and earnings per share.” |
| Item | Disclosure |
|---|---|
| 10-Q Q1 FY2027, OpenAI | Revenue from OpenAI, a related party, $10.0bn in the quarter incl. revenue share (FY2026 $24.1bn); receivable $7.2bn; equity method stake about 24%; $12.0bn of a $13.0bn funding commitment paid. |
| 10-Q Q1 FY2027, leases | Finance lease liabilities $71.0bn; operating lease liabilities $27.5bn; leases signed but not yet commenced $364.6bn against $329.1bn at 30 Jun 2026, commencing FY2027 to FY2034 with terms of 1 to 20 years. |
| 10-Q Q1 FY2027, liquidity | Operating cash flow $58.0bn, +$12.9bn; capex $39.4bn, +$20.0bn; other investing cash outflow up $6.7bn to facilitate component purchases; debt repaid $4.85bn. |
| 10-Q Q1 FY2027, unearned revenue | $69.6bn at 30 Sep 2026; $30.3bn expected to be recognized in the Dec 2026 quarter, $22.2bn in Mar 2027 and $12.1bn in Jun 2027. |
| 10-Q Q1 FY2027, capital returns | 6m shares bought back for $2.9bn under the program, $4.4bn in the cash flow statement; dividends declared $7.3bn; $37.7bn of the $60bn authorization unused. |
| 10-K FY2026, PP&E | Property and equipment $313.1bn net at 30 Jun 2026 against $205.0bn; FY2026 depreciation $34.3bn; servers and network equipment depreciated over 2 to 6 years. |
| 10-K FY2026 and 10-Q, tax | IRS notices of proposed adjustment for 2004 to 2013 seek $28.9bn plus penalties and interest; the company contests them; unrecognized tax benefits and other income tax liabilities $30.6bn at 30 Sep 2026. |
| 10-Q Q1 FY2027, legal | Accrued legal liabilities $582m; reasonably possible additional losses about $400m; LinkedIn appeal of the Irish GDPR fine continues. |
7 Peer Valuation & Sector Summary
- Sector: cloud infrastructure, enterprise software and AI platforms. Microsoft TTM revenue $346.4bn against Alphabet $471.1bn, Amazon $797.5bn, Meta $241.6bn and Oracle $71.8bn.
- Growth (latest quarter): ORCL 29.6%, META 26.1%, GOOGL 24.7%, MSFT 18.8%, AMZN 12.1%.
- Operating margin TTM: MSFT 47.1%, GOOGL 33.3%, META 32.9%, ORCL 32.1%, AMZN 13.1%.
- Free cash flow margin TTM: MSFT 17.3%, META 10.4%, GOOGL 4.2%, AMZN (5.3%), ORCL (40.0%); all five raised capex in the period.
- Valuation: MSFT 11.1x EV/Sales and 27.3x P/E against GOOGL 7.0x and 14.7x, META 6.5x and 20.9x, AMZN 3.3x and 19.3x, ORCL 6.8x and 20.9x. Alphabet and Amazon net income include large investment gains.
| Company | Revenue TTM ($bn) | Revenue growth (%) | Gross margin (%) | Operating margin (%) | Net margin (%) | FCF margin (%) | ROE (%) | Net cash ($bn) | Market value ($bn) | EV/Sales (x) | P/E TTM (x) |
|---|---|---|---|---|---|---|---|---|---|---|---|
| MSFT | 346.4 | 18.8 | 67.7 | 47.1 | 41.2 | 17.3 | 34.2 | 29.0 | 3,884 | 11.1 | 27.3 |
| GOOGL | 471.1 | 24.7 | 60.9 | 33.3 | 50.0 | 4.2 | 44.3 | 139.0 | 3,449 | 7.0 | 14.7 |
| AMZN | 797.5 | 12.1 | 51.4 | 13.1 | 16.9 | (5.3) | 26.3 | (66.1) | 2,595 | 3.3 | 19.3 |
| META | 241.6 | 26.1 | 81.0 | 32.9 | 31.1 | 10.4 | 32.3 | (1.2) | 1,570 | 6.5 | 20.9 |
| ORCL | 71.8 | 29.6 | 64.0 | 32.1 | 26.4 | (40.0) | 43.4 | (88.3) | 396 | 6.8 | 20.9 |

8 Material Events & Contracts
- Nine Forms 8-K in twelve months: four earnings releases, the segment change presentation of 2 Sep 2026 and the recast annual report of 28 Oct 2026, two board notices and the 2025 annual meeting results. The Q1 FY2026 release of 29 Oct 2025 is listed for context.
- Segment change (8-K of 2 Sep 2026): the CEO letter states the two segments follow how the business is run and resources are allocated, and gives quarterly revenue for Azure, Microsoft 365 cloud, Industry solutions and advertising.
- No debt or equity offerings were filed in the period; debt fell from $43.2bn at 30 Sep 2025 to $35.5bn as notes matured.
| Date | Items | Event |
|---|---|---|
| 28 Oct 2026 | 8.01, 9.01 | FY2026 Form 10-K Items 1, 7 and 8 recast for the two new segments (Ex 99.1); Agents and Infra FY2026 revenue $268.1bn, operating income $136.4bn; Devices and Consumer $63.7bn and $18.9bn; Deloitte consent (Ex 23.1). |
| 28 Oct 2026 | 2.02, 9.01 | Q1 FY2027 results (Ex 99.1): revenue $92.3bn, +19%; operating income $45.9bn, +21%; net income $36.6bn, +32%; diluted EPS $4.92; Azure $33.2bn, +48%; commercial RPO $677bn, +73%. |
| 2 Sep 2026 | 7.01, 9.01 | FY27 segments and investor metrics presentation (Ex 99.1): two segments replace three; FY2025 and FY2026 quarters restated; Q1 FY2027 outlook remapped (Agents and Infra $75.15bn to $75.75bn, Devices and Consumer $14.7bn to $15.2bn). |
| 29 Jul 2026 | 2.02, 9.01 | Q4 FY2026 and FY2026 results (Ex 99.1): Q4 revenue $90.0bn, +18%; FY2026 revenue $331.8bn, net income $133.7bn, diluted EPS $17.95; Q4 included a $3.2bn gain on the Anthropic investment. |
| 5 Jun 2026 | 5.02 | Director Reid Hoffman will not stand for reelection at the 2026 annual meeting; the filing states no disagreement (no exhibits). |
| 14 May 2026 | 5.02, 9.01 | Carmine Di Sibio, former EY global chairman and CEO, appointed director from 13 May 2026; joins the Audit and Compensation Committees; board expanded to 13 (Ex 99.1 press release). |
| 29 Apr 2026 | 2.02, 9.01 | Q3 FY2026 results (Ex 99.1): revenue $82.9bn, +18%; operating income $38.4bn; net income $31.8bn; diluted EPS $4.27; CEO states AI business annual revenue run rate above $37bn, +123%. |
| 28 Jan 2026 | 2.02, 9.01 | Q2 FY2026 results (Ex 99.1): revenue $81.3bn, +17%; net income $38.5bn incl. a $7.6bn net gain from OpenAI investments; diluted EPS $5.16; commercial RPO $625bn, +110%. |
| 8 Dec 2025 | 5.02, 5.07 | 2025 annual meeting of 5 Dec 2025: 12 directors elected, say on pay 91.94%, 2026 Stock Plan approved with 97.07%, six shareholder proposals rejected (no exhibits). |
| 29 Oct 2025 | 2.02, 7.01, 9.01 | Q1 FY2026 results: revenue $77.7bn, +18%; net income $27.7bn incl. a $3.1bn OpenAI loss after tax. Filed just before the twelve month window; shown for context. |
| Contract | Terms |
|---|---|
| OpenAI partnership (definitive agreement Oct 2025, extended Apr 2026) | Equity method stake about 24% as converted; Microsoft keeps revenue share payments and IP rights to OpenAI models; $13.0bn funding commitment, $12.0bn paid; Q1 FY2027 revenue from OpenAI $10.0bn; receivable $7.2bn. |
| Datacenter leases not yet commenced | $364.6bn at 30 Sep 2026 against $329.1bn at 30 Jun 2026; commencing FY2027 to FY2034 with terms of 1 to 20 years. |
| Finance leases | Liabilities $71.0bn at 30 Sep 2026 against $54.4bn at 30 Sep 2025; right of use assets obtained $5.2bn in Q1 FY2027 and $24.6bn in FY2026. |
| Senior notes | $35.5bn at carrying value, face $41.3bn, fair value $29.3bn; $4.4bn matures in the rest of FY2027; no new issuance in FY2024 to FY2026 other than notes from the 2024 exchange. |
| Anthropic compute commitment (Anthropic Form S-1, 26 Oct 2026) | Minimum spend of $44.9bn with Microsoft from Nov 2026 to May 2033, against $114.5bn with Google and $110.0bn with Amazon. Microsoft recorded a $3.2bn gain on its Anthropic investment in Q4 FY2026 (8-K Ex 99.1 of 29 Jul 2026). |
| Share repurchase program (Sep 2024) | $60bn authorization; $37.7bn unused at 30 Sep 2026. |
| 2026 Stock Plan | Approved on 5 Dec 2025 with 97.07% of votes; replaces the 2017 Stock Plan. |
9 Ownership, Voting Power & Annual Meeting
- One share class, one vote per share; no controlling holder. Vanguard Capital Management reported 7.48% (Schedule 13G, 31 Mar 2026); directors and executive officers hold below 1%.
- 2025 annual meeting (5 Dec 2025, virtual): 85.0% of shares voted; all 12 directors elected with 91.53% to 99.72% as reported; say on pay 91.94%; 2026 Stock Plan 97.07%; all six shareholder proposals rejected, the highest at 27.48% (data operations in human rights hotspots).
- 2026 annual meeting on 8 Dec 2026 (proxy of 21 Oct 2026): 12 nominees, 11 independent, incl. new nominees Carmine Di Sibio and John Collison; Reid Hoffman and Hugh Johnston not standing; four shareholder proposals.
- Insiders, twelve months: 13 open market sales of about 240,500 shares for about $118.6m and one purchase. CEO Satya Nadella sold 86,525 shares for $43.4m on 1 Sep 2026; CFO Amy Hood sold 48,979 shares for $24.8m in Sep and Oct 2026; Brad Smith $20.0m in Nov 2025; Judson Althoff $18.3m. Nadella and Hood sold under trading plans adopted in Mar and Jun 2026.
- Purchase: director John Stanton bought 5,000 shares at $397.35 on 18 Feb 2026, about $2.0m.
| Proposal | For (bn votes) | Against (bn votes) | Abstain (bn votes) | For as % of votes cast | Result |
|---|---|---|---|---|---|
| Elect Hugh F. Johnston | 4.733 | 0.438 | 0.012 | 91.5 | Elected; 91.53% as reported |
| Elect Satya Nadella | 4.815 | 0.337 | 0.031 | 93.5 | Elected; 93.46% as reported |
| Elect John David Rainey | 5.160 | 0.015 | 0.009 | 99.7 | Elected; 99.72% as reported |
| Advisory vote on executive compensation | 4.745 | 0.416 | 0.023 | 91.9 | Approved; 91.94% as reported |
| Ratify Deloitte & Touche as auditor FY2026 | 5.898 | 0.408 | 0.015 | 93.5 | Approved; 93.53% as reported |
| Approve 2026 Stock Plan | 5.016 | 0.152 | 0.016 | 97.1 | Approved; 97.07% as reported |
| Shareholder: European security program censorship risk audit | 0.040 | 5.103 | 0.040 | 0.8 | Rejected; 0.79% as reported |
| Shareholder: report on censorship risks in generative AI | 0.036 | 5.104 | 0.044 | 0.7 | Rejected; 0.69% as reported |
| Shareholder: report on AI data usage oversight | 0.684 | 4.436 | 0.064 | 13.4 | Rejected; 13.36% as reported |
| Shareholder: report on data operations in human rights hotspots | 1.407 | 3.713 | 0.064 | 27.5 | Rejected; 27.48% as reported |
| Shareholder: report on human rights due diligence | 1.337 | 3.738 | 0.108 | 26.3 | Rejected; 26.34% as reported |
| Shareholder: report on AI and machine learning tools for oil and gas | 0.448 | 4.671 | 0.064 | 8.8 | Rejected; 8.75% as reported |
Remarks at the 2025 annual meeting
- Virtual meeting of 5 Dec 2025: management recapped FY2025 revenue above $281bn, +15%, and $37.7bn returned to shareholders.
- CFO Amy Hood: about $400bn of committed contracts; capex follows demand; capital allocation order growth investment, then dividends, then buybacks.
- Shareholder questions covered AI infrastructure returns, responsible AI staffing (about 400 people, half full time) and datacenter siting.
| Holder | Shares (m) | % of class | As of | Filing |
|---|---|---|---|---|
| Vanguard Capital Management | 556.0 | 7.48 | 31 Mar 2026 | Schedule 13G |
| BlackRock | 540.0 | 7.3 | 31 Dec 2023 | Schedule 13G/A, latest on file |
| Directors and executive officers | see note | below 1 | Oct 2026 | Forms 4 |
10 Risk Factors
- Item 1A of the FY2026 Form 10-K holds 26 risk factors against 23 in FY2025 (11,557 words against 9,977); the Q1 FY2027 Form 10-Q repeats all 26 with added text on AI agents and datacenter construction.
| Risk | Disclosure and change |
|---|---|
| Infrastructure investment ahead of revenue | New FY2026 factor: datacenter, component and energy spending made on an accelerated timeline; overestimated demand may leave capacity underused and lead to impairment. Cash capex TTM $135.9bn; leases not yet commenced $364.6bn. |
| Customer concentration in OpenAI | Revenue from OpenAI $10.0bn in Q1 FY2027, 10.8% of revenue; receivable $7.2bn; OpenAI was about 45% of commercial RPO at Dec 2025, stated on the Q2 FY2026 call. |
| Power, permits and supply | New standalone factor names electricity, grid connection delays, land, zoning and permits; supply factor adds multi year lead times and purchase commitments above market prices. The CFO cited about $25bn of higher component prices in calendar 2026 capex (Apr 2026 call). |
| AI development and misuse | FY2026 text adds instances of AI operating inconsistently with company principles and over reliance on companion AI; the Q1 FY2027 10-Q adds agentic systems that pursue unintended goals. |
| Tax disputes | IRS proposed adjustments for 2004 to 2013 of $28.9bn plus penalties and interest, contested; tax years 2014 to 2017 under audit; unrecognized tax benefits $30.6bn. |
| PC and gaming demand | Windows OEM and devices revenue (22%) in Q1 FY2027 after the Windows 10 end of support peak; XBOX hardware (14%); FY2026 operating expenses included XBOX impairment and related charges. |
| Legal and regulatory | Accrued legal liabilities $582m with about $400m more reasonably possible; LinkedIn GDPR appeal pending; the 10-Q adds US state audit obligations for advanced AI models. |
How risk factors changed
- Comparison: 10-K FY2026 (year to 30 Jun 2026) filed 29 Jul 2026 acc 0001193125-26-323660 against 10-K FY2025 (year to 30 Jun 2025) filed 30 Jul 2025 acc 0000950170-25-100235.
- 'AI' appears 82 times in 18 of 26 factors in the FY2026 10-K against 51 times in 14 of 23 factors in the FY2025 10-K, and 96 times in 19 factors in the Q1 FY2027 10-Q.
- Words on power, energy and electricity rose from 10 to 23 mentions between the two Forms 10-K (25 in the Q1 FY2027 10-Q); capacity, power and permitting now sit in two separate operational factors.
- Mentions of AI agents rose from 2 in the FY2025 10-K to 5 in the FY2026 10-K and 15 in the Q1 FY2027 10-Q, mainly in the cybersecurity and AI factors.
- The new investment factor ties returns to continued customer use of Azure for AI workloads and states demand may be overestimated, leading to underused infrastructure and possible impairment.
- Item 1A grew from 9,977 to 11,557 words (+15.8%) between the Forms 10-K and to 11,607 words in the Q1 FY2027 10-Q.

| Measure | 10-K FY2025 | 10-K FY2026 |
|---|---|---|
| Risk factors (count) | 23 | 26 |
| Words in Item 1A | 9,977 | 11,557 |
| Change | Risk factor | What changed |
|---|---|---|
| Added | Cloud and AI strategy requires substantial investments | New factor states AI datacenter, component and energy investments are made at large scale, on an accelerated timeline and ahead of fully developed revenue, that funding depends on cash flow and capital markets, and that overestimated demand may leave infrastructure underused and lead to asset impairment. |
| Added | May be unable to develop and expand adequate infrastructure | New standalone factor on datacenter capacity names electricity availability, grid connection delays, energy costs, land, zoning, environmental reviews and permits as limits on expansion. |
| Added | May experience other quality problems | Software and hardware quality text split out of the former combined supply or quality factor, now naming AI products alongside other software, XBOX consoles and Surface devices. |
| Reworded | Success depends on competitive cloud and AI products | Replaces 'Our focus on cloud based and AI services presents execution and competitive risks'; adds agentic computing, monetizing AI through pricing models that reflect value, go to market and retention execution, and misuse of AI products by customers or malicious actors. |
| Reworded | Abuse of our platforms may harm reputation | Adds child safety focus: laws requiring age assurance, age appropriate design and parental controls in app stores and operating systems, and risks to children and adolescents from conversational or emotionally engaging AI systems. |
| Reworded | Issues in AI development and deployment | Drops the reference to strategic partner OpenAI as a named model source; adds that the company has experienced instances of AI solutions operating inconsistently with its principles, and risks of over reliance on companion or highly personalized AI. |
| Reworded | Supply problems | Heading narrowed from 'supply or quality problems'; adds shortages of semiconductors, networking, power and cooling equipment, multi year lead times, long term purchase and price commitments above market rates, and possible delays to infrastructure deployment. |
| Reworded | Outages, disruptions or capacity constraints | Replaces 'excessive outages, data losses, and disruptions'; adds reliance on third party colocation, leased datacenters and cloud infrastructure providers, and capacity constraints from power, GPU and component availability. |
| Reworded | Protection and utilization of intellectual property | Removes the sentences on weaker patent law and broad licensing through open source engagement; body shortened from 180 to 131 words. |
| Filing | Change disclosed |
|---|---|
| 10-Q Q1 FY2027 (Sep 2026 quarter) filed 28 Oct 2026 | Microsoft repeats the full Item 1A (26 factors, 11,607 words, no factor added or removed). Text additions: AI agents acting autonomously and vulnerability discovery driven by AI added to the cybersecurity factor; models and agentic systems that pursue unintended goals or are manipulated through prompts added to the AI factor; a new 'Datacenter construction and operation' paragraph on siting, permitting, energy, water and grid laws and new US state audit obligations for advanced AI models added to the legal factor; frontier AI that trains on Microsoft interactions added as an IP risk; the employee factor was cut from 277 to 185 words, removing references to diverse backgrounds and union activity; the Ukraine and Middle East conflict references and Seattle and Silicon Valley location references were removed from the catastrophic events factor. |
11 Stock Price, Scenarios & Sensitivity
- MSFT traded at $522.99 on 30 Oct 2026, 5.1% below the 52 week high of $551.15 and 49.8% above the June 2026 low of $349.20.
- Valuation: 27.3x TTM diluted EPS of $19.16, which includes the Q2 FY2026 OpenAI gain of $7.6bn after tax and the Q4 FY2026 Anthropic gain; 11.1x EV/Sales; 18.8x EV/EBITDA; free cash flow yield 1.5% on TTM free cash flow of $60.0bn.
- Scenario model: revenue grows from TTM Q1 FY2027 $346.4bn for three years; operating margin as stated; no investment gains or losses; 19% tax rate; price equals TTM Q1 FY2030 EPS times exit P/E.

Critical factors and core assumptions
| Factor | Current value | Best case requires | Evidence in filings and calls |
|---|---|---|---|
| Azure growth | Q1 FY2027 +48.2%; Q2 FY2027 guidance +49% to +50% in constant currency (call) | above 40% a year through FY2028 | 10-Q Q1 FY2027; Q1 FY2027 call |
| Conversion of commercial RPO | $677bn, about 30% within 12 months (call) | OpenAI and other model lab commitments delivered on schedule | 10-Q; Q2 FY2026 and Q1 FY2027 calls |
| Capacity and capex productivity | cash capex $39.4bn; $45.2bn incl. finance leases (call); leases not commenced $364.6bn | capacity matches demand; Microsoft Cloud gross margin at or above 65% | 10-Q lease note; Q2 FY2027 guidance |
| Copilot monetization | over 30m paid Microsoft 365 Copilot seats (Jun 2026); Microsoft 365 cloud +17.2% | Microsoft 365 commercial cloud growth in the high teens or above | 8-K Ex 99.1 of 29 Jul 2026; 10-Q |
| Operating margin | 49.8% in Q1 FY2027; 46.8% in FY2026 | 48% or higher in FY2029 as depreciation grows | income statements; FY2027 margin guidance |
| OpenAI relationship | 24% stake; $10.0bn of quarterly revenue; $7.2bn receivable | revenue share and stake value sustained; no impairment | 10-Q Note 1 |
- Revenue base TTM Q1 FY2027 $346.4bn; operating income $163.2bn (47.1% margin).
- Best case: 20% revenue CAGR, 48% operating margin, 32x P/E, share count (1%) over three years.
- Base case: 15% revenue CAGR, 45% margin, 27x P/E, share count (1%) over three years, in line with buybacks of $20bn to $25bn a year.
- Worst case: 9% revenue CAGR, 40% margin, 20x P/E, share count unchanged; OpenAI related commitments delayed and AI capacity underused.
- Tax rate 19% (TTM 19.7%); OpenAI gains and losses excluded; net interest set to zero.
Scenarios, three years forward
| Measure | Worst case | Base case | Best case |
|---|---|---|---|
| Revenue CAGR, 3 years (%) | 9.0 | 15.0 | 20.0 |
| Revenue, TTM Q1 FY2030 ($bn) | 448.7 | 526.9 | 598.7 |
| Operating margin, TTM Q1 FY2030 (%) | 40.0 | 45.0 | 48.0 |
| Net income, TTM Q1 FY2030 ($bn) | 145.4 | 192.1 | 232.8 |
| EPS, TTM Q1 FY2030 ($) | 19.58 | 26.12 | 31.66 |
| Exit P/E (x) | 20.0 | 27.0 | 32.0 |
| Implied price ($) | 392 | 705 | 1,013 |
| Change against $522.99 (%) | (25) | 35 | 94 |
| Implied annual return (%) | (9.2) | 10.5 | 24.7 |

Sensitivity analysis
| Revenue CAGR \ Operating margin | 40% | 43% | 45% | 47% | 48% |
|---|---|---|---|---|---|
| 9% | $534 | $574 | $601 | $627 | $641 |
| 12% | $579 | $623 | $652 | $681 | $695 |
| 15% | $627 | $674 | $705 | $737 | $752 |
| 18% | $677 | $728 | $762 | $796 | $813 |
| 20% | $712 | $766 | $801 | $837 | $855 |
| Exit P/E \ Operating margin | 40% | 43% | 45% | 47% | 48% |
|---|---|---|---|---|---|
| 20x | $464 | $499 | $522 | $546 | $557 |
| 23x | $534 | $574 | $601 | $628 | $641 |
| 27x | $627 | $674 | $705 | $737 | $752 |
| 30x | $697 | $749 | $784 | $819 | $836 |
| 32x | $743 | $799 | $836 | $873 | $892 |
Disclaimer
This analysis is for information only and is not financial advice. It is derived from public SEC filings retrieved via sec-api.io and is not a publication of the U.S. Securities and Exchange Commission. Scenario values are model outputs under stated assumptions and are not forecasts. Data as of 30 October 2026.
Sources
All company figures are read from SEC filings retrieved through the sec-api.io MCP server. Statements marked as stated on the call are taken from the earnings calls held by the company for Q2 FY2026 to Q1 FY2027.
| Form | Period | Filed | Accession number |
|---|---|---|---|
| 10-Q | Q1 FY2027 | 28 Oct 2026 | 0001193125-26-436133 |
| 8-K Ex 99.1 | Q1 FY2027 results | 28 Oct 2026 | 0001193125-26-436122 |
| 8-K Ex 99.1 (recast 10-K) | FY2024 to FY2026 | 28 Oct 2026 | 0001193125-26-436149 |
| DEF 14A | 2026 annual meeting | 21 Oct 2026 | 0001193125-26-427849 |
| 8-K Ex 99.1 | FY27 segments presentation | 2 Sep 2026 | 0001193125-26-380280 |
| 10-K | FY2026 | 29 Jul 2026 | 0001193125-26-323660 |
| 8-K | Q4 FY2026 results | 29 Jul 2026 | 0001193125-26-323632 |
| 10-Q | Q3 FY2026 | 29 Apr 2026 | 0001193125-26-191507 |
| 10-Q | Q2 FY2026 | 28 Jan 2026 | 0001193125-26-027207 |
| 10-Q | Q1 FY2026 | 29 Oct 2025 | 0001193125-25-256321 |
| 10-K | FY2025 | 30 Jul 2025 | 0000950170-25-100235 |
| 10-Q | Q3 FY2025 | 30 Apr 2025 | 0000950170-25-061046 |
| 10-K | FY2024 | 30 Jul 2024 | 0000950170-24-087843 |
| 10-K | FY2023 | 27 Jul 2023 | 0000950170-23-035122 |
| 8-K 5.07 | 2025 annual meeting | 8 Dec 2025 | 0001193125-25-311196 |
| Schedule 13G | 31 Mar 2026 | 30 Apr 2026 | 0002100119-26-000820 |
| Company | Form | Filed | Accession number |
|---|---|---|---|
| Adobe | 8-K Ex 99.1 | 10 Sep 2026 | 0000796343-26-000147 |
| Alphabet | 10-Q | 28 Oct 2026 | 0001652044-26-000084 |
| Amazon | 8-K Ex 99.1 | 29 Oct 2026 | 0001018724-26-000038 |
| Anthropic | S-1 | 26 Oct 2026 | 0001628280-26-067168 |
| CoreWeave | 8-K Ex 99.1 | 11 Aug 2026 | 0001769628-26-000362 |
| HP Inc. | 8-K Ex 99.1 | 26 Aug 2026 | 0000047217-26-000048 |
| Meta | 10-Q | 21 Oct 2026 | 0001628280-26-066773 |
| Oracle | 10-Q | 11 Sep 2026 | 0001193125-26-389274 |
| Roblox | 8-K Ex 99.1 | 29 Oct 2026 | 0001628280-26-068235 |
| Salesforce | 8-K Ex 99.1 | 26 Aug 2026 | 0001108524-26-000187 |
| ServiceNow | 8-K Ex 99.1 | 28 Oct 2026 | 0001373715-26-000092 |
| Take Two Interactive | 8-K Ex 99.1 | 7 Aug 2026 | 0001628280-26-054580 |
| Workday | 8-K Ex 99.1 | 27 Aug 2026 | 0001327811-26-000042 |
| Filed | Exhibit | Document | Content |
|---|---|---|---|
| 8 Dec 2025 | 8-K body (no exhibits; Items 5.02, 5.07) | 2025 annual meeting vote results and 2026 Stock Plan approval | Annual meeting held 5 Dec 2025; 6,321,402,487 of 7,433,087,554 eligible shares voted (85.0%); All 12 director nominees elected; support ranged from 91.53% (Hugh Johnston) to 99.72% (new director John David Rainey); Satya Nadella 93.46% |
| 28 Jan 2026 | EX-99.1 | Q2 FY2026 (Dec 2025) earnings release with financial statements | Revenue $81.3bn, up 17% (15% constant currency); operating income $38.3bn, up 21%; GAAP net income $38.5bn (up 60%) and diluted EPS $5.16 included $7.6bn net gain from OpenAI investments; non GAAP net income $30.9bn (up 23%), EPS $4.14 (up 24%) |
| 29 Apr 2026 | EX-99.1 | Q3 FY2026 (Mar 2026) earnings release with financial statements | Revenue $82.9bn, up 18% (15% constant currency); operating income $38.4bn, up 20%; net income $31.8bn and diluted EPS $4.27, both up 23%; CEO stated the AI business passed an annual revenue run rate of $37bn, up 123% year on year |
| 14 May 2026 | EX-99.1 | Press release: Carmine Di Sibio appointed to board | Former EY global chairman and CEO Carmine Di Sibio appointed director effective 13 May 2026; Joins Audit Committee and Compensation Committee; board expanded to 13 members |
| 5 Jun 2026 | 8-K body (no exhibits; Item 5.02) | Reid Hoffman will not stand for reelection | Reid Hoffman, director since 2017, told the company on 2 Jun 2026 he will not stand for reelection at the 2026 annual meeting; He serves until the 2026 annual meeting; filing states no disagreement with management |
| 29 Jul 2026 | EX-99.1 | Q4 FY2026 (Jun 2026) and full year FY2026 earnings release with financial statements | Q4 revenue $90.0bn, up 18%; operating income $40.6bn, up 18%; GAAP net income $35.8bn (up 31%), diluted EPS $4.81; non GAAP EPS $4.74 (up 23%); Discrete items added $0.27 to EPS against April guidance, including a $3.2bn gain on the Anthropic investment and lower Voluntary Retirement Program costs, partly offset by XBOX severance and impairment charges |
| 2 Sep 2026 | EX-99.1 | Investor presentation: FY2027 segments, investor metrics, restated history and adjusted Q1 FY2027 outlook | From FY2027 three segments become two: Agents and Infra (Azure, Microsoft 365 cloud, productivity and server licensing, industry solutions, frontier and support services) and Devices and Consumer (search and advertising, XBOX, Windows OEM and devices); GitHub cloud and Security Copilot move from Azure to Microsoft 365 commercial cloud; LinkedIn is split between Industry solutions cloud and Search and advertising |
| 28 Oct 2026 | EX-99.1 | Q1 FY2027 (Sep 2026) earnings release with financial statements, first under new segments | Revenue $92.3bn, up 19%, above the $89.85bn to $90.95bn guidance range; operating income $45.9bn, up 21%; GAAP net income $36.6bn (up 32%), diluted EPS $4.92; non GAAP net income $36.4bn and EPS $4.89 (both up 18%) excluding $207m OpenAI gain |
| 28 Oct 2026 | EX-99.1 | FY2026 10-K Items 1, 7 and 8 recast for the new segment structure | Recasts FY2026 annual report business description, MD&A and financial statements to Agents and Infra and Devices and Consumer; auditor report dual dated 29 Jul 2026 and 28 Oct 2026 for Notes 1, 7, 8, 12 and 18; Recast segment results FY2026 / FY2025 / FY2024: Agents and Infra revenue $268.1bn / $218.8bn / $186.9bn, operating income $136.4bn / $110.8bn / $94.5bn |
| 28 Oct 2026 | EX-23.1 | Deloitte & Touche consent | Deloitte consents to incorporation of its reports (dated 29 Jul 2026; 28 Oct 2026 for retrospective adjustments) into ten Form S-8 registrations and one Form S-3 |