Cerebras (CBRS): First Public Quarters
Insights derived from analysing SEC filings. Independent analysis of Cerebras Systems Inc. Class A common stock, not a publication of the SEC.
Figures are read from the Form 424B4 prospectus dated 13 May 2026 and the Forms S-1 and S-1/A behind it, from the Forms 10-Q for the quarters ended 31 March 2026 and 30 June 2026, and from the three Forms 8-K carrying the Exhibit 99.1 earnings releases and the Exhibit 3.1 certificate of incorporation, no Form 10-K and no proxy statement of any kind having been filed under central index key 2021728. Accession numbers appear in the text beside the figures, the Schedules and the Forms 3, 4 and 144 they are read from. Market prices are the closing prices of 4 September 2026.
Summary
Cerebras Systems reported revenue of $180.1m for the quarter ended 30 June 2026, 74.3% above the same quarter of 2025, and an operating loss of $(477.2)m against $(57.2)m. Share based compensation was $377.0m of that quarter's expense, $273.6m of it recognised on restricted stock units once a liquidity based vesting condition was satisfied at the 13 May 2026 listing. Gross profit was $25.6m at a 14.2% gross margin, against 31.1% a year earlier. Revenue for the six months to 30 June 2026 was $373.5m against $202.8m. Before share based compensation the quarter's operating loss was $100.2m, 55.6% of revenue.
No annual report on Form 10-K has been filed. The first is due for the year ending 31 December 2026, so the audited record stops at 31 December 2025 and sits inside the IPO prospectus, which presents two audited years, FY2025 audited by KPMG LLP and FY2024 audited by BDO USA, P.C., and eight unaudited quarters. Audited revenue was $510.0m in FY2025 and $290.3m in FY2024, with operating losses of $(145.9)m and $(101.4)m.
The revenue mix moved to services in one quarter. Cloud and other services revenue was $126.0m in the June 2026 quarter against $33.0m a year earlier, while hardware revenue fell to $54.1m from $70.3m. Reported revenue is struck after $44.3m of customer warrant amortisation charged against revenue in the quarter and $46.3m in the half, a charge that runs to October 2031. Revenue recognised under the December 2025 master relationship agreement with OpenAI OpCo, LLC was $56.8m in the quarter and $74.4m in the half.
Revenue is concentrated in named counterparties. The risk factors put Mohamed bin Zayed University of Artificial Intelligence at 34% of revenue in the June 2026 quarter against 70% a year earlier, at 63% in the March 2026 quarter, at 62.0% for FY2025, and at 49% against 47% for the two six month periods; Group 42 Holding Ltd and its affiliates are put at 85.0% for FY2024 and 24.0% for FY2025. Two customers held 76% of accounts receivable at 30 June 2026 and one held 78% at 31 December 2025. Revenue allocated to unsatisfied performance obligations was $25.4bn at 30 June 2026, of which the company expects to recognise 22% in the first 24 months.
The offering closed on 15 May 2026 at 34,500,000 Class A shares at $185.00, with net proceeds of approximately $6.2 billion. Cash and cash equivalents were $6.74bn at 30 June 2026 with $1.18bn of investments, against $701.7m and $406.5m at 31 December 2025. Operating cash flow was an outflow of $47.5m for the half and capital expenditure $548.9m. Debt is the $918.2m balance of a working capital loan from OpenAI OpCo, LLC bearing 6% interest and maturing no later than 31 December 2032; an $850.0m revolving facility was undrawn at 30 June 2026. Total equity moved from a deficit of $578.7m at 31 December 2025 to $9.15bn.
Numeric guidance appears only in the two Exhibit 99.1 earnings releases. The full year 2026 core revenue range was raised on 12 August 2026 to $880m to $890m from the $855.0m to $865.0m issued on 23 June 2026, with core gross margin raised to 41% to 43% and core operating margin to (19)% to (17)%. Third quarter core revenue is guided at approximately $214 million to $216 million. The Chief Financial Officer states a plan to more than triple revenue in 2027, with no range attached.
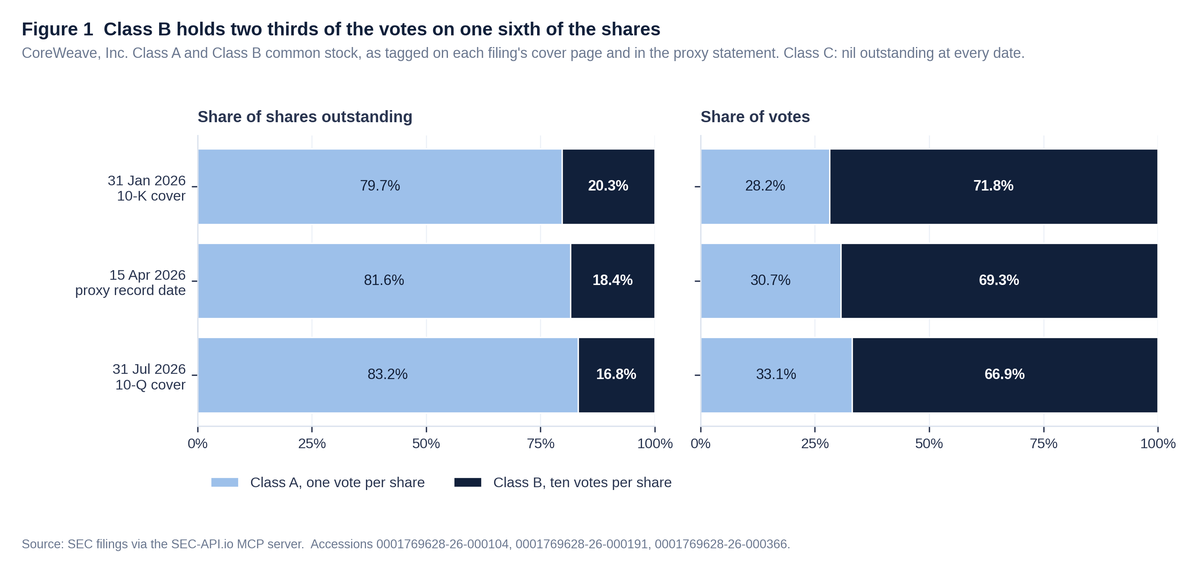
Class A common stock closed at $210.05 on 4 September 2026, putting the market value of all 237,564,041 shares across the three classes at $49.90bn and of the listed Class A alone at $23.58bn. That is 69.3 times June quarter revenue taken at an annual rate, against 14.4 times at NVIDIA, 16.9 at AMD, 7.5 at Intel and 4.8 at CoreWeave, whose market value of $49.29bn is struck on quarterly revenue of $2.58bn against Cerebras's $180m. Class B carries twenty votes a share and holds 95.2% of the votes on 47.0% of the shares.
Across the four months since listing, 46 Forms 4 name Cerebras as issuer and none carries code P, an open market purchase. Insiders sold 1,291,278 shares under code S at prices from $161.46 to $250.302, and a further 713,377 shares were withheld by the issuer at the $185.00 offering price to pay tax on vesting restricted stock units. The prospectus carries 70 risk factors and both quarterlies carry 67, the three dropped being tied to the offering itself; six headings were reworded and none was added. Item 1A of all three filings names material weaknesses in internal control over financial reporting, and the conclusion on disclosure controls at 30 June 2026 is that they were not effective.
1 Revenue & Business Model
Cerebras Systems reported revenue of $180.1m for the quarter ended 30 June 2026 and $373.5m for the six months then ended, against $103.3m and $202.8m for the same periods of 2025. The audited record behind those quarters runs to two years: revenue of $510.0m for the year ended 31 December 2025 and $290.3m for the year ended 31 December 2024, both taken from the final IPO prospectus on Form 424B4, accession 0001628280-26-035214.
No Form 10-K has been filed. The company listed on 14 May 2026 and its first fiscal year as a reporting company ends 31 December 2026, so the first annual report is not yet due. The query cik:2021728 AND formType:"10-K" returns zero filings. There is therefore no Item 1 Business, no audited three year income statement and no annual segment note on the Exchange Act record. Everything annual in this chapter comes from the registration statement, and everything quarterly from the two Forms 10-Q, accessions 0001628280-26-044981 (quarter ended 31 March 2026) and 0001628280-26-056357 (quarter ended 30 June 2026). The prospectus itself presents only two audited years, so a five year revenue series cannot be built for this company from any filing.
What the company sells
The Q2 2026 10-Q describes the business in one sentence: Cerebras "is an artificial intelligence (“AI”) infrastructure company that designs and manufactures an AI compute platform comprised of proprietary systems and software that is delivered in standard racks for deployment in our, and our customers’ data centers up to supercomputer scale."
Cerebras states in the prospectus that it delivers "high-performance AI offerings primarily through on-premises hardware and cloud-based solutions." The core component is the Wafer-Scale Engine, a processor occupying an entire silicon wafer, housed in the CS-3 system, which the prospectus describes as a data centre ready appliance; multiple CS-3 systems connect into what the company calls Cerebras AI supercomputers. Hardware sales include a renewable software subscription.
The cloud side has two contract shapes the prospectus names and defines. Dedicated Capacity contracts "are generally structured as take-or-pay commitments, under which customers pay for dedicated compute capacity irrespective of utilization", and the associated revenue is recognised over the service term. On-Demand is consumption priced, with customers paying for tokens as they use them or pre purchasing token bundles drawn down over time. Alongside these sit deployment and professional services and custom AI modelling work. Cerebras Cloud is sold directly and through partner marketplaces the prospectus lists, including AWS Marketplace, Microsoft Marketplace, IBM watsonx Model Gateway, OpenRouter, Hugging Face and Vercel AI Gateway.
Cerebras "operates as one reportable segment", with the chief executive officer as chief operating decision maker and net income or loss as the measure of segment profit. On that basis of presentation there is no segment revenue table to set against consolidated revenue. Revenue is disaggregated two ways instead: by type and timing of transfer, and by geographic area, which is "designated based upon the billing location of the customer."
Table 1.1 Revenue as filed, by type and by geographic area, $m
| Q2 2026 | Q2 2025 | H1 2026 | H1 2025 | FY2025 | FY2024 | |
|---|---|---|---|---|---|---|
| Hardware, at a point in time | 54.119 | 70.295 | 164.712 | 139.969 | 358.440 | 211.965 |
| Cloud and other services, at a point in time | 0.359 | 0.237 | 0.987 | 0.851 | 2.194 | 0.628 |
| Cloud and other services, over time | 125.632 | 32.790 | 207.817 | 62.014 | 149.357 | 77.659 |
| Total revenue | 180.110 | 103.322 | 373.516 | 202.834 | 509.991 | 290.252 |
| United States | 83.977 | 30.212 | 154.071 | 105.096 | 187.643 | 282.685 |
| Europe, Middle East, and Africa | 95.749 | 73.033 | 218.921 | 97.643 | 322.231 | 7.567 |
| Other | 0.384 | 0.077 | 0.524 | 0.095 | 0.117 | n/a |
Quarterly and half year figures from the Forms 10-Q named above; annual figures from the 424B4. Periods end 30 June 2026, 30 June 2025, 31 December 2025 and 31 December 2024. The FY2024 "Other" line was filed as a dash.
The mix moved to cloud in one quarter
Cloud and other services revenue was $126.0m in the June 2026 quarter against $33.0m a year earlier, while hardware revenue fell to $54.1m from $70.3m. The prospectus stated the direction before it happened: as a result of the OpenAI Master Relationship Agreement, "we expect cloud and other services revenue to comprise a significantly higher percentage of total revenue in future periods."
Reported revenue is now struck after a noncash reduction. Cerebras recognised $44.3m in the June quarter and $46.3m in the half as a reduction in revenue for amortisation of customer warrant assets, of which $2.5m and $3.3m related to the OpenAI arrangement. The remaining balance of those warrant assets will be charged against revenue through October 2031. The prospectus explains the mechanic: the contra revenue lowers reported net revenue, while the gross amount without contra revenue is what the customer is invoiced and pays in cash.
Billing location moved with the customer base. In FY2024, $282.7m of $290.3m was billed in the United States; in FY2025, $322.2m of $510.0m was billed in Europe, the Middle East and Africa.


Concentration: the largest share fell to 34% as the disclosed total held at 76%

The customer letters used in the concentration tables of the financial statement notes are assigned within each filing and do not carry across filings. The related party pairing shows this directly: in the 424B4 and the March quarter 10-Q the two customers flagged as related parties to each other are lettered A and B, and in the June quarter 10-Q they are lettered A and D. Those lettered tables therefore track the largest customer of each period rather than one traced counterparty.
The risk factors do name the counterparties, in the prospectus and in both Forms 10-Q, and the percentages they state match the lettered tables. Mohamed bin Zayed University of Artificial Intelligence ("MBZUAI"), an Abu Dhabi university, is named at 62.0% of total revenue for FY2025 in the 424B4 risk factors, and in the quarterly risk factors at 63% and 24% for the March 2026 and March 2025 quarters, at 34% and 70% for the June 2026 and June 2025 quarters, and at 49% and 47% for the two six month periods. Group 42 Holding Ltd and its affiliates ("G42"), an Abu Dhabi technology group, is named at 24.0% and 85.0% for FY2025 and FY2024 in the 424B4 risk factors, and at 11% and 64% for the March quarters and 9% and 18% for the June quarters. So MBZUAI is the counterparty behind the largest share in FY2025 and in both 2026 quarters, and G42 behind the 85.0% of FY2024. G42 and MBZUAI are stated to be related parties with respect to each other under ASC 850, Related Party Disclosures.
On a six month basis the named largest customer moved from 47% of revenue in 2025 to 49% in 2026. The June 2026 quarter share fell from 70% a year earlier, a comparison of single quarters inside that unchanged half year position, and it came alongside two other customers crossing the disclosure threshold at 32% and 10%.
Receivables concentrated as revenue spread. The June quarter 10-Q states that "as of June 30, 2026, two customers accounted for 76% of our accounts receivable balance. As of December 31, 2025, one customer accounted for 78% of our accounts receivable balance." At 31 March 2026 three customers accounted for 86%, and at 31 December 2024 a single customer accounted for 91%. Accounts receivable, net rose to $123.4m at 30 June 2026 from $50.4m at 31 December 2025.
Revenue recognised under the OpenAI agreement was $56.8m in the June quarter and $74.4m in the half, both after the warrant amortisation above. No revenue was recognised under that arrangement in FY2025.
Contract structure
Table 1.2 Contract balances and remaining performance obligation, as filed
| 30 Jun 2026 | 31 Mar 2026 | 31 Dec 2025 | |
|---|---|---|---|
| Remaining performance obligation, $bn | 25.4 | 25.0 | 24.6 |
| Expected in the first 24 months | 22% | 16% | 15% |
| Expected in months 25 to 48 | 43% | 45% | 43% |
| Deferred revenue, current, $m | 173.735 | n/a | 131.049 |
| Deferred revenue, non current, $m | 244.529 | n/a | 35.847 |
| Customer deposits, current, $m | 242.672 | n/a | 354.460 |
Remaining performance obligation from the Forms 10-Q and the 424B4; balance sheet lines from the June quarter 10-Q, which presents 30 June 2026 against 31 December 2025.
The June quarter 10-Q attributes a significant amount of the $25.4bn to the Master Relationship Agreement signed with OpenAI OpCo, LLC in December 2025. Under that agreement OpenAI is contractually committed to purchase 750MW of AI inference compute capacity over a term of three or four years, extendable by OpenAI to five in total, with an option to purchase a further 1.25GW for deployment in tranches by the end of 2030, up to 2.0GW in all. OpenAI funded a secured promissory note of approximately $1.0bn in January 2026, bearing interest at 6% and maturing no later than 31 December 2032. Pass through data centre costs are included in the transaction price and are reported gross; those attached to capacity beyond the amounts already recognised as leases are excluded from the disclosed obligation.
$69.8m of revenue in the half had been sitting in deferred revenue at 31 December 2025, against $27.3m on the same basis a year earlier. In June 2026 Cerebras entered an agreement with AWS covering an initial multiyear lease of its systems, options for future procurement, pricing commitments, exclusivity and minimum manufacturing capacity guarantees, and states that if AWS purchases as contemplated, "AWS may represent a material percentage of our revenue at such time."
2 Financial Analysis & Ratios
Revenue in the June 2026 quarter, the three months ended 30 June 2026, was $180.1m and the operating loss was $477.2m, of which $377.0m was share based compensation. Both figures are unaudited interim information from the Form 10-Q filed on 12 August 2026, accession 0001628280-26-056357.
The audited record stops at 31 December 2025 and sits inside the final prospectus for the initial public offering, filed on Form 424B4, accession 0001628280-26-035214. That prospectus carries two audited years and no more: FY2025, audited by KPMG LLP with a report dated 31 March 2026, and FY2024, audited by BDO USA, P.C. with a report dated 18 September 2025. FY2023 consolidated statements are not presented in it. Every 2026 figure below comes from the two Forms 10-Q, accessions 0001628280-26-044981 and 0001628280-26-056357, and is unaudited.
Table 2.1 Statements of operations, US dollars in millions, as filed
| FY2024 audited | FY2025 audited | Q1 2026 unaudited | Q2 2026 unaudited | H1 2026 unaudited | H1 2025 unaudited | |
|---|---|---|---|---|---|---|
| Period end | 31 Dec 2024 | 31 Dec 2025 | 31 Mar 2026 | 30 Jun 2026 | 30 Jun 2026 | 30 Jun 2025 |
| Hardware and product revenue | 211.965 | 358.440 | 110.593 | 54.119 | 164.712 | 139.969 |
| Cloud, services and other revenue | 78.287 | 151.551 | 82.813 | 125.991 | 208.804 | 62.865 |
| Total revenue | 290.252 | 509.991 | 193.406 | 180.110 | 373.516 | 202.834 |
| Cost of hardware and product | 137.310 | 204.746 | 64.931 | 53.141 | 118.072 | 95.059 |
| Cost of cloud, services and other | 30.204 | 106.174 | 42.299 | 101.410 | 143.709 | 34.072 |
| Gross profit | 122.738 | 199.071 | 86.176 | 25.559 | 111.735 | 73.703 |
| Research and development | 158.234 | 243.319 | 75.495 | 320.151 | 395.646 | 113.519 |
| Sales and marketing | 20.980 | 70.645 | 14.701 | 86.969 | 101.670 | 28.554 |
| General and administrative | 44.962 | 30.969 | 11.017 | 95.672 | 106.689 | 17.282 |
| Operating loss | (101.438) | (145.862) | (15.037) | (477.233) | (492.270) | (85.652) |
| Other income (expense), net | (378.237) | 390.746 | 2.528 | 26.979 | 29.507 | 374.644 |
| Income tax expense | 1.927 | 7.057 | 1.497 | 0.274 | 1.771 | 3.347 |
| Net income (loss) | (481.602) | 237.827 | (14.006) | (450.528) | (464.534) | 285.645 |
| Basic earnings (loss) per share, dollars | (9.90) | 1.64 | (0.22) | (2.98) | (4.34) | 2.11 |
Net income in FY2025 and in the six months to 30 June 2025 each sit above an operating loss in the same period. The prospectus attributes $363.3m of FY2025 other income to a one time gain on extinguishment of the forward contract liability attached to the purchase agreement for certain Series F redeemable convertible preferred stock, and the Q2 2026 Form 10-Q records the same $363.3m gain inside the June 2025 quarter.

The cost of the cloud, services and other line rose to $101.4m in the June 2026 quarter from $24.6m a year earlier, faster than the revenue on it. The quarter also carries $44.3m of customer warrant amortisation recorded as a reduction of revenue, against $46.3m for the half year.
Operating expenses and the share based compensation charge

Share based compensation was $377.0m in the June 2026 quarter and $386.6m in the half year, against $13.3m and $22.4m in the same 2025 periods and $49.8m for the whole of FY2025. The Form 10-Q states that $273.6m of the quarter's charge was recognised on restricted stock units once the liquidity based vesting condition was satisfied at the IPO on 13 May 2026. The prospectus pro forma footnote had put that charge at approximately $150.5m, measured on the awards whose service condition was satisfied at 31 December 2025.
Table 2.2 Share based compensation by expense line, US dollars in millions
| Expense line | FY2024 audited | FY2025 audited | Q1 2026 unaudited | Q2 2026 unaudited |
|---|---|---|---|---|
| Cost of revenue | 0.921 | 0.827 | 0.950 | 15.353 |
| Research and development | 41.397 | 32.154 | 5.699 | 222.147 |
| Sales and marketing | 8.723 | 9.950 | 1.792 | 71.055 |
| General and administrative | 7.523 | 6.836 | 1.152 | 68.453 |
| Total | 58.564 | 49.767 | 9.593 | 377.008 |
Strip the charge out and the June 2026 quarter operating loss becomes $100.2m, or 55.6% of revenue, against $5.4m in the March 2026 quarter and $43.9m in the June 2025 quarter. The prospectus presents the same measure for the audited years at $96.1m for FY2025 and $42.9m for FY2024. The charge is what moves research and development, general and administrative and sales and marketing from $75.5m, $11.0m and $14.7m in the March 2026 quarter to $320.2m, $95.7m and $87.0m in the June quarter. At 31 March 2026 unrecognised compensation cost stood at $101.6m on service based awards, plus $531.2m on Class B performance shares granted to the chief executive officer and the chief technology officer.
Cash, the offering proceeds and debt

The offering closed on 15 May 2026. Cerebras sold 34,500,000 shares of Class A common stock at $185.00, including the underwriters' option for 4,500,000 shares exercised in full, and the Form 10-Q states net proceeds of approximately $6.2 billion after underwriting discounts, commissions and offering expenses. The financing section of the cash flow statement carries $6.23bn for the offering. The prospectus had estimated $5.41bn on the base offering and $6.22bn with the option exercised in full. The financing section also carries an outflow of $416.7m in the same half year, which the Form 10-Q describes as "tax withholding related to the tender offer and the IPO". The prospectus separately estimated $416.1m of the net proceeds for "tax withholding and remittance obligations related to the RSU Net Settlement", a narrower purpose than the filed outflow covers.
Cash and cash equivalents were $6.74bn at 30 June 2026, with $1.18bn of investments and $684.7m of restricted cash, against $701.7m, $406.5m and $228.7m at 31 December 2025. Operating cash flow was an outflow of $47.5m for the half year to 30 June 2026 and an outflow of $123.8m a year earlier; FY2025 was an outflow of $10.1m and FY2024 an inflow of $452.0m. Capital expenditure was $548.9m in the half year, against $382.7m for the whole of FY2025.
Debt is a working capital loan of $1.005bn received in January 2026 from OpenAI OpCo, LLC under the master relationship agreement, bearing stated interest of 6% and maturing no later than 31 December 2032. Noncash credits of $86.3m reduced it to $918.2m at 30 June 2026, split $736.0m current and $182.2m long term. The revolving credit agreement dated 14 April 2026 with Morgan Stanley Senior Funding, Inc. as agent stepped up from $250.0m to $850.0m on 17 June 2026, matures 14 April 2031, carries a $150.0m minimum liquidity covenant, and was undrawn at 30 June 2026.
Capital structure and ratios
All redeemable convertible preferred stock converted into 124,652,775 shares of Class B common stock at the offering. Total equity moved from a deficit of $578.7m at 31 December 2025 to $9.15bn at 30 June 2026, with additional paid in capital at $10.54bn and an accumulated deficit of $1.37bn.
Table 2.3 Shares outstanding at 5 August 2026 and the votes they carry
| Class | Shares | Share of total | Votes per share | Votes | Share of votes |
|---|---|---|---|---|---|
| Class A | 112,247,109 | 47.2% | 1 | 112,247,109 | 4.8% |
| Class B | 111,601,424 | 47.0% | 20 | 2,232,028,480 | 95.2% |
| Class N | 13,715,508 | 5.8% | 0 | n/a | n/a |
| Total | 237,564,041 | 100.0% | 2,344,275,589 | 100.0% |
Authorised capital is 3,500,000,000 Class A shares, 240,000,000 Class B, 100,000,000 Class N and 100,000,000 preferred, none of it designated as a series, per the amended and restated certificate of incorporation filed as EX-3.1 to the Form 8-K, accession 0001628280-26-035605.
Table 2.4 Ratios, computed from the figures in Tables 2.1 and 2.3
| FY2024 audited | FY2025 audited | Q1 2026 unaudited | Q2 2026 unaudited | |
|---|---|---|---|---|
| Gross margin | 42.3% | 39.0% | 44.6% | 14.2% |
| Operating margin | (34.9)% | (28.6)% | (7.8)% | (265.0)% |
| Operating margin before share based compensation | (14.8)% | (18.8)% | (2.8)% | (55.6)% |
| Revenue growth on the same period a year earlier | n/a | 75.7% | 94.4% | 74.3% |
| Current ratio at period end | 0.87x | 2.15x | n/a | 5.82x |
| Total liabilities to total assets at period end | 110.5% | 41.8% | n/a | 21.3% |
| Days sales outstanding on period revenue | 172.8 | 36.1 | n/a | 62.3 |
| Total debt to total equity at period end | n/a | n/a | n/a | 10.0% |
Return on equity and return on assets are absent from Table 2.4 because equity was negative at both audited year ends, at a deficit of $966.8m at 31 December 2024 and $578.7m at 31 December 2025, and the positive equity at 30 June 2026 had existed for six weeks. Leverage before 30 June 2026 has no meaning as a ratio either, because there was no borrowing on the balance sheet at 31 December 2025 or 31 December 2024. A three year or five year audited series for growth, margin and returns cannot be built, because the prospectus presents two audited years.
The eight unaudited quarters the prospectus carries
The prospectus carries a section headed "Quarterly Results of Operations" setting out eight consecutive unaudited quarters, the three months ended 31 March 2024 through the three months ended 31 December 2025. The company states that the information for each of those quarters "has been prepared on the same basis as our audited consolidated financial statements" and that the results "are not necessarily indicative of the results that may be expected for a full year or any other fiscal period".
Table 2.5 Unaudited quarterly results of operations from the prospectus, US dollars in millions, as filed
| Quarter ended | Total revenue | Gross profit | Gross margin | Loss from operations | Net income (loss) | Share based compensation |
|---|---|---|---|---|---|---|
| 31 Mar 2024 | 66.631 | 25.139 | 37.7% | (18.051) | (15.750) | 9.426 |
| 30 Jun 2024 | 69.771 | 30.880 | 44.3% | (23.760) | (50.855) | 22.903 |
| 30 Sep 2024 | 72.319 | 32.007 | 44.3% | (19.377) | (309.341) | 16.828 |
| 31 Dec 2024 | 81.531 | 34.712 | 42.6% | (40.250) | (105.656) | 9.407 |
| 31 Mar 2025 | 99.512 | 41.604 | 41.8% | (28.470) | (23.867) | 9.154 |
| 30 Jun 2025 | 103.322 | 32.099 | 31.1% | (57.182) | 309.512 | 13.281 |
| 30 Sep 2025 | 135.714 | 55.135 | 40.6% | (26.469) | (22.201) | 11.346 |
| 31 Dec 2025 | 171.443 | 70.233 | 41.0% | (33.741) | (25.617) | 15.986 |
Form 424B4, accession 0001628280-26-035214, MD&A, "Quarterly Results of Operations". Share based compensation is the total line of the footnote to that table, which splits it between cost of revenue and operating expenses.
Together with the March and June 2026 quarters in Table 2.1, the record carries ten consecutive quarters to 30 June 2026, all of the quarterly figures unaudited. The September and December 2025 quarters appear in the prospectus alone, and December quarter revenue was 2.1 times the December 2024 quarter.
3 MD&A & Management Commentary
For the quarter ended 30 June 2026, Cerebras Systems reported revenue of $180.1 million, gross profit of $25.6 million, a loss from operations of ($477.2) million and a net loss of ($450.5) million. Stock based compensation expense was $377.0 million in the quarter, against $9.6 million in the quarter ended 31 March 2026 (Form 10-Q, accession 0001628280-26-056357, filed 12 August 2026; Form 10-Q, accession 0001628280-26-044981, filed 23 June 2026).
With no Form 10-K on the record, there is no Item 7 annual MD&A. Management's own account of the business sits in three places: Part I Item 2 of the two Forms 10-Q, the MD&A of the Rule 424(b)(4) prospectus, dated 13 May 2026 and filed 14 May 2026 (accession 0001628280-26-035214), and the Exhibit 99.1 press releases furnished with the earnings Forms 8-K. Numeric guidance appears only in the third.
The three current reports
Three Forms 8-K exist under CIK 2021728, and the table below is all of them. Item numbers are read from the EDGAR submission header returned by the SEC-API.io filing search; the structured 8-K endpoint returns zero records for this issuer.
Table 3.1 Every Form 8-K filed by Cerebras Systems, with the Items each carries
| Filed | Accession | Items as filed | What the Item carries |
|---|---|---|---|
| 12 Aug 2026 | 0001628280-26-056186 | Item 2.02 Results of Operations and Financial Condition; Item 9.01 Financial Statements and Exhibits | EX-99.1 second quarter 2026 release: core revenue $209.9 million, core gross margin 41%, core operating margin (16)%, remaining performance obligations $25.4 billion, third quarter and raised full year outlook. Furnished, not filed. |
| 23 Jun 2026 | 0001628280-26-044941 | Item 2.02 Results of Operations and Financial Condition; Item 9.01 Financial Statements and Exhibits | EX-99.1 first quarter 2026 release: GAAP revenue $193.4 million, core revenue $191.3 million, core gross margin 47%, core operating loss ($3.5) million, first outlook for the second quarter and the full year. Furnished, not filed. |
| 15 May 2026 | 0001628280-26-035605 | Item 5.03 Amendments to Articles of Incorporation or Bylaws; Change in Fiscal Year; Item 8.01 Other Events; Item 9.01 Financial Statements and Exhibits | Item 5.03 reports the amended and restated certificate of incorporation and bylaws effective on closing, filed as EX-3.1 and EX-3.2. Item 8.01 reports the IPO of 34,500,000 Class A shares at $185.00, including the underwriters' option for 4,500,000 shares exercised in full, for gross proceeds of $6.4 billion. |
No Form 8-K reports a director or officer change under Item 5.02, a material definitive agreement under Item 1.01, or an auditor change under Item 4.01. The change of independent accountant was disclosed in the registration statement instead.
Guidance, and where it was searched for
Numeric guidance was searched for in Part I Item 2 of the 10-Q for the quarter ended 30 June 2026 (0001628280-26-056357), in Part I Item 2 of the 10-Q for the quarter ended 31 March 2026 (0001628280-26-044981), in all three Forms 8-K and their exhibits (0001628280-26-056186, 0001628280-26-044941 and 0001628280-26-035605), and in the MD&A and the Key Factors Affecting Our Performance section of the 424B4 prospectus (0001628280-26-035214). Every numeric figure sits in the two Exhibit 99.1 press releases. The two 10-Q MD&A sections and the prospectus carry directional expectations and no numeric outlook; the closing 8-K of 15 May 2026 carries none. Each figure below was current only on the date it was issued.

Table 3.2 The complete guidance record, as issued
| Issued | Form and accession | Period | Metric | Figure | Standing? |
|---|---|---|---|---|---|
| 23 Jun 2026 | 8-K EX-99.1, 0001628280-26-044941 | Q2 2026 | Core revenue | approximately $194.0 million, up 88% on the year | Superseded by the reported result of $209.9 million |
| 23 Jun 2026 | 8-K EX-99.1, 0001628280-26-044941 | Q2 2026 | Core gross margin | 36% to 38% | Superseded by the reported 41% |
| 23 Jun 2026 | 8-K EX-99.1, 0001628280-26-044941 | Q2 2026 | Core operating margin | (30)% to (32)% | Superseded by the reported (16)% |
| 23 Jun 2026 | 8-K EX-99.1, 0001628280-26-044941 | FY 2026 | Core revenue, gross margin, operating margin | $855.0m to $865.0m; 38% to 41%; (28)% to (32)% | Raised on 12 August 2026 |
| 12 Aug 2026 | 8-K EX-99.1, 0001628280-26-056186 | Q3 2026 | Core revenue | approximately $214 million to $216 million | Standing |
| 12 Aug 2026 | 8-K EX-99.1, 0001628280-26-056186 | Q3 2026 | Core gross margin | 38% to 40% | Standing |
| 12 Aug 2026 | 8-K EX-99.1, 0001628280-26-056186 | Q3 2026 | Core operating margin | (25)% to (23)% | Standing |
| 12 Aug 2026 | 8-K EX-99.1, 0001628280-26-056186 | FY 2026 | Core revenue, gross margin, operating margin | $880m to $890m; 41% to 43%; (19)% to (17)% | Standing |
| 12 Aug 2026 | 8-K EX-99.1, 0001628280-26-056186 | FY 2027 | Revenue | The Chief Financial Officer states a plan to more than triple revenue in 2027 | Standing, with no range attached |
Core revenue, core gross margin and core operating margin are the company's non GAAP measures. They exclude pass through data centre revenue and the related costs, the amortisation of customer warrant assets, stock based compensation expense, and employer payroll tax on stock based compensation arising from the IPO. On a GAAP basis the same quarter carried a gross margin of 14.2% and an operating margin of (265.0)%.

Bob Komin, Chief Financial Officer of Cerebras, stated in the 12 August 2026 release: "Our quarterly results exceeded our guidance across all core business metrics." The same release carries his statement that "We have made rapid progress in key areas required to deliver exceptional growth against our remaining performance obligations of $25.4 billion, and plan to more than triple revenue in 2027." Remaining performance obligations were $24.6 billion at 31 December 2025 (424B4, Note 5).
Call transcripts are not EDGAR documents and none is cited here.
What the MD&A itself commits to
One directional statement changed sign between quarters. The prospectus dated 13 May 2026 and the 10-Q filed 23 June 2026 both state: "We expect overall gross profit will decrease in absolute dollars in the near term, driven by start-up costs related to expediting the availability of cloud capacity to fulfill the significant increase in near-term demand." The 10-Q of 12 August 2026 states instead: "We expect overall gross profit will increase in absolute dollars in the near term, primarily due to higher gross profit from Cloud and other services as revenue increases in connection with the continued ramp-up of dedicated cloud capacity deployments." The gross margin expectation did not change with it. All three filings state that gross margin is expected to be significantly lower in the near term than in recent prior periods and to fluctuate from period to period, attributing that to the amortisation of customer warrant assets, pass through data centre amounts recorded in both revenue and cost of revenue, and start up costs on new cloud capacity.
The MD&A carries one quantified forward estimate. The prospectus put the cumulative stock based compensation expense expected in the June 2026 quarter for restricted stock units at $370.9 million; the 10-Q filed 23 June 2026 put the same estimate at $366.8 million. The 10-Q for the June quarter reports total stock based compensation expense of $377.0 million for the quarter, and $273.6 million recognised in the six months for restricted stock units on satisfaction of both the service based and the liquidity based vesting conditions.
On funding, the June quarter 10-Q states: "We believe that our current cash, cash equivalents, restricted cash, and marketable securities will be sufficient to fund our operations for at least the next 12 months from the date of this Quarterly Report on Form 10-Q." Principal sources of liquidity at 30 June 2026 were cash, cash equivalents and restricted cash of $7.4 billion and marketable securities of $1.2 billion, against a Working Capital Loan balance of $918.2 million and an accumulated deficit of $1.4 billion. The same section reports fixed operating lease payment obligations of $690.3 million at 30 June 2026, and adds that leases signed in the third quarter of 2026 carry aggregate undiscounted future minimum payments of approximately $2.3 billion over their terms.
The trends management names for itself
Table 3.3 Trends management identifies, with the filing and the date
| Trend | Filing and section | Filing date |
|---|---|---|
| Revenue depends substantially on cloud capacity sold to OpenAI, G42 and MBZUAI | 424B4, Key Factors Affecting Our Performance, 0001628280-26-035214 | 14 May 2026 |
| Cloud and other services revenue is expected to comprise a significantly higher percentage of total revenue in future periods | 10-Q, Components of Results of Operations, 0001628280-26-056357 | 12 Aug 2026 |
| Amortisation of customer warrant assets is a noncash reduction in revenue that negatively affects sequential revenue growth in the near term | 10-Q, Components of Results of Operations, 0001628280-26-056357 | 12 Aug 2026 |
| Pass through data centre revenue is expected to increase significantly in the near term as initial Committed Capacity is deployed in the Cerebras cloud | 10-Q, Components of Results of Operations, 0001628280-26-056357 | 12 Aug 2026 |
| Growth in cloud solutions depends on procuring long term data centre leases for power and space, including time based milestones under the OpenAI master relationship agreement | 424B4, Key Factors Affecting Our Performance, 0001628280-26-035214 | 14 May 2026 |
| The company has no general long term capacity commitments with suppliers and sources components from sole or single source suppliers | 424B4, Key Factors Affecting Our Performance, 0001628280-26-035214 | 14 May 2026 |
| Research and development, sales and marketing, and general and administrative expenses are each expected to increase in absolute dollar terms | 10-Q, Components of Results of Operations, 0001628280-26-056357 | 12 Aug 2026 |
Each statement in Table 3.3 was current when its filing was made and carries the forward looking statements qualification set out in that filing.
4 Sector & Competitor Analysis
Cerebras reported revenue of $180.1m for the three months ended 30 June 2026, gross margin of 14.2% and an operating loss of $(477.2)m, against $96.22bn of revenue and a 66.2% operating margin at NVIDIA in the quarter ended 26 July 2026. Cerebras carries $7.92bn of cash and current marketable debt securities against $918m of debt, and its total debt is 0.10 times stockholders' equity, against 0.15 at NVIDIA, 0.05 at AMD, 0.58 at Intel and 6.98 at CoreWeave.
The comparator set comes from the filing
Cerebras names its competitors in Part II Item 1A of the Form 10-Q for the quarter ended 30 June 2026, accession 0001628280-26-056357:
"With respect to hardware, we compete against semiconductor companies such as NVIDIA Corporation, a dominant market leader, Advanced Micro Devices, Inc., Intel Corporation, as well as AI accelerators developed by hyperscalers and private companies. We also compete against full-service cloud service providers such as Amazon.com, Inc. (AWS), Microsoft Corporation (Azure), Alphabet Inc. (Google Cloud Platform), and Oracle Corporation, as well as AI-optimized specialized clouds such as CoreWeave, Inc. and other neo-clouds. Certain of our competitors are also current or prospective customers."
The set below is every company named there that is listed and had a fiscal quarter ending between 27 June and 26 July 2026 on its Exchange Act record at 4 September 2026. That rule includes NVIDIA, AMD, Intel and CoreWeave and excludes four named companies. Amazon, Microsoft and Alphabet each carry their cloud business inside a much larger group, so a comparison against them measures Cerebras against consolidated revenue that comes mostly from other activities. Oracle's most recent periodic report at the price date is the Form 10-K for the fiscal year ended 31 May 2026, accession 0001193125-26-277521, so no quarter in the June to July 2026 window is on its record.
Table 4.1 Comparator set: fiscal calendars and what makes each comparison imperfect
| Company | Ticker | Fiscal year ends | Last completed fiscal year end | Latest reported period | What makes the comparison imperfect |
|---|---|---|---|---|---|
| Cerebras Systems Inc. | CBRS | 31 December | 31 December 2025 | Q2 2026, to 30 June 2026 | Two Forms 10-Q are the whole Exchange Act record; no Form 10-K exists. |
| NVIDIA Corporation | NVDA | last Sunday in January | 25 January 2026 | Q2 FY2027, to 26 July 2026 | The quarter ends four weeks later than the others, and revenue is 534 times Cerebras's. |
| Advanced Micro Devices, Inc. | AMD | last Saturday in December | 27 December 2025 | Q2 2026, to 27 June 2026 | Client and gaming processors sit alongside data centre products in one reported revenue line. |
| Intel Corporation | INTC | last Saturday in December | 27 December 2025 | Q2 2026, to 27 June 2026 | Operates its own fabrication capacity and a foundry business, so cost of revenue carries fixed manufacturing cost Cerebras does not bear. |
| CoreWeave, Inc. | CRWV | 31 December | 31 December 2025 | Q2 2026, to 30 June 2026 | Buys accelerators rather than designing them, and reports no gross profit subtotal. |
Gross margin below is revenue less cost of revenue as each company presents it. CoreWeave presents no gross profit subtotal and reports technology and infrastructure expense separately from cost of revenue, so its gross margin reads n/a. Total debt is the current plus the noncurrent portion of borrowings, with operating lease liabilities excluded, and equity is stockholders' equity attributable to the parent, which for Intel excludes $15.60bn of noncontrolling interests.
Table 4.2 Cerebras against the four named competitors, most recent reported quarter as filed
| Cerebras | NVIDIA | AMD | Intel | CoreWeave | |
|---|---|---|---|---|---|
| Period end | 30 Jun 2026 | 26 Jul 2026 | 27 Jun 2026 | 27 Jun 2026 | 30 Jun 2026 |
| Revenue ($bn) | 0.180 | 96.221 | 11.536 | 16.128 | 2.575 |
| Revenue growth on the year ago quarter | 74.3% | 105.9% | 50.1% | 25.4% | 112.5% |
| Gross margin | 14.2% | 75.0% | 53.8% | 40.4% | n/a |
| Operating margin | (265.0)% | 66.2% | 17.3% | 11.1% | (1.9)% |
| Return on capital, quarter at an annual rate | (19.0)% | 97.2% | 11.3% | 5.2% | (0.5)% |
| Total debt to equity | 0.10x | 0.15x | 0.05x | 0.58x | 6.98x |
| Market value at 4 September 2026 ($bn) | 49.90 | 5,551.68 | 779.62 | 483.22 | 49.29 |
| Market value to quarterly revenue at an annual rate | 69.3x | 14.4x | 16.9x | 7.5x | 4.8x |
Return on capital is the quarter's operating income taken at an annual rate over total debt plus equity at the same balance sheet date, struck identically for all five and covering three months of trading. Sources: Forms 10-Q, accessions 0001628280-26-056357, 0001045810-26-000075, 0000002488-26-000123, 0000050863-26-000157 and 0001769628-26-000366.

Cerebras's market value is $49.90bn and CoreWeave's is $49.29bn, on quarterly revenue of $180m and $2.58bn.
Where Cerebras sits in the sector
Cloud and other services produced 70.0% of Cerebras's June 2026 quarterly revenue, $126.0m of $180.1m, and hardware produced 30.0%. CoreWeave, which sells compute capacity, sits in the set alongside the three chip designers for that reason.
The same 10-Q names Amazon both as a competitor and as the counterparty to the AWS Commercial Agreement entered in June 2026, the position the risk factor describes when it states that certain competitors are also current or prospective customers. That agreement covers an initial multiyear lease of Cerebras systems in AWS data centres, and the company states that if AWS purchases as contemplated, "AWS may represent a material percentage of our revenue at such time."
No market share figure is stated in this chapter. The competition and market opportunity risk factors of the same 10-Q state no share of any market for the company, and the market opportunity risk factor states:
"Market opportunity estimates and growth forecasts, including third-party market research and internal estimates, are subject to significant uncertainty and are based on assumptions and estimates which may not prove to be accurate."
The five companies together show $126.6bn of revenue in their most recent reported quarters, 76.0% of it at NVIDIA. Those quarters end on four different dates, so the total covers four period ends between 27 June and 26 July 2026.
Comparisons that are not available
A company with two quarters of public record cannot be measured on multiyear tests. These comparisons are absent from this chapter rather than estimated.
- Multiyear revenue or margin growth for Cerebras on the Exchange Act record. The record is two Forms 10-Q, so one year on year quarterly pair and one half year pair exist, and the two audited years, to 31 December 2024 and 31 December 2025, sit only in the registration statement.
- Return on capital and leverage for Cerebras at 31 December 2025 on the definition used in Table 4.2. Stockholders' equity was $(578.7)m at that date because $1.93bn of redeemable convertible preferred stock sat outside permanent equity, so the ratio has no peer meaning.
- Multiyear total shareholder return, a full 52 week price range and any multiyear price statistic. The shares first traded on 14 May 2026.
- A cash conversion or free cash flow comparison across a cycle, and any comparison of annual guidance against outcome, both of which need more than one reported year.
The price basis for this document
Table 4.3 As of price block, close of Friday 4 September 2026
| Company | Ticker | Close, US$ | Shares outstanding | Cover page filing | Share count as of | Market value, US$bn |
|---|---|---|---|---|---|---|
| Cerebras Systems Inc. | CBRS | 210.05 | 237,564,041, all three classes | Form 10-Q, 0001628280-26-056357 | 5 August 2026 | 49.90 |
| NVIDIA Corporation | NVDA | 230.36 | 24,100,000,000 | Form 10-Q, 0001045810-26-000075 | 21 August 2026 | 5,551.68 |
| Advanced Micro Devices, Inc. | AMD | 477.57 | 1,632,475,042 | Form 10-Q, 0000002488-26-000123 | 29 July 2026 | 779.62 |
| Intel Corporation | INTC | 95.80 | 5,044,000,000 | Form 10-Q, 0000050863-26-000157 | 17 July 2026 | 483.22 |
| CoreWeave, Inc. | CRWV | 89.36 | 551,536,602, Class A and Class B | Form 10-Q, 0001769628-26-000366 | 31 July 2026 | 49.29 |
US markets were shut on Monday 7 September 2026, so 4 September is the last regular session before this document's date. Each close is the regular session close of that date. The NVIDIA and Intel cover pages round their share counts to the nearest hundred million and the nearest million respectively, and the market values inherit that rounding.
The Cerebras market value uses all 237,564,041 shares of all three classes, at the Class A close. Only Class A is listed. The Amended and Restated Certificate of Incorporation, filed as EX-3.1 to the Form 8-K with accession 0001628280-26-035605, ranks the three classes equally as to dividends, liquidation and distributions, converts Class B into Class A one for one at the holder's option and automatically on a transfer outside its permitted transferee carve outs, and converts Class N into Class A one for one on a transfer unless the transfer is to an Affiliate or the transferee elects to receive Class N. Every unlisted share therefore carries the same claim on cash flows as a listed one and can become one, so the Class A price is the reference price for all 237,564,041 shares. Counting only the listed Class A would give $23.58bn on 112,247,109 shares, 47.2% of the total.
5 Insider Activity
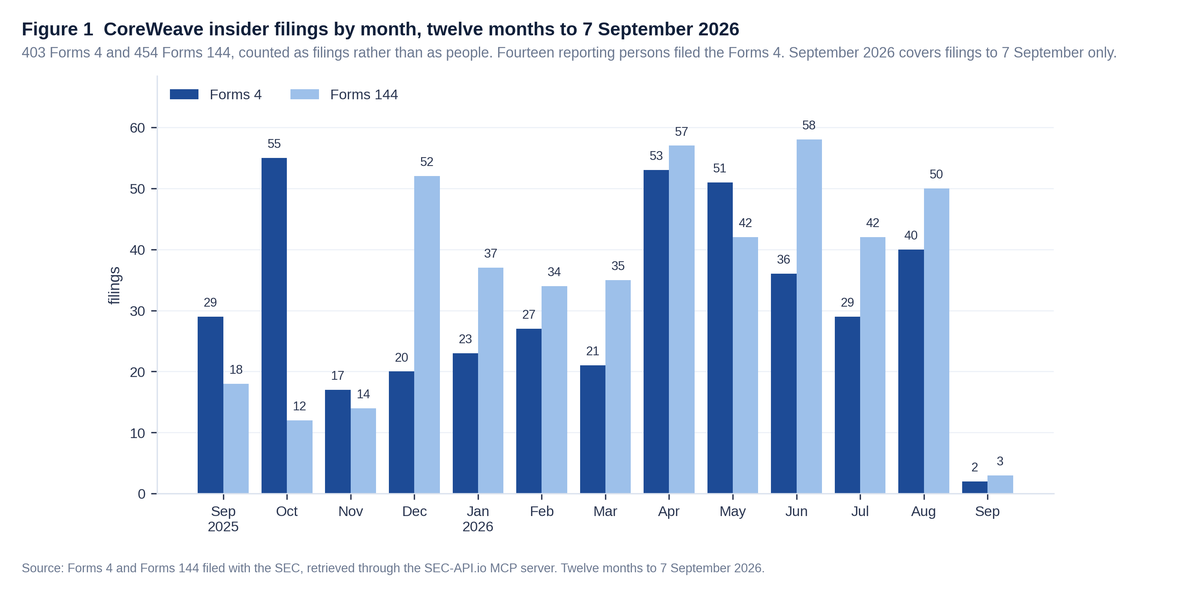
Cerebras Systems Inc. listed on 14 May 2026, so the Section 16 record runs about four months. Through 8 September 2026 it holds 13 Forms 3, 46 Forms 4 and 11 Forms 144 with Cerebras as issuer or subject, and no Form 5. These are counts of filings. 13 reporting persons account for the 46 Forms 4, and 5 account for the 11 Forms 144.
Across the 46 Forms 4 there are 268 code S sale lines and no code P purchase line. Code S is an open market or private sale of securities; code P is an open market or private purchase. Code S disposals total 1,291,278 shares at prices from $161.46 to $250.302 as filed.
Table 5.1 Code S sale lines on Forms 4, aggregated to the filing that reports each
| Sale date(s) | Insider | Role as coded | Shares | Price range as filed | Held after | Accession |
|---|---|---|---|---|---|---|
| 25 Jun 2026 | Sean Lie | Officer (CTO) | 10,033 | $165.21 to $186.51 | 0 | 0001628280-26-046031 |
| 25 Jun 2026 | Andrew D. Feldman | Director, Officer (CEO, President) | 17,990 | $169.07 to $184.73 | 0 | 0001628280-26-046034 |
| 25 Jun 2026 | Yagnesh Patel | Officer (CAO) | 6,079 | $162.45 to $189.36 | 4,000 | 0001628280-26-046035 |
| 25 to 26 Jun 2026 | Yagnesh Patel | Officer (CAO) | 4,000 | $161.61 to $189.36 | 0 | 0001628280-26-046038 |
| 25 Jun 2026 | Dhiraj Mallick | Officer (COO) | 36,131 | $162.24 to $185.21 | 33,314 | 0001628280-26-046040 |
| 25 to 26 Jun 2026 | Dhiraj Mallick | Officer (COO) | 33,314 | $161.46 to $187.90 | 0 | 0001628280-26-046042 |
| 30 Jun 2026 | Dhiraj Mallick | Officer (COO) | 10,000 | $206.51 | 0 | 0001628280-26-046550 |
| 14 Aug 2026 | Steven Vassallo | Director | 50,000 | $216.38 to $219.97 | 49,599 | 0001567929-26-000003 |
| 17 Aug 2026 | Eric Vishria | Director | 68,268 | $224.1976 to $250.302 | 31,383 | 0001104659-26-098846 |
| 18 Aug 2026 | Andrew D. Feldman | Director, Officer (CEO, President) | 26,644 | $214.85 to $240.01 | 66,853 | 0001628280-26-058119 |
| 18 Aug 2026 | Sean Lie | Officer (CTO) | 21,257 | $214.85 to $240.01 | 595,449 | 0001628280-26-058312 |
| 18 Aug 2026 | Dhiraj Mallick | Officer (COO) | 38,889 | $214.85 to $240.01 | 120,000 | 0001628280-26-058313 |
| 18 Aug 2026 | Yagnesh Patel | Officer (CAO) | 4,574 | $215.67 to $240.01 | 16,676 | 0001628280-26-058314 |
| 20 to 21 Aug 2026 | Sean Lie | Officer (CTO) | 726,540 | $203.78 to $212.64 | 368,926 | 0001628280-26-058506 |
| 21 Aug 2026 | Andrew D. Feldman | Director, Officer (CEO, President) | 237,559 | $196.20 to $210.21 | 16,853 | 0001628280-26-058961 |
| Total | 1,291,278 |
Every row is code S. "Held after" is the shares owned following the last sale line on that Form 4: direct holdings, except Steven Vassallo's and Eric Vishria's, which are indirect. Where a filing reports a weighted average price, its footnote gives the underlying range.

Table 5.2 Transaction codes in the 46 Forms 4, with the meaning of each
| Code | What it means in plain words | Lines |
|---|---|---|
| S | Open market or private sale of securities | 268 |
| J | Other acquisition or disposition, explained in a footnote | 125 |
| C | Conversion of a derivative security into the underlying stock | 119 |
| M | Exercise of a derivative security, here a stock option | 12 |
| F | Shares withheld by the issuer to pay tax on a vesting award | 4 |
| G | Gift of securities | 2 |
| A | Grant or award of securities from the issuer | 1 |
| P | Open market or private purchase of securities | 0 |
Codes J and C carry the listing mechanics. At the offering each share of Class A common stock outstanding before the offering and each share of redeemable convertible preferred stock became one share of Class B common stock, reported as exempt under Rule 16b-7. Later code J lines are pro rata in kind distributions by the venture funds to their partners, footnoted as "not a purchase or sale of securities" and made "without additional consideration". Later code C lines are voluntary one for one conversions of Class B into Class A, the step that makes a share saleable on Nasdaq.
Code M covers 950,650 option exercises, all in August 2026 at exercise prices of $2.40, $2.72, $5.02, $5.48 and $7.89: Sean Lie 696,798 shares on 20 August and 16,293 on 21 August, Andrew D. Feldman 237,559 on 21 August. Code G covers two gifts, 213,074 shares by Sean Lie on 20 August 2026 and 50,000 by Andrew D. Feldman on 21 August 2026, each footnoted as a transfer "to a donor-advised fund sponsored by a charitable organization under Section 501(c)(3) of the Internal Revenue Code". The single code A line grants 15,000 restricted stock units to Yagnesh Patel on 26 June 2026 at a stated price of $0.00.
Tax withholding on vesting carries code F
Every withholding line in this record is code F, and each carries the same footnote verbatim: "Represents shares withheld by the Issuer to satisfy tax liability on vesting of restricted stock units. Not a market sale." There are four such lines, all dated 13 May 2026 and all priced at the $185.00 IPO price: Andrew D. Feldman 107,076 shares, Sean Lie 96,127, Yagnesh Patel 19,083 and Dhiraj Mallick 491,091, 713,377 shares in total. All 268 code S lines were read; none of them carries a withholding footnote. Reading the code F lines as elected selling would overstate the sale total by 713,377 shares.
The Rule 10b5-1 checkbox is ticked on 6 of the 46 Forms 4
The checkbox on the Form 4 cover marks a transaction made under a Rule 10b5-1 trading arrangement. It is ticked on six filings: two by Eric Vishria, two by Benchmark Capital Management Co. VIII, L.L.C. and two by Benchmark AI Infrastructure Management Co., L.L.C. One of those six carries a sale line, Eric Vishria's 68,268 shares on 17 August 2026, under a plan the footnote dates to 18 May 2026.
Two further filings name a plan in a footnote with the box left unticked: Sean Lie's 726,540 shares sold on 20 and 21 August and Andrew D. Feldman's 237,559 shares sold on 21 August, both under plans the footnotes date to 20 May 2026. The checkbox alone attributes 68,268 shares to a plan; the footnotes take that to 1,032,367 shares, leaving 258,911 shares on filings that state no plan.
The 13 Forms 3 all carry 13 May 2026
All 13 Forms 3 carry period of report 13 May 2026 and were filed on 13 May 2026, the date the Form S-1 was declared effective (Form EFFECT accession 9999999995-26-001616). They are the initial statements of beneficial ownership that Section 16 requires on registration, filed by ten individuals and three fund entities. Five individuals are coded as officers and six as directors, Andrew D. Feldman being coded as both. The three entities are coded as 10% owners: Benchmark Capital Management Co. VIII, L.L.C., Benchmark AI Infrastructure Management Co., L.L.C. and Foundation Capital Management Co. VIII, L.L.C. None reports a transaction. Twelve report holdings; Eric Vishria's, accession 0001628280-26-034704, carries neither a Table I nor a Table II entry.
Table 5.3 Forms 144, notices of proposed sale
| Filed | Account | Relationship as filed | Units | Aggregate market value, US$m | Source of shares | Plan date |
|---|---|---|---|---|---|---|
| 14 Aug 2026 | Vassallo Family Revocable Trust dated 7/15/02 | Director | 50,000 | 11.551 | Private Placement | n/a |
| 17 Aug 2026 | Eric Vishria | 10% Stockholder | 68,268 | 15.702 | Pro rata distribution for no consideration | 18 May 2026 |
| 18 Aug 2026 | Dhiraj Mallick | Officer | 38,889 | 9.799 | Vesting of restricted stock units | n/a |
| 18 Aug 2026 | Sean Lie | Officer | 21,257 | 5.356 | Vesting of restricted stock units | n/a |
| 18 Aug 2026 | Andrew D. Feldman | Officer, Director | 26,644 | 6.714 | Vesting of restricted stock units | n/a |
| 20 Aug 2026 | Sean Lie | Officer | 710,247 | 153.193 | Performance Stock Units | 20 May 2026 |
| 21 Aug 2026 | Andrew Feldman | Director | 237,559 | 49.852 | Exercise of Stock Options | 20 May 2026 |
| 21 Aug 2026 | Sean Lie | Officer | 16,293 | 3.419 | Exercise of Stock Options | 20 May 2026 |
| 4 Sep 2026 | Sean Lie | Officer | 53,460 | 10.181 | Performance Stock Units and Exercise of Stock Options | 20 May 2026 |
| 4 Sep 2026 | Andrew Feldman | Director | 37,441 | 7.130 | Exercise of Stock Options | 20 May 2026 |
| 4 Sep 2026 | Vassallo Family Revocable Trust dated 7/15/02 | Director | 50,000 | 9.522 | Private Placement | n/a |
| Total | 1,310,058 | 282.419 |
Aggregate market value is as filed to the nearest dollar, shown here in millions. A Form 144 gives notice of an intended sale; the completed sale is reported afterwards on a Form 4. Eight of these eleven notices have a matching code S line on a Form 4 for the same person and the same date, at the same unit count. The three filed on 4 September 2026, covering 140,901 shares, have no matching Form 4 in the record as of 8 September 2026; a Form 4 for a sale made on 4 September falls due on 9 September.
Section 16 and Rule 144 data retrieved through the SEC-API.io MCP insider trading endpoint on issuer central index key 2021728.
6 Risk Factors
Cerebras Systems Inc. has filed no Form 10-K, so there is no annual Item 1A on the Exchange Act record and no prior year risk factor set to compare against. The comparison below runs the RISK FACTORS section of the final IPO prospectus on Form 424B4, filed 14 May 2026, accession 0001628280-26-035214, against Part II Item 1A of both Forms 10-Q: the quarter ended 30 June 2026, accession 0001628280-26-056357, and the quarter ended 31 March 2026, accession 0001628280-26-044981. The same set appears in the S-1 family behind it, accessions 0001628280-26-025762, 0001628280-26-029503 and 0001628280-26-033143.
The prospectus carries 70 risk factors under six group headings. Both quarterlies carry 67 under the same six groups, one of which is renamed. Nothing has been added to the set since the prospectus.

What moved between the prospectus and the quarterlies
Three risk factors were dropped when the set moved from the prospectus into Item 1A, all of them tied to the offering itself. As filed in the 424B4, they read "No public market for our common stock currently exists and an active liquid market may not develop or be sustained following this offering.", "If you purchase shares of our Class A common stock in this offering, you will incur immediate and substantial dilution." and "We have broad discretion in the use of the net proceeds from this offering and may not use them effectively." All three are absent from both quarterlies.
Six headings were reworded and none was added. The three that changed most are given in full below Table 6.1.
Table 6.1 Risk factor headings reworded after the 424B4 prospectus
| Reference | Group, short label as in Figure 6.1 | New wording first appears in | What changed in the heading |
|---|---|---|---|
| Market opportunity estimates | Business and industry | 10-Q to 31 March 2026 | The words "included in this prospectus" removed from the estimates and forecasts. |
| Multi class voting control | Ownership of Class A common stock | 10-Q to 31 March 2026 | Holders described as those who held securities "prior to the IPO" rather than "prior to this offering". |
| Share sales into the public market | Ownership of Class A common stock | 10-Q to 31 March 2026 | The heading covers sales rather than future sales. |
| Exclusive forum | Ownership of Class A common stock | 10-Q to 31 March 2026 | The charter and bylaws "provide" for the forum rather than "will provide". |
| Supply chain fluctuations | Business and industry | 10-Q to 30 June 2026 | Fluctuations "in" supply and demand rather than "of" supply and demand. |
| Public company costs | Ownership of Class A common stock | 10-Q to 30 June 2026 | Costs stated as incurred rather than expected, and the body rewritten. |
The share sales heading reads in the prospectus, "Future sales of our Class A common stock in the public market could cause the price of our common stock to decline." and in both quarterlies "Sales of our Class A common stock in the public market could cause the price of our common stock to decline."
The public company cost heading carries the one substantive rewrite at the June quarter. The prospectus and the March quarterly read "We will incur increased costs as a result of operating as a public company, and our management will be required to devote substantial time to support compliance with our public company responsibilities and corporate governance practices." The June quarterly reads "We incur significant costs as a result of operating as a public company, and our management is required to devote substantial time to support compliance with our public company responsibilities and corporate governance practices."
The supply chain heading moved from "Any significant fluctuations of supply and demand or disruption to our supply chain may harm our ability to manufacture and deliver our products to our customers." to "Any significant fluctuations in supply and demand or disruption to our supply chain may harm our ability to manufacture and deliver our products to our customers."
Of the 67 risk factors common to all three filings, 23 have body text that differs between the prospectus and the March quarterly, and 17 differ between the March and June quarterlies. Most of those differences update a period, a figure or a reference to the offering.
The figures the risk factors themselves carry
Table 6.2 Numbers printed inside the risk factors, by filing
| Number as stated in the risk factors | 424B4, 14 May 2026 | 10-Q to 31 March 2026 | 10-Q to 30 June 2026 |
|---|---|---|---|
| Revenue share, MBZUAI | 62.0% of total revenue, year to 31 Dec 2025 | 63% (Q1 2026), 24% (Q1 2025) | 34% (Q2 2026), 70% (Q2 2025); 49% and 47% for the six months |
| Revenue share, G42 | 24.0% (FY2025), 85.0% (FY2024) | 11% (Q1 2026), 64% (Q1 2025) | 9% (Q2 2026), 18% (Q2 2025); 10% and 41% for the six months |
| Accounts receivable, latest balance date | one customer (MBZUAI) 77.9% at 31 Dec 2025 | three customers 86% at 31 Mar 2026 | two customers 76% at 30 Jun 2026 |
| Accounts receivable, prior balance date | one customer (G42) 91.0% at 31 Dec 2024 | one customer 78% at 31 Dec 2025 | one customer 78% at 31 Dec 2025 |
| OpenAI Working Capital Loan | $1.0bn, 6% per annum, maturity no later than 31 Dec 2032, repaid in equal amortised instalments over three years from delivery of the final tranche of the initial 250 MW | same terms | same terms |
| Headcount in the growth risk factor | 708 people at 31 Dec 2025 | 784 people at 31 Mar 2026 | no headcount figure |
| Shares releasable from lock up | up to approximately 171.1 million during the lock up period, of which up to approximately 15.0 million held by Section 16 directors and officers | same figures | same figures |
| Vested options outstanding | approximately 21.5 million at 30 Apr 2026 | same figure | same figure |
The June quarterly states in its concentration risk factor: "Further, as of June 30, 2026, two customers accounted for 76% of our accounts receivable balance. As of December 31, 2025, one customer accounted for 78% of our accounts receivable balance." G42 and MBZUAI are stated to be related parties with respect to each other under Accounting Standards Codification 850. The heading names OpenAI, G42, MBZUAI and AWS. The same risk factor states that the AWS Commercial Agreement entered in June 2026 carries pricing commitments, exclusivity and minimum manufacturing capacity guarantees, and that "if AWS purchases additional products and services, as contemplated by our minimum capacity commitments in the AWS Commercial Agreement, AWS may represent a material percentage of our revenue at such time."
The lock up and vested option figures hold constant across all three filings. Each of the prospectus, the March quarterly and the June quarterly states that "we estimate an aggregate of up to approximately 171.1 million shares will be released from lock-up agreements or market standoff provisions during the Lock-up Period, including up to approximately 15.0 million shares held by our directors and officers subject to reporting under Section 16 of the Exchange Act", and each states that "As of April 30, 2026, there were an aggregate of approximately 21.5 million vested stock options outstanding." The prospectus defines that period as ending on the earlier of 6:00 a.m. Eastern Time on the second trading day following the release of earnings for the quarter ending 30 September 2026 and 180 days after the date of the prospectus.
The supplier dependency is stated by name. Item 1A states "We depend on one third-party foundry, Taiwan Semiconductor Manufacturing Company Limited (“TSMC”), to manufacture our proprietary processor using its fabrication equipment and techniques", that Cerebras does not generally have long term capacity commitments with its suppliers, including those that are sole or single sourced, and that "Substantially all of our manufacturing services and component orders are currently transacted on a purchase order basis". No percentage of total purchases appears in the risk factors of the prospectus or of either quarterly; that figure sits in the concentration note to the financial statements.
The growth and loss risk factors restate revenue, result and accumulated deficit figures that also appear in the financial statements, and update them each quarter.
What Item 1A says about the material weaknesses
The material weaknesses in internal control over financial reporting appear as a named risk factor in the "Risks Related to Financial and Accounting Matters" group of all three filings, alongside a change of accountant disclosure. The heading holds constant; the body is updated each quarter.
The period the weaknesses attach to moves each time. The prospectus states "In connection with the preparation of our financial statements, we identified certain material weaknesses in our internal control over financial reporting, including most recently for the years ended December 31, 2025 and 2024." The March quarterly reads "including most recently for the three months ended March 31, 2026, and 2025." The June quarterly reads "In connection with the preparation of our financial statements, we identified certain material weaknesses in our internal control over financial reporting that existed as of June 30, 2026." The description is identical in all three, and the June quarterly states that they "relate to (i) inadequate or missing resources who possess an appropriate level of expertise to timely review account reconciliations and identify, select, and apply U.S. generally accepted accounting principles (“GAAP”) pertaining to several financial statement areas, including revenue recognition, inventory management and costing, data center assets accounting, and equity administration and (ii) the failure to maintain adequate IT general controls, including ineffective segregation of duties."
On remediation, the June quarterly states "In response to the identified material weaknesses, we have begun adding additional resources, formalizing processes, and implementing new controls", that additional accounting and finance personnel have been hired and continue to be hired, and that "The material weaknesses will not be considered remediated until management designs and implements effective controls that operate for a sufficient period of time and management has concluded, through testing, that these controls are effective." No filing states that any of them has been remediated. The wording on monitoring changed from management will monitor the remediation plans, in the prospectus, to management continues to monitor them, in both quarterlies.
The separate disclosure controls risk factor states "We have identified material weaknesses in our internal control over financial reporting in the past, most recently for the period ended June 30, 2026, and cannot assure you that there will not be material weaknesses or significant deficiencies in our internal controls in the future." It also fixes when management's own report first becomes due: "As a public company, we are required to provide an annual management report on the effectiveness of our internal control over financial reporting commencing with our annual report on Form 10-K for the year ending December 31, 2027." As an emerging growth company Cerebras states it is not yet required to comply with the SEC rules implementing Section 404 of the Sarbanes-Oxley Act.
7 Stock Price, Scenarios & Sensitivity
Cerebras has a listed price record of 79 regular sessions. The Class A common stock began trading on 14 May 2026 and the report's as of date is the close of Friday 4 September 2026, so the whole history runs to three and a half months. That is too short to read a trend from, too short to hold a full reporting cycle, and it covers only two Forms 10-Q. Every forward number in this chapter is an assumption, labelled as one below and listed as a figure so the case can be rebuilt.
The as of price block for this document is fixed once, in chapter 4, and is not restated here. Figure 7.1 plots the price history to the same as of date.

The dashed lines mark the filing dates of the two Forms 10-Q. No annual report exists, so there has never been a Form 10-K release date to mark.
The base the scenarios start from
There is no Form 10-K, no multiyear seasonal pattern, and only two quarters of Exchange Act reporting to test a forecast against. Revenue reached $509.991m in FY2025 against $290.252m in FY2024, growth of 76%, and $373.516m in the six months to 30 June 2026 against $202.834m a year earlier, growth of 84% (Form 424B4, accession 0001628280-26-035214; Form 10-Q, accession 0001628280-26-056357). Gross margin was 14% in the June 2026 quarter against 31% a year earlier, and 30% for the half year against 36%. Management attributes the quarterly fall to amortisation of customer warrant assets recorded as a reduction of revenue, $44.3m in the quarter, and to stock based compensation and related payroll tax arising on the listing.
The scenarios are anchored on one filed number. The Form 10-Q for the quarter ended 30 June 2026 states that revenue allocated to unsatisfied or partially unsatisfied performance obligations was $25.4 billion at 30 June 2026, that a significant amount of the balance is attributable to the master relationship agreement with OpenAI, and that the company expects to recognise approximately 22% of it over the initial 24 months ending 30 June 2028, 43% between months 25 and 48, and the remaining balance thereafter.
Assumptions, stated as numbers
Each item below is an assumption made for this chapter. No filing states any of them.
- Assumption R1. Each disclosed tranche of the $25.4bn obligation is recognised evenly inside its stated window. That gives $232.8m a month from July 2026 to June 2028 and $455.1m a month from July 2028. The filing gives percentages and windows and no monthly profile.
- Assumption R2. Revenue equals the scheduled release multiplied by a delivery factor that differs by case. The filed first half of 2026 is never scaled.
- Assumption O1. FY2026 operating expense is the filed first half of $604.005m plus a second half of $330.405m, the first half excluding the $273.6m of restricted stock unit expense recognised once at the listing. Operating expense then grows at a fixed rate a year.
- Assumption S1. The share count starts at 237,564,041, the total of all three classes on the 5 August 2026 cover page.
- Assumption S2. A stated share of the 76.011m potentially dilutive securities outstanding at 30 June 2026, plus the 10,033,508 Class N warrants issued in July 2026, settles into shares evenly over the three years.
- Assumption S3. New grants add a stated percentage of the opening count each year.
- Assumption N1. Nonoperating income and expense and income tax net to zero, so net income equals operating income.
Class B conversion changes votes; the share count is unchanged. The Amended and Restated Certificate of Incorporation (EX-3.1 to the Form 8-K with accession 0001628280-26-035605) makes Class B convertible into Class A one for one, at the holder's option and automatically on a transfer outside the permitted transferee carve outs. Between the two 10-Q cover dates Class A rose by 20,116,921 shares while Class B fell by 19,118,955. Conversion moves the twenty to one voting ratio, and the share count in these scenarios moves only through warrants, options, restricted stock units and new grants.
Table 7.1 Three year scenario inputs and outcomes. Every input is an assumption.
| Worst case | Base case | Best case | |
|---|---|---|---|
| Delivery against the disclosed obligation schedule | 45% | 100% | 115% |
| Gross margin, FY2026 / FY2027 / FY2028 | 22% / 21% / 20% | 26% / 30% / 34% | 30% / 37% / 42% |
| Operating expense growth a year | 50% | 45% | 32% |
| Potentially dilutive pool settled by FY2028 | 55% | 100% | 100% |
| New equity grants a year | 2% | 3% | 4% |
| Largest customer, share of FY2028 revenue | 72% | 55% | 40% |
| Revenue, FY2026 (US$bn) | 1.002 | 1.771 | 1.980 |
| Revenue, FY2028 (US$bn) | 1.857 | 4.128 | 4.747 |
| Revenue growth a year, FY2025 to FY2028 | 54% | 101% | 110% |
| Gross profit, FY2028 (US$bn) | 0.371 | 1.403 | 1.994 |
| Operating expense, FY2028 (US$bn) | 2.102 | 1.965 | 1.628 |
| Operating income (loss), FY2028 (US$bn) | (1.731) | (0.561) | 0.365 |
| Share count, FY2028 (m) | 300.4 | 348.2 | 356.8 |
| Net income (loss) per share, FY2028 (US$) | (5.76) | (1.61) | 1.02 |
The base case is an estimate. It reaches FY2028 revenue of $4.13bn and still records an operating loss of $(561)m, because operating expense compounds at 45% a year from a base of $934m while gross margin reaches 34%. Even the worst case carries revenue growth of 54% a year, because it is built on the contracted obligation the 10-Q discloses. A case in which the master relationship agreement is terminated in whole sits outside this frame.

What drives the best case
Four filed items carry the best case. The master relationship agreement entered in December 2025 commits OpenAI to purchase 750 MW of inference compute, with an option for a further 1.25 GW to a maximum of 2.0 GW, over an initial term of three to four years extendable to five. The commercial agreement with AWS entered in June 2026 covers an initial multiyear lease of Cerebras systems in AWS data centres with options for future procurement, and the company states that AWS may represent a material percentage of its revenue if the contemplated purchases occur. Excluding pass through revenue and costs, warrant amortisation, stock based compensation and the related payroll tax, the company's own core gross profit was $85.217m in the June 2026 quarter against $32.286m a year earlier, and core operating loss narrowed to $(33.613)m from $(43.901)m. And MBZUAI, which the Part II Item 1A risk factor of the same 10-Q names, fell to 34% of revenue in the June quarter from 70% a year earlier as a second customer reached 32% and a third reached 10%.
Sensitivity

Delivery against the disclosed schedule moves FY2028 loss per share across a range of $2.82 on its own, from $(3.83) at 45% of the schedule to $(1.01) at 115%. Gross margin moves it by $2.61 and operating expense growth by $1.36. The two share count assumptions move it by $0.21 and $0.15, and both move it in the same direction: settling fewer potentially dilutive securities spreads the same loss across fewer shares, which widens the loss per share.

The grid turns positive in five of its twenty five cells, every one of them at delivery of 100% or more combined with gross margin of 42% or more; the cell at 100% delivery and 42% margin stays at $(0.66). The FY2028 result is negative in every cell where delivery runs at 70% of schedule or below.
Five filed conditions would move the base case. Delivery timing may change at the customer's request, which the 10-Q names as a reason the recognition periods may vary. OpenAI may terminate part or all of the agreement on a delivery failure or a service level failure, and on termination it may direct the bank to stop complying with the company's instructions on the working capital loan funds, of which $918.2m was outstanding at 30 June 2026. The AWS purchases contemplated in the June 2026 agreement may not occur. Amortisation of customer warrant assets against revenue may continue at the June quarter rate of $44.3m. And operating expense may grow faster than the assumed 45% a year, which at 50% alone takes FY2028 loss per share to $(2.01).
8 Sources
Every accession number this report cites, grouped by form type and ordered by filing date within each group. Filing data was retrieved through the SEC-API.io MCP server. Market prices carry no named provider and sit outside that credit.
Registration statement family, Cerebras Systems Inc., CIK 2021728. No Form 10-K has been filed, so the audited financial statements are carried by the prospectus and the Forms S-1 behind it.
| Accession | Filed | What it is |
|---|---|---|
| 0001628280-26-025762 | 17 Apr 2026 | Form S-1, the first public registration statement, with the exhibit index and the Exhibit 10 material contracts |
| 0001628280-26-029503 | 4 May 2026 | Form S-1/A, first amendment, refiling Exhibit 10.11 |
| 0001628280-26-033143 | 11 May 2026 | Form S-1/A, second amendment, with the 2026 Incentive Award Plan and the 2026 Employee Stock Purchase Plan |
| 9999999995-26-001616 | 14 May 2026 | Form EFFECT, notice that the registration statement was declared effective on 13 May 2026 |
| 0001628280-26-035214 | 14 May 2026 | Form 424B4, final prospectus dated 13 May 2026: the FY2025 statements audited by KPMG LLP, the FY2024 statements audited by BDO USA, P.C., eight unaudited quarters to 31 December 2025, MD&A, the 70 risk factors and the principal stockholders table |
Quarterly reports on Form 10-Q, Cerebras Systems Inc.
| Accession | Filed | What it is |
|---|---|---|
| 0001628280-26-044981 | 23 Jun 2026 | Form 10-Q for the quarter ended 31 March 2026 |
| 0001628280-26-056357 | 12 Aug 2026 | Form 10-Q for the quarter ended 30 June 2026, the most recent reported period |
Current reports on Form 8-K, Cerebras Systems Inc. These three are the whole 8-K record.
| Accession | Filed | What it is |
|---|---|---|
| 0001628280-26-035605 | 15 May 2026 | Items 5.03, 8.01 and 9.01, closing of the offering, with Exhibit 3.1, the amended and restated certificate of incorporation, and Exhibit 3.2, the bylaws |
| 0001628280-26-044941 | 23 Jun 2026 | Items 2.02 and 9.01, first quarter 2026 results, Exhibit 99.1 |
| 0001628280-26-056186 | 12 Aug 2026 | Items 2.02 and 9.01, second quarter 2026 results, Exhibit 99.1 |
Section 16 reports and Forms 144, Cerebras Systems Inc. as issuer. Thirteen Forms 3 were filed on 13 May 2026 and eleven Forms 144 between 14 August and 4 September 2026; the Forms 4 carrying the code S sale lines in Table 5.1 are listed individually.
| Accession | Filed | What it is |
|---|---|---|
| 0001628280-26-034704 | 13 May 2026 | Form 3, Eric Vishria, the one Form 3 carrying neither a Table I nor a Table II entry |
| 0001628280-26-046031 | 29 Jun 2026 | Form 4, Sean Lie |
| 0001628280-26-046034 | 29 Jun 2026 | Form 4, Andrew D. Feldman |
| 0001628280-26-046035 | 29 Jun 2026 | Form 4, Yagnesh Patel |
| 0001628280-26-046038 | 29 Jun 2026 | Form 4, Yagnesh Patel |
| 0001628280-26-046040 | 29 Jun 2026 | Form 4, Dhiraj Mallick |
| 0001628280-26-046042 | 29 Jun 2026 | Form 4, Dhiraj Mallick |
| 0001628280-26-046550 | 1 Jul 2026 | Form 4, Dhiraj Mallick |
| 0001567929-26-000003 | 18 Aug 2026 | Form 4, Steven Vassallo |
| 0001104659-26-098846 | 19 Aug 2026 | Form 4, Eric Vishria, the one sale line with the Rule 10b5-1 checkbox ticked |
| 0001628280-26-058119 | 19 Aug 2026 | Form 4, Andrew D. Feldman |
| 0001628280-26-058312 | 20 Aug 2026 | Form 4, Sean Lie |
| 0001628280-26-058313 | 20 Aug 2026 | Form 4, Dhiraj Mallick |
| 0001628280-26-058314 | 20 Aug 2026 | Form 4, Yagnesh Patel |
| 0001628280-26-058506 | 21 Aug 2026 | Form 4, Sean Lie, with the option exercises and the gift footnote |
| 0001628280-26-058961 | 25 Aug 2026 | Form 4, Andrew D. Feldman, with the option exercises and the gift footnote |
Comparator filings used in chapter 4. Each is the most recent periodic report on that company's record at 4 September 2026.
| Accession | Filed | What it is |
|---|---|---|
| 0001193125-26-277521 | 22 Jun 2026 | Oracle Corporation, Form 10-K for the fiscal year ended 31 May 2026 |
| 0000050863-26-000157 | 23 Jul 2026 | Intel Corporation, Form 10-Q for the quarter ended 27 June 2026 |
| 0000002488-26-000123 | 4 Aug 2026 | Advanced Micro Devices, Inc., Form 10-Q for the quarter ended 27 June 2026 |
| 0001769628-26-000366 | 11 Aug 2026 | CoreWeave, Inc., Form 10-Q for the quarter ended 30 June 2026 |
| 0001045810-26-000075 | 26 Aug 2026 | NVIDIA Corporation, Form 10-Q for the quarter ended 26 July 2026 |
Disclaimer
This report is not financial advice, and it is not an offer, a solicitation or a recommendation to buy, sell or hold any security. It is independent analysis of public filings, prepared for information only. It is not a publication of the Securities and Exchange Commission, and the SEC has neither reviewed nor endorsed it. No investment objective, financial situation or particular need of any reader has been considered.
The filing record behind it is the one set out under the headline and in the Sources appendix, and it is short. Cerebras Systems Inc. listed on 14 May 2026. No annual report on Form 10-K is on the record, and none is due until the year ending 31 December 2026 closes, so there is no Item 1 Business, no Item 1A annual risk factor set, no Item 7 annual MD&A and no Item 9A management report on internal control over financial reporting. The Exchange Act record is two quarterly reports on Form 10-Q, for the quarters ended 31 March 2026 and 30 June 2026, and three current reports on Form 8-K. The audited years, FY2025 audited by KPMG LLP and FY2024 audited by BDO USA, P.C., are carried by the Form 424B4 prospectus and the Forms S-1 behind it, not by an annual report; the prospectus presents no audited FY2023, so no three year or five year audited series exists for this company. No proxy statement of any kind has been filed and no annual meeting has been held, so there are no vote results, no Item 402 compensation tables, no audit fee disclosure and no post listing beneficial ownership table. The most recent audited period is the year to 31 December 2025 and the most recent reported period is the quarter to 30 June 2026; nothing later than the Form 10-Q and the Form 8-K filed on 12 August 2026 has been reported by the company.
Figures described as filed are reproduced from those documents. Everything else, including every growth rate, margin, ratio, return, multiple, share and each of the three cases and the sensitivity grid in chapter 7, is this report's own arithmetic or estimate on stated assumptions, and each of those assumptions may prove wrong. Where the filings print their own rounded percentages the report says so and prints the computed figure beside them. Forward looking statements taken from the filings, including the guidance figures in chapter 3, are management's own and were current only at the date filed; a later filing may already have changed them. Market prices move, and the closing prices of 4 September 2026 used throughout will not be the prices at which any reader can transact.