Cerebras Systems (CBRS), Financial Analysis
Insights derived from analysing SEC filings. Independent analysis, not a publication of the SEC.
- Revenue $210.8m in Q3 2026, +55.3% year on year and +17.0% on Q2; costs +168.2%. GAAP operating margin (106.3%) against (19.5%) in Q3 2025, after stock based compensation of $155.1m and customer warrant amortization of $36.4m booked against revenue. Core revenue, the company's non GAAP measure, was $230.9m (+70.1%) with a core operating margin of (14.3%) and core net income of $29.8m (company measures, 8-K Ex 99.1); GAAP net loss $161.2m, diluted EPS ($0.67).
- Cloud and other services revenue $141.9m (+264.7%), 67% of revenue; hardware $68.9m, (28.8%) year on year. OpenAI contributed $72.4m under its master relationship agreement, 34% of revenue; MBZUAI was 38% and G42 7%, against MBZUAI 70% and G42 14% in Q3 2025 (Q3 2026 10-Q). US revenue $130.8m, 62% of the total, against 29% a year earlier.
- Remaining performance obligations $26.1bn at 30 Sep 2026, against $24.6bn at 31 Dec 2025; 33% is expected within 24 months, against 15% at year end. The release states 700 gross MW of data center capacity secured for delivery by end 2027, against more than 600 MW live and under contract in the Q2 release; leases not yet commenced total $8.5bn undiscounted, starting in 2026 and 2027 (10-Q).
- FY2026 core revenue guidance (non GAAP) raised to $940m to $960m from $880m to $890m in Aug and $855m to $865m in Jun; Q4 2026 core revenue guidance $310m to $330m, +81% to +92% on Q4 2025, with a core operating margin of (1%) to 1%. The CEO states in the release that Cerebras expects to triple revenue in 2027.
- Cash and investments $7.36bn plus $444m restricted cash at 30 Sep 2026; the OpenAI working capital loan stands at $829.1m after $175.5m of non cash repayments through services and other credits, and the $850m revolver is undrawn. Operating cash flow was ($388.9m) and capital expenditure $1.05bn in 9M 2026, against $301m in 9M 2025.
- Shares closed at $97.75 on 12 Nov 2026, 47% below the $185.00 IPO price; market value $23.8bn, EV/Sales 22.8x TTM. Insiders sold $415m of stock from listing to 27 Oct 2026 with no open market purchases; the IPO lock up ran to the earlier of the second trading day after the Q3 2026 release or 180 days after the 13 May 2026 prospectus, which was 9 Nov 2026 (424B4). Scenario prices three years forward on exit EV/Sales: base $126, best $275, worst $49.
Figures are read from the Q3 2026 earnings release (8-K Ex 99.1 of 12 Nov 2026) and the Q3 2026 10-Q filed the same day, incl. its Ex 10.1 (MBZUAI purchase order amendment), the Forms 10-Q and earnings releases for Q1 and Q2 2026, the IPO prospectus (424B4 of 14 May 2026) for FY2024, FY2025 and the quarters of 2025, the 2024 Form S-1 for FY2023, the Forms 8-K with all their exhibits since the listing, Schedules 13D and 13G, Forms 4 for central index key 2021728, and the filings of the peers used in chapters 2 to 5. Cerebras files no separate CFO commentary document; CFO and CEO statements come from the earnings releases. No 10-K exists yet: Cerebras listed on 14 May 2026, so the risk factor comparison uses the prospectus. Share price $97.75 is the regular session close of 12 Nov 2026, the day of the release. Accession numbers appear in the Sources appendix.
1 Revenue & Business Model
- Storyline: Cerebras moved from selling wafer scale systems, mostly to G42 and MBZUAI in the UAE, to renting inference capacity in its own cloud, led by a 750 MW OpenAI contract; Q3 2026 cloud revenue was more than double hardware revenue, and losses widened on IPO stock compensation. Chapters 2 to 4 cover the three revenue drivers: Cerebras Cloud, wafer scale systems, and contracted capacity with its customer concentration.
- Cerebras designs the Wafer Scale Engine, a processor built on a whole silicon wafer, and sells it in CS systems for on premises use or as inference capacity through Cerebras Cloud and partner clouds. It reports one segment and two revenue lines: hardware (point in time) and cloud and other services (dedicated capacity on take or pay terms, on demand tokens, support and AI model services).
- Revenue FY2023 $78.7m, FY2024 $290.3m and FY2025 $510.0m (+75.7%); TTM Q3 2026 $755.8m. G42 was 85% of FY2024 revenue; in FY2025 MBZUAI was 62% and G42 24% (424B4). Net income of $237.8m in FY2025 includes a $363.3m gain on a forward contract liability; the operating loss was ($145.9m).
- Since Q1 2026, GAAP revenue is reduced by amortization of warrants issued to G42, OpenAI and AWS ($82.7m in 9M 2026) and includes pass through data center revenue billed to OpenAI ($35.0m). The customer warrant asset was $1.09bn at 30 Sep 2026 and is amortized against revenue through Oct 2031 (10-Q). Core revenue, the company's non GAAP measure, removes both effects.
- Regions (10-Q, billing location): US revenue $130.8m and Europe, Middle East and Africa $79.8m in Q3 2026, against $39.8m and $95.8m in Q3 2025; 9M 2026 US $284.9m and EMEA $298.7m. Property and equipment of $1.51bn sits in the US ($1.30bn) and Canada ($210m).


| Line | Q1 2025 | Q2 2025 | Q3 2025 | Q4 2025 | Q1 2026 | Q2 2026 | Q3 2026 |
|---|---|---|---|---|---|---|---|
| Revenue, GAAP ($m) | 99.5 | 103.3 | 135.7 | 171.4 | 193.4 | 180.1 | 210.8 |
| Hardware ($m) | 69.7 | 70.3 | 96.8 | 121.7 | 110.6 | 54.1 | 68.9 |
| Cloud and other services ($m) | 29.8 | 33.0 | 38.9 | 49.8 | 82.8 | 126.0 | 141.9 |
| Core revenue, non GAAP ($m) | 99.5 | 103.3 | 135.7 | 171.4 | 191.3 | 209.9 | 230.9 |
| Customer warrant amortization ($m) | 0.0 | 0.0 | 0.0 | 0.0 | 2.1 | 44.3 | 36.4 |
| Pass through revenue ($m) | 0.0 | 0.0 | 0.0 | 0.0 | 4.1 | 14.5 | 16.4 |
| Hardware gross margin, GAAP (%) | 30.5 | 33.6 | 50.4 | 49.3 | 41.3 | 1.8 | 11.0 |
| Cloud and other services gross margin, GAAP (%) | 68.2 | 25.6 | 16.2 | 20.6 | 48.9 | 19.5 | 24.3 |
| Core operating income (loss), non GAAP ($m) | (19.3) | (43.9) | (15.1) | (17.8) | (3.5) | (33.6) | (33.1) |
2 Cerebras Cloud: Cloud Revenue $141.9m, Up 265%, With OpenAI at 34% of Revenue
- Cloud and other services revenue by quarter from Q1 2025: $29.8m, $33.0m, $38.9m, $49.8m, $82.8m, $126.0m, $141.9m. Q3 2026 rose +12.6% on Q2; core cloud revenue, a company non GAAP measure, $144.9m (+272.3%).
- OpenAI is the largest cloud customer: MRA revenue $72.4m in Q3 and $146.8m in 9M 2026 (10-Q). The 10-Q MD&A says the cloud share of revenue will rise as OpenAI capacity is delivered, with pass through revenue rising in the near term as initial capacity runs in the Cerebras cloud.
- Margins: cloud GAAP gross margin 24.3% in Q3 2026 against 16.2% in Q3 2025 and 48.9% in Q1 2026; core cloud gross margin 46.9% against 16.5%, which the 10-Q attributes to higher pricing and operating leverage, partly offset by capacity rental costs.
- Channels: dedicated capacity on take or pay terms and on demand token pricing; partner channels incl. AWS Marketplace, Microsoft Marketplace, IBM watsonx Model Gateway, Vercel AI Gateway, OpenRouter and Hugging Face; Oracle Cloud Infrastructure from 2027 (10-Q; release).
How the inference cloud market is changing
- 424B4 (May 2026): an estimate cited in the prospectus puts the addressable market for Cerebras within AI inference at about $66bn in 2025 and $292bn by 2029 (45% CAGR), and AI training infrastructure at about $185bn in 2025 and $380bn by 2029 (20% CAGR).
- Q3 2026: CoreWeave revenue $3.66bn, up 168%, with a revenue backlog of about $132.5bn (8-K Ex 99.1, 10 Nov 2026).
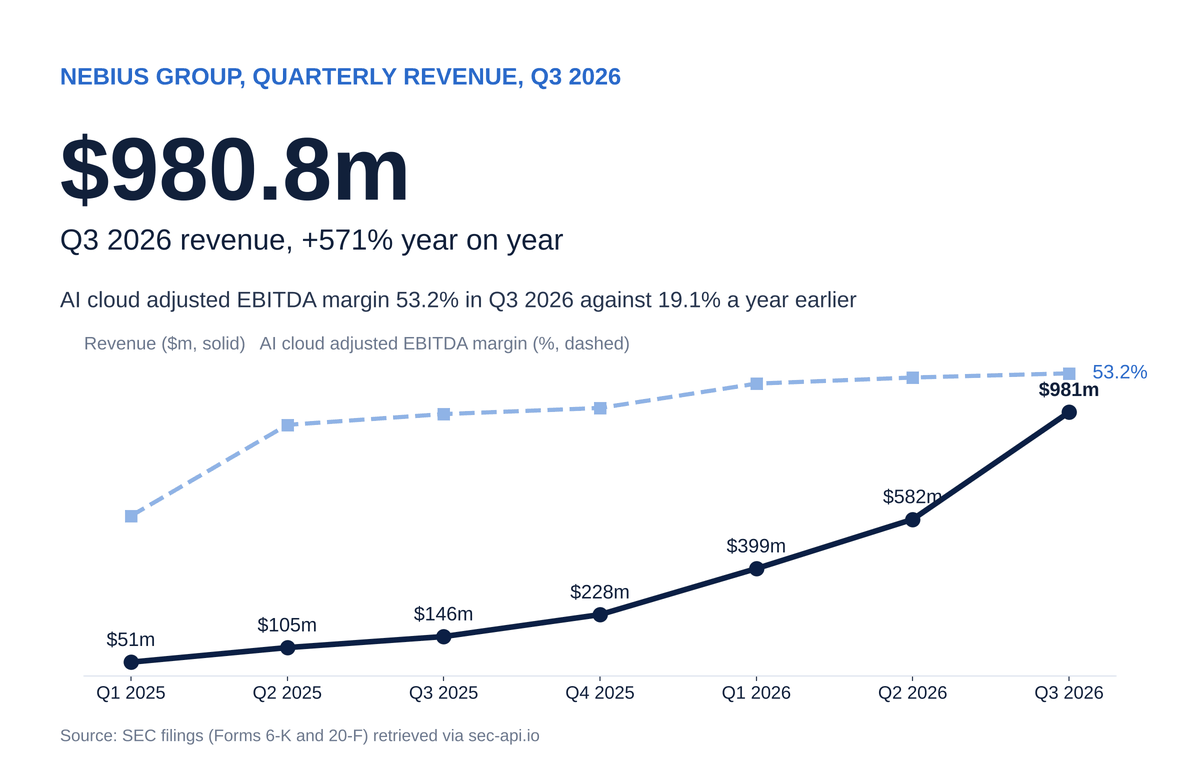
- Q2 2026: Nebius AI cloud revenue $575m, up 514%; production inference workloads on its Token Factory more than tripled in the quarter (6-K, 12 Aug 2026).
- Sep 2026 quarter: IREN AI Cloud revenue $200m with an 86% segment gross margin before depreciation and a $20.3bn backlog (8-K, 5 Nov 2026).
- Aug 2026 quarter: Oracle Cloud Infrastructure revenue $7.39bn, up 120.7%; Cerebras inference to be available in Oracle Cloud Infrastructure in 2027 (Oracle 10-Q; Cerebras 8-K Ex 99.1).
- Q3 2026 10-Q: Cerebras inference is sold through AWS Marketplace, Microsoft Marketplace, IBM watsonx Model Gateway, Vercel AI Gateway, OpenRouter and Hugging Face.


| Company and line | Period | Revenue | Growth (%) | Margin (%) | Detail |
|---|---|---|---|---|---|
| Cerebras cloud and other services | Q3 2026 | $141.9m | 264.7 | 24.3 | core cloud gross margin 46.9%; OpenAI MRA $72.4m |
| CoreWeave Revenue | Q3 2026 | $3.66bn | 168.3 | 5.7 | Revenue backlog about $132.5bn; margin is GAAP operating margin |
| Nebius AI cloud revenue | Q2 2026 | $575.0m | 514.0 | 49.7 | Margin is AI cloud adjusted EBITDA margin; customer commitments above $40bn |
| IREN AI Cloud revenue | Sep 2026 quarter | $200.0m | n/a | 86.0 | Margin is segment gross margin before depreciation; backlog $20.3bn |
| Oracle OCI revenue | Aug 2026 quarter | $7.39bn | 120.7 | n/a | RPO $664bn, +45.9% |
| Alphabet Google Cloud revenue | Q3 2026 | $30.71bn | 102.6 | 36.2 | Backlog $560.8bn |
3 Wafer Scale Systems: Hardware Revenue $68.9m, Down 29%, Against GPU Data Center Sales
- Hardware revenue by quarter from Q1 2025: $69.7m, $70.3m, $96.8m, $121.7m, $110.6m, $54.1m, $68.9m. FY2025 hardware was $358.4m, 70% of revenue.
- Q3 2026 hardware fell $27.9m year on year: $17.1m warrant amortization and $10.8m lower deliveries on existing arrangements; core hardware revenue $86.0m, (11.2%) year on year. Hardware gross margin 11.0% against 50.4% (core 31.0% against 50.5%).
- Product cadence (releases): CS4 announced in Aug 2026 with up to 30x faster inference claimed; CS5 targeted for early summer 2027; Wafer Scale Engine 5 in system testing less than five months after tape out; inventory charges of $23.5m in 9M 2026 relate to the product transition (10-Q).
- Supply chain: the Q2 release states the wafer scale design uses no HBM memory, CoWoS packaging or 3nm fabrication; TSMC wafer supply secured; manufacturing with Flex and Sanmina to exit 2026 above 10x the capacity at the start of the year.
How the AI chip market is changing
- Jul 2026 quarter: NVIDIA data center revenue $89.0bn, up 117%; company GAAP operating margin 66.2% (8-K Ex 99.1, 26 Aug 2026).
- Q3 2026: AMD Data Center segment revenue $8.55bn, up 96.9%, segment operating margin 33.7%; AMD contracts with OpenAI for 6 GW (AMD 8-K, 3 Nov 2026).
- Jul 2026 quarter: Broadcom AI semiconductor revenue $16.7bn, up 221%, with $21.7bn guided for the Oct 2026 quarter (8-K, 2 Sep 2026).
- Q3 2026: Intel DCAI revenue $7.32bn, up 77.8%; Intel announced the Crescent Island inference GPU (8-K, 29 Oct 2026).


| Company and line | Period | Revenue | Growth (%) | Margin (%) | Detail |
|---|---|---|---|---|---|
| Cerebras hardware | Q3 2026 | $68.9m | (28.8) | 11.0 | margin is hardware gross margin; core hardware revenue $86.0m |
| NVIDIA Data Center revenue | Jul 2026 quarter | $89.00bn | 117.0 | 66.2 | Margin is company GAAP operating margin |
| Broadcom AI semiconductor revenue | Jul 2026 quarter | $16.70bn | 221.0 | 53.9 | Margin is company GAAP operating margin |
| AMD Data Center segment revenue | Q3 2026 | $8.55bn | 96.9 | 33.7 | Segment operating margin |
| Intel DCAI revenue | Q3 2026 | $7.32bn | 77.8 | 41.5 | Segment operating margin |
4 Contracted Capacity: $26.1bn RPO, OpenAI 750 MW and 700 MW of Data Centers
- RPO $24.6bn at 31 Dec 2025, $25.4bn at 30 Jun 2026 and $26.1bn at 30 Sep 2026, mostly the OpenAI MRA. The share expected within 24 months rose to 33% from 15%; 44% falls in months 25 to 48 (424B4; 10-Q). RPO includes pass through costs only for capacity whose data center leases had commenced.
- OpenAI MRA: 750 MW in tranches 2026 to 2028, an option for 1.25 GW more by end 2030 (up to 2.0 GW in total), service credits or partial termination for late capacity, a $1.0bn working capital loan and a warrant for up to 33.4m shares (424B4; 10-Q).
- Concentration as filed: G42 85% of FY2024 revenue; MBZUAI 62% and G42 24% in FY2025; MBZUAI 38%, OpenAI 34% and G42 7% in Q3 2026; 9M 2026 MBZUAI 45%, OpenAI 25% and G42 9%. MBZUAI and G42 are related parties.
- Capacity: 700 gross MW of data center capacity secured for delivery by end 2027, against more than 600 MW live and under contract at Q2; leases not yet commenced $8.5bn undiscounted; new capacity contracts in Norway and Finland; property and equipment in the US and Canada (releases; 10-Q).
How contracted AI capacity is changing
- 30 Sep 2026: CoreWeave RPO $132.3bn; Microsoft commercial RPO $677bn (+73%); Google Cloud backlog $560.8bn; Oracle RPO $664bn at 31 Aug 2026 (company filings).
- Contracts set in gigawatts with equity warrants: AMD and OpenAI 6 GW; Cerebras and OpenAI 750 MW with an option for 1.25 GW more, plus a warrant for up to 33.4m Cerebras shares (AMD 8-K; Cerebras 10-Q).
- Aug 2026: Nebius raised its end 2026 contracted power target to 5 GW (6-K, 12 Aug 2026); CoreWeave above 4.6 GW contracted at 30 Sep 2026.
- Nov 2026: IREN reports more than 5 GW of secured power (8-K, 5 Nov 2026).
- Q3 2026 10-Q: Cerebras leases not yet commenced total $8.5bn undiscounted, starting in 2026 and 2027; the Q3 2026 release adds new capacity contracts in Norway and Finland.


| Company | Measure and date | Value | Detail |
|---|---|---|---|
| Cerebras | RPO, 30 Sep 2026 | $26.1bn | 33% within 24 months; 700 MW under contract |
| CoreWeave | Remaining performance obligations, 30 Sep 2026 | $132.30bn | Contracted power above 4.6 GW; debt $46.9bn |
| Oracle | Remaining performance obligations, 31 Aug 2026 | $664.00bn | OCI revenue $7.39bn |
| Microsoft | Commercial RPO, 30 Sep 2026 | $677.00bn | Azure revenue $33.2bn, +48.2% |
| IREN | AI Cloud backlog, 30 Sep 2026 | $20.30bn | More than 5 GW secured power |
| Nebius | Customer commitments, Q2 2026 | above $40bn | Contracted power target 5 GW at end 2026 |
5 Financial Analysis & Ratios
- GAAP operating margin TTM (99.3%) against (28.6%) in FY2025 and (34.9%) in FY2024. Stock based compensation was $558m over the TTM, 74% of revenue, after RSUs with a liquidity condition vested at the IPO.
- Net loss TTM $651.4m. Other income, mostly interest on the IPO cash, was $103.7m over the TTM and $63.9m in Q3 2026, net of $18.6m of non cash interest on the OpenAI working capital loan.
- Free cash flow TTM ($1.39bn): operating cash flow ($264.7m) less capital expenditure of $1.13bn. In 9M 2026 supplier prepayments and inventory raised working capital: prepaid expenses and other current assets rose to $543m from $32m at 31 Dec 2025 (10-Q).
- Balance sheet at 30 Sep 2026: cash $3.07bn, investments $4.29bn, restricted cash $444m; property and equipment $1.51bn, of which construction in progress $1.10bn; customer warrant assets $1.09bn; deferred revenue $688m; working capital loan $829.1m; equity $9.16bn against ($579m) at 31 Dec 2025, when preferred stock sat outside equity.
- Capital returns: no dividends and no buybacks; IPO net proceeds $6.2bn after $165.4m of underwriting discounts and offering costs; $416.7m paid for tax withholding on the tender offer and IPO RSU settlement in 9M 2026.
| Line item | FY2023 | FY2024 | FY2025 | TTM Q3 2026 |
|---|---|---|---|---|
| Revenue | 78.7 | 290.3 | 510.0 | 755.8 |
| Gross profit | 26.4 | 122.7 | 199.1 | 224.1 |
| Research and development | 140.1 | 158.2 | 243.3 | 646.0 |
| Selling, general and administrative | 20.2 | 65.9 | 101.6 | 328.2 |
| Operating income | (133.9) | (101.4) | (145.9) | (750.2) |
| Net income | (127.2) | (481.6) | 237.8 | (651.4) |
| Diluted EPS ($) | (2.92) | (9.90) | 1.38 | n/a |
| Operating cash flow | (79.0) | 452.0 | (10.1) | (264.7) |
| Capital expenditure | (6.6) | (23.4) | (382.7) | (1,127.7) |
| Free cash flow | (85.6) | 428.5 | (392.8) | (1,392.4) |
| Stock based compensation | 26.6 | 58.6 | 49.8 | 557.7 |
| Cash and investments | 152.4 | 337.2 | 1,108.2 | 7,360.8 |
| Total debt | 0.0 | 0.0 | 0.0 | 829.1 |
| Total equity | (559.0) | (966.8) | (578.7) | 9,158.9 |

| Metric | Q3 2025 | Q3 2026 | Change |
|---|---|---|---|
| Revenue ($m) | 135.7 | 210.8 | 55.3% |
| Gross profit ($m) | 55.1 | 42.1 | (23.7%) |
| Operating income ($m) | (26.5) | (224.1) | (746.8%) |
| Net income ($m) | (22.2) | (161.2) | (626.2%) |
| Diluted EPS ($) | (0.41) | (0.67) | (63.4%) |
| Operating cash flow ($m) | (10.4) | (341.4) | n/a |
| Free cash flow ($m) | (126.4) | (838.6) | (563.3%) |
| Operating margin (%) | (19.5) | (106.3) | (86.8 pts) |
| Net margin (%) | (16.4) | (76.5) | (60.1 pts) |
| Ratio | FY2023 | FY2024 | FY2025 | TTM Q3 2026 |
|---|---|---|---|---|
| Growth and margins | ||||
| Revenue growth (%) | n/a | 268.6 | 75.7 | n/a |
| Gross margin (%) | 33.5 | 42.3 | 39.0 | 29.6 |
| Operating margin (%) | (170.1) | (34.9) | (28.6) | (99.3) |
| Net margin (%) | (161.5) | (165.9) | 46.6 | (86.2) |
| FCF margin (%) | (108.7) | 147.6 | (77.0) | (184.2) |
| Cost and investment intensity | ||||
| R&D (%) revenue | 177.9 | 54.5 | 47.7 | 85.5 |
| SBC (%) revenue | 33.8 | 20.2 | 9.8 | 73.8 |
| Capex (%) revenue | 8.4 | 8.1 | 75.0 | 149.2 |
| Returns | ||||
| ROA (%) | (56.4) | (72.0) | 13.8 | (5.5) |
| Asset turnover (x) | 0.35 | 0.26 | 0.22 | 0.06 |
| Liquidity and leverage | ||||
| Current ratio (x) | 3.89 | 0.87 | 2.15 | 5.27 |
| Net cash ($bn) | 0.2 | 0.3 | 1.1 | 6.5 |
| Efficiency and cash quality | ||||
| Days sales outstanding | 31 | 173 | 36 | 112 |


| Measure | Value |
|---|---|
| Market cap ($bn) | 23.8 |
| Enterprise value ($bn) | 17.2 |
| EV/Sales (TTM) (x) | 22.8 |
| FCF yield (%) | (5.9) |
| Price/Book (x) | 2.6 |
Cost structure and profitability
- Costs (revenue less operating income) $435.0m in Q3 2026, +168.2%, against revenue +55.3%; GAAP operating margin (86.8) pts year on year and 158.6 pts on Q2 2026, when IPO stock compensation of $377m was booked.
- Stock based compensation $155.1m in Q3 2026 (74% of revenue) against $11.3m a year earlier; $273.6m of the 9M 2026 expense relates to RSUs whose liquidity condition was met at the IPO, and CEO and CTO Executive Grants began expensing in Q2 2026 (10-Q).
- Cost of revenue 80.0% of revenue against 59.4% in Q3 2025; depreciation in cost of revenue rose to $22.6m from $0.9m as cloud systems were placed in service, and total lease costs reached $69.0m against $26.3m (10-Q Notes 8 and 15).
- Core operating loss (company non GAAP measure) $33.1m, a core operating margin of (14.3%), against $15.1m and (11.1%) in Q3 2025; core operating expenses were $127.7m against $70.4m (8-K Ex 99.1).


| Line | Q3 2025 | Q4 2025 | Q1 2026 | Q2 2026 | Q3 2026 |
|---|---|---|---|---|---|
| Cost of revenue (% of revenue) | 59.4 | 59.0 | 55.4 | 85.8 | 80.0 |
| Research and development (% of revenue) | 42.2 | 42.3 | 39.0 | 177.8 | 84.4 |
| Sales and marketing (% of revenue) | 15.4 | 12.4 | 7.6 | 48.3 | 15.6 |
| General and administrative (% of revenue) | 2.6 | 5.9 | 5.7 | 53.1 | 26.4 |
| Stock based compensation (incl. in lines above) (% of revenue) | 8.4 | 9.3 | 5.0 | 209.3 | 73.6 |
| Depreciation and amortization (incl. in lines above) (% of revenue) | 6.4 | 9.6 | 9.4 | 13.5 | 14.1 |
| Operating income (loss) (% of revenue) | (19.5) | (19.7) | (7.8) | (265.0) | (106.3) |
| Line | Q3 2025 | Q3 2026 | 9M 2026 |
|---|---|---|---|
| Revenue | 135.7 | 210.8 | 584.3 |
| Core operating loss | (15.1) | (33.1) | (70.2) |
| GAAP operating loss | (26.5) | (224.1) | (716.4) |
| Other income, net | 5.8 | 63.9 | 93.4 |
| Income taxes | (1.5) | (1.0) | (2.7) |
| Net loss | (22.2) | (161.2) | (625.8) |
Cash, capital expenditure and liquidity
- Capital expenditure by quarter from Q1 2025: $98m, $87m, $116m, $82m, $132m, $417m, $497m; property and equipment rose to $1.51bn from $437m at 31 Dec 2025, with construction in progress of $1.10bn.
- Operating cash flow by quarter from Q1 2025: ($55m), ($69m), ($10m), $124m, $12m, ($60m), ($341m). In 9M 2026 customer deposits fell $245.7m and prepaid expenses rose $546.0m, against a $288.0m rise in deferred revenue (10-Q cash flow statement).
- Liquidity: cash, cash equivalents, restricted cash and investments $7.8bn and $850m of revolver capacity (release); the 10-Q states liquidity covers at least 12 months and that future investment may need further debt or equity.
- OpenAI loan accounting: the MRA and loan are treated together; the financing component in the contract adds non cash interest ($57.2m in 9M 2026) to other income and the same amount to deferred revenue, which is recognized as revenue as capacity is delivered (10-Q Note 10).

6 MD&A & Management Commentary
Q3 2026 results: 8-K Ex 99.1 and 10-Q of 12 Nov 2026
- Revenue $210.8m, +55.3% year on year and +17.0% on Q2 2026; 9M 2026 $584.3m (+72.6%). Core revenue (non GAAP) of $230.9m was above the $214m to $216m guided in Aug; the CFO states guidance was exceeded on all metrics in each of the three quarters since the listing.
- Revenue lines (10-Q MD&A): hardware fell $27.9m, of which $17.1m warrant amortization and $10.8m lower deliveries; cloud and other services rose $103.0m, incl. $122.3m more from the OpenAI arrangement and new inference agreements, less $19.3m warrant amortization.
- Margins: GAAP gross margin 20.0% against 40.6%; hardware 11.0% against 50.4%, cut by warrant amortization, higher material costs and preferential pricing for a large strategic customer signed in 2025; cloud 24.3% against 16.2%. Core gross margin (non GAAP) 41.0% against 40.7%; core cloud 46.9% against 16.5% (8-K Ex 99.1).
- Operating costs: research and development $177.8m (+211%), of which $99.9m more stock based compensation and payroll tax; general and administrative $55.6m against $3.5m, with $38.5m more stock compensation and public company costs; sales and marketing $32.8m.
- Cash: operating cash flow ($341.4m) in Q3 and ($388.9m) in 9M 2026; capital expenditure $497.2m in Q3 and $1.05bn in 9M 2026, for systems and data center capacity for the cloud (10-Q). Inventory $146.1m at 30 Sep 2026 against $63.6m at 31 Dec 2025; inventory charges $23.5m in 9M 2026 tied to the next product generation.
- Commercial items in the release: Oracle to offer Cerebras inference in Oracle Cloud Infrastructure in 2027; a cloud deal with an unnamed top three hyperscaler; new capacity contracts in Norway and Finland; CS4 system announced in Aug 2026 and CS5 targeted for early summer 2027.
| Item | Outlook | Source |
|---|---|---|
| Q4 2026 core revenue | $310m to $330m | 8-K Ex 99.1, 12 Nov 2026 |
| Q4 2026 core gross margin | 47% to 49% | 8-K Ex 99.1, 12 Nov 2026 |
| Q4 2026 core operating margin | (1%) to 1% | 8-K Ex 99.1, 12 Nov 2026 |
| FY2026 core revenue | $940m to $960m; Aug: $880m to $890m; Jun: $855m to $865m | 8-K Ex 99.1, 12 Nov, 12 Aug and 23 Jun 2026 |
| FY2026 core gross margin | 42% to 44%; Aug: 41% to 43%; Jun: 38% to 41% | 8-K Ex 99.1 |
| FY2026 core operating margin | (10%) to (8%); Aug: (19%) to (17%); Jun: (32%) to (28%) | 8-K Ex 99.1 |
| Q3 2026 core revenue (guided in Aug) | $214m to $216m; actual $230.9m | 8-K Ex 99.1, 12 Aug and 12 Nov 2026 |
| 2027 revenue | CEO expects to triple revenue in 2027 (release quote) | 8-K Ex 99.1, 12 Nov 2026 |
| Implied Q4 2026 core revenue from FY guidance | $308m to $328m, derived as FY guidance less 9M core revenue of $632.1m | derived |
Management and CFO commentary
- Cerebras files no CFO commentary document; the points below come from the earnings releases filed as 8-K Ex 99.1.
- Q3 2026 release (12 Nov 2026), CFO Bob Komin: guidance exceeded on all metrics in each of the three quarters reported since the listing; new customers incl. hyperscalers, neoclouds and large enterprises; pipeline for high speed inference up more than 10x in the quarter.
- Q3 2026 release, CEO Andrew Feldman: customers buy direct systems, Cerebras Cloud or capacity through third party clouds; Cerebras expects to triple revenue in 2027.
- Q2 2026 release (12 Aug 2026): core revenue more than doubled to $210m; RPO $25.4bn; the CFO stated plans to more than triple revenue in 2027; disaggregated inference with AMD in production in Q4 2026 and on Amazon Bedrock in Q1 2027.
- Q1 2026 release (23 Jun 2026): OpenAI deal for 750 MW valued at more than $20bn; AWS partnership for disaggregated inference with Trainium 3 for prefill and CS3 for decode.
| Speaker | Date and source | Statement |
|---|---|---|
| Andrew Feldman, CEO | 12 Nov 2026, 8-K Ex 99.1 | “Cerebras’ technology remains the undisputed champion of speed” |
| Bob Komin, CFO | 12 Aug 2026, 8-K Ex 99.1 | “Our quarterly results exceeded our guidance across all core business metrics.” |
| Andrew Feldman, CEO | 12 Aug 2026, 8-K Ex 99.1 | “Speed changes what AI can do.” |
| Item | Disclosure |
|---|---|
| 424B4, business | One segment; hardware and cloud and other services; customers incl. hyperscalers, model labs, AI natives, enterprises and sovereign AI programmes; contract manufacturers incl. Flex and Sanmina; TSMC wafers. |
| 424B4, OpenAI MRA | Signed Dec 2025: 750 MW of inference capacity in tranches from 2026 to 2028, each with a three or four year term extendable to five years; option for 1.25 GW more by end 2030; RPO $24.6bn at 31 Dec 2025, 15% within 24 months. |
| 10-Q Q3 2026, revenue | OpenAI MRA revenue $72.4m in Q3 and $146.8m in 9M 2026, net of $3.2m and $6.5m warrant amortization; RPO $26.1bn, 33% within 24 months and 44% in months 25 to 48. |
| 10-Q Q3 2026, customers | Customer A 38% (70% in Q3 2025), Customer B 34%, Customer C 7% below the 10% line; A and C are related parties; receivables 64% from Customer B and 16% from Customer C. |
| 10-Q Q3 2026, debt | Working capital loan $1.0bn from OpenAI at 6%, maturing by 31 Dec 2032, repaid mainly through service credits ($175.5m to date); $850m revolver undrawn, maturing 14 Apr 2031, $150m minimum liquidity covenant. |
| 10-Q Q3 2026, leases | Operating lease liabilities $621.1m; leases not yet commenced $8.5bn starting 2026 and 2027; a further $217.8m signed in Q4 2026 (subsequent event). |
| 10-Q Q3 2026, warrants | OpenAI warrant for up to 33.4m Class N shares at $0.00001: 10.0m vested and exercised; AWS warrant for up to 2.70m shares at $100.00 vesting on AWS payments; G42 warrants for 1.86m and 1.66m shares exercised. |
| 10-Q Q3 2026, controls | Disclosure controls not effective at 30 Sep 2026 due to material weaknesses in IT general controls, segregation of duties and finance staffing; remediation ongoing. |
| 10-Q Q3 2026, legal | Putative class action filed Oct 2025 in the Northern District of California alleging copyright infringement tied to large language models and datasets; no loss estimate. |
| 10-Q Q3 2026, Ex 10.1 | MBZUAI purchase order of 30 Dec 2025 amended on 18 Sep 2026: some inference CS3 systems replaced by a training and inference CS3 cluster at an unchanged total contract value; not for use in the US or delivery to the UAE. |
7 Peer Valuation & Sector Summary
- Sector: AI compute for training and inference. The 424B4 names NVIDIA, AMD and Intel as hardware competitors, AI accelerators built by hyperscalers and private companies, the AWS, Azure, Google Cloud and Oracle clouds, and specialist clouds such as CoreWeave. An estimate cited in the prospectus puts the addressable market for Cerebras within AI inference at about $66bn in 2025 and $292bn by 2029.
- Growth, latest quarter year on year: CRWV 168.3%, NVDA 105.9%, AVGO 85.5%, CBRS 55.3%, AMD 44.7%.
- GAAP operating margin TTM: NVDA 65.2%, AVGO 48.0%, AMD 17.7%, CRWV (0.8%), CBRS (99.3%). Gross margin: NVDA 74.7%, AMD 53.7%, CBRS 29.6%.
- Valuation, EV/Sales TTM: CBRS 22.8x, AMD 20.9x, AVGO 20.4x, NVDA 13.1x, CRWV 7.1x. Net cash: CBRS $6.5bn, NVDA $23.2bn; net debt AVGO $35.4bn, CRWV $42.7bn.
| Company | Revenue TTM ($bn) | Revenue growth (%) | Gross margin (%) | Operating margin (%) | Net margin (%) | FCF margin (%) | Net cash ($bn) | Market value ($bn) | EV/Sales (x) | P/E TTM (x) |
|---|---|---|---|---|---|---|---|---|---|---|
| CBRS | 0.8 | 55.3 | 29.6 | (99.3) | (86.2) | (184.2) | 6.5 | 24 | 22.8 | n/a |
| NVDA | 303.0 | 105.9 | 74.7 | 65.2 | 63.7 | 41.9 | 23.2 | 4,005 | 13.1 | 20.8 |
| AMD | 45.4 | 44.7 | 53.7 | 17.7 | 16.8 | 14.9 | 8.7 | 956 | 20.9 | 125.3 |
| AVGO | 89.1 | 85.5 | 68.8 | 48.0 | 42.9 | 44.2 | (35.4) | 1,781 | 20.4 | 46.6 |
| CRWV | 9.9 | 168.3 | 66.7 | (0.8) | (25.6) | (206.6) | (42.7) | 27 | 7.1 | n/a |

8 Material Events & Contracts
- Four Forms 8-K since the listing: the IPO closing (15 May 2026) and three earnings releases (23 Jun, 12 Aug and 12 Nov 2026). The Q3 2026 10-Q adds Ex 10.1, the MBZUAI purchase order amendment.
- IPO (8-K Item 8.01): 34.5m Class A shares at $185.00 incl. the 4.5m share over allotment, gross proceeds $6.4bn; preferred stock converted into 124.7m Class B shares.
- Financing: $1.0bn of Series H preferred stock and the $1.0bn OpenAI working capital loan in early 2026, before the IPO; revolver opened on 14 Apr 2026 at $250m for letters of credit and raised to $850m on 17 Jun 2026.
- Warrants as sales incentives: customer warrants to OpenAI, G42 and AWS are booked as an asset ($1.09bn at 30 Sep 2026) and amortized against revenue as the related revenue is recognized.
| Date | Items | Event |
|---|---|---|
| 15 May 2026 | 5.03, 8.01, 9.01 | IPO closed: 34.5m Class A shares at $185.00 incl. 4.5m over allotment, gross proceeds $6.4bn; restated certificate (Ex 3.1) and bylaws (Ex 3.2) |
| 23 Jun 2026 | 2.02, 9.01 | Q1 2026 results (Ex 99.1): revenue $193.4m, core revenue $191.3m, OpenAI MRA for 750 MW valued at more than $20bn, AWS partnership |
| 12 Aug 2026 | 2.02, 9.01 | Q2 2026 results (Ex 99.1): revenue $180.1m, core revenue $209.9m, RPO $25.4bn, more than 600 MW live and under contract, FY2026 core revenue guidance $880m to $890m |
| 12 Nov 2026 | 2.02, 9.01 | Q3 2026 results (Ex 99.1): revenue $210.8m, core revenue $230.9m, RPO $26.1bn, 700 MW under contract, FY2026 core revenue guidance $940m to $960m |
| Contract | Terms |
|---|---|
| OpenAI master relationship agreement | 750 MW of inference capacity in tranches 2026 to 2028, three or four year terms extendable to five; option for 1.25 GW more by end 2030; service credits or partial termination if capacity is late; release of Jun 2026 values it at more than $20bn. |
| OpenAI working capital loan | $1.0bn received Jan 2026, 6%, maturity by 31 Dec 2032, secured on a lockbox account; repaid through services and credits ($175.5m to 30 Sep 2026); $829.1m outstanding. |
| OpenAI warrant | Up to 33,445,026 Class N shares at $0.00001, vesting on loan funding, capacity delivery and market value or payment thresholds; 10,033,508 shares exercised in Jul 2026; expires by 24 Dec 2035. |
| MBZUAI purchase order (10-Q Ex 10.1) | PO of 30 Dec 2025 amended 18 Sep 2026: training and inference CS3 cluster replaces part of the inference systems at unchanged total value; delivery to a storage facility, with Cerebras as exporter of record. |
| AWS warrant and partnership | Warrant for up to 2,696,678 Class N shares at $100.00 issued Jun 2026; 269,668 vested at issue, the rest vest on AWS payments within five years; expires 19 Jun 2033. |
| G42 warrants | 1,857,516 shares (Dec 2025) and 1,655,975 shares (Apr 2026) at $0.01, both exercised; recorded as customer warrant assets. |
| Revolving credit facility | $850m, Morgan Stanley Senior Funding as agent, matures 14 Apr 2031; $150m minimum liquidity covenant; secured on substantially all assets; undrawn at 30 Sep 2026. |
| Data center leases | Operating lease liabilities $621.1m; leases not yet commenced $8.5bn (commencing 2026 and 2027); $217.8m more signed in Q4 2026. |
9 Ownership, Voting Power & Insiders
- Three share classes: Class A with 1 vote, Class B with 20 votes and Class N with none. At 5 Nov 2026 there were 160.1m Class A, 69.2m Class B and 13.7m Class N shares (10-Q cover), so Class B held 89.6% of votes, against about 99.2% stated in the prospectus after the IPO. Class B converts to Class A on sale and on the founders' departure, death or incapacity.
- Largest holders in Schedules 13G and 13D: FMR 17.8% of Class A at 30 Sep 2026 (25.7% at 30 Jun); Atreides 10.7%, Benchmark 9.8% and Foundation Capital 12.2% at 30 Jun 2026, Foundation 7.6% at 30 Sep 2026 after distributions; CEO Andrew Feldman 9.2%.
- No annual meeting has been held since the listing and no proxy statement is filed; the voting structure is covered in the Sep 2026 sec-api.io post on Cerebras voting.
- Insiders, Forms 4 from listing to 12 Nov 2026: sales of $415m and no open market purchases. Sean Lie sold $201m, Dhiraj Mallick $104m and Andrew Feldman $64m; by month, $20.7m in Jun, $245.3m in Aug, $142.4m in Sep and $6.9m in Oct 2026. Directors Steve Vassallo and Lior Susan adopted Rule 10b5‑1 plans in Aug 2026 for 230,000 and 376,714 shares (10-Q Item 5).
| Holder | Form | As of | Class A shares (m) | Share of Class A as filed (%) |
|---|---|---|---|---|
| FMR LLC | 13G/A | 30 Sep 2026 | 30.34 | 17.8 |
| Foundation Capital VIII entities | 13G/A | 30 Sep 2026 | 9.52 | 7.6 |
| Benchmark Capital VIII entities | 13G | 30 Jun 2026 | 12.23 | 9.8 |
| Atreides Management | 13G | 30 Jun 2026 | 10.54 | 10.7 |
| Andrew Feldman | 13G | 30 Jun 2026 | 10.40 | 9.2 |
| Eclipse (Lior Susan) | 13D/A | 14 Aug 2026 | 9.56 | 4.3 |
| Altimeter (Brad Gerstner) | 13G | 30 Jun 2026 | 7.23 | 6.2 |
| Coatue Management | 13G | 30 Jun 2026 | 7.01 | 7.1 |
| Jane Street Group | 13G/A | 30 Sep 2026 | 2.80 | 2.5 |
| Holder | Shares sold (m) | Value ($m) | Months |
|---|---|---|---|
| Sean Lie, CTO and co founder | 0.99 | 200.7 | Jun, Aug to Oct |
| Dhiraj Mallick, COO | 0.51 | 103.6 | Jun, Aug, Sep |
| Andrew Feldman, CEO and co founder | 0.32 | 64.3 | Jun, Aug, Sep |
| Steven Vassallo, director | 0.10 | 21.4 | Aug, Sep |
| Eric Vishria, director | 0.07 | 15.7 | Aug |
| Bob Komin, CFO | 0.03 | 6.6 | Sep |
| Yagnesh Patel, CAO | 0.02 | 3.0 | Jun, Aug, Sep |
10 Risk Factors
- Item 1A of the Q3 2026 10-Q holds 69 risk factors against 70 in the IPO prospectus of 14 May 2026 (43,329 words against 41,201); no 10-K exists yet. 2 factors were added, 3 removed and 8 materially reworded. The concentration factor now names MBZUAI 38%, OpenAI 34% and G42 7% of Q3 2026 revenue, and the OpenAI custom inference chip.
| Risk | Disclosure and change |
|---|---|
| Customer concentration | MBZUAI 38%, OpenAI 34% and G42 7% of Q3 2026 revenue; G42 85% of FY2024 revenue; OpenAI MRA is most of the $26.1bn RPO (Q3 2026 10-Q). |
| OpenAI capacity delivery | Late capacity or service levels below contract terms give OpenAI service credits or a right to terminate part or all of the MRA; termination can accelerate the $829.1m working capital loan. |
| Customer built chips | New in the 10-Q: OpenAI has announced an internally developed custom inference chip; Amazon and other hyperscalers run AI workloads on their own silicon. |
| Data center capacity | Leases not yet commenced $8.5bn; rent and power obligations continue if customers reduce commitments; delays can cost priority in power connection queues (10-Q). |
| GPU supply (new) | Disaggregated inference pairs GPUs for prefill with Cerebras systems for decode; GPUs are in short supply and may need prepayments or long term commitments. |
| Customer financing (new) | Hardware buyers may rely on outside financing; defaults or delays could defer revenue and leave inventory and costs unrecovered. |
| UAE exposure and export controls | Most 2025 revenue came from customers headquartered in the UAE; MBZUAI cluster amended in Sep 2026 to exclude use in the US and delivery to the UAE (Ex 10.1). |
| Internal control | Material weaknesses (IT general controls, segregation of duties, staffing) left disclosure controls not effective at 30 Sep 2026. |
| Share supply | Options for 15.6m Class A and 3.9m Class B shares and RSUs for 15.2m Class A and 10.9m Class B shares at 30 Sep 2026; the IPO lock up ended on 9 Nov 2026, 180 days after the prospectus (424B4). |
| Litigation | Copyright class action filed Oct 2025; new 10-Q text adds short seller reports and alleged inconsistencies across filings and calls as possible triggers of claims. |
How risk factors changed
- Comparison: 10-Q Q3 2026 Part II Item 1A, filed 12 Nov 2026, acc 0001628280-26-073494 against IPO prospectus 424B4, filed 14 May 2026, acc 0001628280-26-035214 (no 10-K exists).
- Customer concentration text now carries Q3 2026 shares: MBZUAI 38%, OpenAI 34%, G42 7%.
- Two new factors cover customer financing for hardware purchases and GPU supply for disaggregated inference.
- Three offering factors fell away after the listing; the share sales factor now lists option and RSU overhang.
- Factor text grew 5% to 43,329 words from 41,201.

| Measure | IPO prospectus (424B4, May 2026) | 10-Q Q3 2026 |
|---|---|---|
| Risk factors (count) | 70 | 69 |
| Words in Item 1A | 41,201 | 43,329 |
| Change | Risk factor | What changed |
|---|---|---|
| Added | Customer financing, defaults and hardware revenue timing | New factor: hardware buyers may depend on outside financing; delays, defaults or bankruptcies could defer shipments and revenue, leave costs unrecovered and put creditor claims on delivered hardware ahead of Cerebras. |
| Added | GPU supply for disaggregated inference | New factor: disaggregated inference uses GPUs for prefill and Cerebras systems for decode, so Cerebras must buy GPUs that are in short supply and may need prepayments, long term commitments or guarantees. |
| Removed | No public market yet | Dropped after the listing on 14 May 2026. |
| Removed | Immediate dilution for IPO buyers | Dropped after the IPO. |
| Removed | Discretion over IPO proceeds | Dropped after the IPO; use of proceeds now in Part II Item 2. |
| Reworded | Customer concentration | Heading now names hyperscalers Amazon, Oracle and Microsoft in place of AWS; adds MBZUAI 38% and G42 7% of Q3 2026 revenue, OpenAI 34% (25% in 9M 2026), the OpenAI custom inference chip and OpenAI's right to service credits. |
| Reworded | Net losses | Updated to Q3 2026 net loss $161.2m, core net income $29.8m and an accumulated deficit of $1.5bn (prospectus: $905.3m). |
| Reworded | Cloud offerings | Adds industry security incidents and tighter model access at OpenAI, Anthropic and Fireworks, and the risk that lower AI funding leads customers incl. OpenAI to cut or postpone capacity commitments. |
| Reworded | Data center capacity and power | Adds unsold capacity, rent and power obligations that continue if customers reduce commitments, OpenAI site acceptance disputes and the loss of priority in power connection queues. |
| Reworded | Supply chain and inventory | Heading adds higher inventory, working capital and excess or obsolete inventory; text cites inventory charges already incurred. |
| Reworded | Litigation | Adds short seller reports, alleged inconsistencies across filings and calls, collection disputes and insurer coverage disputes. |
| Reworded | Net operating loss carryforwards | Heading wording only. |
| Reworded | Share sales | Heading drops 'future'; lock up text replaced by option and RSU counts at 30 Sep 2026: 15.6m Class A and 3.9m Class B under options, 15.2m Class A and 10.9m Class B under RSUs. |
| Filing | Change disclosed |
|---|---|
| 10-Q Q3 2026 filed 12 Nov 2026 | Item 1A restated in full: 69 factors against 70 in the prospectus; 2 added, 3 removed, 8 reworded. |
| 10-Q Q1 2026 filed 23 Jun 2026 and Q2 2026 filed 12 Aug 2026 | Not compared factor by factor; the Q3 2026 10-Q is compared directly with the prospectus. |
11 Stock Price, Scenarios & Sensitivity
- CBRS closed at $97.75 on 12 Nov 2026, the day of the Q3 2026 release. IPO price $185.00; first day close $312.66 on 14 May 2026, the highest close since listing; lowest close $81.71 on 5 Nov 2026. Month end closes: May $236.99, Jun $221.00, Jul $198.71, Aug $184.24, Sep $177.65, Oct $109.18.
- Valuation basis: EV/Sales. Market value $23.8bn on 243.0m Class A, B and N shares (5 Nov 2026, 10-Q cover); enterprise value $17.2bn after net cash of $6.53bn. EV/Sales 22.8x TTM revenue of $755.8m and 18.1x the FY2026 core revenue guidance midpoint of $950m. P/E is n/a on the TTM net loss.
- Scenario method: implied price equals TTM Q3 2029 revenue times an exit EV/Sales multiple, plus net cash of $6.53bn held at the 30 Sep 2026 level, divided by 291.6m shares (243.0m plus 20% for the unvested OpenAI and AWS warrants, options and RSUs). Revenue grows from TTM Q3 2026 $755.8m for three years. Net cash held flat is a simplification: 9M 2026 capex was $1.05bn.

Critical factors and core assumptions
| Factor | Current value | Best case requires | Evidence in filings |
|---|---|---|---|
| OpenAI capacity delivery | 750 MW committed; 700 gross MW of data center capacity secured for delivery by end 2027 | all tranches delivered on time; option for 1.25 GW more exercised | 424B4; 8-K Ex 99.1 of 12 Nov 2026 |
| RPO conversion | RPO $26.1bn, 33% within 24 months (30 Sep 2026) | conversion on the filed schedule, no service credits | Q3 2026 10-Q, Note 3 |
| Customer mix | MBZUAI 38%, OpenAI 34%, G42 7% of Q3 2026 revenue | hyperscaler deals (Oracle, AWS, an unnamed top three hyperscaler) add revenue outside the three | Q3 2026 10-Q risk factors; 8-K Ex 99.1 |
| Cloud margins | cloud GAAP gross margin 24.3%, core 46.9% (Q3 2026) | core gross margin at or above the 47% to 49% Q4 guidance | 8-K Ex 99.1 of 12 Nov 2026 |
| Manufacturing and supply | manufacturing capacity to exit 2026 above 10x the start of the year; TSMC wafers secured | CS4 and CS5 ramp without inventory charges | 8-K Ex 99.1 of 12 Aug and 12 Nov 2026 |
| Share supply | IPO lock up ended 9 Nov 2026; options and RSUs for 45.6m shares | dilution held near 20% over three years | 424B4; Q3 2026 10-Q |
- Revenue base TTM Q3 2026 $755.8m; FY2026 core revenue guidance $940m to $960m; CEO expects revenue to triple in 2027; RPO $26.1bn.
- Best case: 130% revenue CAGR as OpenAI tranches and hyperscaler deals arrive on schedule; exit EV/Sales 8x, below today's 22.8x and above CoreWeave 7.1x.
- Base case: 100% revenue CAGR, in line with a tripling in 2027 and slower growth after; exit EV/Sales 5x.
- Worst case: 50% revenue CAGR with capacity delays, service credits and lower MBZUAI orders; exit EV/Sales 3x.
- Shares up 20% from 243.0m through warrants, options and RSUs; no dividends or buybacks; net cash held at $6.53bn.
Scenarios, three years forward
| Measure | Worst case | Base case | Best case |
|---|---|---|---|
| Revenue CAGR, 3 years (%) | 50.0 | 100.0 | 130.0 |
| Revenue, TTM Q3 2029 ($bn) | 2.6 | 6.0 | 9.2 |
| Exit EV/Sales (x) | 3.0 | 5.0 | 8.0 |
| Implied price ($) | 49 | 126 | 275 |
| Change against $97.75 (%) | (50) | 29 | 181 |
| Implied annual return (%) | (20.8) | 8.8 | 41.1 |
| Description | Delivery delays; concentration losses | Revenue triples in 2027, slower after | OpenAI and hyperscaler capacity on schedule |

Sensitivity analysis
| Revenue CAGR \ EV/Sales | 3x | 4x | 5x | 6x | 8x |
|---|---|---|---|---|---|
| 50% | $49 | $57 | $66 | $75 | $92 |
| 75% | $64 | $78 | $92 | $106 | $134 |
| 100% | $85 | $105 | $126 | $147 | $188 |
| 115% | $100 | $125 | $151 | $177 | $228 |
| 130% | $117 | $149 | $180 | $212 | $275 |
Disclaimer
This analysis is for information only and is not financial advice. It is derived from public SEC filings retrieved via sec-api.io and is not a publication of the U.S. Securities and Exchange Commission. Scenario values are model outputs under stated assumptions and are not forecasts. Data as of 13 November 2026.
Sources
All company and peer figures are read from SEC filings retrieved through the sec-api.io MCP server. Share prices are regular session closes as dated in the text.
| Form | Period | Filed | Accession number |
|---|---|---|---|
| 8-K Ex 99.1 | Q3 2026 | 12 Nov 2026 | 0001628280-26-073366 |
| 10-Q | Q3 2026 | 12 Nov 2026 | 0001628280-26-073494 |
| 8-K Ex 99.1 | Q2 2026 | 12 Aug 2026 | 0001628280-26-056186 |
| 10-Q | Q2 2026 | 12 Aug 2026 | 0001628280-26-056357 |
| 8-K Ex 99.1 | Q1 2026 | 23 Jun 2026 | 0001628280-26-044941 |
| 10-Q | Q1 2026 | 23 Jun 2026 | 0001628280-26-044981 |
| 8-K | IPO closing | 15 May 2026 | 0001628280-26-035605 |
| 424B4 | FY2024 and FY2025, quarters Q1 2024 to Q4 2025 | 14 May 2026 | 0001628280-26-035214 |
| S-1 | FY2023 | 30 Sep 2024 | 0001628280-24-041596 |
| Company | Form | Filed | Accession number |
|---|---|---|---|
| AMD | 8-K Ex 99.1 | 3 Nov 2026 | 0000002488-26-000188 |
| Alphabet | 10-Q | 28 Oct 2026 | 0001652044-26-000084 |
| Altimeter (Brad Gerstner) | Schedule 13G | 14 Aug 2026 | 0001541617-26-000009 |
| Andrew Feldman | Schedule 13G | 14 Aug 2026 | 0001493152-26-038435 |
| Atreides Management | Schedule 13G | 14 Aug 2026 | 0001777813-26-000008 |
| Benchmark Capital VIII entities | Schedule 13G | 14 Aug 2026 | 0001104659-26-097224 |
| Broadcom | 8-K Ex 99.1 | 2 Sep 2026 | 0001730168-26-000076 |
| Coatue Management | Schedule 13G | 14 Aug 2026 | 0000919574-26-005577 |
| CoreWeave | 8-K Ex 99.1 | 10 Nov 2026 | 0001769628-26-000461 |
| Eclipse (Lior Susan) | Schedule 13D/A | 18 Aug 2026 | 0001193125-26-355477 |
| FMR LLC | Schedule 13G/A | 5 Nov 2026 | 0000315066-26-002909 |
| Foundation Capital VIII entities | Schedule 13G/A | 12 Nov 2026 | 0001645076-26-000007 |
| IREN | 8-K Ex 99.1 and 10-Q | 5 Nov 2026 | 0001878848-26-000065 |
| Intel | 8-K Ex 99.1 | 29 Oct 2026 | 0000050863-26-000188 |
| Jane Street Group | Schedule 13G/A | 6 Nov 2026 | 0001595888-26-000136 |
| Microsoft | 10-Q | 28 Oct 2026 | 0001193125-26-436133 |
| NVIDIA | 8-K Ex 99.1 | 26 Aug 2026 | 0001045810-26-000073 |
| Nebius | 6-K Ex 99.1 | 12 Aug 2026 | 0001104659-26-094568 |
| Oracle | 10-Q | 11 Sep 2026 | 0001193125-26-389274 |
| Filed | Exhibit | Document | Content |
|---|---|---|---|
| 15 May 2026 | Ex 3.1 | Amended and restated certificate of incorporation | Effective at the IPO closing on 15 May 2026: authorized shares of 3.5bn Class A, 240m Class B and 100m Class N; Class A 1 vote, Class B 20 votes, Class N no votes per share; classified board with three year terms |
| 15 May 2026 | Ex 3.2 | Amended and restated bylaws | Effective at the IPO closing on 15 May 2026; 8-K Item 8.01: IPO of 34.5m Class A shares at $185.00, gross proceeds $6.4bn |
| 23 Jun 2026 | Ex 99.1 | Q1 2026 results release | Revenue $193.4m (+94%), core revenue $191.3m (+92%); hardware $110.6m, cloud and other services $82.8m (+178%); OpenAI deal for 750 MW valued at more than $20bn; AWS partnership; FY2026 core revenue guidance $855m to $865m |
| 12 Aug 2026 | Ex 99.1 | Q2 2026 results release | Revenue $180.1m (+74%), core revenue $209.9m (+103%); cloud and other services $126.0m (+281%); RPO $25.4bn; more than 600 MW live and under contract; FY2026 core revenue guidance raised to $880m to $890m |
| 12 Nov 2026 | Ex 99.1 | Q3 2026 results release | Revenue $210.8m (+55%), core revenue $230.9m (+70%); cloud and other services $141.9m (+265%); GAAP operating margin (106%), core (14%); RPO $26.1bn; 700 MW under contract for delivery by end 2027; FY2026 core revenue guidance $940m to $960m |
| 12 Nov 2026 | Ex 10.1 | Amendment No. 1 to MBZUAI purchase order of 30 Dec 2025 (10-Q exhibit) | Signed 18 Sep 2026: some inference CS3 systems swapped for a training and inference CS3 cluster; total contract value and unit cost unchanged; Cluster not for use in the US and not to be delivered to the UAE; title passes at a storage facility; Cerebras acts as exporter of record |