CrowdStrike Holdings, Inc. (CRWD), Financial Analysis
Insights derived from analysing SEC filings. Independent analysis, not a publication of the SEC.
Figures are read from the Forms 10-K for FY2022 to FY2026, the Forms 10-Q for Q3 FY2025 to Q2 FY2027, the Forms 8-K of March 2023 to August 2026 with their quarterly earnings exhibits 99.1, the proxy statements of May 2025 and May 2026, the Form 424B4 prospectus of June 2019, Schedules 13G, Forms 13F and Forms 4 and 144 on the record for central index key 1535527, together with the comparable filings of six peers. Accession numbers for every filing used appear in the Sources appendix. Market prices are closing prices of 9 October 2026.
CrowdStrike (CRWD) closed at $275.04 on 9 October 2026, 51.4x enterprise value (EV) to sales of the trailing twelve months (TTM), against a peer median of 15.5x. Q2 FY2027 revenue rose 25.8% to $1.47bn, net new annual recurring revenue (ARR) rose 51% to $332.8m and GAAP operating loss was $33.2m.
All share counts, per share figures and prices are on the basis after the four for one split effective after the close on 1 July 2026; annual meeting vote counts are as filed, before the split.
Key findings
- Q2 FY2027 (quarter ended 31 July 2026) revenue was $1.47bn, up 25.8% year on year; ending ARR, the annualized value of subscription contracts, was $5.84bn, up 25%, and guidance of 26 August 2026 puts FY2027 net new ARR growth at 34.0% at midpoint against 22.5% on 3 March 2026.
- GAAP operating loss was $33.2m, (2.3)% of revenue, against $105.5m a year earlier, and non GAAP operating income was $371.6m, 25.3% of revenue; the two measures differ mainly by stock based compensation (SBC) and related employer payroll taxes of $399.0m, 27.1% of revenue.
- Net cash was $4.27bn at 31 July 2026 and TTM free cash flow (FCF, operating cash flow less purchases of property and equipment and capitalized internal use software) was $1.53bn, 28.3% of revenue; remaining performance obligations (RPO) rose 48.6% to $10.7bn and non cancelable purchase obligations were $4.14bn, with $2.9bn more committed after 31 July 2026.
- At $275.04 shares trade at 51.4x EV / sales and 184.6x price to FCF (P / FCF), against medians of 15.5x and 66.1x for six security software peers; TTM diluted GAAP EPS is $0.04, at which P / E is not meaningful (n/m).
- At the annual meeting of 17 June 2026 the advisory ratification of supermajority voting provisions received 24.0m votes for and 144.9m against (14.2% of for plus against); directors Johanna Flower and Denis J. O'Leary were elected with 131.0m and 104.3m votes for and 39.0m and 65.7m withheld (77.0% and 61.3% for).
- The proxy of 5 May 2026 reports FY2026 total compensation of the Chief Executive Officer of $247.58m, of which $242.12m is grant date fair value of stock awards, and a pay ratio of 1,391 to 1.
- Forms 4 report open market sales of 4.10m shares for $759.34m and open market purchases of 0 in the twelve months to 10 October 2026, of which 1.71m shares for $419.85m from 1 August to 7 October 2026; Form 144 notices in the same twelve months cover 14.99m shares at $2.09bn stated market value.
- Of four groups of lawsuits over the 19 July 2024 outage, three ended in dismissal by 15 June 2026 and the Delta case filed on 25 October 2024 is in discovery; the 10-Q reports information requests from the Department of Justice and the SEC and states the company is cooperating.
- Three sets of stated assumptions for FY2028 to FY2030 give arithmetic outcomes of $67, $263 and $748 per share at end FY2030.
Table 0.1 CrowdStrike at a glance
| Measure | Value | Basis |
|---|---|---|
Share price | $275.04 | Close, 9 October 2026 |
Market cap | $281.6bn | 1.02bn shares, 10-Q cover, 20 August 2026 |
Net cash | $4.27bn | Cash and investments $5.01bn less senior notes $746m, 31 July 2026 |
EV | $277.4bn | Market cap less net cash |
TTM revenue | $5.40bn | Q3 FY2026 to Q2 FY2027 |
TTM revenue growth | 24.3% | Against the prior four quarters; Q2 FY2027: 25.8% |
Operating margin, Q2 FY2027 | (2.3)% GAAP; 25.3% non GAAP | Non GAAP as reported by the company |
TTM FCF margin | 28.3% | FCF of $1.53bn |
Ending ARR | $5.84bn | 31 July 2026; up 25% year on year |
RPO | $10.7bn | 31 July 2026; 46% due within 12 months |
EV / sales | 51.4x | TTM revenue; peer median 15.5x |
P / FCF | 184.6x | Market cap over TTM FCF; peer median 66.1x |
TTM diluted GAAP EPS | $0.04 | Q3 FY2026 to Q2 FY2027; P / E n/m |
Diluted shares | 1.04bn | Q2 FY2027 weighted average |
Source: 10-Q Q2 FY2027, 8-K Exhibit 99.1 of 26 August 2026, SEC filings via SEC-API.io; Market data, 9 October 2026
1 Revenue & Business Model
Subscriptions supplied 95.2% of Q2 FY2027 revenue of $1.47bn, which rose 25.8% year on year, and ending ARR reached $5.84bn, up 25%.
CrowdStrike business model and revenue model
CrowdStrike sells one product family, the Falcon cybersecurity platform, as a subscription. Falcon Flex, a licensing model under which a customer commits spend upfront and draws it down across modules, carried more than $2.29bn of ending ARR at 31 July 2026, 39.2% of the total.
Table 1.1 Business model as filed
| Item | As filed |
|---|---|
| Product | Falcon platform: 32 cloud modules at 31 January 2026 and 33 at the 10-K filing date of 4 March 2026 (29 at the FY2025 10-K filing date), delivered as software as a service through one sensor |
| Pricing units | Per endpoint, identity, cloud sensor, user, device and gigabyte of daily ingestion |
| Revenue recognition | Subscriptions ratably over terms of generally one to three years, invoiced mostly at the start of the term; professional services as performed |
| Sales channel | Direct sales team working through resellers, distributors, managed security service providers, system integrators and cloud marketplaces |
| Customers | More than 88,000 organizations at 31 January 2026 (more than 74,000 a year earlier), including end customers of managed security service providers |
| Customers or channel partners at 10% of revenue or more | 0 in Q2 FY2027, H1 FY2027, FY2026, FY2025 and FY2024 |
| Reportable segments | 1 |
| Infrastructure | Data center co location facilities in the United States and Europe plus third party data centers in both regions |
| Full time employees | 11,706 at 31 July 2026; 10,698 at 31 January 2026 |
| Customer commitment packages after the 19 July 2024 incident | Discounts, added modules, professional services, flexible payment terms or longer subscription periods; the 10-Q reports increased contraction and lower upsell values as a result |
| Changes in definitions and comparatives | FY2025 and FY2024 statements revised in the FY2026 10-K for an immaterial error, with revenue unchanged; about $26.0m excluded from ARR in Q3 FY2025 after a notice from a federal distributor |
Source: 10-K FY2026, 10-K FY2025, 10-Q Q2 FY2027, 10-Q Q3 FY2025 (SEC filings via SEC-API.io)
Revenue by type: subscription and professional services

Table 1.2 Revenue by type, FY2022 to H1 FY2027
| Revenue | FY2022 | FY2023 | FY2024 | FY2025 | FY2026 | H1 FY2026 | H1 FY2027 |
|---|---|---|---|---|---|---|---|
Subscription | $1.36bn | $2.11bn | $2.87bn | $3.76bn | $4.56bn | $2.15bn | $2.72bn |
Professional services | $92m | $130m | $185m | $192m | $247m | $119m | $135m |
Total | $1.45bn | $2.24bn | $3.06bn | $3.95bn | $4.81bn | $2.27bn | $2.86bn |
Total, growth year on year | n/a | 54% | 36% | 29% | 22% | n/a | 26% |
Subscription share | 93.7% | 94.2% | 93.9% | 95.1% | 94.9% | 94.8% | 95.3% |
Source: 10-K FY2026, 10-K FY2024, 10-Q Q2 FY2027 (SEC filings via SEC-API.io)
Revenue by region
United States share of revenue was 64.9% in Q2 FY2027 against 67.1% a year earlier, as revenue from Europe, Middle East and Africa rose 40%.

Table 1.3 Revenue by region, FY2022 to H1 FY2027
| Region | FY2022 | FY2023 | FY2024 | FY2025 | FY2026 | H1 FY2027 | FY2026 growth | H1 FY2027 growth | Q2 FY2027 growth |
|---|---|---|---|---|---|---|---|---|---|
United States | $1.05bn | $1.56bn | $2.09bn | $2.68bn | $3.22bn | $1.87bn | 20% | 22% | 22% |
Europe, Middle East and Africa | $200m | $328m | $468m | $619m | $783m | $499m | 26% | 37% | 40% |
Asia Pacific | $143m | $228m | $316m | $402m | $496m | $304m | 23% | 32% | 34% |
Other | $62m | $122m | $184m | $249m | $317m | $185m | 27% | 23% | 21% |
Total | $1.45bn | $2.24bn | $3.06bn | $3.95bn | $4.81bn | $2.86bn | 22% | 26% | 26% |
Source: 10-K FY2026, 10-K FY2024, 10-Q Q2 FY2027 (SEC filings via SEC-API.io)
ARR, net new ARR, retention and module adoption
Net new ARR was $332.8m in Q2 FY2027, up 51% year on year, and the 10-Q states that dollar based net retention improved on the prior quarter.

Table 1.4 Quarterly revenue, ARR and contract balances, Q3 FY2025 to Q2 FY2027
| Metric | Q3 FY2025 | Q4 FY2025 | Q1 FY2026 | Q2 FY2026 | Q3 FY2026 | Q4 FY2026 | Q1 FY2027 | Q2 FY2027 |
|---|---|---|---|---|---|---|---|---|
Revenue | $1.01bn | $1.06bn | $1.10bn | $1.17bn | $1.23bn | $1.31bn | $1.39bn | $1.47bn |
Ending ARR | $4.02bn | $4.24bn | $4.44bn | $4.66bn | $4.92bn | $5.25bn | $5.51bn | $5.84bn |
ARR growth year on year | 27% | 23% | 22% | 20% | 23% | 24% | 24% | 25% |
Net new ARR (Q4 = change in ARR) | $153.0m | $224.3m | $193.8m | $221.1m | $265.3m | $330.7m | $255.8m | $332.8m |
RPO | $5.4bn | $6.5bn | $6.8bn | $7.2bn | $7.9bn | $9.0bn | $8.8bn | $10.7bn |
RPO due within 12 months | 57% | 53% | 52% | 52% | 51% | 51% | 52% | 46% |
Deferred revenue | $3.20bn | $3.73bn | $3.77bn | $3.83bn | $4.06bn | $4.75bn | $4.72bn | $4.84bn |
Backlog (contracted, still to be invoiced) | $2.2bn | $2.8bn | $3.0bn | $3.3bn | $3.8bn | $4.2bn | $4.0bn | $5.9bn |
Source: 10-Q Q2 FY2027, 10-Q Q1 FY2027, 10-K FY2026, 10-Q Q3 FY2026, 10-Q Q2 FY2026, 10-Q Q1 FY2026, 10-K FY2025, 10-Q Q3 FY2025 (SEC filings via SEC-API.io)
Table 1.5 Module adoption and Falcon Flex ARR
| Metric | Jul 2025 | Oct 2025 | Jan 2026 | Apr 2026 | Jul 2026 |
|---|---|---|---|---|---|
Subscription customers with 6 or more modules | 48% | 49% | 50% | 51% | 51% |
With 7 or more modules | 33% | 34% | 34% | 35% | 35% |
With 8 or more modules | 23% | 24% | 24% | 25% | 26% |
Ending ARR from Falcon Flex accounts | n/a | above $1.35bn | $1.69bn | n/a | above $2.29bn |
Falcon Flex ARR growth year on year | n/a | more than 200% | over 120% | n/a | 101% |
Source: 8-K 26 Aug 2026, 8-K 3 Jun 2026, 8-K 3 Mar 2026, 8-K 2 Dec 2025, 8-K 27 Aug 2025 (SEC filings via SEC-API.io)
RPO, deferred revenue and purchase commitments
RPO rose 48.6% year on year to $10.7bn at 31 July 2026, with 46% due within 12 months against 52% a year earlier. Non cancelable purchase obligations, which include data center capacity, were $4.14bn against $2.77bn six months earlier (schedule in Table 5.3).

Table 1.6 ARR, retention, RPO and purchase obligations at period end (deferred revenue in Tables 1.4 and 2.5)
| Metric | Jan 2022 | Jan 2023 | Jan 2024 | Jan 2025 | Jan 2026 | Jul 2026 |
|---|---|---|---|---|---|---|
Ending ARR | $1.73bn | $2.56bn | $3.44bn | $4.24bn | $5.25bn | $5.84bn |
Dollar based net retention rate | 124% | 125% | 119% | 112% | 115% | n/a |
RPO | $2.3bn | $3.4bn | $4.6bn | $6.5bn | $9.0bn | $10.7bn |
RPO due within 12 months | 65% | 63% | 60% | 53% | 51% | 46% |
Non cancelable purchase obligations | $178m | $271m | $748m | $2.69bn | $2.77bn | $4.14bn |
Source: 10-Q Q2 FY2027, 10-K FY2026, 10-K FY2025, 10-K FY2024, 10-K FY2023, 10-K FY2022 (SEC filings via SEC-API.io)
2 Financial Analysis & Ratios
Q2 FY2027 revenue rose 25.8% year on year to $1.47bn, GAAP operating loss narrowed to $33.2m from $105.5m and FCF was $379m, 25.8% of revenue (10-Q Q2 FY2027). Non GAAP operating income of $371.6m excludes $399.0m of SBC and related employer payroll taxes, 27.1% of revenue; GAAP operating margin was (2.3)% and non GAAP operating margin 25.3%.
CrowdStrike Q2 FY2027 results year on year
Table 2.1 What changed, Q2 FY2027 and H1 FY2027 against prior year (prior year as revised)
| Metric | Q2 FY2027 | Q2 FY2026 | Change | H1 FY2027 | H1 FY2026 | Change |
|---|---|---|---|---|---|---|
Revenue, $bn | 1.47 | 1.17 | 25.8% | 2.86 | 2.27 | 25.7% |
Subscription revenue, $bn | 1.40 | 1.10 | 27.0% | 2.72 | 2.15 | 26.3% |
Gross profit, $bn | 1.10 | 0.86 | 27.5% | 2.14 | 1.68 | 27.7% |
Research and development, $m | 444 | 343 | 29.7% | 853 | 673 | 26.6% |
Sales and marketing, $m | 510 | 447 | 14.2% | 999 | 886 | 12.7% |
General and administrative, $m | 176 | 177 | (0.4)% | 353 | 341 | 3.5% |
Operating income (loss), $m | (33.2) | (105.5) | $72.2m | (63.8) | (224.2) | $160m |
Non GAAP operating income, $m | 372 | 255 | 45.8% | 697 | 456 | 52.9% |
Net income (loss) attributable to CrowdStrike, $m | 5.3 | (70.2) | $75.5m | 33.1 | (174.4) | $207m |
Non GAAP net income, $m | 323 | 237 | 36.0% | 606 | 422 | 43.7% |
Diluted EPS, $ | 0.01 | (0.07) | $0.08 | 0.03 | (0.17) | $0.20 |
Non GAAP diluted EPS, $ | 0.31 | 0.23 | $0.08 | 0.58 | 0.41 | $0.17 |
Gross margin | 74.6% | 73.6% | 1.0 pts | 74.9% | 73.8% | 1.2 pts |
Subscription gross margin | 77.8% | 77.1% | 0.7 pts | 78.0% | 77.1% | 0.9 pts |
Operating margin | (2.3)% | (9.0)% | 6.8 pts | (2.2)% | (9.9)% | 7.6 pts |
Non GAAP operating margin | 25.3% | 21.8% | 3.5 pts | 24.4% | 20.1% | 4.3 pts |
Net margin | 0.4% | (6.0)% | 6.4 pts | 1.2% | (7.7)% | 8.8 pts |
Operating cash flow, $bn | 0.53 | 0.33 | 59.3% | 1.12 | 0.72 | 56.4% |
Capital expenditure, $m | 150.9 | 47.8 | 215.8% | 271.1 | 151.0 | 79.6% |
FCF, $m | 379 | 285 | 33.1% | 850 | 566 | 50.2% |
FCF margin | 25.8% | 24.4% | 1.4 pts | 29.8% | 24.9% | 4.9 pts |
FCF as defined by CrowdStrike (also deducts net purchases of deferred compensation investments), $m | 377 | 284 | 33.1% | 846 | 563 | 50.2% |
SBC, $m | 377 | 280 | 34.8% | 675 | 527 | 27.9% |
SBC as % of revenue | 25.6% | 23.9% | 1.7 pts | 23.6% | 23.2% | 0.4 pts |
July 19 Incident costs (recoveries), net, $m | (14.5) | 35.7 | ($50.2m) | 3.6 | 75.4 | (95.2)% |
Strategic plan charges, $m | 0 | 38.4 | ($38.4m) | 0 | 45.0 | ($45.0m) |
Acquisitions, net of cash acquired, $m | 0 | 0 | 0 | 881 | 0 | $881m |
Share repurchases, $m | 0 | 0 | 0 | 175.6 | 0 | $176m |
Diluted shares, bn | 1.044 | 1.000 | 4.5% | 1.038 | 0.997 | 4.1% |

Table 2.2 Quarterly financials, Q1 FY2026 to Q2 FY2027 (FY2026 quarters as revised; Q3 FY2026 is FY2026 less H1 and Q4)
| Line | Q1 FY2026 | Q2 FY2026 | Q3 FY2026 | Q4 FY2026 | Q1 FY2027 | Q2 FY2027 |
|---|---|---|---|---|---|---|
Revenue, $bn | 1.10 | 1.17 | 1.23 | 1.31 | 1.39 | 1.47 |
Revenue growth year on year | 19.8% | 21.3% | 22.2% | 23.3% | 25.6% | 25.8% |
Gross margin | 73.9% | 73.6% | 75.2% | 75.8% | 75.3% | 74.6% |
Subscription gross margin | 77.0% | 77.1% | 78.0% | 78.7% | 78.2% | 77.8% |
Operating income (loss), $m (Q3 FY2026 as first reported: (69.4)) | (118.7) | (105.5) | (62.2) | (6.9) | (30.6) | (33.2) |
Operating margin | (10.8)% | (9.0)% | (5.0)% | (0.5)% | (2.2)% | (2.3)% |
Non GAAP operating income, $m | 201 | 255 | 265 | 326 | 326 | 372 |
Non GAAP operating margin | 18.2% | 21.8% | 21.4% | 25.0% | 23.5% | 25.3% |
Net income (loss) attributable to CrowdStrike, $m | (104.3) | (70.2) | (26.8) | 38.7 | 27.8 | 5.3 |
Diluted EPS, $ | (0.10) | (0.07) | (0.03) | 0.04 | 0.03 | 0.01 |
Non GAAP diluted EPS, $ | 0.18 | 0.23 | 0.24 | 0.28 | 0.27 | 0.31 |
Operating cash flow, $m | 384 | 333 | 398 | 498 | 591 | 530 |
Capital expenditure, $m | 103.2 | 47.8 | 100.2 | 119.7 | 120.2 | 150.9 |
FCF, $m | 281 | 285 | 297 | 378 | 471 | 379 |
FCF margin | 25.5% | 24.4% | 24.1% | 29.0% | 34.0% | 25.8% |
SBC, $m | 248 | 280 | 275 | 295 | 298 | 377 |
SBC as % of revenue | 22.4% | 23.9% | 22.3% | 22.6% | 21.5% | 25.6% |
July 19 Incident costs (recoveries), net, $m | 39.7 | 35.7 | 26.2 | 16.2 | 18.1 | (14.5) |
Strategic plan charges (benefits), $m | 6.6 | 38.4 | 0.5 | (0.7) | 0 | 0 |
Cash and cash equivalents, $bn | 4.61 | 4.97 | 4.80 | 5.23 | 4.55 | 5.01 |
Stockholders equity, $bn | 3.45 | 3.76 | 4.02 | 4.43 | 4.63 | 5.10 |
Diluted shares, bn | 0.994 | 1.000 | 1.005 | 1.033 | 1.032 | 1.044 |
Source: 10-Q Q1 FY2027, 10-Q Q2 FY2027, 10-Q Q3 FY2026, 10-K FY2026, 10-Q Q2 FY2026, 10-Q Q1 FY2026; 8-K Exhibit 99.1 of 3 June 2025, 27 August 2025, 2 December 2025, 3 March 2026, 3 June 2026, 26 August 2026
CrowdStrike GAAP and non GAAP operating income
Costs of the 19 July 2024 Falcon sensor outage (July 19 Incident) total $181m since FY2025; Q2 FY2027 carried a net recovery of $14.5m. FY2026 10-K revised FY2024 and FY2025 for timing of SBC expense, lowering the FY2024 operating result by $17.1m (10-K FY2026).

Table 2.3 GAAP to non GAAP operating income and net income, $m
| Line, $m | Q2 FY2027 | Q2 FY2026 | H1 FY2027 | H1 FY2026 |
|---|---|---|---|---|
GAAP loss from operations | (33.2) | (105.5) | (63.8) | (224.2) |
Stock based compensation and related employer payroll taxes | 399.0 | 276.7 | 716.6 | 542.3 |
Amortization of acquired intangible assets | 13.3 | 7.6 | 25.7 | 15.3 |
Acquisition related expenses, net | 6.7 | 1.3 | 14.2 | 1.8 |
Mark to market on deferred compensation liabilities | 0.5 | 0.8 | 1.0 | 0.5 |
July 19 Incident costs (recoveries), net | (14.5) | 35.7 | 3.6 | 75.4 |
Strategic plan related charges | 0.0 | 38.4 | 0.0 | 45.0 |
Non GAAP income from operations | 371.6 | 255.0 | 697.3 | 456.1 |
GAAP net income (loss) attributable to CrowdStrike | 5.3 | (70.2) | 33.1 | (174.4) |
Non GAAP income tax adjustments | (87.2) | (52.6) | (169.5) | (85.1) |
Gains on strategic investments attributable to CrowdStrike | 0.0 | 0.0 | (18.2) | 0.8 |
Non GAAP net income attributable to CrowdStrike | 322.9 | 237.4 | 606.3 | 422.1 |
Table 2.4 One off items disclosed, FY2022 to FY2026 (FY2027 quarters in Tables 2.2 and 2.3)
| Period | Item | Charge or (gain), $m |
|---|---|---|
FY2026 | July 19 Incident costs, net | 117.7 |
FY2026 | Strategic plan charges, net (about 500 positions, 5% of workforce) | 44.8 |
FY2025 | July 19 Incident costs, net | 60.1 |
FY2025 | Prior period SBC revision, effect on operating result | (4.0) |
FY2024 | Prior period SBC revision, effect on operating result | 17.1 |
FY2024 | Legal reserve and settlement charges | 7.8 |
FY2022 | Legal reserve and settlement charges | 9.5 |
Source: 8-K Exhibit 99.1 of 3 March 2026, 8-K Exhibit 99.1 of 4 March 2025, 8-K Exhibit 99.1 of 7 March 2023; 10-K FY2026
CrowdStrike income statement, balance sheet and cash flow, five years
Table 2.5 Income statement, balance sheet and cash flow, FY2022 to FY2026 (FY2024 to FY2026 as revised)
| Line | FY2022 | FY2023 | FY2024 | FY2025 | FY2026 |
|---|---|---|---|---|---|
Revenue, $bn | 1.45 | 2.24 | 3.06 | 3.95 | 4.81 |
Gross profit, $bn | 1.07 | 1.64 | 2.30 | 2.96 | 3.59 |
Research and development, $bn | 0.37 | 0.61 | 0.78 | 1.08 | 1.38 |
Sales and marketing, $bn | 0.62 | 0.90 | 1.14 | 1.52 | 1.83 |
General and administrative, $m | 223 | 317 | 395 | 481 | 670 |
Operating income (loss), $m | (142.5) | (190.1) | (19.1) | (116.4) | (293.3) |
Non GAAP operating income, $bn | 0.20 | 0.36 | 0.66 | 0.88 | 1.05 |
Interest income, $m | 3.8 | 52.5 | 148.9 | 196.2 | 195.0 |
Interest expense, $m | 25.2 | 25.3 | 25.8 | 26.3 | 28.0 |
Income tax, $m | 72.4 | 22.4 | 32.2 | 71.1 | 34.2 |
Net income (loss) attributable to CrowdStrike, $m | (234.8) | (183.2) | 72.2 | (15.2) | (162.5) |
Non GAAP net income, $m | 161 | 368 | 752 | 815 | 957 |
Operating cash flow, $bn | 0.57 | 0.94 | 1.17 | 1.38 | 1.61 |
Purchases of property and equipment, $m | 112 | 235 | 177 | 255 | 302 |
Capitalized internal use software, $m | 20.9 | 29.1 | 49.5 | 59.0 | 68.8 |
FCF, $bn (FCF as defined by CrowdStrike: same at two decimals) | 0.44 | 0.68 | 0.94 | 1.07 | 1.24 |
SBC, $bn | 0.31 | 0.53 | 0.65 | 0.86 | 1.10 |
Acquisitions, net of cash acquired, $m | 415 | 18 | 239 | 310 | 382 |
Share repurchases, $m | 0 | 0 | 0 | 0 | 0 |
Cash and short term investments, $bn | 2.00 | 2.71 | 3.47 | 4.32 | 5.23 |
Senior notes (3.00%, due February 2029), $m | 740 | 741 | 742 | 744 | 745 |
Accounts receivable, $bn | 0.37 | 0.63 | 0.85 | 1.13 | 1.36 |
Goodwill, $bn | 0.42 | 0.43 | 0.64 | 0.91 | 1.36 |
Total assets, $bn | 3.62 | 5.03 | 6.65 | 8.70 | 11.09 |
Deferred revenue, $bn | 1.53 | 2.36 | 3.05 | 3.73 | 4.75 |
Total liabilities, $bn | 2.58 | 3.54 | 4.31 | 5.38 | 6.61 |
Stockholders equity, $bn | 1.03 | 1.46 | 2.30 | 3.28 | 4.43 |
Source: 10-K FY2022, 10-K FY2023, 10-K FY2024, 10-K FY2025, 10-K FY2026; 8-K Exhibit 99.1 of 7 March 2023, 5 March 2024, 4 March 2025, 3 March 2026

CrowdStrike ratio analysis
Table 2.6 Ratios, FY2022 to FY2026 and TTM (Q3 FY2026 to Q2 FY2027); non GAAP FY2022 to FY2024 as published before the FY2026 change in method
| Ratio | FY2022 | FY2023 | FY2024 | FY2025 | FY2026 | TTM Q2 FY2027 |
|---|---|---|---|---|---|---|
Revenue growth | 66.0% | 54.4% | 36.3% | 29.4% | 21.7% | 24.3% |
Gross margin | 73.6% | 73.2% | 75.2% | 75.0% | 74.7% | 75.2% |
Subscription gross margin | 76.3% | 75.8% | 78.0% | 77.8% | 77.7% | 78.2% |
Operating margin | (9.8)% | (8.5)% | (0.6)% | (2.9)% | (6.1)% | (2.5)% |
Non GAAP operating margin | 13.5% | 15.9% | 21.6% | 22.3% | 21.7% | 23.9% |
Net margin | (16.2)% | (8.2)% | 2.4% | (0.4)% | (3.4)% | 0.8% |
FCF margin | 30.4% | 30.2% | 30.8% | 27.0% | 25.8% | 28.3% |
SBC as % of revenue | 21.4% | 23.5% | 21.2% | 21.8% | 22.8% | 23.1% |
Research and development as % of revenue | 25.6% | 27.1% | 25.5% | 27.2% | 28.8% | 29.0% |
Sales and marketing as % of revenue | 42.5% | 40.4% | 37.3% | 38.5% | 38.1% | 36.0% |
ROE (net income over average equity) | (24.8)% | (14.7)% | 3.8% | (0.5)% | (4.2)% | 1.0% |
ROIC (return on invested capital: operating income taxed at 21% over average debt plus equity) | (6.7)% | (7.6)% | (0.6)% | (2.6)% | (5.0)% | (2.0)% |
ROA (net income over average assets) | (7.4)% | (4.2)% | 1.2% | (0.2)% | (1.6)% | 0.4% |
Current ratio | 1.83x | 1.73x | 1.76x | 1.77x | 1.77x | 1.57x |
Debt to equity | 0.72x | 0.51x | 0.32x | 0.23x | 0.17x | 0.15x |
Net cash, $bn | 1.26 | 1.96 | 2.73 | 3.58 | 4.48 | 4.27 |
Interest cover (operating income over interest expense) | (5.6)x | (7.5)x | (0.7)x | (4.4)x | (10.5)x | (5.0)x |
Interest cover on non GAAP operating income | 7.8x | 14.0x | 25.6x | 33.4x | 37.3x | 48.3x |
DSO (days sales outstanding: period end receivables over revenue times 365) | 93 | 102 | 102 | 104 | 103 | 70 |
Inventory, $m | 0 | 0 | 0 | 0 | 0 | 0 |
Asset turnover | 0.46x | 0.52x | 0.52x | 0.52x | 0.49x | 0.51x |
Capital expenditure as % of revenue | 9.2% | 11.8% | 7.4% | 7.9% | 7.7% | 9.1% |
Diluted EPS, $ | (0.26) | (0.20) | 0.07 | (0.02) | (0.16) | 0.04 |
Non GAAP diluted EPS, $ | 0.17 | 0.39 | 0.77 | 0.81 | 0.93 | 1.10 |
FCF per diluted share, $ | 0.49 | 0.73 | 0.96 | 1.09 | 1.24 | 1.46 |
Diluted shares, bn | 0.909 | 0.933 | 0.975 | 0.979 | 1.002 | 1.044 |
Basic weighted shares, growth year on year (last column: Q2 FY2027 against Q2 FY2026) | 4.3% | 2.6% | 2.4% | 2.6% | 2.4% | 2.0% |
Share repurchases as % of FCF | 0.0% | 0.0% | 0.0% | 0.0% | 0.0% | 11.5% |
Dividends, $m | 0 | 0 | 0 | 0 | 0 | 0 |
Deferred revenue growth | 67.7% | 54.0% | 29.7% | 22.1% | 27.5% | 26.3% |
RPO growth | n/a | 47.8% | 35.3% | 41.3% | 38.5% | 48.6% |
Source: 10-K FY2022, 10-K FY2023, 10-K FY2024, 10-K FY2025, 10-K FY2026; 8-K Exhibit 99.1 of 7 March 2023, 5 March 2024, 4 March 2025, 3 March 2026; 10-Q Q2 FY2027, 10-Q Q2 FY2026; 8-K Exhibit 99.1 of 26 August 2026
CrowdStrike share repurchases, dilution and net cash
H1 FY2027 share repurchases of $176m for 1.92m shares equal 20.7% of FCF against SBC of $675m; basic weighted shares rose 2.0% in Q2 FY2027 against Q2 FY2026 and $1.30bn remains authorized. Net cash was $4.27bn at 31 July 2026 after $881m paid for Seraphic and SGNL in Q1 FY2027.

3 MD&A & Management Commentary
CrowdStrike raised FY2027 guidance twice: midpoint growth in net new ARR moved from 22.5% on 3 March 2026 to 27.7% on 3 June and 34.0% on 26 August 2026, and Q2 FY2027 revenue of $1.471bn was 2.2% above guidance midpoint.
CrowdStrike guidance against actual results
Revenue closed above the top of the guided range in five of six quarters, by 0.4% to 2.0%; Q1 FY2026 revenue of $1.103bn fell inside its range.
Table 3.1 Quarterly guidance against reported result, Q1 FY2026 to Q3 FY2027
| Quarter | Guidance issued | Revenue guidance | Revenue reported | Against midpoint | Non GAAP income from operations, guidance | Reported | Non GAAP EPS diluted, guidance (split adjusted) | Reported |
|---|---|---|---|---|---|---|---|---|
Q1 FY2026 | 4 March 2025 | $1.101bn to $1.106bn | $1.103bn | 0.0% | $173.1m to $180.0m | $201.1m | $0.160 to $0.165 | $0.183 |
Q2 FY2026 | 3 June 2025 | $1.145bn to $1.152bn | $1.169bn | 1.8% | $226.9m to $233.1m | $255.0m | $0.205 to $0.210 | $0.233 |
Q3 FY2026 | 27 August 2025 | $1.208bn to $1.218bn | $1.234bn | 1.8% | $256.0m to $262.0m | $264.6m | $0.233 to $0.238 | $0.240 |
Q4 FY2026 | 2 December 2025 | $1.290bn to $1.300bn | $1.305bn | 0.8% | $315.4m to $319.4m | $325.8m | $0.273 to $0.278 | $0.280 |
Q1 FY2027 | 3 March 2026 | $1.360bn to $1.364bn | $1.386bn | 1.7% | $308.0m to $310.4m | $325.7m | $0.265 to $0.268 | $0.275 |
Q2 FY2027 | 3 June 2026 | $1.436bn to $1.442bn | $1.471bn | 2.2% | $345.6m to $349.1m | $371.6m | $0.290 to $0.293 | $0.31 |
Q3 FY2027 | 26 August 2026 | $1.523bn to $1.529bn | n/a | n/a | $372.7m to $375.9m | n/a | $0.31 | n/a |
Source: 8-K Exhibit 99.1 releases of 4 March 2025, 3 June 2025, 27 August 2025, 2 December 2025, 3 March 2026, 3 June 2026, 26 August 2026

FY2027 guidance changes and net new ARR outlook
Guidance of 26 August 2026 implies Q4 FY2027 net new ARR of about $421m at midpoints, 27% above Q4 FY2026, and Q4 revenue of about $1.62bn, up 24.0%.
Table 3.2 FY2027 guidance at each issuance and Q3 FY2027 guidance
| Measure | 3 March 2026 | 3 June 2026 | 26 August 2026 (current) |
|---|---|---|---|
Ending ARR | $6.466bn to $6.516bn | $6.532bn to $6.556bn | $6.603bn to $6.612bn |
Net new ARR implied by ending ARR guidance | $1.213bn to $1.264bn | $1.279bn to $1.303bn | $1.350bn to $1.359bn |
Net new ARR growth at midpoint (FY2026 net new ARR $1.011bn) | 22.5% | 27.7% | 34.0% |
Total revenue | $5.868bn to $5.928bn | $5.915bn to $5.959bn | $5.991bn to $6.011bn |
Revenue growth at midpoint (FY2026 revenue $4.812bn) | 22.6% | 23.4% | 24.7% |
Non GAAP income from operations | $1.422bn to $1.462bn | $1.452bn to $1.480bn | $1.497bn to $1.508bn |
Non GAAP operating margin at midpoints | 24.5% | 24.7% | 25.0% |
Non GAAP EPS, diluted | $1.195 to $1.225 | $1.220 to $1.240 | $1.25 to $1.26 |
Diluted shares assumed | 1.04bn | 1.04bn | 1.04bn |
Q3 FY2027 guidance | n/a | n/a | Ending ARR $6.184bn to $6.188bn; net new ARR $343m to $347m, up 30% at midpoint; revenue range as in Table 3.1, up 23.7% at midpoint |
FCF margin for FY2027 as stated by management (earnings calls, 3 March, 3 June and 26 August 2026) | At least 30% | At least 30% | At least 30% |
Source: 8-K Exhibit 99.1, 3 March 2026, 8-K Exhibit 99.1, 3 June 2026, 8-K Exhibit 99.1, 26 August 2026; ARR base from 10-K, 4 March 2026, SEC filings via SEC-API.io; earnings calls, 3 March, 3 June and 26 August 2026


Management commentary in 8-K filings
Table 3.3 Management statements in 8-K filings, 10 October 2025 to 10 October 2026
| Filed | Item | Subject | What the filing states |
|---|---|---|---|
26 August 2026 | 2.02 | Q2 FY2027 results | The CFO attributes the raised FY2027 outlook to Q2 results and Q3 pipeline. |
3 June 2026 | 2.02 | Q1 FY2027 results | The CFO raised expected FY2027 net new ARR growth to 27.7% at midpoint and names Q2 pipeline, retention, Falcon Flex and AI as supports. |
20 April 2026 | 7.01 | Rationale for the award to the President | Board cites growth from $3.06bn revenue in FY2024 to $4.81bn in FY2026 and ending ARR from $3.44bn to $5.25bn, the acquisitions of Pangea, Onum, SGNL and Seraphic Security, and an ambition of $20bn ending ARR. |
6 April 2026 | 8.01 | Share repurchase increase | The CFO states the company sees "a growing disconnect between our improving momentum fueled by AI tailwinds and our current valuation". |
3 March 2026 | 2.02 | Q4 and FY2026 results | The CFO states a goal of $20bn ending ARR in FY2036; the release of 6 April 2026 repeats it. |
29 December 2025 | 7.01 | Rationale for the award to the CEO | Board cites revenue growth from $250m in FY2019 to $3.95bn in FY2025, non GAAP operating margin of 22.3% in FY2025 and a $20bn ARR objective. |
2 December 2025 | 2.02 | Q3 FY2026 results | The CFO raised FY2026 guidance, lifted expected H2 FY2026 net new ARR growth to at least 50% and stated confidence in 20% net new ARR growth for FY2027. |
Source: 8-K Exhibit 99.1 0001535527-26-000029, 8-K Exhibit 99.1 0001535527-26-000022, 8-K 0001535527-26-000022, 8-K 0001535527-26-000018, 8-K Exhibit 99.1 0001535527-26-000013, 8-K Exhibit 99.1 0001535527-26-000007, 8-K 0001104659-25-124912, 8-K Exhibit 99.1 0001535527-25-000030, SEC filings via SEC-API.io; results figures and award terms are in Table 5.1
Trends and risks management flags
Q2 FY2027 10-Q states that the 19 July 2024 incident "has adversely affected our results of operations" and expects effects on key metrics in future periods; the same quarter shows net new ARR up 51% year on year and a net incident recovery of $14.5m.
Table 3.4 Trends and risks named by management, with source and date
| Topic | What management states | Source and date |
|---|---|---|
AI demand | The CEO describes securing AI as the largest market opportunity in company history; the release names Falcon AI Detection and Response and a coalition with OpenAI and Anthropic called Project QuiltWorks. | 8-K Exhibit 99.1, 3 June 2026; 8-K Exhibit 99.1, 26 August 2026 |
Revenue drivers | Q2 FY2027 subscription revenue rose $297.3m, or 27%, which MD&A attributes to new customers and to additional sensors and modules sold to existing customers. | 10-Q, 26 August 2026 |
Retention | Management stated gross retention of 97% at 31 January 2026; the 10-K reports dollar based net retention of 115% at that date and the Q2 FY2027 release reports both rates increased. | Earnings call, 3 March 2026; 10-K, 4 March 2026; 8-K Exhibit 99.1, 26 August 2026 |
19 July 2024 incident | MD&A reports delays in creating sales opportunities and longer sales cycles, and states that customer commitment packages increase contraction and reduce upsell values. Accrued balance was $13.1m at 31 July 2026. | 10-Q, 26 August 2026 |
Incident litigation | The 10-Q states that a loss is reasonably possible and that an amount or range cannot be estimated at the current stage; status of each matter is in Table 8.4. | 10-Q, 26 August 2026 |
Commission accounting | The amortization period for initial commissions moved from four to five years in February 2026, lowering sales commission expense by $25.5m in Q2 FY2027 and $53.4m in H1 FY2027; management stated an FY2027 effect of $85m to $95m. | 10-Q, 26 August 2026; Earnings call, 3 March 2026 |
Cost outlook | Management expects sales and marketing, research and development and administrative expenses to rise in dollars and gross margin to rise over the long term by an amount the 10-Q calls modest; research and development average headcount rose 17% in Q2 FY2027. | 10-Q, 26 August 2026 |
Capital spending | Management stated capital expenditure of 7% to 8% of FY2027 revenue, weighted to H1. | Earnings call, 3 March 2026 |
Long term target | $20bn of ending ARR in FY2036, against $5.84bn at 31 July 2026. | 8-K Exhibit 99.1, 3 March 2026; 10-Q, 26 August 2026 |
Source: filings linked in each row, SEC filings via SEC-API.io; earnings call, 3 March 2026

4 Sector & Competitor Analysis
CrowdStrike TTM revenue grew 24.3% to 31 July 2026 against a median of 22.8% for six security software peers, and shares trade at 51.4x EV / sales against a peer median of 15.5x (market data, 9 October 2026).
Cybersecurity market size and growth
Gartner sizes 2026 information security spending at $247.5bn, up 13.6% in current US dollars, and $372.8bn in 2030. CrowdStrike's TTM revenue of $5.40bn equals 4.3% of 2026 security software spending of $126.9bn.

Table 4.1 Named research on cybersecurity market size and share
| Source | Date | Finding |
|---|---|---|
| 24 Sep 2026 | Worldwide spending $217.7bn in 2025, $247.5bn in 2026 (up 13.6% in current US dollars, 12.7% in constant currency) and $372.8bn in 2030; in constant currency, growth of 11.2% in 2027 and 10.8% compound annual growth 2025 to 2030 | |
Same Gartner forecast | 24 Sep 2026 | Enterprise endpoint protection $21.3bn in 2026 and $32.9bn in 2030; cloud security $16.6bn and $38.4bn, 24.1% compound annual growth |
Same Gartner forecast | 24 Sep 2026 | Securing AI ecosystems and AI agents $3bn in 2026 and $16bn in 2030; security software share of spending 49.6% in 2024 and 55.6% in 2030 |
| 25 Jun 2026 | Network access control spending contracts 17.7% a year to 2030 and intrusion detection 8.3% a year; zero trust network access grows 20.9% a year | |
| May 2025 | Microsoft ranked first in modern endpoint security with a 28.6% share in 2024 against 25.8% in 2023 |
Source: Gartner and IDC publications as reported by the publishers linked in the table; growth rates in rows 2 to 4 as reported, basis as in row 1 where stated
Platform consolidation, AI security and acquisitions
Palo Alto Networks completed four acquisitions between January and May 2026, including identity vendor CyberArk; its next generation security ARR reached $9.1bn against CrowdStrike's ending ARR of $5.84bn, each on the filer's own definition.
Table 4.2 Demand, consolidation and competition as filed
| Company | Statement |
|---|---|
| CrowdStrike | Competitors listed in seven categories: legacy antivirus, alternative endpoint security, network security, cloud security, identity security, professional services and legacy SIEM (security information and event management) vendors |
| Palo Alto Networks | Acquisitions completed: Chronosphere on 29 Jan 2026, CyberArk on 11 Feb 2026, Koi on 14 Apr 2026, Portkey on 29 May 2026; next generation security ARR $9.1bn at 31 Jul 2026 against $5.6bn |
| Fortinet | Q2 2026 billings $2.37bn, up 33%; revenue $2.05bn against $1.63bn |
| Zscaler | ARR $3.77bn at 31 Jul 2026 against $3.02bn; FY2026 free cash flow margin 23% against 27% |
| Cloudflare | Dollar based net retention rate 120% in Q2 2026 against 114%; 4,698 customers above $100,000 of annualized revenue against 3,712 |
| Okta | Dollar based net retention rate 107% at 31 Jul 2026 against 106%; platform capabilities being extended to AI agents; longer sales cycles cited as a headwind to RPO growth |
| SentinelOne | ARR $1.22bn at 31 Jul 2026, up 22%; restructuring plan of May 2026 with $24.4m of charges in Q2 FY2027 |
Source: latest 10-K or 10-Q of each filer as listed in Table 4.7, SEC filings via SEC-API.io
CrowdStrike versus Palo Alto Networks, Fortinet, Zscaler, Cloudflare, Okta and SentinelOne
CrowdStrike's rule of 40 score (revenue growth plus FCF margin) of 52.6% ranks third of seven against six US listed security vendors in categories named in its 10-K; SBC is 23.1% of revenue against a peer median of 18.3%. RPO grew 48.6%, the highest of seven.

Table 4.3 Operating comparison, latest twelve months reported by each filer
| Company | Period | Revenue | Growth | Gross margin | GAAP operating margin | FCF margin | Rule of 40 | SBC % of revenue | R&D % of revenue | ROIC |
|---|---|---|---|---|---|---|---|---|---|---|
CrowdStrike | TTM to 31 Jul 2026 | $5.40bn | 24.3% | 75.2% | (2.5)% | 28.3% | 52.6% | 23.1% | 29.0% | (2.0)% |
Palo Alto Networks | FY to 31 Jul 2026 | $11.5bn | 24.5% | 70.4% | 6.1% | 35.8% | 60.3% | 15.5% | 22.2% | 3.0% |
Fortinet | TTM to 30 Jun 2026 | $7.53bn | 18.8% | 80.2% | 32.4% | 41.4% | 60.2% | 3.9% | 11.2% | 75.6% |
Zscaler | FY to 31 Jul 2026 | $3.35bn | 25.4% | 76.8% | (4.0)% | 23.2% | 48.7% | 24.5% | 26.9% | (2.7)% |
Cloudflare | TTM to 30 Jun 2026 | $2.51bn | 33.5% | 72.6% | (14.1)% | 12.5% | 46.1% | 20.2% | 22.8% | (6.0)% |
Okta | TTM to 31 Jul 2026 | $3.07bn | 11.2% | 78.1% | 7.5% | 31.3% | 42.5% | 16.4% | 21.2% | 2.5% |
SentinelOne | TTM to 31 Jul 2026 | $1.10bn | 21.1% | 72.5% | (29.5)% | 2.8% | 23.9% | 29.3% | 33.2% | (17.3)% |
Peer median | n/a | n/a | 22.8% | 74.7% | 1.0% | 27.3% | 47.4% | 18.3% | 22.5% | (0.1)% |
Source: filings listed in Table 4.7, SEC filings via SEC-API.io

Table 4.4 Contracted revenue and recurring revenue indicators as filed
| Company | Balance date | RPO | RPO a year earlier | RPO growth | Recurring metric | Latest | A year earlier | Growth | Net retention rate |
|---|---|---|---|---|---|---|---|---|---|
CrowdStrike | 31 Jul 2026 | $10.7bn | $7.20bn | 48.6% | ARR | $5.84bn | $4.66bn | 25.4% | 115% (31 Jan 2026) |
Palo Alto Networks | 31 Jul 2026 | $21.2bn | $15.8bn | 34.2% | Next generation security ARR | $9.10bn | $5.60bn | 62.5% | n/a |
Fortinet | 30 Jun 2026 | $7.73bn | $6.64bn | 16.4% | Billings, Q2 2026 | $2.37bn | $1.78bn | 33.4% | n/a |
Zscaler | 31 Jul 2026 | $7.37bn | $5.78bn | 27.4% | ARR | $3.77bn | $3.02bn | 25.1% | n/a |
Cloudflare | 30 Jun 2026 | $2.73bn | $1.98bn | 38.2% | n/a | n/a | n/a | n/a | 120% (Q2 2026) |
Okta | 31 Jul 2026 | $4.86bn | $4.15bn | 17.0% | Current RPO | $2.58bn | $2.27bn | 14.1% | 107% (31 Jul 2026) |
SentinelOne | 31 Jul 2026 | $1.70bn | $1.20bn | 41.7% | ARR | $1.22bn | $1.00bn | 21.6% | n/a |
Peer median | n/a | n/a | n/a | 30.8% | n/a | n/a | n/a | n/a | n/a |
Source: filings listed in Table 4.7; CrowdStrike ARR from 10-Q 0001535527-26-000031, SEC filings via SEC-API.io
Valuation multiples EV / sales, P / FCF and P / E
CrowdStrike's market cap of $281.6bn is 184.6x TTM FCF of $1.53bn, third of seven, against a peer median of 66.1x. 52 week range is $85.68 in February 2026 to $286.99 on 6 October 2026.

Table 4.5 Valuation and capital structure at 9 October 2026 closing prices
| Company | Price | Shares | Market cap | Net cash | EV | EV / sales | P / FCF | TTM diluted EPS | P / E | Debt / equity |
|---|---|---|---|---|---|---|---|---|---|---|
CrowdStrike | $275.04 | 1.02bn | $281.6bn | $4.27bn | $277.4bn | 51.4x | 184.6x | $0.04 | n/m | 0.15x |
Palo Alto Networks | $418.78 | 818m | $342.6bn | $6.13bn | $336.4bn | 29.3x | 83.3x | $0.40 | 1,047x | 0.06x |
Fortinet | $194.75 | 734m | $142.9bn | $3.97bn | $138.9bn | 18.5x | 45.8x | $2.83 | 68.8x | 0.32x |
Zscaler | $233.73 | 163m | $38.1bn | $1.78bn | $36.3bn | 10.8x | 48.9x | ($0.39) | n/a | 0.65x |
Cloudflare | $360.93 | 356m | $128.5bn | $893m | $127.6bn | 50.8x | 408.2x | ($0.58) | n/a | 2.02x |
Okta | $232.13 | 175m | $40.6bn | $2.30bn | $38.3bn | 12.5x | 42.2x | $1.66 | 139.8x | 0.00x |
SentinelOne | $26.27 | 348m | $9.1bn | $813m | $8.3bn | 7.6x | 294.2x | ($1.02) | n/a | 0.00x |
Peer median | n/a | n/a | n/a | n/a | n/a | 15.5x | 66.1x | n/a | 139.8x | 0.19x |
Source: Market data, 9 October 2026; share counts and balance sheets from filings listed in Table 4.7, SEC filings via SEC-API.io
Table 4.6 Metric definitions and basis for Tables 4.3 to 4.5 (ROIC as in Table 2.6)
| Item | Definition or basis |
|---|---|
| TTM | Latest annual report plus latest year to date period less prior year to date period; Palo Alto Networks and Zscaler on FY2026 to 31 Jul 2026 |
| Growth | TTM revenue against prior TTM revenue |
| RPO | Contracted revenue yet to be recognized, as filed; CrowdStrike and SentinelOne file RPO rounded to $0.1bn |
| Recurring metric | Each filer's own definition; Palo Alto Networks ARR at 31 Jul 2026 includes CyberArk, acquired 11 Feb 2026; Fortinet billings are for Q2 2026 |
| Net retention rate | Dollar based net retention as filed; 10-Q filings of CrowdStrike and SentinelOne state the direction of change |
| Market cap | Closing price times shares on latest 10-K or 10-Q cover; Class A plus Class B for Cloudflare, Okta and SentinelOne |
| EV | Market cap less net cash; net cash is cash and investments less debt at carrying value, leases excluded |
| P / E | Price over TTM diluted GAAP EPS; n/m for CrowdStrike at EPS of $0.04, n/a where EPS is negative; median on the three peers with positive EPS |
Source: definitions applied to the filings listed in Table 4.7
Table 4.7 Filings behind each peer figure
| Company | Latest annual report | Latest interim report | Prior year comparative |
|---|---|---|---|
CrowdStrike | 10-K 0001535527-26-000010 | 10-Q 0001535527-26-000031 | 10-Q 0001535527-25-000025 |
Palo Alto Networks | 10-K 0001327567-26-000023 | n/a | n/a |
Fortinet | 10-K 0001262039-26-000007 | 10-Q 0001262039-26-000021 | 10-Q 0001262039-25-000028 |
Zscaler | 10-K 0001713683-26-000157 | n/a | 10-K 0001713683-25-000158 |
Cloudflare | 10-K 0001477333-26-000016 | 10-Q 0001477333-26-000054 | 10-Q 0001477333-25-000137 |
Okta | 10-K 0001660134-26-000020 | 10-Q 0001660134-26-000069 | 10-Q 0001660134-25-000157 |
SentinelOne | 10-K 0001583708-26-000020 | 10-Q 0001583708-26-000055 | 10-Q 0001583708-25-000148 |
Source: SEC filings via SEC-API.io
5 Material Events & Contracts
Non cancelable purchase obligations rose 49.5% in six months to $4.14bn at 31 July 2026, and CrowdStrike committed a further $2.9bn after quarter end, according to the Q2 FY2027 10-Q. CrowdStrike filed 8 Forms 8-K in the twelve months to 10 October 2026, and the $750m revolving credit facility expired on 2 January 2026.
CrowdStrike 8-K filings in the last twelve months

Table 5.1 Forms 8-K filed from 10 October 2025 to 10 October 2026, newest first
| Filed | Items | Event | Accession |
|---|---|---|---|
26 Aug 2026 | 2.02, 9.01 | Q2 FY2027 results: revenue $1.47bn, up 26%; ARR $5.84bn, up 25%, with net new ARR of $332.8m; GAAP operating loss $33.2m; operating cash flow $530.3m and FCF as defined by CrowdStrike $377.4m ($379m on the report basis). | 0001535527-26-000029 |
22 Jun 2026 | 5.03, 5.07, 9.01 | Annual meeting of 17 June 2026 (votes as filed, before the split): charter amendment limiting officer liability approved with 144.4m votes for and 24.7m against, effective 22 June 2026; advisory ratification of supermajority voting provisions received 24.0m votes for and 144.9m against; directors Flower (131.0m for, 39.0m withheld) and O'Leary (104.3m for, 65.7m withheld) elected. | 0001104659-26-076376 |
3 Jun 2026 | 2.02, 8.01, 9.01 | Q1 FY2027 results: revenue $1.39bn, up 26%; ARR $5.51bn, up 24%, with net new ARR of $255.8m; GAAP operating loss $30.6m; FCF as defined by CrowdStrike $468.5m ($471m on the report basis). Board approved a four for one stock split as a stock dividend: record date 25 June 2026, three additional shares per share after the close on 1 July 2026, split adjusted trading from 2 July 2026. | 0001535527-26-000022 |
20 Apr 2026 | 5.02, 7.01, 9.01 | Board approved on 16 April 2026 a performance and service based award to President Michael Sentonas: 100,000 PSUs (performance stock units) at target as filed (400,000 split adjusted), 0 to 200,000 shares as filed (0 to 800,000) depending on total stockholder return against the S&P 500 from 22 December 2025 to 22 December 2028. | 0001535527-26-000018 |
6 Apr 2026 | 8.01, 9.01 | Board authorized a further $500m of repurchases, taking the program to $1.5bn; 413,130 shares repurchased to date at an average $364.57 as filed, for $150.6m (1.65m shares at $91.14 split adjusted). | 0001535527-26-000013 |
3 Mar 2026 | 2.02, 9.01 | Q4 FY2026 results: revenue $1.31bn, up 23%; ARR $5.25bn, up 24%, with net new ARR of $330.7m; GAAP operating loss $6.9m; FY2026 revenue $4.81bn, up 22%, and GAAP operating loss $293.3m. | 0001535527-26-000007 |
29 Dec 2025 | 5.02, 7.01, 9.01 | Independent directors approved on 22 December 2025 a performance award to Chief Executive Officer George Kurtz: 300,000 PSUs at target as filed (1.2m split adjusted), 0 to 600,000 shares as filed (0 to 2.4m) on the same three year relative return test; the filing states a share price of $483.14 ($120.79 split adjusted) and a market capitalization of $121.3bn on that date. | 0001104659-25-124912 |
2 Dec 2025 | 2.02, 9.01 | Q3 FY2026 results: revenue $1.23bn, up 22%; ARR $4.92bn, up 23%, with net new ARR of $265.3m; GAAP operating loss $69.4m as first reported ($62.2m as revised, Table 2.2); FCF as defined by CrowdStrike $295.9m ($297m on the report basis). | 0001535527-25-000030 |
Source: Forms 8-K and Exhibits 99.1, 10.1 and 3.1 as linked, SEC filings via SEC-API.io; report basis FCF as in Table 2.2
CrowdStrike acquisitions: SGNL, Seraphic, Pangea, Onum and XM Cyber
SGNL and Seraphic closed in February 2026 for $955.4m of cash net of cash acquired, of which $74.0m is held in escrow as restricted cash; goodwill on the two deals is $886.6m. CrowdStrike's venture funds held 9.4% of Seraphic before the deal, remeasured to $38.1m for a $15.5m gain net of non controlling interest. XM Cyber consideration is $145.0m in cash and shares expected at closing, plus further shares set at closing.

Table 5.2 Acquisitions closed or signed since September 2025
| Target | Business as filed | Signed | Closed | Cash, net of cash acquired | Replacement awards | Developed technology and other intangibles | Goodwill |
|---|---|---|---|---|---|---|---|
SGNL.AI, Inc. (100%) | Continuous identity security | 7 Jan 2026 | 20 Feb 2026 | $627.9m | $9.2m | $87.9m, 96 months | $561.1m |
Seraphic Algorithms Ltd. (remaining 90.6%) | Browser runtime security | 12 Jan 2026 | 3 Feb 2026 | $327.5m | $13.7m | $69.8m, 96 months | $325.5m |
Pangea Cyber Corporation (100%) | AI detection and response | n/a | 26 Sep 2025 | $212.1m | $10.6m | $13.2m, 72 months | $209.9m |
Onum Technology Inc. (100%) | Real time telemetry pipeline management | n/a | 12 Sep 2025 | $252.7m | $2.0m | $21.4m, 24 to 84 months | $233.1m |
XM Cyber Ltd. technology assets | Attack path visualization and offensive simulation; seller is a Schwarz Digits company | Jul 2026 | Expected H2 FY2027 | $145.0m expected | n/a | n/a | n/a |
Source: 10-Q, Q2 FY2027, Notes 11 and 12; signing dates from 10-K, FY2026, SEC filings via SEC-API.io
CrowdStrike purchase obligations and material contracts
Payments due after FY2031 rose to $1.24bn at 31 July 2026 from $157m at 31 January 2026, 29.9% of the total against 5.7%.


Table 5.3 Material contracts and commitments
| Contract | Parties | What it does | Term | Economics and termination |
|---|---|---|---|---|
Non cancelable purchase obligations | CrowdStrike and unnamed vendors | Commits the company to buy data center capacity, advertising, technology, equipment, office renovations, corporate events and consulting services under contracts longer than one year | FY2027 to after FY2031 | $4.14bn at 31 Jul 2026: $0.19bn in the rest of FY2027, $0.84bn in each of FY2028 and FY2029, $0.65bn in FY2030, $0.38bn in FY2031, $1.24bn thereafter |
Purchase commitments made after 31 July 2026 | CrowdStrike and unnamed vendors | Adds non cancelable commitments disclosed in the Q2 FY2027 10-Q | FY2027 to FY2034 | $2.9bn |
Purchase commitment signed after 30 April 2026 | CrowdStrike and an unnamed vendor | Adds one non cancelable commitment disclosed in the Q1 FY2027 10-Q, which states it enters the schedule in subsequent periods | Q2 FY2027 through FY2037 | $1.7bn |
3.00% Senior Notes due 2029 | CrowdStrike Holdings as issuer; CrowdStrike, Inc. and CrowdStrike Financial Services, Inc. as guarantors; U.S. Bank Trust Company as trustee | Unsecured borrowing of $750.0m issued at par on 20 Jan 2021 | Matures February 2029; interest paid 15 February and 15 August | Redeemable at 100.00% of principal since 15 Feb 2026; holders can require repurchase at 101% on a change of control event; covenants limit liens, subsidiary guarantees, dividends and mergers; fair value $712.5m at 31 Jul 2026 |
Secured revolving credit facility | CrowdStrike, Inc. as borrower; CrowdStrike Holdings as guarantor; Silicon Valley Bank and other lenders | Provided a revolving line of up to $750.0m with a $100.0m letter of credit sub facility | Expired 2 Jan 2026 | $0 outstanding at expiry; commitment fee had been 0.15% to 0.25% a year on unused amounts; interest expense fell in H1 FY2027 as amortization of its issuance costs ended |
Share repurchase program | Board authorization | Permits repurchases of Class A common stock in the open market, in private transactions and under Rule 10b5-1 plans | No fixed expiration date | $1.0bn approved June 2025 plus $500.0m on 6 Apr 2026; $175.6m spent in H1 FY2027 on 1.92m shares, $0 in Q2; $1.3bn remained at 31 Jul 2026 |
Performance Unit Agreement, 22 Dec 2025 | CrowdStrike Holdings and George Kurtz | Grants PSUs earned on total stockholder return ranked against S&P 500 constituents | Performance period 22 Dec 2025 to 22 Dec 2028 | Target 300,000 units as filed (1.2m after the split): 50% at the 25th percentile, 100% at the 55th, 150% at the 75th, 200% at the 90th, 0% below the 25th; forfeited on termination except prorated vesting on termination without cause or for good reason, and full vesting on such a termination within 3 months before or 24 months after a change in control; 50% weighting for time served as Executive Chairman |
Performance Unit Agreement, 16 Apr 2026 | CrowdStrike Holdings and Michael Sentonas | Grants PSUs on the same relative return scale, with a further year of service vesting | Performance period to 22 Dec 2028; earned units vest 25% on each of 20 Mar, 20 Jun, 20 Sep and 20 Dec 2029 | Target 100,000 units as filed (400,000 after the split), maximum 200%; same termination and change in control terms; subject to the company's compensation recovery policy |
Outside Director Compensation Policy, amended 17 Jun 2026 | CrowdStrike Holdings and non employee directors | Sets director pay | Annual, until amended by the board | $50,000 cash retainer, $60,000 more for the chairman, committee retainers of $6,000 to $30,000; restricted stock units of $375,000 on joining, vesting over three years, and $275,000 each year; all director awards vest on a change in control |
Operating leases signed and yet to commence | CrowdStrike and unnamed landlords | Four office leases excluded from the lease liability until they start | Start October 2026 to August 2027; terms of 5.0 to 11.3 years | $117.5m of undiscounted minimum payments, against $82.7m on leases already recorded |
Customer financing commitments | CrowdStrike and qualified end users | Funds customers' purchases of its products and services | n/a | $69.7m of non cancelable unfunded commitments at 31 Jul 2026 |
Source: 10-Q, Q2 FY2027, Notes 6, 8, 11 and 16 and Exhibit 10.1; 10-Q, Q1 FY2027; 10-K, FY2026; Kurtz agreement; Sentonas agreement; director policy, SEC filings via SEC-API.io
CrowdStrike July 2024 outage litigation status
Three of four groups of lawsuits over the 19 July 2024 software update ended in dismissal by 15 June 2026; the case filed on 25 October 2024 by Delta Air Lines (printed in the filings as Delta Airlines, Inc.) in Georgia is in discovery (10-Q, Note 11). Department of Justice and SEC have requested information on revenue recognition and ARR reporting for transactions with certain customers and on the incident; the 10-Q states the company is cooperating (dates and status in Table 8.4, expenses in Table 8.5).
6 Ownership, Voting Power & Annual Meeting
CrowdStrike stockholders cast 144.9m votes against and 24.0m for the advisory ratification of supermajority voting provisions on 17 June 2026, 14.2% of votes for plus against in favor, and approved the officer liability charter amendment with 56.7% of outstanding shares. Vanguard Capital Management (7.27%) and BlackRock (6.70%) are the two holders above 5%. George Kurtz, Chief Executive Officer, beneficially owned 9.5m shares at 3 April 2026 against 25.3m a year earlier, including 444,396 against 17.0m in trusts with an independent trustee over which he shares voting power.
CrowdStrike major shareholders and voting power
Table 6.1 Beneficial ownership at 3 April 2026, shares split adjusted (voting power derived: 13G sole voting power; insiders: shares less options and units vesting within 60 days)
| Holder | Position as filed | Shares beneficially owned | % of class, as filed | Shares with voting power, derived | % of 1.02bn record date votes, derived | Shares, 15 April 2025 | Change |
|---|---|---|---|---|---|---|---|
Vanguard Capital Management | 5% stockholder; Schedule 13G, 31 March 2026 | 73.8m | 7.27% | 9.9m | 0.98% | n/a | n/a |
BlackRock, Inc. | 5% stockholder; Schedule 13G/A, 31 December 2023 | 67.8m | 6.70% | 62.1m | 6.10% | 67.8m | 0 |
George Kurtz | Chief Executive Officer, President and Director | 9.5m | below 1% | 8.1m | 0.79% | 25.3m | (15.7m) |
Sameer K. Gandhi | Director | 3.3m | below 1% | 3.3m | 0.33% | 3.4m | (16,792) |
Burt W. Podbere | Chief Financial Officer | 1.4m | below 1% | 1.4m | 0.14% | 1.3m | 186,388 |
Michael Sentonas | President | 883,872 | below 1% | 850,952 | 0.08% | 832,100 | 51,772 |
Godfrey R. Sullivan | Director | 445,060 | below 1% | 445,060 | 0.04% | 482,496 | (37,436) |
Denis J. O'Leary | Director | 351,192 | below 1% | 351,192 | 0.03% | 465,312 | (114,120) |
Gerhard Watzinger | Chair of the Board | 345,656 | below 1% | 345,656 | 0.03% | 504,116 | (158,460) |
Johanna Flower | Director | 302,204 | below 1% | 302,204 | 0.03% | 335,880 | (33,676) |
Roxanne S. Austin | Director | 273,188 | below 1% | 73,188 | 0.01% | 479,376 | (206,188) |
Shawn Henry | Former Chief Security Officer | 92,960 | below 1% | 92,960 | 0.01% | 66,616 | 26,344 |
Cary J. Davis | Director | 84,380 | below 1% | 84,380 | 0.01% | 81,248 | 3,132 |
Laura J. Schumacher | Director | 34,712 | below 1% | 34,712 | 0.00% | 31,648 | 3,064 |
All executive officers and directors (11 persons) | Group | 17.0m | 1.67% | 15.3m | 1.51% | 33.1m | (16.1m) |
Source: DEF 14A filed 5 May 2026; DEF 14A filed 6 May 2025, SEC filings via SEC-API.io
Table 6.2 Share structure, board and pay facts
| Item | As filed |
|---|---|
| Classes of voting stock | 1 (Class A common stock), one vote per share, no cumulative voting |
| Share class history | Every Class B share (10 votes) converted into one Class A share (1 vote) on 11 December 2024 |
| Shares outstanding at record date, 24 April 2026 | 254.5m as filed; 1.02bn split adjusted |
| Board of directors | 9 members in 3 classes with three year terms; independent Chair Gerhard Watzinger |
| Votes required to amend bylaws and listed charter articles | Two thirds of total voting power |
| Hedging and pledging of company stock | Insider trading policy contains anti hedging and anti pledging provisions |
| CEO total compensation | FY2026 $247.58m; FY2025 $35.20m; FY2024 $46.98m |
| CEO stock awards, grant date fair value | FY2026 $242.12m; FY2025 $31.85m; FY2024 $44.09m |
| Relative total shareholder return award to CEO, December 2025 | 1.2m target PSUs (300,000 as filed); value at maximum $289.88m; terms in Table 5.3 |
| Median employee total compensation | FY2026 $178,015; FY2025 $222,761 |
| CEO pay ratio | FY2026 1,391 to 1; FY2025 158 to 1 |
| Advisory vote on executive pay | 2025 and 2026 agendas: 0; latest vote 18 June 2024: 233.0m for, 36.4m against as filed, 86.5% of for plus against (Class B at 10 votes) |
Source: DEF 14A filed 5 May 2026; 8-K filed 13 December 2024; 8-K filed 22 June 2026; 8-K filed 21 June 2024

CrowdStrike 13F institutional holders
Original Form 13F-HR filings reporting CrowdStrike common stock rose 22.2% from 2,031 for 30 September 2025 to 2,482 for 30 June 2026. FMR LLC reported 31.4m shares at 30 June 2026 against 12.5m at 30 September 2025.

Table 6.3 CrowdStrike shares reported by 12 large Form 13F filers, split adjusted (filed counts multiplied by 4)
| Filer | 30 Sep 2025 | 31 Dec 2025 | 31 Mar 2026 | 30 Jun 2026 | Change, Sep 2025 to Jun 2026 | % of shares outstanding, Jun 2026 |
|---|---|---|---|---|---|---|
BlackRock, Inc. | 82.7m | 84.6m | n/a | 87.4m | 4.7m | 8.53% |
Vanguard Group Inc | 95.5m | 96.9m | 0 | 0 | (95.5m) | 0.00% |
Vanguard Capital Management LLC | n/a | n/a | 63.9m | 64.8m | n/a | 6.33% |
Vanguard Portfolio Management LLC | n/a | n/a | 24.1m | 23.8m | n/a | 2.33% |
State Street Corp | 43.7m | 44.6m | 44.5m | 46.3m | 2.6m | 4.53% |
Invesco Ltd. (Dec 2025 and Mar 2026 include new holdings amendments) | 9.9m | 32.9m | 30.6m | 33.6m | 23.7m | 3.28% |
JPMorgan Chase & Co | 24.2m | 22.4m | 14.4m | 32.7m | 8.5m | 3.19% |
FMR LLC | 12.5m | 13.1m | 13.8m | 31.4m | 18.9m | 3.07% |
Morgan Stanley | 25.9m | 24.9m | 26.2m | 26.0m | 122,676 | 2.54% |
Geode Capital Management | 23.2m | 23.8m | 24.0m | 24.3m | 1.1m | 2.38% |
T. Rowe Price Associates | 16.9m | 17.1m | 16.6m | 17.2m | 363,572 | 1.68% |
Jennison Associates LLC | 22.8m | 22.0m | 15.3m | 15.0m | (7.8m) | 1.47% |
Source: Form 13F filings for the four quarter ends, CUSIP 22788C105; filing for 30 June 2026 linked per filer (for Vanguard Group Inc, Schedule 13G/A of 26 March 2026 reporting 0 shares): BlackRock, Inc.; Vanguard Group Inc; Vanguard Capital Management LLC; Vanguard Portfolio Management LLC; State Street Corp; Invesco Ltd.; JPMorgan Chase & Co; FMR LLC; Morgan Stanley; Geode Capital Management; T. Rowe Price Associates; Jennison Associates LLC. Shares outstanding 1.02bn from 10-Q cover, 20 August 2026

CrowdStrike Schedule 13D and 13G filings
Schedule 13G filings from 10 October 2024 to 10 October 2026: 5. Schedule 13D filings: 0.
Table 6.4 Schedule 13G filings on CrowdStrike, 10 October 2024 to 10 October 2026
| Filed | Form | Filer | Event date | Shares, split adjusted | % of class, as filed (2024: Class A) | Sole voting power, split adjusted |
|---|---|---|---|---|---|---|
| SC 13G | Vanguard Capital Management | 31 Mar 2026 | 73.8m | 7.27% | 9.9m | |
| SC 13G/A | The Vanguard Group | 13 Mar 2026 | 0 | 0% | 0 | |
| SC 13G/A | T. Rowe Price Associates, Inc. | 30 Sep 2024 | 6.9m | 0.7% | 6.6m | |
| SC 13G/A | The Vanguard Group | 30 Sep 2024 | 86.3m | 9.27% | 0 | |
| SC 13G/A | The Vanguard Group | 30 Sep 2024 | 86.3m | 9.27% | 0 |
Source: Schedule 13G filings linked in the first column
CrowdStrike annual meeting voting results
Shares present or represented were 82.5% of 254.5m shares outstanding at the record date, as filed, before the split (1.02bn split adjusted). Board recommended a vote for all four proposals; the proxy states that a stockholder proposal for simple majority voting was excluded under SEC proxy rules as conflicting with a company proposal (proposal 4).
Table 6.5 Annual meeting of 17 June 2026, votes as filed, before the split
| No. | Proposal | Vote standard | For | Against or withheld | Abstain | Broker non votes | % for, of for plus against | % for, of 254.5m shares outstanding as filed | Result |
|---|---|---|---|---|---|---|---|---|---|
1 | Elect Johanna Flower, Class I director to 2029 | Plurality | 131,014,818 | 39,026,380 | n/a | 39,947,114 | 77.0% | 51.5% | Elected |
1 | Elect Denis J. O'Leary, Class I director to 2029 | Plurality | 104,319,861 | 65,721,337 | n/a | 39,947,114 | 61.3% | 41.0% | Elected |
2 | Ratify PricewaterhouseCoopers LLP for fiscal 2027 | Majority of votes cast | 207,551,102 | 1,434,320 | 1,002,890 | n/a | 99.3% | 81.5% | Ratified |
3 | Amend charter to limit officer liability under Delaware law | Majority of outstanding shares | 144,387,962 | 24,713,003 | 940,233 | 39,947,114 | 85.4% | 56.7% | Approved |
4 | Advisory ratification of supermajority voting provisions | Majority of votes cast | 24,034,816 | 144,942,474 | 1,063,908 | 39,947,114 | 14.2% | 9.4% | Majority against |
Source: 8-K filed 22 June 2026, Item 5.07; DEF 14A filed 5 May 2026 (vote standards), SEC filings via SEC-API.io; stockholder proposals on the ballot: 0

7 Insider Activity
CrowdStrike insiders sold 1.71m shares for $419.85m in the open market from 1 August to 7 October 2026 and bought 0; twelve month sales total 4.10m shares for $759.34m, 0.40% of 1.02bn shares outstanding (10-Q). Twelve reporting persons filed 182 Forms 4, 0 Forms 3 and 0 Forms 5.
Insider buying and selling by month

September 2026 accounts for 1.32m shares and $330.38m, 44% of twelve month sale value. Sales under Rule 10b5-1 trading plans are 74% of value; sales to cover tax on vesting of restricted stock units (RSUs), required under issuer policy as stated in Form 4 remarks, are 20%.
Table 7.1 Insider transactions by month, shares
| Month | Sold (S) | of which Rule 10b5-1 plan | of which to cover tax on vesting | of which other | Bought (P) | Sale value | Sellers | Awards (A) | Option exercises (M) | Gifts and transfers out (G) |
|---|---|---|---|---|---|---|---|---|---|---|
Oct 2025 | 129,388 | 129,388 | 0 | 0 | 0 | $16.52m | 3 | 0 | 0 | 0 |
Nov 2025 | 55,728 | 20,000 | 35,728 | 0 | 0 | $7.66m | 3 | 0 | 0 | 0 |
Dec 2025 | 208,464 | 13,236 | 164,228 | 31,000 | 0 | $25.46m | 6 | 864 | 0 | 202,572 |
Jan 2026 | 12,000 | 12,000 | 0 | 0 | 0 | $1.39m | 1 | 0 | 0 | 0 |
Feb 2026 | 180,524 | 0 | 180,524 | 0 | 0 | $18.88m | 2 | 0 | 0 | 0 |
Mar 2026 | 273,352 | 0 | 273,352 | 0 | 0 | $28.11m | 4 | 1,060,664 | 0 | 121,768 |
Apr 2026 | 112,628 | 112,628 | 0 | 0 | 0 | $12.50m | 2 | 479,212 | 0 | 0 |
May 2026 | 645,644 | 610,108 | 35,536 | 0 | 0 | $90.18m | 4 | 0 | 20,000 | 0 |
Jun 2026 | 517,196 | 236,036 | 164,160 | 117,000 | 0 | $89.79m | 7 | 11,860 | 0 | 74,064 |
Jul 2026 | 254,500 | 240,000 | 0 | 14,500 | 0 | $49.00m | 3 | 0 | 0 | 49,500 |
Aug 2026 | 265,147 | 230,000 | 35,147 | 0 | 0 | $55.08m | 3 | 0 | 0 | 0 |
Sep 2026 | 1,317,160 | 1,071,944 | 165,276 | 79,940 | 0 | $330.38m | 8 | 454 | 62,920 | 0 |
Oct 2026 | 128,776 | 128,776 | 0 | 0 | 0 | $34.39m | 3 | 0 | 0 | 0 |
Total | 4,100,507 | 2,804,116 | 1,053,951 | 242,440 | 0 | $759.34m | 10 | 1,553,054 | 82,920 | 447,904 |
Source: Forms 4 filed 10 Oct 2025 to 10 Oct 2026, SEC filings via SEC-API.io
Insider sales by person
George Kurtz, Chief Executive Officer, sold 1.77m shares for $305.57m, 40% of twelve month sale value.

Table 7.2 Reporting persons: twelve month sales and latest reported holding
| Insider | Role | Forms 4 | Shares sold (S) | Sale value | Rule 10b5-1 plan | To cover tax on vesting | Other | Awards (A) | Held directly incl. unvested units | Held indirectly | Latest Form 4 |
|---|---|---|---|---|---|---|---|---|---|---|---|
George Kurtz | Chief Executive Officer, President and Director | 94 | 1,772,992 | $305.57m | 1,200,048 | 572,944 | 0 | 823,944 | 7,511,504 | 400,000 | 0001778564-26-000179 |
Burt W. Podbere | Chief Financial Officer | 15 | 714,396 | $158.42m | 480,000 | 234,396 | 0 | 167,312 | 342,936 | 998,392 | 0001778610-26-000024 |
Michael Sentonas | President | 10 | 783,983 | $139.73m | 561,944 | 222,039 | 0 | 479,840 | 1,245,517 | 0 | 0000950103-26-015176 |
Sameer K. Gandhi | Director | 20 | 374,000 | $65.04m | 374,000 | 0 | 0 | 2,023 | 32,075 | 15,611,491 | 0001201326-26-000027 |
Gerhard Watzinger | Chair of the Board | 7 | 160,000 | $35.59m | 120,000 | 0 | 40,000 | 2,438 | 34,242 | 155,564 | 0001445832-26-000013 |
Denis J. O'Leary | Director | 9 | 122,500 | $19.92m | 0 | 0 | 122,500 | 1,998 | 130,422 | 133,260 | 0001253512-26-000015 |
Anurag Saha | Chief Accounting Officer | 9 | 71,308 | $13.29m | 46,736 | 24,572 | 0 | 67,764 | 181,100 | 0 | 0001921602-26-000012 |
Roxanne S. Austin | Director | 2 | 50,000 | $11.88m | 0 | 0 | 50,000 | 1,608 | 77,040 | 0 | 0001061632-26-000008 |
Cary J. Davis | Director | 4 | 29,940 | $7.37m | 0 | 0 | 29,940 | 2,115 | 58,479 | 0 | 0001220632-26-000006 |
Johanna Flower | Director | 6 | 21,388 | $2.54m | 21,388 | 0 | 0 | 1,956 | 306,184 | 0 | 0001872303-26-000008 |
Laura J. Schumacher | Director | 4 | 0 | 0 | 0 | 0 | 0 | 2,056 | 38,724 | 0 | 0001319245-26-000014 |
Godfrey R. Sullivan | Director | 2 | 0 | 0 | 0 | 0 | 0 | 0 | n/a | 342,564 | 0001233412-26-000002 |
Total | 182 | 4,100,507 | $759.34m | 2,804,116 | 1,053,951 | 242,440 | 1,553,054 |
Source: Forms 4 linked in the table, SEC filings via SEC-API.io; two George Kurtz lines filed as 2.537 shares (23 July 2026) and 2.978 shares (24 August 2026) are counted as 2,537 and 2,978, the fall in reported holdings on the same lines

Table 7.3 Ten largest open market transaction lines by value
| Date | Insider | Role | Code | Shares | Price as reported | Value | Held after transaction | Ownership line | Form 4 |
|---|---|---|---|---|---|---|---|---|---|
24 Sep 2026 | Burt W. Podbere | Chief Financial Officer | S | 114,668 | $261.19 | $29.95m | 412,105 | Direct | 0001778610-26-000024 |
24 Sep 2026 | Burt W. Podbere | Chief Financial Officer | S | 74,007 | $259.35 | $19.19m | 588,929 | Direct | 0001778610-26-000024 |
24 Sep 2026 | Burt W. Podbere | Chief Financial Officer | S | 69,169 | $262.29 | $18.14m | 342,936 | Direct | 0001778610-26-000024 |
30 Sep 2026 | Michael Sentonas | President | S | 61,611 | $266.53 | $16.42m | 1,287,531 | Direct | 0000950103-26-015176 |
24 Sep 2026 | Burt W. Podbere | Chief Financial Officer | S | 62,000 | $262.72 | $16.29m | 109,200 | Doris Trust | 0001778610-26-000024 |
24 Sep 2026 | Burt W. Podbere | Chief Financial Officer | S | 62,000 | $262.25 | $16.26m | 109,200 | Buttonwillow Trust | 0001778610-26-000024 |
24 Sep 2026 | Burt W. Podbere | Chief Financial Officer | S | 62,156 | $260.25 | $16.18m | 526,773 | Direct | 0001778610-26-000024 |
30 Sep 2026 | Michael Sentonas | President | S | 53,539 | $265.39 | $14.21m | 1,349,142 | Direct | 0000950103-26-015176 |
21 Sep 2026 | Michael Sentonas | President | S | 48,866 | $231.61 | $11.32m | 1,475,538 | Direct | 0001968270-26-000015 |
30 Sep 2026 | Michael Sentonas | President | S | 41,974 | $267.29 | $11.22m | 1,245,557 | Direct | 0000950103-26-015176 |
Source: Forms 4 linked in the table, SEC filings via SEC-API.io
Table 7.4 Ten largest daily sale totals by person
| Date | Insider | Form 4 lines | Shares sold (S) | Average price | Value | Rule 10b5-1 plan | To cover tax on vesting | Other | Form 4 |
|---|---|---|---|---|---|---|---|---|---|
24 Sep 2026 | Burt W. Podbere | 8 | 480,000 | $261.44 | $125.49m | 480,000 | 0 | 0 | 0001778610-26-000024 |
30 Sep 2026 | Michael Sentonas | 7 | 241,944 | $265.45 | $64.22m | 241,944 | 0 | 0 | 0000950103-26-015176 |
16 Sep 2026 | Gerhard Watzinger | 6 | 120,000 | $238.58 | $28.63m | 120,000 | 0 | 0 | 0001445832-26-000011 |
11 May 2026 | Michael Sentonas | 2 | 160,000 | $133.75 | $21.40m | 160,000 | 0 | 0 | 0001968270-26-000009 |
21 Sep 2026 | George Kurtz | 31 | 84,515 | $240.13 | $20.29m | 10,000 | 74,515 | 0 | 0001778564-26-000168, 0001778564-26-000169 |
22 Jun 2026 | George Kurtz | 55 | 84,820 | $171.39 | $14.54m | 10,000 | 74,820 | 0 | 0001778564-26-000099, 0001778564-26-000100 |
1 Oct 2026 | Sameer K. Gandhi | 10 | 54,000 | $265.22 | $14.32m | 54,000 | 0 | 0 | 0001201326-26-000027 |
5 Jun 2026 | Denis J. O'Leary | 15 | 77,000 | $171.39 | $13.20m | 0 | 0 | 77,000 | 0001253512-26-000007 |
23 Mar 2026 | George Kurtz | 10 | 127,660 | $102.97 | $13.15m | 0 | 127,660 | 0 | 0001778564-26-000009 |
4 Feb 2026 | George Kurtz | 18 | 115,412 | $103.25 | $11.92m | 0 | 115,412 | 0 | 0001778564-26-000004 |
Source: Forms 4 linked in the table, SEC filings via SEC-API.io
Rule 10b5-1 plans, stock awards and option exercises
George Kurtz reports plan sales on 120 trading days; 115 of 182 Forms 4 have the Rule 10b5-1 box checked.
Table 7.5 Rule 10b5-1 plans cited in Form 4 footnotes
| Insider | Plan adopted | First sale | Last sale | Sale days | Shares sold | Value | First and last Form 4 |
|---|---|---|---|---|---|---|---|
George Kurtz | 6 Jan 2026 | 17 Apr 2026 | 7 Oct 2026 | 120 | 1,195,503 | $224.94m | 0001778564-26-000014, 0001778564-26-000179 |
Burt W. Podbere | 24 Jun 2026 | 24 Sep 2026 | 24 Sep 2026 | 1 | 480,000 | $125.49m | 0001778610-26-000024 |
Michael Sentonas | 1 Jul 2026 | 30 Sep 2026 | 30 Sep 2026 | 1 | 241,944 | $64.22m | 0000950103-26-015176 |
Sameer K. Gandhi | 27 Jun 2025 | 24 Oct 2025 | 1 Sep 2026 | 13 | 320,000 | $50.71m | 0001201326-25-000007, 0001201326-26-000021 |
Michael Sentonas | 24 Jun 2025 | 8 Oct 2025 | 12 May 2026 | 5 | 320,000 | $42.13m | 0001968270-25-000009, 0001968270-26-000011 |
Gerhard Watzinger | 17 Jun 2026 | 16 Sep 2026 | 16 Sep 2026 | 1 | 120,000 | $28.63m | 0001445832-26-000011 |
Sameer K. Gandhi | 25 Jun 2026 | 1 Oct 2026 | 1 Oct 2026 | 1 | 54,000 | $14.32m | 0001201326-26-000027 |
Anurag Saha | 2 Jul 2026 | 1 Oct 2026 | 1 Oct 2026 | 1 | 24,776 | $6.51m | 0001921602-26-000012 |
Johanna Flower | 16 Jan 2025 | 15 Oct 2025 | 15 Jan 2026 | 2 | 21,388 | $2.54m | 0001872303-25-000007, 0001872303-26-000002 |
Anurag Saha | 24 Mar 2025 | 17 Apr 2026 | 24 Jun 2026 | 2 | 18,616 | $2.37m | 0001921602-26-000004, 0001921602-26-000008 |
Source: Forms 4 linked in the table, SEC filings via SEC-API.io; adoption dates as in Form 4 footnotes (Form 144 notices state 16 January 2026 for George Kurtz and for the May 2026 sales of Michael Sentonas)
Table 7.6 Insider transactions by type
| Type | Code | Form 4 lines | Insiders | Shares or units | Value at reported price |
|---|---|---|---|---|---|
Open market purchase | P | 0 | 0 | 0 | 0 |
Open market sale under a Rule 10b5-1 plan | S | 1,858 | 7 | 2,804,116 | $563.28m |
Open market sale to cover tax on vesting | S | 189 | 4 | 1,053,951 | $149.93m |
Other open market sale | S | 26 | 4 | 242,440 | $46.12m |
RSUs with final amount set on FY2026 performance, 6 Mar 2026 | A | 3 | 3 | 1,059,648 | n/a |
RSUs granted to officers, 16 Apr 2026 | A | 4 | 3 | 479,212 | n/a |
Annual RSU grant to directors, 17 Jun 2026 | A | 7 | 7 | 11,256 | n/a |
Vested RSUs in lieu of director cash retainer | A | 24 | 6 | 2,938 | n/a |
Gift or transfer, shares leaving the reported line | G | 17 | 4 | 447,904 | n/a |
Option exercise, shares acquired | M | 3 | 2 | 82,920 | n/a |
Source: Forms 4 filed 10 Oct 2025 to 10 Oct 2026, SEC filings via SEC-API.io; one Johanna Flower line of 402 units on 17 June 2026, filed with code S, acquired flag A, price 0 and a footnote describing unvested RSUs, is counted as an award
Form 144 notices of proposed sale
Form 144 notices cover 14.99m shares at $2.09bn stated market value; 3 trusts whose notices state the relationship Affiliate and acquisition by gift account for 10.87m shares and $1.36bn.
Table 7.7 Form 144 notices filed 10 Oct 2025 to 10 Oct 2026, by person (shares split adjusted)
| Person for whose account | Relationship stated | Notices | Stating a Rule 10b5-1 plan date | Filed | Shares to be sold | Stated market value | Form 144 |
|---|---|---|---|---|---|---|---|
DK Giving Trust | Affiliate | 2 | 0 | 5 Nov 2025 to 5 Feb 2026 | 6,410,548 | $797.46m | 1, 2 |
PK Giving Trust | Affiliate | 2 | 0 | 5 Nov 2025 to 5 Feb 2026 | 4,379,304 | $554.61m | 1, 2 |
George Kurtz | CEO / President, CEO | 11 | 1 | 3 Nov 2025 to 21 Sep 2026 | 1,842,944 | $276.43m | 1, 2, 3, 4, 5, 6, 7, 8, 9, 10, 11 |
Burt W. Podbere | Officer | 10 | 1 | 3 Nov 2025 to 24 Sep 2026 | 714,396 | $158.40m | 1, 2, 3, 4, 5, 6, 7, 8, 9, 10 |
Michael Sentonas | Officer | 9 | 5 | 10 Oct 2025 to 30 Sep 2026 | 723,983 | $132.43m | 1, 2, 3, 4, 5, 6, 7, 8, 9 |
Potomac Investments LP | Director | 7 | 7 | 24 Oct 2025 to 1 Oct 2026 | 412,108 | $72.33m | 1, 2, 3, 4, 5, 6, 7 |
Gerhard Watzinger | Director | 2 | 1 | 5 Jun 2026 to 16 Sep 2026 | 200,000 | $43.48m | 1, 2 |
Denis J. O'Leary | Director | 3 | 0 | 5 Dec 2025 to 13 Jul 2026 | 123,500 | $20.66m | 1, 2, 3 |
Roxanne S. Austin | Director | 1 | 0 | 14 Sep 2026 | 50,000 | $11.88m | 1 |
2025 DK Charitable Remainder Unitrust | Affiliate | 1 | 0 | 15 Jan 2026 | 83,840 | $9.66m | 1 |
Cary J. Davis | Director | 1 | 0 | 17 Sep 2026 | 29,940 | $7.23m | 1 |
Johanna Flower | Director | 2 | 2 | 15 Oct 2025 to 15 Jan 2026 | 21,388 | $2.53m | 1, 2 |
Total | 51 | 17 | 14,991,951 | $2.09bn |
Source: Forms 144 linked in the table, SEC filings via SEC-API.io
8 Risk Factors
CrowdStrike's 10-Q Q2 FY2027 carries 59 risk factors in 26,062 words under the 59 headings of the 10-K FY2026 (25,876 words): 5 were reworded, adding agentic AI, attackers that use AI, currency hedging and a share repurchase authorization raised to $1.5bn. Against the 10-K FY2025, the FY2026 10-K added 1 factor (share repurchases), dropped 1 (cross default under the $750m revolving facility that expired in January 2026) and reworded 22.
CrowdStrike risk factors by category
Table 8.1 Risk factor count, word count and status by category (status: 10-K FY2026 against 10-K FY2025)
| Category | Count FY2025 | Count FY2026 | Count Q2 FY2027 | Words FY2025 | Words FY2026 | Words Q2 FY2027 | New | Dropped | Reworded (substance added, removed or changed) | Updated (figures, dates or single words) | Unchanged |
|---|---|---|---|---|---|---|---|---|---|---|---|
Business and industry | 28 | 28 | 28 | 11,654 | 11,616 | 11,749 | 0 | 0 | 11 | 3 | 14 |
Intellectual property, legal and regulatory | 12 | 12 | 12 | 6,999 | 7,309 | 7,319 | 0 | 0 | 3 | 0 | 9 |
Ownership of common stock | 6 | 7 | 7 | 1,790 | 2,051 | 2,091 | 1 | 0 | 2 | 1 | 3 |
Indebtedness | 4 | 3 | 3 | 1,323 | 860 | 860 | 0 | 1 | 3 | 0 | 0 |
General | 9 | 9 | 9 | 3,785 | 4,040 | 4,043 | 0 | 0 | 3 | 0 | 6 |
Total | 59 | 59 | 59 | 25,551 | 25,876 | 26,062 | 1 | 1 | 22 | 4 | 32 |
Source: 10-K FY2025, 10-K FY2026, 10-Q Q2 FY2027 (Item 1A; words count heading and body)

CrowdStrike risk factor changes FY2026 against FY2025
Table 8.2 Item 1A risk factors in the FY2026 10-K and change against the FY2025 10-K
| Category | Risk factor | Words FY2026 | Change in words | Status | What changed |
|---|---|---|---|---|---|
Business and industry | Incident of 19 July 2024 | 700 | (119) | Reworded | Cost categories, management time, added personnel and remediation failure sentences removed; the condition of regaining customer and partner trust replaced by further negative media coverage (119 words shorter). |
Business and industry | Managing growth | 293 | (21) | Reworded | Headcount example (7,273 employees in January 2023, 10,118 in January 2025) removed. |
Business and industry | History of losses | 206 | (23) | Updated | Net loss $162.5m for FY2026; accumulated deficit $1.3bn ($1.1bn a year earlier). |
Business and industry | Attracting new customers | 439 | 9 | Reworded | Changes and uncertainty in trade policies or tariffs added as a cause of delayed security spending. |
Business and industry | Renewals and module expansion | 329 | (1) | Updated | One verb changed ("result from"). |
Business and industry | Sales cycles | 311 | 11 | Reworded | Geopolitical conditions, trade policies and tariffs added; longer sales cycles after the incident now "may continue" (FY2025: "expect to continue"). |
Business and industry | Competition | 825 | 0 | Reworded | Market conditions "are changing rapidly and significantly" through AI (FY2025: "could change"). |
Business and industry | Hiring and retention | 462 | 26 | Reworded | Adds that the Strategic Plan (about 500 positions, 5% of workforce, announced 6 May 2025) could affect recruiting and retention. |
Business and industry | Fluctuating results | 669 | 4 | Reworded | Tariffs and trade restrictions added to the list of economic conditions. |
Business and industry | International operations | 686 | 21 | Reworded | Threat of changes in tariffs and tax treaties added; digital sovereignty requirements emerging in the EU added; international revenue 33% in FY2026 (32% in FY2025). |
Business and industry | Government sales | 678 | 0 | Updated | One conjunction changed in the certification bullet. |
Business and industry | Scaling technology | 591 | 12 | Reworded | Investment in new technologies "including those involving AI"; reliance on external platforms in several layers of technology stacks added. |
Business and industry | Additional capital | 277 | (3) | Reworded | Revolving facility removed from the stated sources of liquidity for the next 12 months. |
Business and industry | Equipment suppliers and supply chain | 284 | 46 | Reworded | Adds tariffs and trade restrictions, component shortages and price increases from higher demand, and risks that grow with scale. |
Business and industry | 14 unchanged factors | 4,866 | 0 | Unchanged | Text identical: Adoption of cloud delivered endpoint security (299 words), Product enhancement and new products (279 words), Pricing pressure (128 words), Product defects, errors and vulnerabilities (825 words), Cyberattacks on CrowdStrike (771 words), Data centers and cloud hosting (588 words), Key personnel (199 words), Direct sales force (324 words), Ratable revenue recognition (286 words), Brand and reputation (474 words), Channel and technology partners (261 words), Customer support (135 words), Company culture (177 words), Customer credit risk (120 words). |
Intellectual property, legal and regulatory | Data privacy and security laws | 1,804 | 219 | Reworded | Adds 219 words: UK Data Use and Access Act 2025, EU Digital Services Act, Data Act, Network and Information Security Directive II and Digital Operational Resiliency Act; UK adequacy decision now runs to December 2031. |
Intellectual property, legal and regulatory | Compliance with laws and public sector contracting | 494 | 24 | Reworded | Digital sovereignty requirements added to topics of new regulation; sentence on higher operating costs of compliance added. |
Intellectual property, legal and regulatory | Use of AI | 790 | 67 | Reworded | Adds that incorporating AI requires sizable resources and that the investments may fail to deliver anticipated benefits; adds delays in customer purchasing decisions; EU AI Act provisions effective February 2025; Texas, Colorado and Utah AI laws (FY2025 named the EU AI Act, published 12 July 2024 and in force 1 August 2024, and California laws of 2024). |
Intellectual property, legal and regulatory | 9 unchanged factors | 4,221 | 0 | Unchanged | Text identical: Protection of intellectual property (543 words), Infringement claims (711 words), Third party licenses (256 words), Export controls and sanctions (399 words), Anti corruption laws (350 words), Open source software (631 words), Service level commitments (193 words), Litigation (329 words), Warranty, product liability and indemnity (809 words). |
Ownership of common stock | Share price volatility | 555 | 7 | Reworded | Amounts or frequency of stock repurchases added to the list of price drivers. |
Ownership of common stock | Share repurchase program | 250 | 250 | New | New factor (250 words): $1.0bn program authorized June 2025 uses cash and may leave long term stockholder value unchanged if the share price falls below repurchase prices; $50.6m repurchased from 1 February to 4 March 2026, $949.4m of authorization remaining at 4 March 2026. |
Ownership of common stock | Sales of shares and dilution | 154 | 2 | Updated | Shares outstanding 1.01bn at 28 February 2026 (991.5m a year earlier), split adjusted. |
Ownership of common stock | Dividends | 153 | 2 | Reworded | Dividend restriction now refers to "any future credit facility" (FY2025: the existing credit facility). |
Ownership of common stock | 3 unchanged factors | 939 | 0 | Unchanged | Text identical: Analyst coverage (211 words), Charter and Delaware takeover provisions (437 words), Exclusive forum bylaw (291 words). |
Indebtedness | Indebtedness | 108 | (48) | Reworded | Availability of up to $750m under the revolving facility and its variable rate exposure removed; $750m of Senior Notes remains. |
Indebtedness | Debt service | 424 | (77) | Reworded | Credit agreement limits on asset sales and remedies of revolving lenders and secured lenders removed. |
Indebtedness | Restrictive covenants | 328 | (148) | Reworded | Heading now names the indenture and future credit agreements; financial ratio covenants of the revolving facility removed (148 words shorter). |
Indebtedness | Cross default provisions | 0 | (190) | Dropped | Dropped (190 words); revolving facility expired in January 2026. |
General | Tax structure and tax law | 1,150 | 378 | Reworded | Adds 378 words: One Big Beautiful Bill Act of 4 July 2025, executive order of 20 January 2025 on the OECD framework, G7 side by side agreement of 28 June 2025 and OECD guidance of 5 January 2026. |
General | Net operating loss carryforwards | 223 | (128) | Reworded | Paragraph on ownership change limits under Sections 382 and 383 removed; federal carryforwards $2.6bn ($1.4bn a year earlier). |
General | Corporate responsibility expectations | 232 | 5 | Reworded | Heading and text replace environmental, social and governance with corporate responsibility; expectations described as evolving and possibly contradictory; compliance effort described as incurred. |
General | 6 unchanged factors | 2,435 | 0 | Unchanged | Text identical: Internal controls (523 words), Acquisitions and strategic investments (589 words), Sales and use tax (172 words), Accounting estimates (358 words), Equity investments (361 words), Catastrophic events (432 words). |
Source: 10-K FY2025, 10-K FY2026

CrowdStrike 10-Q risk factor updates in FY2027 and AI risk wording
Item 1A mentions AI 37 times in the 10-K FY2025, 41 in the 10-K FY2026 and 42 in the 10-Q Q2 FY2027; the term agentic appears 3 times, all in the Q2 FY2027 10-Q.
Table 8.3 Item 1A changes in the Q2 FY2027 10-Q against the FY2026 10-K
| Category | Risk factor | Status | What changed | First filed in |
|---|---|---|---|---|
Intellectual property, legal and regulatory | Use of AI | Reworded | "generative and agentic AI" replaces generative AI in three sentences; Illinois and New York added to states with AI laws; proposals for such laws described as widespread. | 10-Q Q2 FY2027 |
Business and industry | Cyberattacks on CrowdStrike | Reworded | Adds that attacks are becoming more sophisticated as threat actors use AI technologies (10-K FY2025 and FY2026: 0 references to AI in this factor). | 10-Q Q2 FY2027 |
Business and industry | International operations | Reworded | Adds 108 words on foreign currency forward contracts: hedges may be ineffective and carry counterparty credit and settlement cash flow risk; international revenue 35% in H1 FY2027. | 10-Q Q2 FY2027 |
Business and industry | Product defects, errors and vulnerabilities | Reworded | Example replaced: path traversal vulnerability in certain LogScale versions, fixed with a security advisory in April 2026 (10-K: Falcon Linux sensor issue of February 2025). | 10-Q Q2 FY2027 |
Ownership of common stock | Share repurchase program | Reworded | Adds authorization of a further $500m announced 6 April 2026; total program $1.5bn. | 10-Q Q1 FY2027 |
Business and industry | History of losses | Updated | Accumulated deficit $1.2bn at 31 July 2026; profitability stated for Q1 and Q2 FY2027. | 10-Q Q2 FY2027 |
Ownership of common stock | Sales of shares and dilution | Updated | 1,023,934,842 shares outstanding at 20 August 2026. | 10-Q Q2 FY2027 |
Ownership of common stock | Dividends | Updated | Heading and text now refer to cash dividends. | 10-Q Q1 FY2027 |
Business and industry | Direct sales force | Updated | "incentivizing" added to recruiting, training and retaining sales personnel. | 10-Q Q1 FY2027 |
Intellectual property, legal and regulatory | Data privacy and security laws | Updated | UK Data Use and Access Act 2025 described in the past tense as phased in. | 10-Q Q2 FY2027 |
Indebtedness | Indebtedness | Updated | $750m of principal outstanding restated at 31 July 2026. | 10-Q Q2 FY2027 |
Several | Hiring and retention, Litigation, Internal controls, Tax structure and tax law, Accounting estimates | Updated | Statement references changed to condensed consolidated or unaudited statements; one typographical edit in the tax factor. | n/a |
All | Remaining 43 factors | Unchanged | Text identical to the 10-K. | n/a |
Source: 10-K FY2026, 10-Q Q1 FY2027, 10-Q Q2 FY2027

CrowdStrike legal proceedings, market risk and cybersecurity governance
Notes to the financial statements describe 12 lawsuits over the 19 July 2024 incident, a count across 1 securities class action, 2 passenger class actions, 8 derivative suits and the Delta case: at 26 August 2026 the Delta case is in discovery and the other 11 ended in dismissal or voluntary dismissal.
Table 8.4 Legal proceedings and government inquiries, status as filed
| Matter | Filed | 10-K FY2025 (filed 10 Mar 2025) | 10-K FY2026 (filed 4 Mar 2026) | 10-Q Q2 FY2027 (filed 26 Aug 2026) |
|---|---|---|---|---|
Securities class action against the company and certain officers, federal court, Western District of Texas | 30 Jul 2024 | Amended complaint filed 21 January 2025 | Motion to dismiss filed 7 April 2025 and granted 12 January 2026; final judgment entered 28 January 2026; appeal period lapsed and judgment is final | Removed from the list of proceedings |
Two passenger class actions over flight disruptions, Western District of Texas | 5 and 19 Aug 2024 | Consolidated 6 November 2024; consolidated complaint 6 December 2024; motion to dismiss filed 4 February 2025 | Dismissed with final judgment 18 June 2025; plaintiffs appealed to the Fifth Circuit 25 June 2025; appeal pending | Fifth Circuit affirmed the dismissal 20 May 2026 and denied panel or en banc rehearing 15 June 2026 |
Three derivative suits against certain officers and directors, Western District of Texas | 4, 11 and 20 Sep 2024 | Consolidated and stayed 21 November 2024 pending the securities class action | Stayed | Court ordered dismissal 16 April 2026 |
Derivative suit, federal court, District of Delaware | 9 Apr 2025 | n/a (suit filed after this 10-K) | Voluntarily dismissed without prejudice 22 May 2025 | Removed from the list of proceedings |
Two further derivative suits, Western District of Texas | 10 Apr 2025 | n/a (suit filed after this 10-K) | Consolidated 23 May 2025; stayed 18 July 2025 | Court ordered dismissal 7 April 2026 |
Two derivative suits, Delaware Court of Chancery | 3 and 17 Jul 2025 | n/a (suit filed after this 10-K) | Consolidated and stayed 18 August 2025 | Court ordered dismissal 18 March 2026 |
Delta Airlines, Inc. (name as filed) against CrowdStrike, Inc., Superior Court of Fulton County, Georgia (Metro Atlanta Business Case Division); unspecified monetary and punitive damages sought | 25 Oct 2024 | Motion to dismiss filed 16 December 2024 | Motion granted in part and denied in part 16 May 2025; discovery ongoing | Discovery ongoing |
Requests for information from the US Department of Justice and the SEC | First disclosed in 10-Q Q1 FY2026 | Inquiries from governmental authorities, no agency named | Requests cover recognition of revenue and reporting of ARR for transactions with certain customers, the incident and related matters; company cooperating | Same wording as 10-K FY2026 |
Customer and third party claims; other governmental inquiries | From Jul 2024 | Some customers and third parties asserted claims or publicly threatened litigation | Claims asserted; company cooperating with inquiries | Company "has cooperated and provided information" |
Loss estimate for all matters above | n/a | Loss reasonably possible; amount or range stated as impossible to estimate at an early stage | Same, at the "current stage"; 0 range disclosed | Same as 10-K FY2026 |
Webroot and Open Text patent suit (filed March 2022) | Mar 2022 | Settled and dismissed under an agreement of November 2023; amount stated as immaterial | Removed from the note | Removed from the note |
Source: 10-K FY2025, 10-K FY2026, 10-Q Q2 FY2027, 10-Q Q1 FY2026 (Note 10 in each 10-K, Note 11 in the 10-Q)
Table 8.5 Expenses and accrual for the 19 July 2024 incident and related matters
| Measure | FY2025 | FY2026 | H1 FY2027 |
|---|---|---|---|
Expenses incurred, net of insurance receivable recorded | $60.1m | $117.7m | $3.6m |
Payments made, net of cash received | $38.9m | $123.4m | $6.0m |
Accrued balance at period end | $21.1m | $15.5m | $13.1m |
Source: 10-K FY2026, 10-Q Q2 FY2027

Table 8.6 Item 7A and 10-Q Item 3 market risk disclosures as filed
| Measure | Latest | Prior |
|---|---|---|
Increase in operating loss from a hypothetical 10% adverse change in the US dollar | $138.8m in FY2026 | $108.3m in FY2025, $75.8m in FY2024, $55.5m in FY2023 |
Currency hedging | Forward contracts designated as cash flow hedges entered in Q2 FY2027: $57.9m notional at 31 July 2026, maximum maturity 3 months | 0 derivative or hedging transactions at 31 January 2026 |
Effect of a hypothetical 10% US dollar appreciation at 31 July 2026 | Stated as immaterial to results and cash flows | n/a |
Currencies named for operating expense exposure | British Pound, Australian Dollar and Euro | Same |
Cash and cash equivalents | $5.2bn at 31 January 2026 | $4.3bn at 31 January 2025 |
Effect of a hypothetical 100 basis point rate change on portfolio fair value | Stated as immaterial | Stated as immaterial |
Interest rate on debt | Senior Notes fixed at 3.00% | Senior Notes fixed; revolving facility tied to Term SOFR |
Source: 10-K FY2025, 10-K FY2026, 10-Q Q2 FY2027
Table 8.7 Item 1C cybersecurity disclosure, FY2026 against FY2025
| Topic | 10-K FY2026 | 10-K FY2025 |
|---|---|---|
Material incidents | 0 cybersecurity threats or incidents identified in fiscal 2026 with a material effect on strategy, results or financial condition | Same statement for fiscal 2025 |
Board oversight | Audit Committee, which reports material incidents to the full board | Same |
Management | Chief Information Security Officer directs the programs and updates the Audit Committee and board regularly | Same |
Testing | Table top exercises, penetration testing, independent third party audits, annual internal assessment | Same |
Text | Identical to FY2025 apart from the fiscal year | n/a |
Source: 10-K FY2025, 10-K FY2026 (Item 1C)
9 Stock Price, Scenarios & Sensitivity
Shares closed at $275.04 on 9 October 2026, 184.6x TTM FCF, against arithmetic outcomes for FY2030 of $67, $263 and $748 under the three sets of assumptions in Table 9.2. Current multiple is above the P / FCF at each of the five fiscal year ends from FY2022 to FY2026 (36x to 93x); the best case holds it and the base case applies their median of 89x.
CrowdStrike stock price history

Table 9.1 Share price markers to 9 October 2026
| Item | Value |
|---|---|
| Close, 9 October 2026 | $275.04 |
| 52 week high, intraday, 6 October 2026 | $286.99 |
| Highest close of the past 12 months, 6 October 2026 | $278.86 |
| 52 week low, intraday, February 2026 | $85.68 |
| Lowest month end close of the past 12 months, February 2026 | $93.00 |
| Change against month end October 2025 | 103% |
| Change against month end October 2021 | 290% |
| IPO price, 12 June 2019 | $34.00 as filed; $8.50 split adjusted |
| Close before Q2 FY2027 results, 26 August 2026 | $189.18 |
| Close after Q2 FY2027 results, 27 August 2026 | $227.96, up 20.5% |
Source: Market data, 9 October 2026 (closes of 26 and 27 August 2026 and month end closes: single source); 424B4, SEC filings via SEC-API.io; market value and TTM multiples are in Table 4.5
Three year scenario analysis, FY2028 to FY2030
Base case revenue of $10.9bn and FCF per diluted share of $2.95 in FY2030 give $263 a share at 89x, (5)% against the close of 9 October 2026; the worst case gives $67 at 36x and the best case $748 at 185x. FY2027E is H1 FY2027 actuals plus guidance midpoints of 26 August 2026.
Table 9.2 Scenario assumptions and FY2030 arithmetic outcomes
| Item | FY2027E (guidance midpoint, 26 August 2026) | Worst | Base | Best |
|---|---|---|---|---|
| Inputs (assumption) | ||||
Revenue growth FY2028 / FY2029 / FY2030 | 24.7% | 16% / 14% / 12% | 24% / 22% / 20% | 30% / 30% / 28% |
Gross margin, FY2030 (equal annual steps from FY2027E; FY2027E at the H1 FY2027 rate) | 74.9% | 74% | 76% | 78% |
Non GAAP operating margin, FY2030 (equal annual steps) | 25.0% | 23% | 28% | 32% |
Gap between non GAAP and GAAP operating margin, FY2030 (equal annual steps) | 26.6% | 26.5% | 23.0% | 20.0% |
FCF margin, FY2030 (equal annual steps) | 29.0% | 24% | 30% | 34% |
Diluted share count change a year | 1.04bn shares | 3.0% | 2.0% | 1.5% |
Exit multiple, price / FCF per diluted share | 184.6x TTM | 36x | 89x | 185x |
Non GAAP other income, held flat; tax rate 21% | $152m | $152m | $152m | $152m |
| Outcomes, FY2030 | ||||
Revenue | $6.00bn | $8.89bn | $10.9bn | $13.0bn |
Gross profit | $4.50bn | $6.58bn | $8.28bn | $10.1bn |
GAAP operating income (FY2027E: non GAAP guidance less the H1 FY2027 gap) | ($96m) | ($311m) | $545m | $1.56bn |
GAAP operating margin | (1.6)% | (3.5)% | 5.0% | 12.0% |
Non GAAP operating income | $1.50bn | $2.04bn | $3.05bn | $4.15bn |
FCF (FY2027E: H1 FCF of $850m plus H2 revenue at the TTM margin of 28.3%) | $1.74bn | $2.13bn | $3.27bn | $4.41bn |
Diluted shares | 1.04bn | 1.14bn | 1.11bn | 1.09bn |
Non GAAP EPS | $1.25 to $1.26 | $1.52 | $2.28 | $3.12 |
FCF per diluted share | $1.67 | $1.87 | $2.95 | $4.04 |
Implied share price (FCF per share x exit multiple) | $275.04 close | $67.32 | $262.55 | $747.96 |
Implied price against close of 9 October 2026 | n/a | (76)% | (5)% | 172% |
Source: 8-K Exhibit 99.1, 26 August 2026; 10-Q Q2 FY2027; 10-K FY2026, SEC filings via SEC-API.io; Market data, 9 October 2026

Best case critical factors and demand drivers
Table 9.3 Filed data point behind each best case input
| Factor | Filed data point | Best case input |
|---|---|---|
Net new ARR | $332.8m in Q2 FY2027, 51% above Q2 FY2026; FY2027 guidance of 34% growth at the midpoint | Revenue growth of 30% in FY2028 and FY2029 |
Ending ARR | $5.84bn at 31 July 2026, 25% year on year; FY2027 guidance $6.60bn to $6.61bn, 25.8% above FY2026 | Revenue growth of 28% in FY2030 |
Falcon Flex | Ending ARR from Flex accounts above $2.29bn, 101% year on year, 39.2% of ending ARR | Revenue growth of 28% to 30% against 24.7% in FY2027E |
RPO | $10.7bn at 31 July 2026, 48.6% year on year, 46% due within 12 months | Revenue growth of 28% to 30% |
Retention and module adoption | Dollar based net retention 115% at 31 January 2026; 51% of subscription customers with six or more modules at 31 July 2026 | Revenue growth of 28% to 30% |
Operating margin | Non GAAP operating margin 25.3% in Q2 FY2027 against 21.8% in Q2 FY2026; gross margin 74.6% | Non GAAP operating margin 32%, gross margin 78% |
FCF margin | 34.0% in Q1 FY2027, 28.3% TTM, 30.8% in FY2024 | FCF margin 34% |
Dilution | SBC 23.6% of H1 FY2027 revenue; $176m repurchased in H1 FY2027, $1.30bn authorization remaining | Share count change 1.5% a year |
Exit multiple | Price / TTM FCF of 184.6x on 9 October 2026; 36x to 93x at the five fiscal year ends | 185x held to FY2030 |
Source: 8-K Exhibit 99.1, 26 August 2026; 10-Q Q2 FY2027; 10-K FY2026, SEC filings via SEC-API.io; Market data, 9 October 2026
Sensitivity analysis and filed history against scenario assumptions
An exit multiple of 36x to 185x moves the base case price from $106 to $546, the growth path from $214 to $313, FCF margin of 24% to 34% from $210 to $298 and share count change of 3.0% to 1.5% a year from $255 to $266.


Table 9.4 Filed FY2022 to FY2026, TTM and FY2027E against FY2030 scenario assumptions (revenue and other margins in Tables 2.5, 2.6 and 9.2)
| Period | Revenue growth | Non GAAP operating margin | FCF margin | Share count change (filed: weighted basic; scenarios: diluted) | Price / FCF per diluted share at period end |
|---|---|---|---|---|---|
FY2022 | 66.0% | 13.5% | 30.4% | 4.3% | 93x |
FY2023 | 54.4% | 15.9% | 30.2% | 2.6% | 36x |
FY2024 | 36.3% | 21.6% | 30.8% | 2.4% | 76x |
FY2025 | 29.4% | 22.3% | 27.0% | 2.6% | 91x |
FY2026 | 21.7% | 21.7% | 25.8% | 2.4% | 89x |
TTM Q2 FY2027 (share count: Q2 FY2027 against Q2 FY2026) | 24.3% | 23.9% | 28.3% | 2.0% | 184.6x |
FY2027E | 24.7% | 25.0% | 29.0% | n/a | n/a |
Worst case, FY2030 | 12.0% | 23.0% | 24.0% | 3.0% | 36x |
Base case, FY2030 | 20.0% | 28.0% | 30.0% | 2.0% | 89x |
Best case, FY2030 | 28.0% | 32.0% | 34.0% | 1.5% | 185x |
Source: 10-K FY2022, FY2023, FY2024, FY2025, FY2026; 10-Q Q2 FY2027; 8-K Exhibit 99.1, 26 August 2026; SEC filings via SEC-API.io; Market data at fiscal year ends (single source) and 9 October 2026
Sources and method
- Filings: 10-K FY2026 and the 10-K filings for FY2022 to FY2025; 10-Q Q2 FY2027 and the 10-Q filings from Q3 FY2025; DEF 14A of 5 May 2026; 8-K filings of 26 August 2026 (results), 22 June 2026 (annual meeting) and 3 June 2026 (results and stock split); Forms 4, 144, 13F and Schedule 13G; the 2019 424B4; peer 10-K and 10-Q filings.
- SEC filings via SEC-API.io.
- Market data as of 9 October 2026.
- Earnings calls of 3 March 2026, 3 June 2026 and 26 August 2026, in indirect speech.
- Third party research: Gartner and IDC publications as dated in Table 4.1.
- Scenario figures are arithmetic outcomes of stated assumptions.
Sources appendix
Every filing referenced in this analysis, sorted by form and then by date. Each accession number links to the filing on sec.gov. Count: 178 filings.
Table A.1 CrowdStrike Holdings, Inc. filings, with ownership filings by holders and insiders
Table A.2 Filings of peers and other companies
| Company | Form | Period or filing date | Accession number |
|---|---|---|---|
| Cloudflare | 10-K | 31 Dec 2025 | 0001477333-26-000016 |
| Cloudflare | 10-Q | 30 Jun 2026 | 0001477333-26-000054 |
| Cloudflare | 10-Q | 30 Jun 2025 | 0001477333-25-000137 |
| Fortinet | 10-K | 31 Dec 2025 | 0001262039-26-000007 |
| Fortinet | 10-Q | 30 Jun 2026 | 0001262039-26-000021 |
| Fortinet | 10-Q | 30 Jun 2025 | 0001262039-25-000028 |
| Okta | 10-K | 31 Jan 2026 | 0001660134-26-000020 |
| Okta | 10-Q | 31 Jul 2026 | 0001660134-26-000069 |
| Okta | 10-Q | 31 Jul 2025 | 0001660134-25-000157 |
| Palo Alto Networks | 10-K | 31 Jul 2026 | 0001327567-26-000023 |
| SentinelOne | 10-K | 31 Jan 2026 | 0001583708-26-000020 |
| SentinelOne | 10-Q | 31 Jul 2026 | 0001583708-26-000055 |
| SentinelOne | 10-Q | 31 Jul 2025 | 0001583708-25-000148 |
| Zscaler | 10-K | 31 Jul 2026 | 0001713683-26-000157 |
| Zscaler | 10-K | 31 Jul 2025 | 0001713683-25-000158 |
This report is for information only and is not financial advice.
Read next
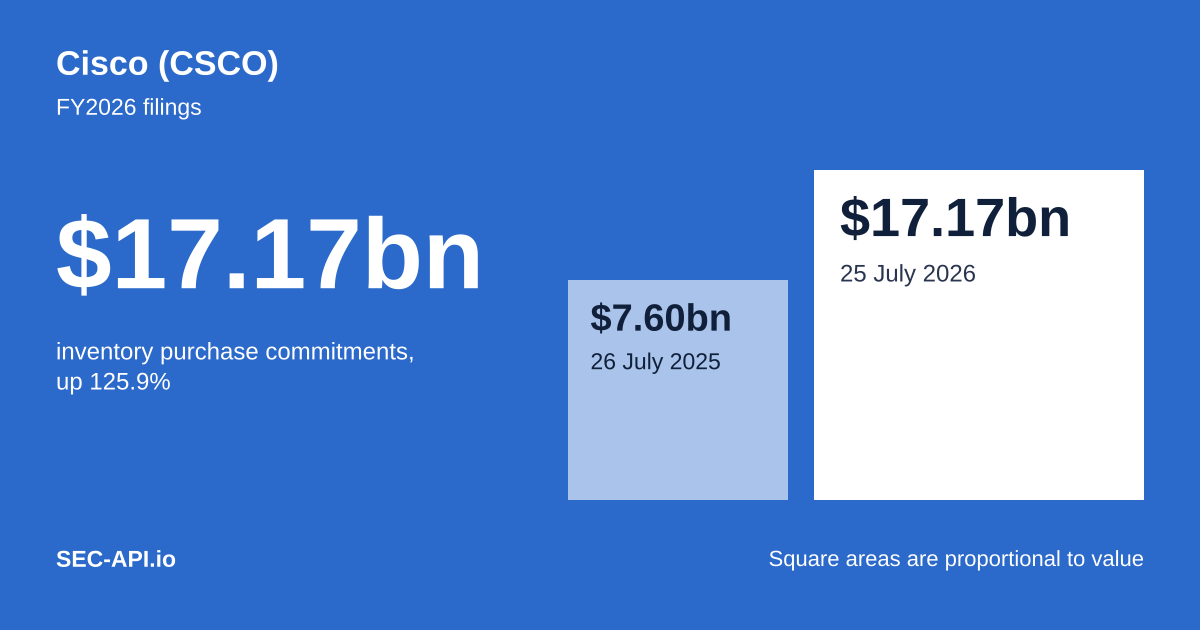
Cisco (CSCO) FY2026 annual results analysis: AI infrastructure orders, purchase commitments, margins, peers and scenarios to FY2030
October 12, 2026·76 min read
IBM (IBM) stock after the Q2 2026 guidance cut: software growth, Confluent acquisition, debt, dividend cover and scenarios to FY2029
October 12, 2026·72 min read