Dell Technologies Inc. (DELL), Financial Analysis
Insights derived from analysing SEC filings. Independent analysis, not a publication of the SEC.
Figures are read from the Forms 10-K for fiscal years 2023, 2024, 2025 and 2026, the Forms 10-Q for the first three quarters of fiscal 2026 and the first two of fiscal 2027, the 31 Forms 8-K filed between January 2025 and September 2026 together with their quarterly earnings exhibits 99.1, the definitive proxy statement of 15 May 2026 and the Item 5.07 voting results of 1 July 2026, on the record for central index key 1571996, together with the comparable annual reports of nine peers. Management commentary is quoted from the company hosted earnings calls of 26 February 2026, 28 May 2026 and 1 September 2026, which are not SEC filings. Fiscal 2024 figures are the revised figures published in the fiscal 2025 annual report. Accession numbers for every filing used appear in the Sources appendix. Market prices are the closing prices of 23 September 2026.
1. Summary
Dell Technologies carried a $95bn AI server backlog at 31 July 2026, 5.79 times the AI server revenue it recognised in that quarter. Net revenue rose 18.8% to $113.5bn in fiscal 2026 while the gross margin fell 220 basis points to 20.0%, the lowest of the five years covered here, and the annual report attributes that fall primarily to the shift in mix toward AI optimised servers. Operating margin rose to 7.2% from 6.5% over the same year, with operating expenses at 12.8% of revenue against 15.7%. In the first half of fiscal 2027 revenue reached $90.8bn, 47.3% of the $192bn full year guidance, at a gross margin of 19.4% and an operating margin of 10.0%. The share closed at $549.83, 63.3 times fiscal 2026 earnings and 22.4 times the base case fiscal 2027 earnings set out in section 14.

2. Revenue and the business model
Dell sells servers, networking equipment, storage, personal computers and peripherals in more than 170 countries, and finances a part of those sales through Dell Financial Services. The annual report puts headcount at about 97,000 at 30 January 2026 and states that other sales channels, meaning resellers, system integrators, distributors and retailers, generated approximately 40% of net revenue in fiscal 2026, with the balance sold directly. Dell Financial Services funded $11.9bn of originations during the year and held a $14.3bn portfolio of financing receivables at the year end. Sales outside the United States were approximately 45% of consolidated net revenue.
The business reports in two segments. Infrastructure Solutions Group revenue grew 39.5% to $60.8bn in fiscal 2026 and passed Client Solutions Group revenue for the first time in the period covered here. Client Solutions Group revenue grew 5.4% to $51.0bn. Segment operating margins moved in opposite directions over the five years: Infrastructure ran at 11.7% in fiscal 2026 against 10.9% in fiscal 2022, while Client fell to 5.6% from 7.1%. The annual report attributes the 110 basis point fall in the Infrastructure margin in fiscal 2026 to a gross margin rate that fell faster than the operating expense rate, driven by the shift toward AI optimised servers.

Table 1. Revenue and operating income by segment and product line, USD millions
| Line | FY2022 | FY2023 | FY2024 | FY2025 | FY2026 | |||||||||||||||||||||||||||||||||||||||||||||||||||||||||||||||||||||||||||||||||||||||||||||
|---|---|---|---|---|---|---|---|---|---|---|---|---|---|---|---|---|---|---|---|---|---|---|---|---|---|---|---|---|---|---|---|---|---|---|---|---|---|---|---|---|---|---|---|---|---|---|---|---|---|---|---|---|---|---|---|---|---|---|---|---|---|---|---|---|---|---|---|---|---|---|---|---|---|---|---|---|---|---|---|---|---|---|---|---|---|---|---|---|---|---|---|---|---|---|---|---|---|---|
| Infrastructure Solutions Group | 34,366 | 38,356 | 33,885 | 43,593 | 60,826 | |||||||||||||||||||||||||||||||||||||||||||||||||||||||||||||||||||||||||||||||||||||||||||||
| Growth, % | n/a | 11.6 | (11.7) | 28.6 | 39.5 | |||||||||||||||||||||||||||||||||||||||||||||||||||||||||||||||||||||||||||||||||||||||||||||
| Operating income | 3,736 | 5,045 | 4,286 | 5,579 | 7,111 | |||||||||||||||||||||||||||||||||||||||||||||||||||||||||||||||||||||||||||||||||||||||||||||
| Operating margin, % | 10.9 | 13.2 | 12.6 | 12.8 | 11.7 | |||||||||||||||||||||||||||||||||||||||||||||||||||||||||||||||||||||||||||||||||||||||||||||
| Client Solutions Group | 61,464 | 58,213 | 48,916 | 48,393 | 50,984 | |||||||||||||||||||||||||||||||||||||||||||||||||||||||||||||||||||||||||||||||||||||||||||||
| Growth, % | n/a | (5.3) | (16.0) | (1.1) | 5.4 | |||||||||||||||||||||||||||||||||||||||||||||||||||||||||||||||||||||||||||||||||||||||||||||
| Operating income | 4,365 | 3,824 | 3,712 | 2,972 | 2,833 | |||||||||||||||||||||||||||||||||||||||||||||||||||||||||||||||||||||||||||||||||||||||||||||
| Operating margin, % | 7.1 | 6.6 | 7.6 | 6.1 | 5.6 | |||||||||||||||||||||||||||||||||||||||||||||||||||||||||||||||||||||||||||||||||||||||||||||
| Corporate and other | 5,367 | 5,732 | 5,624 | 3,581 | 1,728 | |||||||||||||||||||||||||||||||||||||||||||||||||||||||||||||||||||||||||||||||||||||||||||||
| Consolidated net revenue | 101,197 | 102,301 | 88,425 | 95,567 | 113,538 | |||||||||||||||||||||||||||||||||||||||||||||||||||||||||||||||||||||||||||||||||||||||||||||
| Product lines inside the two segments, revenue only | ||||||||||||||||||||||||||||||||||||||||||||||||||||||||||||||||||||||||||||||||||||||||||||||||||
| AI optimised servers | n/a | n/a | 1,873 | 9,286 | 24,683 | |||||||||||||||||||||||||||||||||||||||||||||||||||||||||||||||||||||||||||||||||||||||||||||
| Traditional servers and networking | n/a | n/a | 15,751 | 17,850 | 19,512 | |||||||||||||||||||||||||||||||||||||||||||||||||||||||||||||||||||||||||||||||||||||||||||||
| Storage | 16,465 | 17,958 | 16,261 | 16,457 | 16,631 | |||||||||||||||||||||||||||||||||||||||||||||||||||||||||||||||||||||||||||||||||||||||||||||
| Commercial client | 45,576 | 45,556 | 39,814 | 40,844 | 44,062 | |||||||||||||||||||||||||||||||||||||||||||||||||||||||||||||||||||||||||||||||||||||||||||||
| Consumer client | 15,888 | 12,657 | 9,102 | 7,549 | 6,922 | |||||||||||||||||||||||||||||||||||||||||||||||||||||||||||||||||||||||||||||||||||||||||||||
| Servers and networking, as reported before the split | 17,901 | 20,398 | 17,624 | n/a | n/a | |||||||||||||||||||||||||||||||||||||||||||||||||||||||||||||||||||||||||||||||||||||||||||||
The AI optimised server line was disclosed separately from fiscal 2024 onward; earlier years report servers and networking as one line. Other businesses covers the former VMware resale operation, reported until fiscal 2024, and Secureworks, sold on 3 February 2025. Corporate and other is not a reportable segment. The product lines sit inside the two segments and do not add to the consolidated figure; for fiscal 2024 the servers and networking line equals the AI and traditional lines combined.
Customer concentration appeared for the first time in fiscal 2026. The concentrations note states that one customer accounted for 12% of consolidated net revenue for the year, with substantially all of that attributable to Infrastructure Solutions Group offerings, and that no single customer reached 10% in fiscal 2025 or fiscal 2024. On the supply side, non trade receivables from the three largest contract manufacturers were $13.2bn at the year end against $5.4bn a year earlier, of which $13.0bn was offset against corresponding payables.
3. The AI server transition
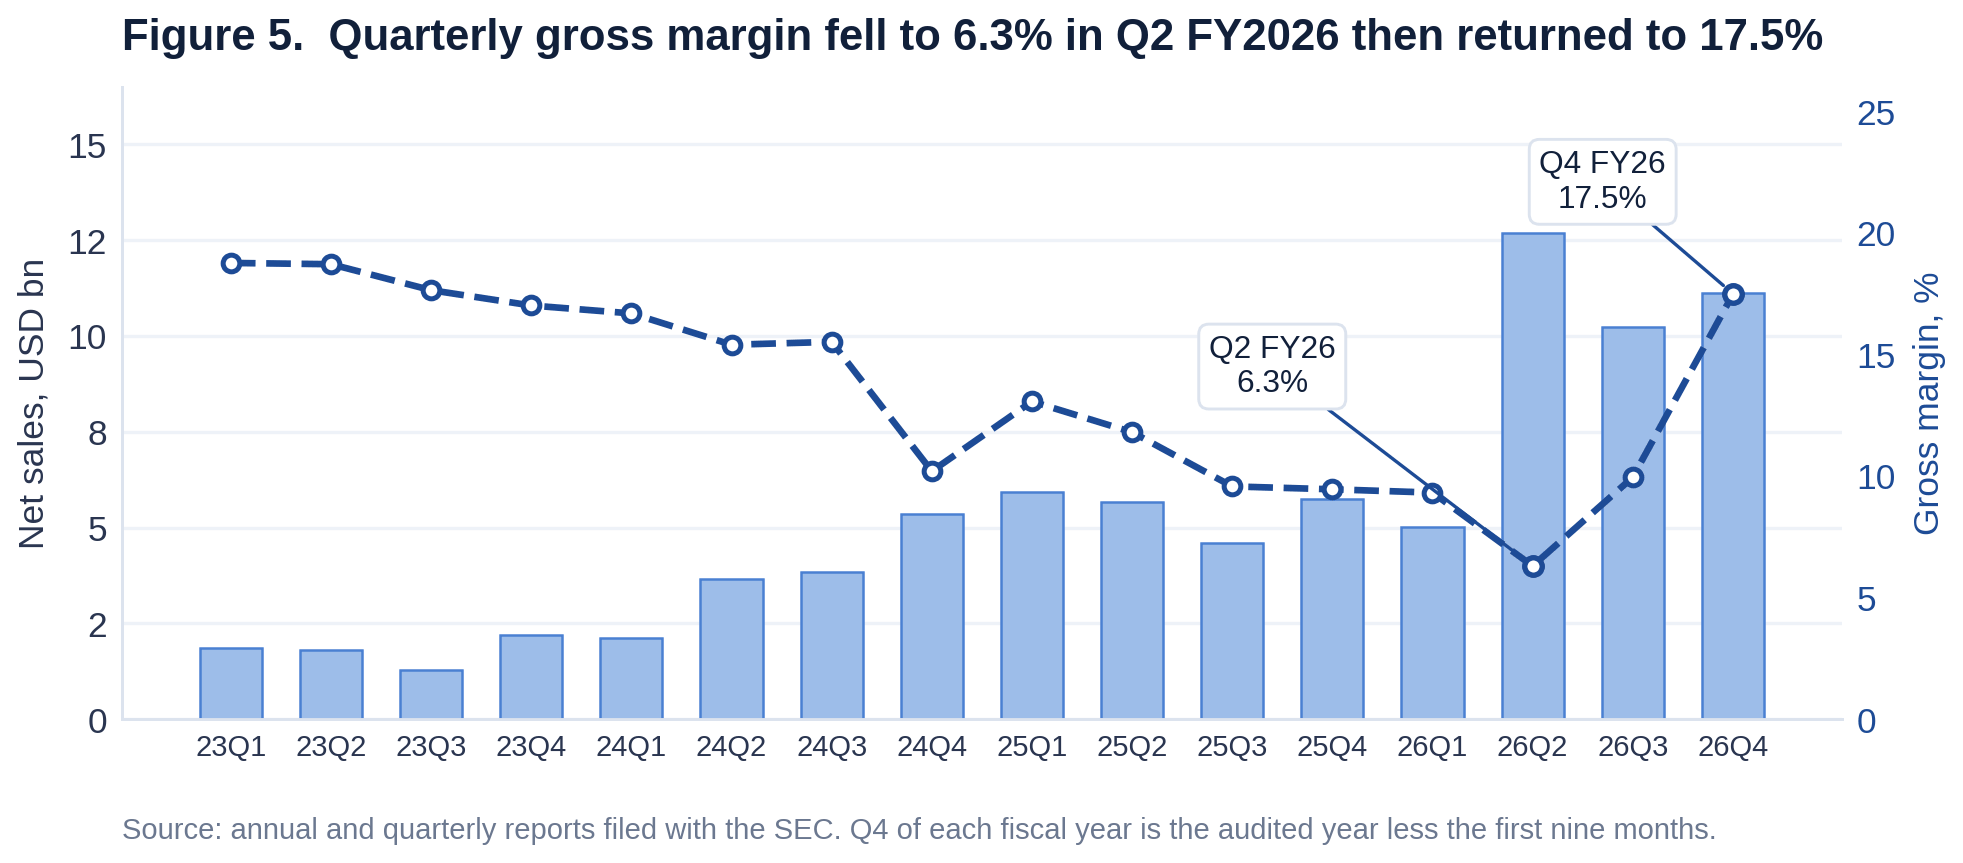
AI optimised server revenue went from $1.9bn in fiscal 2024, 2.1% of consolidated net revenue, to $24.7bn in fiscal 2026, 21.7% of it. Guidance for fiscal 2027 is $74bn, which would be 38.5% of the $192bn revenue midpoint. Over the same period the consolidated gross margin fell from 23.8% to 20.0%, and in Q1 FY2027 to 17.8%. The annual report gives one explanation for the fall, a shift in mix toward AI optimised servers. On each of the three most recent earnings calls the chief financial officer added that excluding that mix effect the gross margin rate rose year on year.

Table 2. AI optimised servers, orders, revenue and backlog, USD millions
| Quarter | Orders booked | Revenue recognised | Closing backlog | Backlog to quarterly revenue, times |
|---|---|---|---|---|
| Q4 FY2026 | 34,100 | 9,000 | 43,000 | 4.78 |
| Q1 FY2027 | 24,400 | 16,100 | 51,300 | 3.19 |
| Q2 FY2027 | 60,900 | 16,400 | 95,000 | 5.79 |
Revenue and closing backlog are from the quarterly earnings releases filed as Exhibit 99.1 to the current reports on Form 8-K of 26 February 2026, 28 May 2026 and 1 September 2026. The Q1 and Q2 FY2027 order figures are in those releases; the Q4 FY2026 order figure of $34.1bn is from the call of 26 February 2026, the release giving only the full year figure of more than $64.0bn. Backlog is not an audited measure, the three quarters do not roll exactly, since 51,300 plus 60,900 less 16,400 is 95,800 against the 95,000 stated, and the annual report states there is inherent non linearity in the timing between demand and shipment.
Orders exceeded revenue in each of the three quarters. Closing backlog was $18.4bn at the end of Q3 FY2026, $43bn at the end of Q4 FY2026 and $95bn at the end of Q2 FY2027. On the call of 1 September 2026 the chief operating officer put orders booked over the preceding twelve months at $131.7bn. The customer count Dell reports for its AI systems rose from 4,000 at the end of fiscal 2026 to 6,500 at the end of Q2 FY2027. Management states that the AI server business runs at a mid single digit operating income rate, against the 7.2% consolidated rate in fiscal 2026 and the 11.7% Infrastructure segment rate.

The backlog at the end of Q2 FY2027 was 5.79 times the AI server revenue recognised in that quarter and 3.85 times the AI server revenue recognised in the whole of fiscal 2026. The annual report states that the timing between demand and subsequent shipment is not linear, and gives the scale of the opportunities, the varying stages of customer readiness and the frequency of component part updates or transitions as the reasons. Section 8 gives the working capital position.
4. Financial analysis
Operating income of $8.1bn in fiscal 2026 was 30.7% above fiscal 2025, on revenue 18.8% higher and operating expenses 3.0% lower. Net income of $5.9bn gave earnings of $8.68 per diluted share against $6.38. Gross profit rose $1.5bn while the gross margin rate fell 220 basis points. Research and development was $3.1bn, 2.8% of revenue, against 3.2% a year earlier; selling, general and administrative expense fell 4.5% to $11.4bn, which the annual report attributes to lower employee compensation following a decline in headcount.
Table 3. Consolidated statements of income, USD millions
| Line | FY2022 | FY2023 | FY2024 | FY2025 | FY2026 |
|---|---|---|---|---|---|
| Net revenue | 101,197 | 102,301 | 88,425 | 95,567 | 113,538 |
| Cost of net revenue | 79,306 | 79,615 | 67,356 | 74,317 | 90,831 |
| Gross margin | 21,891 | 22,686 | 21,069 | 21,250 | 22,707 |
| Selling, general and administrative | 14,655 | 14,136 | 12,857 | 11,952 | 11,416 |
| Research, development and engineering | 2,577 | 2,779 | 2,801 | 3,061 | 3,142 |
| Operating expenses | 17,232 | 16,915 | 15,658 | 15,013 | 14,558 |
| Operating income | 4,659 | 5,771 | 5,411 | 6,237 | 8,149 |
| Interest and other, net | 1,264 | (2,546) | (1,324) | (1,189) | (886) |
| Income before income taxes | 5,923 | 3,225 | 4,087 | 5,048 | 7,263 |
| Income tax expense | 981 | 803 | 715 | 472 | 1,327 |
| Income from continuing operations | 4,942 | 2,422 | 3,372 | 4,576 | 5,936 |
| Income from discontinued operations, net of tax | 765 | 0 | 0 | 0 | 0 |
| Net income including non controlling interests | 5,707 | 2,422 | 3,372 | 4,576 | 5,936 |
| Net income attributable to Dell Technologies Inc. | 5,563 | 2,442 | 3,388 | 4,592 | 5,936 |
| Earnings per basic share, USD | 7.30 | 3.33 | 4.71 | 6.51 | 8.79 |
| Earnings per diluted share, USD | 7.02 | 3.24 | 4.60 | 6.38 | 8.68 |
| Basic shares, millions | 762 | 734 | 720 | 705 | 675 |
| Diluted shares, millions | 791 | 753 | 736 | 720 | 684 |
| Stock based compensation | 1,622 | 931 | 878 | 785 | 723 |
| Dividends declared per share, USD | n/a | 1.32 | 1.48 | 1.78 | 2.10 |
Fiscal 2024 is shown as revised in the fiscal 2025 annual report. Section 11 sets out the revision. Fiscal 2022 earnings per diluted share of $7.02 is the sum of $6.26 from continuing operations and $0.76 from the discontinued VMware operation. Share counts are the weighted average figures given in the earnings per share note, rounded to the million as filed.
Table 4. Consolidated statements of financial position, USD millions
| Line | FY2022 | FY2023 | FY2024 | FY2025 | FY2026 |
|---|---|---|---|---|---|
| Cash and cash equivalents | 9,477 | 8,607 | 7,366 | 3,633 | 11,528 |
| Accounts receivable, net | n/a | 12,860 | 9,343 | 10,298 | 17,585 |
| Short term financing receivables, net | 5,089 | 5,281 | 4,643 | 5,304 | 8,458 |
| Inventories | 5,898 | 4,776 | 3,622 | 6,716 | 10,437 |
| Total current assets | 45,033 | 42,351 | 35,984 | 36,229 | 57,602 |
| Property, plant and equipment, net | 5,415 | 6,209 | 6,432 | 6,336 | 6,676 |
| Long term financing receivables, net | 5,522 | 5,638 | 5,877 | 5,927 | 5,822 |
| Goodwill | 19,770 | 19,676 | 19,700 | 19,120 | 19,547 |
| Intangible assets, net | 7,461 | 6,468 | 5,701 | 4,988 | 4,533 |
| Total assets | 92,735 | 89,611 | 82,126 | 79,746 | 101,286 |
| Accounts payable | n/a | 20,665 | 19,226 | 20,832 | 33,630 |
| Accrued and other | n/a | 8,874 | 6,828 | 6,597 | 8,315 |
| Short term deferred revenue | 14,261 | 15,542 | 15,318 | 13,673 | 13,334 |
| Short term debt | 5,823 | 6,573 | 6,982 | 5,204 | 7,990 |
| Total current liabilities | 56,219 | 51,654 | 48,354 | 46,527 | 63,269 |
| Long term deferred revenue | 13,312 | 14,744 | 13,827 | 12,292 | 13,596 |
| Long term debt | 21,131 | 23,015 | 19,012 | 19,363 | 23,513 |
| Total liabilities | 94,315 | 92,636 | 84,258 | 81,133 | 103,756 |
| Non controlling interests | 105 | 97 | 95 | 95 | 0 |
| Total Dell Technologies stockholders' deficit | (1,685) | (3,122) | (2,227) | (1,482) | (2,470) |
Accounts receivable and accounts payable are presented on a consistent basis from fiscal 2024, after the separation of the former VMware related party balances. Total assets equal total liabilities plus the stockholders' deficit plus non controlling interests in every year.
Table 5. Consolidated statements of cash flows, USD millions
| Line | FY2022 | FY2023 | FY2024 | FY2025 | FY2026 |
|---|---|---|---|---|---|
| Net income including non controlling interests | 5,707 | 2,422 | 3,372 | 4,576 | 5,936 |
| Depreciation and amortisation | 4,551 | 3,156 | 3,303 | 3,123 | 3,029 |
| Cash from operations | 10,307 | 3,565 | 8,676 | 4,521 | 11,185 |
| Cash from or used in investing | 1,306 | (3,024) | (2,783) | (2,215) | (2,055) |
| Cash used in financing | (16,609) | (1,625) | (7,094) | (5,815) | (1,464) |
| Capital expenditure | 2,796 | 3,003 | 2,756 | 2,652 | 2,633 |
| Free cash flow | 7,511 | 562 | 5,920 | 1,869 | 8,552 |
| Share repurchases | 1,496 | 2,883 | 2,080 | 2,588 | 6,014 |
| Dividends paid | 0 | 964 | 1,072 | 1,275 | 1,459 |
| Debt issued | 20,425 | 12,479 | 7,775 | 9,258 | 15,004 |
| Debt repaid | 26,723 | 9,825 | 11,246 | 10,570 | 8,522 |
| Interest paid | 1,825 | 1,169 | 1,438 | 1,304 | 1,354 |
| Income taxes paid, net | 1,257 | 1,208 | 1,379 | 555 | 1,261 |
The cash flow statement starts from net income including non controlling interests, which differs from the attributable figure in Table 3 by $144m in fiscal 2022, $20m in fiscal 2023, $16m in fiscal 2024 and fiscal 2025, and nil in fiscal 2026.

5. What changed in fiscal year 2026
Table 6. Year on year change, fiscal 2026 against fiscal 2025, USD millions
| Line | FY2025 | FY2026 | Change | Change, % |
|---|---|---|---|---|
| Net revenue | 95,567 | 113,538 | 17,971 | 18.8 |
| Cost of net revenue | 74,317 | 90,831 | 16,514 | 22.2 |
| Gross margin | 21,250 | 22,707 | 1,457 | 6.9 |
| Operating expenses | 15,013 | 14,558 | (455) | (3.0) |
| Operating income | 6,237 | 8,149 | 1,912 | 30.7 |
| Net income | 4,592 | 5,936 | 1,344 | 29.3 |
| Infrastructure Solutions Group revenue | 43,593 | 60,826 | 17,233 | 39.5 |
| Client Solutions Group revenue | 48,393 | 50,984 | 2,591 | 5.4 |
| AI optimised server revenue | 9,286 | 24,683 | 15,397 | 165.8 |
| Inventories | 6,716 | 10,437 | 3,721 | 55.4 |
| Accounts receivable | 10,298 | 17,585 | 7,287 | 70.8 |
| Accounts payable | 20,832 | 33,630 | 12,798 | 61.4 |
| Cash and cash equivalents | 3,633 | 11,528 | 7,895 | 217.3 |
| Total debt, carrying value | 24,567 | 31,503 | 6,936 | 28.2 |
| Cash from operations | 4,521 | 11,185 | 6,664 | 147.4 |
| Share repurchases and dividends | 3,863 | 7,473 | 3,610 | 93.5 |
Revenue rose $18.0bn, of which $15.4bn, or 85.7%, came from AI optimised servers. Gross margin rose $1.5bn on that revenue, an incremental gross margin of 8.1%, against the 22.2% average rate carried into the year. Operating expenses fell $455m over the same period. Gross profit alone would have given operating income growth of 23.4%; the reduction in operating expenses accounts for the remaining 7.3 points.
6. Ratio analysis
Return on invested capital rose to 36.0% in fiscal 2026 from 26.1% in fiscal 2024, on an invested capital base that is small because book equity is negative. Return on equity is not presented: total stockholders' equity has been a deficit in every year here, between $3.1bn and $1.5bn, so the denominator is negative in every year. Retained earnings turned positive at $3.3bn in fiscal 2026 while treasury stock stood at $14.5bn, so the deficit sits on the balance sheet alongside positive retained earnings. Net debt to earnings before interest, tax, depreciation and amortisation fell to 1.79 times from 2.24 times and interest cover rose to 6.0 times from 4.8 times.
Table 7. Ratio analysis, fiscal years 2022 to 2026
| Ratio | FY2022 | FY2023 | FY2024 | FY2025 | FY2026 | |||||||||||||||||||||||||||||||||||||||||||||||||||||||||||||||||||||||||||||||||||||||||||||
|---|---|---|---|---|---|---|---|---|---|---|---|---|---|---|---|---|---|---|---|---|---|---|---|---|---|---|---|---|---|---|---|---|---|---|---|---|---|---|---|---|---|---|---|---|---|---|---|---|---|---|---|---|---|---|---|---|---|---|---|---|---|---|---|---|---|---|---|---|---|---|---|---|---|---|---|---|---|---|---|---|---|---|---|---|---|---|---|---|---|---|---|---|---|---|---|---|---|---|
| Growth and margin | ||||||||||||||||||||||||||||||||||||||||||||||||||||||||||||||||||||||||||||||||||||||||||||||||||
| Net revenue growth, % | n/a | 1.1 | (13.6) | 8.1 | 18.8 | |||||||||||||||||||||||||||||||||||||||||||||||||||||||||||||||||||||||||||||||||||||||||||||
| Gross margin, % | 21.6 | 22.2 | 23.8 | 22.2 | 20.0 | |||||||||||||||||||||||||||||||||||||||||||||||||||||||||||||||||||||||||||||||||||||||||||||
| Operating expenses to net revenue, % | 17.0 | 16.5 | 17.7 | 15.7 | 12.8 | |||||||||||||||||||||||||||||||||||||||||||||||||||||||||||||||||||||||||||||||||||||||||||||
| Research and development to net revenue, % | 2.5 | 2.7 | 3.2 | 3.2 | 2.8 | |||||||||||||||||||||||||||||||||||||||||||||||||||||||||||||||||||||||||||||||||||||||||||||
| Operating margin, % | 4.6 | 5.6 | 6.1 | 6.5 | 7.2 | |||||||||||||||||||||||||||||||||||||||||||||||||||||||||||||||||||||||||||||||||||||||||||||
| Net margin, % | 5.5 | 2.4 | 3.8 | 4.8 | 5.2 | |||||||||||||||||||||||||||||||||||||||||||||||||||||||||||||||||||||||||||||||||||||||||||||
| Earnings before interest, tax, depreciation and amortisation margin, % | 9.1 | 8.7 | 9.9 | 9.8 | 9.8 | |||||||||||||||||||||||||||||||||||||||||||||||||||||||||||||||||||||||||||||||||||||||||||||
| Effective tax rate, % | 16.6 | 24.9 | 17.5 | 9.4 | 18.3 | |||||||||||||||||||||||||||||||||||||||||||||||||||||||||||||||||||||||||||||||||||||||||||||
| Returns | ||||||||||||||||||||||||||||||||||||||||||||||||||||||||||||||||||||||||||||||||||||||||||||||||||
| Return on assets, % | n/a | 2.7 | 3.9 | 5.7 | 6.6 | |||||||||||||||||||||||||||||||||||||||||||||||||||||||||||||||||||||||||||||||||||||||||||||
| Return on invested capital, % | 24.6 | 25.8 | 26.1 | 31.5 | 36.0 | |||||||||||||||||||||||||||||||||||||||||||||||||||||||||||||||||||||||||||||||||||||||||||||
| Asset turnover, times | n/a | 1.12 | 1.03 | 1.18 | 1.25 | |||||||||||||||||||||||||||||||||||||||||||||||||||||||||||||||||||||||||||||||||||||||||||||
| Working capital | ||||||||||||||||||||||||||||||||||||||||||||||||||||||||||||||||||||||||||||||||||||||||||||||||||
| Inventory days | n/a | n/a | 23 | 25 | 34 | |||||||||||||||||||||||||||||||||||||||||||||||||||||||||||||||||||||||||||||||||||||||||||||
| Receivable days | n/a | n/a | 46 | 38 | 45 | |||||||||||||||||||||||||||||||||||||||||||||||||||||||||||||||||||||||||||||||||||||||||||||
| Payable days | n/a | n/a | 108 | 98 | 109 | |||||||||||||||||||||||||||||||||||||||||||||||||||||||||||||||||||||||||||||||||||||||||||||
| Cash conversion cycle, days | n/a | n/a | (40) | (35) | (30) | |||||||||||||||||||||||||||||||||||||||||||||||||||||||||||||||||||||||||||||||||||||||||||||
| Liquidity and leverage | ||||||||||||||||||||||||||||||||||||||||||||||||||||||||||||||||||||||||||||||||||||||||||||||||||
| Current ratio, times | 0.80 | 0.82 | 0.74 | 0.78 | 0.91 | |||||||||||||||||||||||||||||||||||||||||||||||||||||||||||||||||||||||||||||||||||||||||||||
| Net debt to earnings before interest, tax, depreciation and amortisation, times | 1.90 | 2.35 | 2.14 | 2.24 | 1.79 | |||||||||||||||||||||||||||||||||||||||||||||||||||||||||||||||||||||||||||||||||||||||||||||
| Interest cover, times | 2.6 | 4.9 | 3.8 | 4.8 | 6.0 | |||||||||||||||||||||||||||||||||||||||||||||||||||||||||||||||||||||||||||||||||||||||||||||
| Cash | ||||||||||||||||||||||||||||||||||||||||||||||||||||||||||||||||||||||||||||||||||||||||||||||||||
| Cash from operations to net income, times | 1.85 | 1.46 | 2.56 | 0.98 | 1.88 | |||||||||||||||||||||||||||||||||||||||||||||||||||||||||||||||||||||||||||||||||||||||||||||
| Capital expenditure to net revenue, % | 2.8 | 2.9 | 3.1 | 2.8 | 2.3 | |||||||||||||||||||||||||||||||||||||||||||||||||||||||||||||||||||||||||||||||||||||||||||||
| Shareholder returns to free cash flow, times | 0.20 | 6.85 | 0.53 | 2.07 | 0.87 | |||||||||||||||||||||||||||||||||||||||||||||||||||||||||||||||||||||||||||||||||||||||||||||
Return on equity is omitted because total stockholders' equity is negative in every year. Working capital days are shown from fiscal 2024, the first year in which receivables and payables are on a consistent basis. Days use average balances against the year net revenue or cost of net revenue. Interest cover is operating income over interest paid as reported in the cash flow statement, and cash from operations to net income uses net income attributable to Dell Technologies Inc.
7. Quarterly record
Quarterly revenue doubled between Q1 FY2026, $23.4bn, and Q2 FY2027, $47.0bn. Gross margin over the same span fell from 21.1% to a low of 17.8% in Q1 FY2027 and recovered to 20.9% in Q2 FY2027. Operating margin rose from 5.0% in Q1 FY2026 to 11.5% in Q2 FY2027, with one fall, from 9.3% in Q4 FY2026 to 8.3% in Q1 FY2027. Earnings per diluted share in Q2 FY2027 were $6.34, against $1.70 a year earlier.

Table 8. Quarterly record, USD millions
| Quarter | Period end | Net revenue | Growth, % | Gross margin, % | Operating income | Operating margin, % | Net income | Diluted EPS, USD | Infrastructure | Infrastructure growth, % | Client |
|---|---|---|---|---|---|---|---|---|---|---|---|
| Q1 FY2025 | 2024-05-03 | 22,244 | n/a | 21.8 | 965 | 4.3 | 997 | 1.37 | 9,227 | n/a | 11,967 |
| Q2 FY2025 | 2024-08-02 | 25,026 | n/a | 21.4 | 1,392 | 5.6 | 887 | 1.23 | 11,646 | n/a | 12,414 |
| Q3 FY2025 | 2024-11-01 | 24,366 | n/a | 22.0 | 1,721 | 7.1 | 1,175 | 1.64 | 11,368 | n/a | 12,131 |
| Q4 FY2025 | 2025-01-31 | 23,931 | n/a | 23.7 | 2,159 | 9.0 | 1,533 | 2.15 | 11,352 | n/a | 11,881 |
| Q1 FY2026 | 2025-05-02 | 23,378 | 5.1 | 21.1 | 1,165 | 5.0 | 965 | 1.37 | 10,317 | 11.8 | 12,509 |
| Q2 FY2026 | 2025-08-01 | 29,776 | 19.0 | 18.3 | 1,773 | 6.0 | 1,164 | 1.70 | 16,800 | 44.3 | 12,503 |
| Q3 FY2026 | 2025-10-31 | 27,005 | 10.8 | 20.7 | 2,119 | 7.8 | 1,548 | 2.28 | 14,107 | 24.1 | 12,478 |
| Q4 FY2026 | 2026-01-30 | 33,379 | 39.5 | 20.2 | 3,092 | 9.3 | 2,259 | 3.37 | 19,602 | 72.7 | 13,494 |
| Q1 FY2027 | 2026-05-01 | 43,842 | 87.5 | 17.8 | 3,656 | 8.3 | 3,438 | 5.24 | 29,009 | 181.2 | 14,609 |
| Q2 FY2027 | 2026-07-31 | 46,971 | 57.7 | 20.9 | 5,385 | 11.5 | 4,133 | 6.34 | 31,782 | 89.2 | 15,034 |
Q4 of each fiscal year is the audited full year less the first nine months reported in the quarterly reports. The four quarters of fiscal 2025 and fiscal 2026 sum to the audited year for revenue, gross margin, operating income and both segments.
The first half of fiscal 2027 produced revenue of $90.8bn, gross margin of $17.6bn at 19.4%, and operating income of $9.0bn at 10.0%. That first half is 47.3% of the $192bn full year guidance, so the guidance requires $101.2bn in the second half. Q3 is guided at $49bn, which leaves $52.2bn implied for Q4, 11.1% above the Q2 figure and 56.3% above Q4 FY2026.
8. Cash, working capital and capital structure
Operating activities provided $11.2bn in fiscal 2026, 147.4% more than fiscal 2025 and 1.88 times net income. Payables rose $12.7bn against a rise of $7.0bn in receivables and $4.0bn in inventory, so the three lines together released cash over the year. The cash conversion cycle was 30 days negative, held there by payable days of 109 against inventory days of 34 and receivable days of 45. Inventory days have risen from 23 in fiscal 2024, which the earnings call of 26 February 2026 attributes to positioning inventory ahead of AI shipments.

Table 9. Debt at 30 January 2026, USD millions
| Component | Amount | Terms as filed |
|---|---|---|
| Senior Notes | 21,573 | Corporate debt issued by Dell International L.L.C. and EMC Corporation, guaranteed by Dell Technologies Inc. |
| Legacy Notes | 952 | Notes assumed in earlier transactions |
| Dell Financial Services allocated debt | (5,507) | Core debt approximated by applying a seven to one debt to equity ratio to Dell Financial Services owned assets, deducted from core debt |
| Total core debt | 17,018 | Up $4.0bn on fiscal 2025 |
| Dell Financial Services debt | 9,139 | Securitisation and structured financing programmes, no recourse to Dell Technologies Inc. |
| Dell Financial Services allocated debt | 5,507 | Added back |
| Total Dell Financial Services related debt | 14,646 | Up $2.9bn on fiscal 2025 |
| Other | 99 | |
| Total debt, principal amount | 31,763 | $8.0bn payable within twelve months |
| Total debt, carrying value | 31,503 |
Cash plus available borrowings were $17.4bn at the year end against $9.6bn a year earlier. The revolving credit facility had capacity of $6.0bn with $5.9bn available, and the commercial paper programme allows up to $5.0bn, undrawn. A further $5.0bn of senior notes was issued in September 2026.

Dell returned $7.5bn to shareholders in fiscal 2026, 0.87 times free cash flow, through $6.0bn of buybacks covering about 54m shares and $1.5bn of dividends. Diluted shares fell to 684m from 791m in fiscal 2022, a reduction of 13.5%. On 26 February 2026 the board added $10.0bn to the repurchase authorisation, taking the cumulative authorisation to $30.0bn with about $15.2bn remaining, and raised the quarterly dividend 20% to $0.630 per share, an annualised $2.52 and a yield of 0.46% at the current price.
9. Management commentary and the guidance record
Reported revenue landed above the guidance midpoint in each of the last six quarters, by 24.6% in Q1 FY2027 and by 5.6% in Q2 FY2027. Full year fiscal 2027 revenue guidance has been raised twice, from $140bn at the midpoint on 26 February 2026 to $167bn on 28 May 2026 and $192bn on 1 September 2026, a cumulative increase of 37.1%. Guidance for AI optimised server revenue within that moved from $50bn to $60bn to $74bn over the same three dates.

Table 10. Guidance against reported result, USD millions except per share
| Quarter | Guided revenue, midpoint | Reported revenue | Difference, % | Guided non GAAP EPS, midpoint | Reported non GAAP EPS | Difference, % |
|---|---|---|---|---|---|---|
| Q1 FY2026 | 23,000 | 23,378 | 1.6 | 1.65 | 1.55 | (6.1) |
| Q2 FY2026 | 29,000 | 29,776 | 2.7 | 2.25 | 2.32 | 3.1 |
| Q3 FY2026 | 27,000 | 27,005 | 0.0 | 2.45 | 2.59 | 5.7 |
| Q4 FY2026 | 31,500 | 33,379 | 6.0 | 3.50 | 3.89 | 11.1 |
| Q1 FY2027 | 35,200 | 43,842 | 24.6 | 2.90 | 4.86 | 67.6 |
| Q2 FY2027 | 44,500 | 46,971 | 5.6 | 4.80 | 7.04 | 46.7 |
Guidance is the midpoint given in the prior quarter earnings release. Non GAAP earnings per diluted share is the measure the company guides to and is not a measure defined under generally accepted accounting principles.
Table 11. Fiscal 2027 full year guidance, as revised, USD millions
| Date given | Revenue at the midpoint | As stated | ||||||||||||||||||||||||||||||||||||||||||||||||||||||||||||||||||||||||||||||||||||||||||||||||
|---|---|---|---|---|---|---|---|---|---|---|---|---|---|---|---|---|---|---|---|---|---|---|---|---|---|---|---|---|---|---|---|---|---|---|---|---|---|---|---|---|---|---|---|---|---|---|---|---|---|---|---|---|---|---|---|---|---|---|---|---|---|---|---|---|---|---|---|---|---|---|---|---|---|---|---|---|---|---|---|---|---|---|---|---|---|---|---|---|---|---|---|---|---|---|---|---|---|---|
| 26 February 2026 | 140,000 | initial guidance, $138bn to $142bn | ||||||||||||||||||||||||||||||||||||||||||||||||||||||||||||||||||||||||||||||||||||||||||||||||
| 28 May 2026 | 167,000 | raised, $165bn to $169bn | ||||||||||||||||||||||||||||||||||||||||||||||||||||||||||||||||||||||||||||||||||||||||||||||||
| 1 September 2026 | 192,000 | raised by $25bn to $192bn at the midpoint | ||||||||||||||||||||||||||||||||||||||||||||||||||||||||||||||||||||||||||||||||||||||||||||||||
| 26 February 2026 | 50,000 | AI optimised server revenue within the full year figure | ||||||||||||||||||||||||||||||||||||||||||||||||||||||||||||||||||||||||||||||||||||||||||||||||
| 28 May 2026 | 60,000 | AI optimised server revenue within the full year figure | ||||||||||||||||||||||||||||||||||||||||||||||||||||||||||||||||||||||||||||||||||||||||||||||||
| 1 September 2026 | 74,000 | AI optimised server revenue within the full year figure | ||||||||||||||||||||||||||||||||||||||||||||||||||||||||||||||||||||||||||||||||||||||||||||||||
What management said on the calls
The consolidated gross margin rate fell from 20.5% in Q4 FY2026 to 18.1% in Q1 FY2027 and recovered to 21.1% in Q2 FY2027, all on a non GAAP basis. The chief financial officer gave the same explanation on each of the three calls. On 26 February 2026 he put the quarter at 20.5%, a rate that "reflected a mixed shift to AI servers, with AI revenue up more than 4x year-over-year and improved profitability in storage". On 28 May 2026: "Gross margin rate was 18.1%, driven primarily by mix shift to AI servers with AI revenue up nearly 9x year-over-year." On 1 September 2026: "Excluding the mix impact of AI servers, gross margin rate[s] are up year over year." On the profitability of that mix he said on 28 May 2026 that "AI server profitability was in line with our mid-single-digit operating income rate target", against the 7.2% consolidated operating margin reported for fiscal 2026 on a GAAP basis.
Two further statements bear on the forward cases. On component costs the chief operating officer said on 28 May 2026 that "we're repricing, it feels like every day", in an environment he described as inflationary across fuel, raw materials, DRAM, NAND and processors. On operating expenses the chief financial officer guided fiscal 2027 to "approximately 8% of revenue, the lowest level in the company's 42-year history", against the 12.8% reported for fiscal 2026 on a GAAP basis. The company does not state the basis of the 8% figure.
Table 12. Figures management gave on the earnings calls
| Item | Figure | Speaker | Call date |
|---|---|---|---|
| AI orders booked in Q2 FY2027 | $60.9bn | Jeff Clarke, vice chairman and chief operating officer | 1 September 2026 |
| AI backlog at the end of Q2 FY2027 | $95bn | Jeff Clarke, vice chairman and chief operating officer | 1 September 2026 |
| AI orders booked in Q1 FY2027 | $24.4bn | Jeff Clarke, vice chairman and chief operating officer | 28 May 2026 |
| AI server revenue recognised in Q1 FY2027 | $16.1bn | Jeff Clarke, vice chairman and chief operating officer | 28 May 2026 |
| AI backlog at the end of Q1 FY2027 | $51.3bn | Jeff Clarke, vice chairman and chief operating officer | 28 May 2026 |
| AI orders for the whole of FY2026 | $64.1bn | Jeff Clarke, vice chairman and chief operating officer | 26 February 2026 |
| Q1 FY2027 gross margin rate, non GAAP | 18.1% | David Kennedy, chief financial officer | 28 May 2026 |
| Q4 FY2026 gross margin rate, non GAAP | 20.5% | David Kennedy, chief financial officer | 26 February 2026 |
| Q2 FY2027 gross margin rate, non GAAP | 21.1% | David Kennedy, chief financial officer | 1 September 2026 |
| AI orders booked over the twelve months to Q2 FY2027 | $131.7bn | Jeff Clarke, vice chairman and chief operating officer | 1 September 2026 |
| AI server operating income rate target | mid single digit | David Kennedy, chief financial officer | 28 May 2026 |
| FY2027 operating expenses as a share of revenue | about 8% | David Kennedy, chief financial officer | 1 September 2026 |
| Core leverage ratio at the end of Q2 FY2027 | 0.8 times | David Kennedy, chief financial officer | 1 September 2026 |
| Returned to shareholders in Q2 FY2027 | $4.3bn | David Kennedy, chief financial officer | 1 September 2026 |
| FY2027 net sales guidance at the midpoint, as raised | $192bn | David Kennedy, chief financial officer | 1 September 2026 |
Earnings calls are hosted by the company and are not SEC filings. The Q1 and Q2 FY2027 order, revenue and backlog figures are also in the quarterly earnings releases filed as Exhibit 99.1 to the current reports on Form 8-K, and Table 2 is built from those releases. The Q1 FY2027 gross margin rate of 18.1% given here is the non GAAP measure; the reported rate is 17.8%. Jeff Clarke is vice chairman and chief operating officer, David Kennedy chief financial officer.
Management declined several analyst requests for detail on those calls. Asked on 26 February 2026 to split the AI order book by chip generation and again by customer type, the chief operating officer answered both times that the company tracks it but, in his words, "I won't do this on the call". Asked on the same call for the component cost assumptions inside guidance, he said the pricing is proprietary and he would not share the percentages. The chief financial officer declined twice on that call to guide free cash flow, and on 1 September 2026 would not answer whether Dell would grow in line with Nvidia in the following year.
10. Sector and competitor analysis
Dell's 20.0% gross margin is the fifth highest of the ten companies in Table 13. The four contract manufacturers run at 8.8% to 12.1% and Super Micro Computer, the other server assembler, at 10.8%. Hewlett Packard Enterprise runs at 31.7%, and the three component and systems suppliers at 36.3% to 71.1%. Dell's 18.8% revenue growth is the fifth lowest of the ten. Operating margin narrows the spread: Dell's 7.2% compares with 4.0% to 8.4% for the four contract manufacturers, 7.1% for Super Micro Computer, a negative 1.3% for Hewlett Packard Enterprise and 17.9% to 60.4% for the three component suppliers.


Table 13. Peer comparison, latest reported fiscal year
| Ticker | Fiscal year | Revenue, USD m | Growth, % | Gross margin, % | Operating margin, % | Return on invested capital, % | Cash conversion cycle, days | Cash from operations to net income, times | Market value, USD bn | Earnings multiple, times | Enterprise value to revenue, times |
|---|---|---|---|---|---|---|---|---|---|---|---|
| DELL | FY2026 | 113,538 | 18.8 | 20.0 | 7.2 | 36.0 | (30) | 1.88 | 350 | 63.3 | 3.25 |
| HPE | FY2025 | 34,296 | 13.8 | 31.7 | (1.3) | 0.2 | 35 | 16.87 | 81 | 469.1 | 2.85 |
| NVDA | FY2026 | 215,938 | 65.5 | 71.1 | 60.4 | 71.3 | 133 | 0.86 | 5,472 | 45.6 | 25.33 |
| VRT | FY2025 | 10,230 | 27.7 | 36.3 | 17.9 | 27.3 | 94 | 1.59 | 96 | 71.7 | 9.45 |
| ANET | FY2025 | 9,006 | 28.6 | 64.1 | 42.8 | 30.6 | 256 | 1.25 | 259 | 73.7 | 28.52 |
| CLS | FY2025 | 12,391 | 28.5 | 12.1 | 8.4 | 36.8 | 88 | 0.79 | 41 | 49.6 | 3.34 |
| JBL | FY2025 | 29,802 | 3.2 | 8.9 | 4.0 | 35.3 | 6 | 2.50 | 34 | 51.5 | 1.17 |
| FLEX | FY2026 | 27,914 | 8.1 | 9.2 | 4.9 | 16.2 | 29 | 1.91 | 42 | 48.2 | 1.57 |
| SANM | FY2025 | 8,128 | 7.4 | 8.8 | 4.4 | 14.5 | 83 | 2.52 | 12 | 49.8 | 1.43 |
| SMCI | FY2026 | 39,063 | 77.8 | 10.8 | 7.1 | 20.6 | 112 | (3.05) | 28 | 12.7 | 0.76 |
Peers cover three groups: server makers competing directly with Dell (HPE, SMCI), the compute supply chain that sets the component cost (NVDA, VRT, ANET), and contract manufacturers that assemble on comparable terms (CLS, JBL, FLEX, SANM). Each company is shown on its own latest reported fiscal year, so the periods are not aligned. The Dell market value uses 635.8m shares outstanding at 1 September 2026 and the closing price of 23 September 2026; peer market values use the latest reported diluted share count of each company and the most recent available price, so the basis differs slightly.
The earnings multiples in Table 13 are on different periods. Dell trades at 63.3 times fiscal 2026 earnings, above NVDA at 45.6 times and below ANET at 73.7 times. Fiscal 2026 ended on 30 January 2026, before the two guidance raises, so the trailing figure is measured against earnings that the current year guidance is 2.8 times. Fiscal 2027 guidance is $24.37 of GAAP diluted earnings per share, 2.8 times the fiscal 2026 figure, which puts the multiple on that guidance at 22.6 times.
11. The fiscal 2024 revision and material events
Dell revised its fiscal 2024 financial statements in the fiscal 2025 annual report. The filing states that during fiscal 2025 the company discovered accumulated credits from certain suppliers that were not recorded, or not recorded in the correct period, and that an investigation indicated the credits resulted from the actions of certain procurement employees supporting a limited number of suppliers, affecting the Client Solutions Group segment. Net revenue was unaffected. The company concluded the amounts were not material to any prior period on their own but that correcting the cumulative misstatement in fiscal 2025 would be material to that year, so it revised fiscal 2024 under Staff Accounting Bulletin 108.
Table 14. Revision to fiscal 2024, as previously reported against as revised, USD millions
| Line | As previously reported | As revised | Adjustment | |||||||||||||||||||||||||||||||||||||||||||||||||||||||||||||||||||||||||||||||||||||||||||||||
|---|---|---|---|---|---|---|---|---|---|---|---|---|---|---|---|---|---|---|---|---|---|---|---|---|---|---|---|---|---|---|---|---|---|---|---|---|---|---|---|---|---|---|---|---|---|---|---|---|---|---|---|---|---|---|---|---|---|---|---|---|---|---|---|---|---|---|---|---|---|---|---|---|---|---|---|---|---|---|---|---|---|---|---|---|---|---|---|---|---|---|---|---|---|---|---|---|---|---|
| Cost of net revenue | 67,556 | 67,356 | (200) | |||||||||||||||||||||||||||||||||||||||||||||||||||||||||||||||||||||||||||||||||||||||||||||||
| Gross margin | 20,869 | 21,069 | 200 | |||||||||||||||||||||||||||||||||||||||||||||||||||||||||||||||||||||||||||||||||||||||||||||||
| Operating income | 5,211 | 5,411 | 200 | |||||||||||||||||||||||||||||||||||||||||||||||||||||||||||||||||||||||||||||||||||||||||||||||
| Net income | 3,211 | 3,388 | 177 | |||||||||||||||||||||||||||||||||||||||||||||||||||||||||||||||||||||||||||||||||||||||||||||||
| Accounts payable | 19,389 | 19,226 | (163) | |||||||||||||||||||||||||||||||||||||||||||||||||||||||||||||||||||||||||||||||||||||||||||||||
| Accrued and other | 6,805 | 6,828 | 23 | |||||||||||||||||||||||||||||||||||||||||||||||||||||||||||||||||||||||||||||||||||||||||||||||
| Total liabilities | 84,398 | 84,258 | (140) | |||||||||||||||||||||||||||||||||||||||||||||||||||||||||||||||||||||||||||||||||||||||||||||||
| Accumulated deficit | (4,630) | (4,453) | 177 | |||||||||||||||||||||||||||||||||||||||||||||||||||||||||||||||||||||||||||||||||||||||||||||||
From the overview and basis of presentation note in the fiscal 2025 annual report. The quarterly adjustments to gross margin were $62m, 29m, 53m and 56m for the four quarters of fiscal 2024 and $45m, 50m and 53m for the first three quarters of fiscal 2025. Diluted earnings per share moved from $4.36 to $4.60 for fiscal 2024 and by five or six cents in each of the first three quarters of fiscal 2025. All fiscal 2024 and fiscal 2025 figures elsewhere in this document are the revised figures.
Two governance items followed the annual meeting. The redomestication from Delaware to Texas took effect on 1 July 2026. Amended and restated bylaws effective 2 July 2026 elect into section 21.373 of the Texas Business Organizations Code, which raises the threshold for submitting a shareholder proposal to holders of at least $1,000,000 in market value or 3% of outstanding voting shares, held continuously for at least six months, with a requirement to solicit holders of at least 67% of the voting power on the proposal.
Table 15. Material current reports on Form 8-K, January 2025 to September 2026
| Filed | Items | Substance as filed |
|---|---|---|
| 27 Feb 2025 | 2.02, 8.01 | Fiscal 2025 results; 18% dividend increase and $10bn added to the repurchase authorisation |
| 1 Apr 2025 | 1.01, 2.03 | $4.0bn of senior notes issued in four tranches, 4.750% to 5.500%, due 2028 to 2035 |
| 8 Sep 2025 | 5.02 | Yvonne McGill resigned as chief financial officer effective 9 September 2025; David Kennedy appointed interim chief financial officer |
| 2 Oct 2025 | 5.02 | One time performance based option award of 2,500,000 options to Jeffrey Clarke at $141.77, vesting to 15 March 2031 |
| 6 Oct 2025 | 1.01, 2.03 | $4.5bn of senior notes issued, 4.150% to 5.100%, used in part to redeem 6.020% notes due 2026 |
| 7 Oct 2025 | 7.01 | Regulation FD investor presentation on the long term financial framework with increased targets |
| 25 Nov 2025 | 2.02, 9.01 | Q3 FY2026 results; David Kennedy named chief financial officer on a permanent basis |
| 26 Feb 2026 | 2.02 | Fiscal 2026 results; 20% dividend increase to $0.630 per quarter and $10bn added to the repurchase authorisation |
| 10 Jun 2026 | 1.01, 1.02, 2.03 | New $6.0bn senior unsecured revolving credit facility maturing 10 June 2031; prior facility repaid and terminated |
| 16 Jun 2026 | 1.01, 2.03 | $3.0bn of senior notes issued, 4.750% to 5.250%, due 2031 to 2037 |
| 1 Jul 2026 | 3.03, 5.07, 8.01 | Annual meeting results; redomestication from Delaware to Texas effective 1 July 2026 |
| 6 Jul 2026 | 3.03, 5.03 | Amended and restated bylaws electing into the Texas shareholder proposal threshold |
| 1 Sep 2026 | 2.02 | Q2 FY2027 results; quarterly dividend of $0.63 declared |
| 15 Sep 2026 | 1.01, 2.03 | $5.0bn of senior notes issued, 5.100% to 5.900%, due 2029 to 2037 |
Thirty one current reports were filed in the period. The fourteen listed here carry the debt, governance and executive items. The seventeen omitted are five routine reports under Item 3.02 covering periodic conversions of Class B into Class C common stock by the Silver Lake affiliated holders, three quarterly results releases already covered in Table 10, four underwriting agreements for the note issues listed above, three amending reports under Item 5.02, the 2025 annual meeting results of 1 July 2025 and the accounting officer change of 12 August 2025.
One legal matter is named in the fiscal 2026 annual report. Lowbruck et al. v. Dell Technologies Inc. et al., filed 28 January 2026 in the United States District Court for the Western District of Texas, is a putative class action under the Employee Retirement Income Security Act against the company, its board and the benefits administration committee, alleging failure to remove imprudent investments from the 401(k) plan, prohibited transactions and failure to monitor plan fiduciaries. Damages are unspecified. The company states it intends to defend the action vigorously and that at 30 January 2026 it does not believe there is a reasonable possibility that a material loss exceeding amounts already accrued across all proceedings has been incurred.
12. Ownership, control and the annual meeting
Michael Dell holds 40.9% of the outstanding common stock, which carries 69.7% of the total voting power on the share counts in the proxy statement ownership table. Class A and Class B shares carry ten votes each and Class C shares one, so the 649,568,287 shares outstanding at the record date carry 3,570,375,178 votes. Class A holds 77.5% of those votes, Class B 13.4% and Class C, the only series listed on the New York Stock Exchange, 9.1%. The fiscal 2026 annual report states that Michael Dell and the Susan Lieberman Dell Separate Property Trust, together with the Silver Lake stockholders, held approximately 91.7% of the total voting power at 9 March 2026. Dell is a controlled company under New York Stock Exchange rules and takes the associated exemptions from certain corporate governance requirements.
Table 16. Voting power by share class at the record date of 27 April 2026
| Class | Votes per share | Share of total votes, % |
|---|---|---|
| Class A common stock | 10 | 77.5 |
| Class B common stock | 10 | 13.4 |
| Class C common stock | 1 | 9.1 |
Shares outstanding and entitled to vote: 649,568,287. Class A 276,744,341 shares, Class B 47,789,758 shares, Class C 325,034,188 shares.
Table 17. Annual meeting of 25 June 2026, votes cast, millions of votes
| Proposal | For | Against or withheld | Abstentions | Broker non votes | For, % of votes cast | |||||||||||||||||||||||||||||||||||||||||||||||||||||||||||||||||||||||||||||||||||||||||||||
|---|---|---|---|---|---|---|---|---|---|---|---|---|---|---|---|---|---|---|---|---|---|---|---|---|---|---|---|---|---|---|---|---|---|---|---|---|---|---|---|---|---|---|---|---|---|---|---|---|---|---|---|---|---|---|---|---|---|---|---|---|---|---|---|---|---|---|---|---|---|---|---|---|---|---|---|---|---|---|---|---|---|---|---|---|---|---|---|---|---|---|---|---|---|---|---|---|---|---|
| Election of directors, Group I, all series voting together as one class | ||||||||||||||||||||||||||||||||||||||||||||||||||||||||||||||||||||||||||||||||||||||||||||||||||
| David Grain | 3,464.3 | 2.7 | n/a | 56.3 | 99.9 | |||||||||||||||||||||||||||||||||||||||||||||||||||||||||||||||||||||||||||||||||||||||||||||
| Egon Durban | 3,457.1 | 9.8 | n/a | 56.3 | 99.7 | |||||||||||||||||||||||||||||||||||||||||||||||||||||||||||||||||||||||||||||||||||||||||||||
| William D. Green | 3,456.3 | 10.7 | n/a | 56.3 | 99.7 | |||||||||||||||||||||||||||||||||||||||||||||||||||||||||||||||||||||||||||||||||||||||||||||
| Steven M. Mollenkopf | 3,455.6 | 11.4 | n/a | 56.3 | 99.7 | |||||||||||||||||||||||||||||||||||||||||||||||||||||||||||||||||||||||||||||||||||||||||||||
| David W. Dorman | 3,406.4 | 60.5 | n/a | 56.3 | 98.3 | |||||||||||||||||||||||||||||||||||||||||||||||||||||||||||||||||||||||||||||||||||||||||||||
| Michael S. Dell | 3,404.1 | 62.9 | n/a | 56.3 | 98.2 | |||||||||||||||||||||||||||||||||||||||||||||||||||||||||||||||||||||||||||||||||||||||||||||
| Ellen J. Kullman | 3,361.9 | 105.1 | n/a | 56.3 | 97.0 | |||||||||||||||||||||||||||||||||||||||||||||||||||||||||||||||||||||||||||||||||||||||||||||
| Election of directors, Group IV, Class C common stock voting separately | ||||||||||||||||||||||||||||||||||||||||||||||||||||||||||||||||||||||||||||||||||||||||||||||||||
| Lynn Vojvodich Radakovich | 197.1 | 24.8 | n/a | 56.3 | 88.8 | |||||||||||||||||||||||||||||||||||||||||||||||||||||||||||||||||||||||||||||||||||||||||||||
| Other proposals, all series voting together as one class | ||||||||||||||||||||||||||||||||||||||||||||||||||||||||||||||||||||||||||||||||||||||||||||||||||
| Ratification of PricewaterhouseCoopers LLP as auditor for fiscal 2027 | 3,504.0 | 19.0 | 0.3 | none | 99.5 | |||||||||||||||||||||||||||||||||||||||||||||||||||||||||||||||||||||||||||||||||||||||||||||
| Advisory vote on named executive officer compensation | 3,359.9 | 106.6 | 0.5 | 56.3 | 96.9 | |||||||||||||||||||||||||||||||||||||||||||||||||||||||||||||||||||||||||||||||||||||||||||||
| Change of the state of incorporation from Delaware to Texas | 3,358.1 | 107.7 | 1.2 | 56.3 | 96.9 | |||||||||||||||||||||||||||||||||||||||||||||||||||||||||||||||||||||||||||||||||||||||||||||
Support is the votes for as a share of the votes cast on that proposal, which is the votes for plus against or withheld plus abstentions; broker non votes are excluded from that base. The Group I directors are elected on a base of about 3.47bn votes and the Group IV director on a base of about 222m Class C votes, so the two are not comparable. Directors are elected on a plurality, so votes withheld carry no legal effect on the outcome. The Class A holders cast 2,767,249,771 votes and the Class B holders 477,897,577 votes for the redomestication, with none against and none abstaining.
Support on the three non election proposals ran from 96.9% to 99.5%. Among the seven Group I directors it ran from 97.0% for Ellen J. Kullman to 99.9% for David Grain, with Michael S. Dell at 98.2%. The one director elected by the Class C holders alone, Lynn Vojvodich Radakovich, drew 88.8%, the lowest of the eight, on the only vote in which the ten vote classes do not participate.
Table 18. Beneficial ownership at the record date of 27 April 2026, millions of shares
| Holder | Class A | Class B | Class C | % of all outstanding common stock |
|---|---|---|---|---|
| Michael S. Dell | 246.8 | — | 18.8 | 40.9 |
| All directors and current executive officers, 15 persons | 246.8 | — | 23.1 | 41.5 |
| Susan Lieberman Dell Separate Property Trust | 29.9 | — | 1.4 | 4.8 |
| Silver Lake affiliated stockholders | — | 47.8 | 0.1 | 7.4 |
From the beneficial ownership table in the proxy statement. Michael Dell holds 89.2% of the Class A shares and 5.8% of the Class C shares. His figures exclude the shares held by the Susan Lieberman Dell Separate Property Trust and Susan L. Dell, shown separately, and include 2,682,335 Class C shares held by the Michael and Susan Dell Foundation. The Silver Lake stockholders hold all of the Class B common stock.
Table 19. Institutional holders of Class C common stock named in the proxy statement, millions of shares
| Holder | Sole dispositive power | Sole voting power | As filed |
|---|---|---|---|
| The Vanguard Group | 22.5 | 3.1 | 13G filed 29 April 2026, holdings at 31 March 2026 |
| BlackRock, Inc. | 22.8 | 20.6 | 13G filed 8 November 2024, holdings at 30 September 2024 |
Class C common stock is the only series listed on the New York Stock Exchange and carries one vote a share. The proxy statement gives these holders by share count from their Schedule 13G filings rather than as a percentage of the class, and the BlackRock filing it cites is the one made in November 2024.
13. Risk factors and internal control
The fiscal 2026 annual report lists forty risk factor headings, one more than fiscal 2025. The addition is that the amount and frequency of share repurchases may fluctuate. The controlled company heading was reworded from an ownership share framing to an explicit voting power framing. No headings were removed. Management concluded that disclosure controls and internal control over financial reporting were effective at 30 January 2026 under the 2013 framework of the Committee of Sponsoring Organizations, and PricewaterhouseCoopers LLP audited that conclusion. No material weakness is disclosed.
Table 20. Principal risk factors and the figures the filings attach to them
| Risk | As filed | Quantified exposure |
|---|---|---|
| Demand for AI solutions | Purchased primarily by a small number of larger customers and cloud service providers; transactions may involve larger amounts of credit or longer payment terms than are typical, which could affect cash flow and create excess and obsolete inventory exposure | One customer was 12% of fiscal 2026 net revenue; backlog $95bn |
| Outstanding indebtedness | A substantial portion of operating cash flow is used for debt service, reducing funds available for working capital, capital expenditure and acquisitions | $31.5bn of debt; capacity for a further $5.0bn of commercial paper and $5.9bn under the revolver |
| Goodwill and intangible impairment | A reporting unit fair value below carrying amount would require a charge | $24.1bn combined carrying value, 24% of total assets |
| Control by the MD and SLP stockholders | Class A and Class B carry ten votes each against one for Class C, so unaffiliated Class C holders have limited ability to influence matters requiring stockholder approval | 91.7% of total voting power at 9 March 2026 |
| Single source and limited source suppliers | A delay in supply of a critical single source or limited source component may prevent timely shipment in desired quantities or configurations | Not quantified in the risk factor |
| Non United States revenue | Tariffs, trade barriers, currency volatility and varied local conditions | 45% of consolidated net revenue |
| Interest rate exposure | Exposure relates to Dell Financial Services borrowings not hedged with swaps | $3.0bn exposed; a 100 basis point rise would add about $30m of annual interest expense |
| Foreign currency exposure | Hedged with option and forward contracts on the euro, Indian rupee, Japanese yen, British pound, Canadian dollar and Australian dollar | Maximum one day loss in fair value of about $6m at 95% confidence |
14. Stock price, scenarios and sensitivity
The share closed at $549.83 on 23 September 2026, against a fifty two week range of $109.92 to $595.51. The monthly close was $148.08 at the end of February 2026, $420.91 at the end of May 2026 and $549.83 in September 2026; the two guidance raises fall on 28 May and 1 September 2026. On 635.8m shares outstanding at 1 September 2026 the market value is $350bn and enterprise value $370bn, or 3.25 times fiscal 2026 revenue and 33.1 times earnings before interest, tax, depreciation and amortisation.

Core assumptions
Table 21. Core assumptions behind the three cases
| Assumption | Best case | Base case | Worst case | Basis |
|---|---|---|---|---|
| Revenue, FY2027 | $200bn | $192bn | $185bn | Base is the company guidance midpoint of 1 September 2026, which needs a Q4 of $52.2bn. H1 is reported at $90.8bn and Q3 is guided at $49bn. Best assumes Q4 beats the implied figure as the last six quarters beat guidance. Worst assumes Q4 falls 7.8% short of the Q3 guided level. |
| Revenue, FY2028 and FY2029 | $265bn then $320bn | $225bn then $245bn | $165bn then $150bn | Best assumes the $95bn backlog converts and is replaced at the trailing order rate. Base assumes orders slow to roughly the FY2027 revenue level. Worst assumes the backlog converts and is not replaced. |
| Gross margin | 20.0% falling to 19.0% | 19.3% falling to 18.0% | 17.5% falling to 16.5% | All three cases assume the AI mix continues to dilute the rate. Q1 FY2027 came in at 17.8% and Q2 FY2027 at 20.9%, against 19.4% for the half. The best case starts 0.9 points below the Q2 rate, the base case 0.1 points below the half year rate and the worst case 0.3 points below the Q1 rate. |
| Operating expenses | $17.0bn to $19.5bn | $16.5bn to $18.2bn | $16.5bn to $17.0bn | Fiscal 2026 was $14.6bn. Management guides fiscal 2027 operating expenses to approximately 8% of revenue, which on $192bn is $15.4bn. |
| Net interest cost | $1.0bn in each year | $1.1bn to $1.3bn | $1.4bn to $1.6bn | Fiscal 2026 interest paid was $1.4bn. $12.5bn of senior notes were issued between June 2025 and September 2026. |
| Effective tax rate | 18% | 18% | 18% | Fiscal 2026 was 18.3%, fiscal 2025 9.4% and fiscal 2024 17.5%. |
| Diluted shares | 650m falling to 612m | 650m falling to 620m | 652m falling to 645m | Fiscal 2026 was 684m, Q1 FY2027 656m and Q2 FY2027 652m. The buyback authorisation has about $15.2bn remaining. The worst case assumes buybacks slow with cash flow. |
| Exit earnings multiple | 24 times | 18 times | 10 times | The trailing multiple is 63.3 times fiscal 2026 earnings and 22.6 times the fiscal 2027 guidance of $24.37. |

Table 22. Three year cases, USD millions except per share
| Line | FY2027 | FY2028 | FY2029 | |||||||||||||||||||||||||||||||||||||||||||||||||||||||||||||||||||||||||||||||||||||||||||||||
|---|---|---|---|---|---|---|---|---|---|---|---|---|---|---|---|---|---|---|---|---|---|---|---|---|---|---|---|---|---|---|---|---|---|---|---|---|---|---|---|---|---|---|---|---|---|---|---|---|---|---|---|---|---|---|---|---|---|---|---|---|---|---|---|---|---|---|---|---|---|---|---|---|---|---|---|---|---|---|---|---|---|---|---|---|---|---|---|---|---|---|---|---|---|---|---|---|---|---|
| Best case | ||||||||||||||||||||||||||||||||||||||||||||||||||||||||||||||||||||||||||||||||||||||||||||||||||
| Net revenue | 200,000 | 265,000 | 320,000 | |||||||||||||||||||||||||||||||||||||||||||||||||||||||||||||||||||||||||||||||||||||||||||||||
| Growth, % | 76.2 | 32.5 | 20.8 | |||||||||||||||||||||||||||||||||||||||||||||||||||||||||||||||||||||||||||||||||||||||||||||||
| Gross margin, % | 20.0 | 19.5 | 19.0 | |||||||||||||||||||||||||||||||||||||||||||||||||||||||||||||||||||||||||||||||||||||||||||||||
| Operating expenses | 17,000 | 18,500 | 19,500 | |||||||||||||||||||||||||||||||||||||||||||||||||||||||||||||||||||||||||||||||||||||||||||||||
| Operating income | 23,000 | 33,175 | 41,300 | |||||||||||||||||||||||||||||||||||||||||||||||||||||||||||||||||||||||||||||||||||||||||||||||
| Operating margin, % | 11.5 | 12.5 | 12.9 | |||||||||||||||||||||||||||||||||||||||||||||||||||||||||||||||||||||||||||||||||||||||||||||||
| Net income | 18,040 | 26,384 | 33,046 | |||||||||||||||||||||||||||||||||||||||||||||||||||||||||||||||||||||||||||||||||||||||||||||||
| Diluted shares, millions | 650 | 630 | 612 | |||||||||||||||||||||||||||||||||||||||||||||||||||||||||||||||||||||||||||||||||||||||||||||||
| Earnings per diluted share, USD | 27.75 | 41.88 | 54.00 | |||||||||||||||||||||||||||||||||||||||||||||||||||||||||||||||||||||||||||||||||||||||||||||||
| Base case | ||||||||||||||||||||||||||||||||||||||||||||||||||||||||||||||||||||||||||||||||||||||||||||||||||
| Net revenue | 192,000 | 225,000 | 245,000 | |||||||||||||||||||||||||||||||||||||||||||||||||||||||||||||||||||||||||||||||||||||||||||||||
| Growth, % | 69.1 | 17.2 | 8.9 | |||||||||||||||||||||||||||||||||||||||||||||||||||||||||||||||||||||||||||||||||||||||||||||||
| Gross margin, % | 19.3 | 18.5 | 18.0 | |||||||||||||||||||||||||||||||||||||||||||||||||||||||||||||||||||||||||||||||||||||||||||||||
| Operating expenses | 16,500 | 17,500 | 18,200 | |||||||||||||||||||||||||||||||||||||||||||||||||||||||||||||||||||||||||||||||||||||||||||||||
| Operating income | 20,556 | 24,125 | 25,900 | |||||||||||||||||||||||||||||||||||||||||||||||||||||||||||||||||||||||||||||||||||||||||||||||
| Operating margin, % | 10.7 | 10.7 | 10.6 | |||||||||||||||||||||||||||||||||||||||||||||||||||||||||||||||||||||||||||||||||||||||||||||||
| Net income | 15,954 | 18,798 | 20,172 | |||||||||||||||||||||||||||||||||||||||||||||||||||||||||||||||||||||||||||||||||||||||||||||||
| Diluted shares, millions | 650 | 635 | 620 | |||||||||||||||||||||||||||||||||||||||||||||||||||||||||||||||||||||||||||||||||||||||||||||||
| Earnings per diluted share, USD | 24.54 | 29.60 | 32.54 | |||||||||||||||||||||||||||||||||||||||||||||||||||||||||||||||||||||||||||||||||||||||||||||||
| Worst case | ||||||||||||||||||||||||||||||||||||||||||||||||||||||||||||||||||||||||||||||||||||||||||||||||||
| Net revenue | 185,000 | 165,000 | 150,000 | |||||||||||||||||||||||||||||||||||||||||||||||||||||||||||||||||||||||||||||||||||||||||||||||
| Growth, % | 62.9 | (10.8) | (9.1) | |||||||||||||||||||||||||||||||||||||||||||||||||||||||||||||||||||||||||||||||||||||||||||||||
| Gross margin, % | 17.5 | 16.5 | 16.5 | |||||||||||||||||||||||||||||||||||||||||||||||||||||||||||||||||||||||||||||||||||||||||||||||
| Operating expenses | 16,500 | 17,000 | 17,000 | |||||||||||||||||||||||||||||||||||||||||||||||||||||||||||||||||||||||||||||||||||||||||||||||
| Operating income | 15,875 | 10,225 | 7,750 | |||||||||||||||||||||||||||||||||||||||||||||||||||||||||||||||||||||||||||||||||||||||||||||||
| Operating margin, % | 8.6 | 6.2 | 5.2 | |||||||||||||||||||||||||||||||||||||||||||||||||||||||||||||||||||||||||||||||||||||||||||||||
| Net income | 11,869 | 7,073 | 5,043 | |||||||||||||||||||||||||||||||||||||||||||||||||||||||||||||||||||||||||||||||||||||||||||||||
| Diluted shares, millions | 652 | 648 | 645 | |||||||||||||||||||||||||||||||||||||||||||||||||||||||||||||||||||||||||||||||||||||||||||||||
| Earnings per diluted share, USD | 18.20 | 10.91 | 7.82 | |||||||||||||||||||||||||||||||||||||||||||||||||||||||||||||||||||||||||||||||||||||||||||||||
Estimates built on the assumptions in the preceding table. They are not company guidance beyond the fiscal 2027 revenue figure in the base case, which is the guidance midpoint.
The three cases give fiscal 2029 earnings of $54.00, $32.54 and $7.82 per diluted share. At the exit multiples in the assumptions table that is $1,296, $586 and $78 per share against $549.83 today, or +136%, +7% and -86%. Each case moves the revenue path and the exit multiple in the same direction, which widens the range between them.
Critical factors driving the best case
Table 23. Critical factors behind the best case and what to watch
| Factor | What the record shows | What moves it |
|---|---|---|
| Backlog conversion and replacement | The best case requires the $95bn backlog to convert on schedule and be replaced at close to the trailing twelve month order rate of $130bn. Orders exceeded revenue by $77.9bn across the last three reported quarters. | Quarterly orders and closing backlog in the earnings releases. A quarter in which orders fall below revenue reverses the backlog build. |
| Gross margin rate | The best case holds 20.0% in fiscal 2027 and gives up one point over the two following years. Q2 FY2027 came in at 20.9% and Q1 FY2027 at 17.8%, a 310 basis point swing in one quarter. | Quarterly gross margin rate. Each point of fiscal 2027 gross margin is worth about $2.52 of earnings per diluted share in the best case. |
| Operating expenses to revenue | Management guides fiscal 2027 operating expenses to approximately 8% of revenue, against 12.8% in fiscal 2026 and 17.7% in fiscal 2024. The best case assumes that ratio is broadly held as revenue grows. | Operating expenses as a percentage of revenue in each quarterly report. Headcount was about 97,000 at the fiscal 2026 year end and has been falling. |
| Component cost and pricing | The chief operating officer said on 28 May 2026 that the company is repricing almost daily in an inflationary component environment, and on 26 February 2026 declined to give the component cost assumptions inside guidance. | The gap between the gross margin rate in a quarter and the rate implied by orders booked in earlier quarters. |
| Customer concentration | One customer was 12% of fiscal 2026 net revenue, substantially all Infrastructure Solutions Group. Dell reports about 6,500 customers for its AI systems, up from about 4,000 two quarters earlier. | The concentrations note in each annual report, and the customer count management gives on the calls. |
| Working capital | The cash conversion cycle is 30 days negative, funded by $33.6bn of payables. Inventory days rose from 23 in fiscal 2024 to 34 in fiscal 2026 as Dell positioned components ahead of shipments. | Payable days and inventory days in each quarterly report. A shortening of supplier terms would turn the cycle positive and consume cash. |
Order, backlog and customer count figures come from the quarterly earnings releases and the earnings calls; the remainder comes from the annual and quarterly reports.
Sensitivity
Earnings in fiscal 2029 are more sensitive to gross margin than to revenue over the ranges shown. At the centre of the grid, $230bn of revenue at an 18.5% gross margin, one point of gross margin is worth about $3.04 of earnings per diluted share and a $40bn move in revenue is worth about $9.79. Across the whole grid earnings range from $4.96 to $62.36.


At the base case exit multiple of 18 times, the current price of $549.83 is covered at fiscal 2029 revenue of $190bn on a gross margin of 22.4%, at $230bn on 18.5%, or at $270bn on 15.8%. The first half of fiscal 2027 ran at 19.4% and Q2 FY2027 at 20.9%. The grid applies one multiple to one year and holds the operating expense, interest, tax and share assumptions of Table 21 constant.
Sources
Every filing read for this analysis, with its accession number. Filings were retrieved through the SEC-API.io service. Market prices are closing prices for 23 September 2026.
Annual reports on Form 10-K, Dell Technologies
| Filing | Filed | Accession number |
|---|---|---|
| Annual report on Form 10-K, fiscal 2026 | 16 Mar 2026 | 0001571996-26-000008 |
| Annual report on Form 10-K, fiscal 2025 | 25 Mar 2025 | 0001571996-25-000034 |
| Annual report on Form 10-K, fiscal 2024 | 25 Mar 2024 | 0001571996-24-000036 |
| Annual report on Form 10-K, fiscal 2023 | 30 Mar 2023 | 0001571996-23-000007 |
Quarterly reports on Form 10-Q, Dell Technologies
| Filing | Period end | Accession number |
|---|---|---|
| Quarterly report on Form 10-Q, Q2 fiscal 2027 | 31 Jul 2026 | 0001571996-26-000046 |
| Quarterly report on Form 10-Q, Q1 fiscal 2027 | 1 May 2026 | 0001571996-26-000030 |
| Quarterly report on Form 10-Q, Q3 fiscal 2026 | 31 Oct 2025 | 0001571996-25-000127 |
| Quarterly report on Form 10-Q, Q2 fiscal 2026 | 1 Aug 2025 | 0001571996-25-000102 |
| Quarterly report on Form 10-Q, Q1 fiscal 2026 | 2 May 2025 | 0001571996-25-000063 |
Current reports on Form 8-K, Dell Technologies
| Filed | Items | Event | Accession number |
|---|---|---|---|
| 2025-01-14 | 3.02 | Unregistered issuance of 3,991,503 shares of Class C common stock upon conversion of an equal number of Class B shares held by SLP affiliated entities (SL SPV-2, Silver Lake Partners IV/V, Silver Lake Technology Investors IV/V); post conversion outstanding: 358,574,323 Class C shares and 62,368,123 Class B shares as of January 8, 2025. | 0001571996-25-000004 |
| 2025-02-27 | 2.02; 8.01; 9.01 | Q4 and full year FY2025 earnings release (Exhibit 99.1); also announced an 18% dividend increase and a $10bn increase in share repurchase authorisation. | 0001571996-25-000014 |
| 2025-03-27 | 8.01; 9.01 | Underwriting agreement (March 26, 2025) for $4.0bn aggregate Senior Notes (2028/2030/2032/2035 tranches, 4.750%-5.500%), closing expected April 1, 2025; proceeds for general corporate purposes, which may include debt repayment. | 0001193125-25-065594 |
| 2025-04-01 | 1.01; 2.03; 9.01 | Debt issuance completed: $4.0bn aggregate principal Senior Notes issued by Dell International L.L.C. and EMC Corporation - $1.0bn 4.750% due 2028, $1.0bn 5.000% due 2030, $1.0bn 5.300% due 2032, $1.0bn 5.500% due 2035; guaranteed by Dell Technologies Inc., Denali Intermediate Inc. and Dell Inc. | 0001193125-25-070461 |
| 2025-05-29 | 2.02; 9.01 | Q1 FY2026 earnings release (Exhibit 99.1). | 0001571996-25-000046 |
| 2025-07-01 | 5.07 | 2025 annual meeting of stockholders (held June 26, 2025) voting results reported under Item 5.07. | 0001571996-25-000078 |
| 2025-07-16 | 3.02 | Unregistered issuance of Class C common stock upon conversion of Class B common stock held by SLP affiliated entities (routine periodic conversion filing). | 0001571996-25-000081 |
| 2025-08-12 | 5.02 | Executive change: Brunilda (Bruny) Rios stepped down as principal accounting officer for personal reasons effective August 8, 2025; Richard Troy Sharp appointed Senior Vice President, Corporate Finance and Chief Accounting Officer (principal accounting officer), effective August 8, 2025, annual base salary $368,100. | 0001571996-25-000093 |
| 2025-08-28 | 2.02; 9.01 | Q2 FY2026 earnings release (Exhibit 99.1). | 0001571996-25-000096 |
| 2025-09-08 | 5.02 | Executive change: Yvonne McGill resigned as CFO effective September 9, 2025 (advisory role through October 31, 2025); David Kennedy appointed interim CFO effective September 9, 2025 (previously SVP, Global Business Operations, Finance). | 0001571996-25-000104 |
| 2025-09-23 | 8.01; 9.01 | Underwriting agreement (September 22, 2025) for $4.5bn aggregate Senior Notes (2029/2031/2032/2036 tranches, 4.150%-5.100%), closing expected October 6, 2025; proceeds to redeem a portion of outstanding 6.020% Senior Notes due 2026 and for general corporate purposes. | 0001193125-25-213629 |
| 2025-09-26 | 3.02 | Unregistered issuance of Class C common stock upon conversion of Class B common stock held by SLP affiliated entities (routine periodic conversion filing). | 0001571996-25-000107 |
| 2025-10-02 | 5.02; 9.01 | Executive compensation: one time performance based stock option award of 2,500,000 options to Jeffrey Clarke (COO/Vice Chairman), exercise price $141.77/share, ten year term, vesting contingent on performance criteria and continued employment through March 15, 2031; forfeiture/repayment obligation in certain circumstances. | 0001571996-25-000111 |
| 2025-10-02 | 5.02 | 8-K/A amending the September 9, 2025 disclosure: David Kennedy's interim CFO equity award detailed as 10,580 time based restricted stock units vesting 20%/30%/50% over three years from grant date. | 0001571996-25-000112 |
| 2025-10-06 | 1.01; 2.03; 9.01 | Debt issuance completed: $4.5bn aggregate principal Senior Notes issued by Dell International L.L.C. and EMC Corporation - $0.75bn 4.150% due 2029, $1.25bn 4.500% due 2031, $1.25bn 4.750% due 2032, $1.25bn 5.100% due 2036; net proceeds used to redeem a portion of the 6.020% Senior Notes due 2026. | 0001193125-25-231904 |
| 2025-10-07 | 7.01; 9.01 | Regulation FD disclosure: investor presentation on Dell's long term financial framework, including increased targets for financial results and shareholder returns; accompanying press release reaffirmed Q3 FY2026 guidance. | 0001193125-25-232662 |
| 2025-10-17 | 5.02 | 8-K/A amending the August 12, 2025 disclosure: Richard Troy Sharp's appointment equity award detailed as 1,796 time based restricted stock units vesting in three equal annual installments from grant date. | 0001571996-25-000114 |
| 2025-11-25 | 2.02; 9.01 | Q3 FY2026 earnings release (Exhibit 99.1); also announced David Kennedy named CFO on a permanent basis. | 0001571996-25-000118 |
| 2025-11-25 | 5.02 | 8-K/A confirming David Kennedy's appointment as permanent CFO effective November 24, 2025: annual base salary $760,000, target cash incentive, and time based RSUs valued at $3,000,000 vesting in equal annual installments from the first anniversary of the effective date. | 0001571996-25-000120 |
| 2026-02-26 | 2.02; 9.01 | Q4 and full year FY2026 earnings release (Exhibit 99.1); also announced a 20% dividend increase (to $0.630/share/quarter) and a $10bn increase in share repurchase authorisation. | 0001571996-26-000003 |
| 2026-04-20 | 3.02 | Unregistered issuance of Class C common stock upon conversion of Class B common stock held by SLP affiliated entities (routine periodic conversion filing). | 0001571996-26-000013 |
| 2026-05-28 | 2.02; 9.01 | Q1 FY2027 earnings release (Exhibit 99.1). | 0001571996-26-000021 |
| 2026-06-10 | 1.01; 1.02; 2.03; 9.01 | New $6.0bn senior unsecured revolving credit facility (Credit Agreement with JPMorgan Chase Bank, N.A. as administrative agent), maturing June 10, 2031, with a $500m letter of credit sub facility; Dell International and EMC simultaneously repaid and terminated the prior existing credit agreement. | 0001193125-26-265877 |
| 2026-06-12 | 8.01; 9.01 | Underwriting agreement (June 11, 2026) for $3.0bn aggregate Senior Notes (2031/2034/2037 tranches, 4.750%-5.250%), closing expected June 16, 2026; proceeds for general corporate purposes, which may include debt repayment. | 0001193125-26-269594 |
| 2026-06-16 | 1.01; 2.03; 9.01 | Debt issuance completed: $3.0bn aggregate principal Senior Notes issued by Dell International L.L.C. and EMC Corporation - $1.0bn 4.750% due 2031, $0.75bn 5.000% due 2034, $1.25bn 5.250% due 2037. | 0001193125-26-272720 |
| 2026-06-17 | 3.02 | Unregistered issuance of Class C common stock upon conversion of Class B common stock held by SLP affiliated entities (routine periodic conversion filing). | 0001571996-26-000032 |
| 2026-07-01 | 3.03; 5.07; 8.01; 9.01 | 2026 annual meeting (held June 25, 2026) voting results, including approval of the redomestication (conversion) of Dell Technologies from a Delaware corporation to a Texas corporation, effective July 1, 2026; Item 8.01 describes the Redomestication mechanics (all Class A/B/C shares automatically converted 1-for-1 into equivalent Texas corporation shares; NYSE listing/symbol DELL unchanged). | 0001571996-26-000036 |
| 2026-07-06 | 3.03; 5.03; 9.01 | Board approved Amended and Restated Bylaws effective July 2, 2026 implementing the Texas Business Organizations Code Section 21.373 election, which raises the bar for shareholder proposals (Rule 14a-8 or otherwise) to holders of at least $1,000,000 in market value or 3% of outstanding voting shares, held continuously for 6+ months, with a requirement to solicit holders of 67%+ of voting power on the proposal. | 0001193125-26-296224 |
| 2026-09-01 | 2.02; 9.01 | Q2 FY2027 earnings release (Exhibit 99.1); Board declared a quarterly cash dividend of $0.63/share, payable October 30, 2026 to shareholders of record October 20, 2026. | 0001571996-26-000039 |
| 2026-09-10 | 8.01; 9.01 | Underwriting agreement for Senior Notes offering (further debt issuance related to the September 15, 2026 closing, see next entry). | 0001193125-26-387958 |
| 2026-09-15 | 1.01; 2.03; 9.01 | Debt issuance completed: $5.0bn aggregate principal Senior Notes issued by Dell International L.L.C. and EMC Corporation - $1.25bn 5.100% due 2029, $1.25bn 5.400% due 2031, $1.5bn 5.600% due 2033, $1.0bn 5.900% due 2037. | 0001193125-26-391976 |
Proxy statement and annual meeting, Dell Technologies
| Filing | Filed | Accession number |
|---|---|---|
| Definitive proxy statement on Form DEF 14A for the 2026 annual meeting | 15 May 2026 | 0001193125-26-226734 |
| Current report on Form 8-K, Item 5.07, 2026 annual meeting voting results | 1 Jul 2026 | 0001571996-26-000036 |
Annual reports of the comparison group
| Company | Fiscal year | Fiscal year end | Accession number |
|---|---|---|---|
| HPE | FY2025 | 2025-10-31 | 0001645590-25-000130 |
| NVDA | FY2026 | 2026-01-25 | 0001045810-26-000021 |
| VRT | FY2025 | 2025-12-31 | 0001674101-26-000008 |
| ANET | FY2025 | 2025-12-31 | 0001596532-26-000013 |
| CLS | FY2025 | 2025-12-31 | 0001030894-26-000011 |
| JBL | FY2025 | 2025-08-31 | 0001628280-25-045293 |
| FLEX | FY2026 | 2026-03-31 | 0000866374-26-000012 |
| SANM | FY2025 | 2025-09-27 | 0000897723-25-000042 |
| SMCI | FY2026 | 2026-06-30 | 0001375365-26-000022 |
Earnings calls, hosted by the company and not SEC filings
| Call | Held | Accession number |
|---|---|---|
| Q2 fiscal 2027 earnings call | 1 Sep 2026 | n/a |
| Q1 fiscal 2027 earnings call | 28 May 2026 | n/a |
| Q4 and full year fiscal 2026 earnings call | 26 Feb 2026 | n/a |
Disclaimer
Figures are taken from filings made with the Securities and Exchange Commission by Dell Technologies Inc., central index key 1571996, and from the corresponding filings of the peer companies named in Table 13. Earnings call material is identified as such and is company hosted rather than filed. Share prices are closing prices from a market data service. Forward cases in section 14 are estimates built on the stated assumptions and are not forecasts, company guidance or investment advice, except where a figure is identified as company guidance. This document is a factual analysis of filed information. It is not a recommendation to buy, sell or hold any security, and it is not affiliated with or endorsed by the Securities and Exchange Commission.