Meta Platforms, Inc. (META), Financial Analysis
Insights derived from analysing SEC filings. Independent analysis of Meta Platforms, Inc. Class A common stock, not a publication of the SEC.
Analysis of Meta's SEC filings under CIK 1326801: three 10-Ks, five 10-Qs, thirteen 8-Ks, three proxies, and the Section 16, 13G and 13F record. Prices as of 4 September 2026.
Summary
Meta Platforms took $60.80 billion of revenue in the quarter to 30 June 2026, 28% more than the same quarter of 2025, and reported income from operations of $18.78 billion, 8% less. Operating margin was 30.9% against 43.0%. Net income was $15.85 billion, down 14%, and diluted earnings per share $6.18 against $7.14. Costs and expenses rose 55%, adding $14.95 billion against the $13.29 billion of revenue added. Research and development rose 67% to $21.66 billion, 35.6% of revenue against 27.2% a year earlier. General and administrative rose 111% to $5.61 billion, which the Form 10-Q attributes primarily to $2.40 billion of charges related to legal proceedings.
Advertising sold on the Family of Apps segment, which is Facebook, Instagram, Messenger, WhatsApp and other services, was $59.36 billion of the quarter's revenue, or 97.6% of the total. The Reality Labs segment, which is the virtual and augmented reality consumer hardware, software and content business, earned $431 million and lost $4.62 billion.
Full year 2025 revenue was $200.97 billion, up 22% on 2024, with income from operations of $83.28 billion, up 20%, and an operating margin of 41.4% against 42.2% in FY2024. Net income for 2025 fell 3% to $60.46 billion on a provision for income taxes of $25.47 billion, which carries the $15.93 billion charge taken in the third quarter of 2025 on enactment of the One Big Beautiful Bill Act.
Capital expenditure, including principal payments on finance leases, was $50.92 billion in the six months to 30 June 2026 against $72.22 billion for the whole of 2025 and $39.23 billion for 2024. The 2026 outlook has been raised twice, from approximately $115 billion to $135 billion on 28 January 2026 to $130 billion to $145 billion on 29 July 2026. Lease obligations for leases signed but not yet commenced were $278.99 billion at 30 June 2026, against $103.77 billion at 31 December 2025, with a further approximately $68 billion of data centre leases entered in July 2026. Noncancelable contractual commitments were $349.31 billion.
Cash, cash equivalents and marketable securities were $90.26 billion at 30 June 2026 against long term debt of $83.66 billion, so net cash was $6.60 billion, against $22.85 billion at the end of 2025 and $48.99 billion at the end of 2024. Meta issued $25.00 billion of senior unsecured notes in May 2026 and $30.00 billion in November 2025. No Class A shares were repurchased in the six months to 30 June 2026, against $22.92 billion of cash repurchases in the same period of 2025; $25.03 billion of authorisation remains and the quarterly dividend held at $0.525 per share.
At the 1 April 2026 record date, Mark Zuckerberg beneficially owned 13.5% of the shares outstanding and 60.8% of the combined voting power, on ten votes for each Class B share and one for each Class A share. Article IV of the charter carries no date, anniversary or ownership trigger that ends the ten vote class. At the annual meeting of 27 May 2026 all ten shareholder proposals were defeated, the recapitalisation proposal drawing 26.5% of the votes cast for and against.
1 Revenue & Business Model
Meta Platforms took $60.80 billion of revenue in the quarter to 30 June 2026, 28% more than the same quarter of 2025, and $117.11 billion in the half year, 30% more. Advertising sold on the Family of Apps segment, which is Facebook, Instagram, Messenger, WhatsApp and other services, supplied $59.36 billion of the quarter, or 97.6% of the total. The Reality Labs segment, which is the virtual and augmented reality consumer hardware, software and content business, supplied $431 million, or 0.7%. Full year 2025 revenue was $200.97 billion, up 22% on the $164.50 billion of 2024. Advertising has been at least 97% of total revenue in every year since 2021.
Meta reports two segments, and its chief executive officer is the chief operating decision maker who reviews them (FY2025 10-K, accession 0001628280-26-003942). Advertising revenue is recognised when impressions are delivered, or when a user takes the contracted action for action based ads. Deferred revenue was $1.16 billion at 30 June 2026 against $1.08 billion at 31 December 2025, and consists mostly of advertising prepayments and credits.

Table 1.1 Revenue by source and by segment, USD million
| Revenue source | Q2 2026 | Q2 2025 | % change | FY2025 | FY2024 | % change |
|---|---|---|---|---|---|---|
| Advertising | 59,363 | 46,563 | 27 | 196,175 | 160,633 | 22 |
| Other revenue | 1,007 | 583 | 73 | 2,584 | 1,722 | 50 |
| Family of Apps | 60,370 | 47,146 | 28 | 198,759 | 162,355 | 22 |
| Reality Labs | 431 | 370 | 16 | 2,207 | 2,146 | 3 |
| Total revenue | 60,801 | 47,516 | 28 | 200,966 | 164,501 | 22 |
Source: Form 10-Q for the quarter to 30 June 2026, accession 0001628280-26-050705, and Form 10-K for FY2025, accession 0001628280-26-003942.
Family of Apps other revenue rose 73% in the quarter to $1.01 billion, which the 10-Q attributes to paid messaging from WhatsApp and to subscriptions. It rose 50% in 2025 to $2.58 billion, attributed to paid messaging from WhatsApp and Meta Verified subscriptions. Reality Labs revenue rose 16% in the quarter to $431 million, attributed to higher sales of AI glasses partly offset by lower Meta Quest sales; in 2025 it rose 3% to $2.21 billion, which is below the $2.27 billion the segment earned in 2021.
Reality Labs carried an operating loss of $19.19 billion in 2025 and $4.62 billion in the June 2026 quarter. Its cumulative operating loss across 2021 to 2025 was $76.95 billion. The FY2025 10-K states the company expects the segment to continue to operate at a loss for the foreseeable future, and that its ability to fund the effort depends on profits from other parts of the business. It also sets out the planned 2026 mix of Reality Labs operating expenses at approximately 70% on wearables and 30% on virtual reality and Horizon.
Table 1.2 Income (loss) from operations by segment, USD million
| Segment | Q2 2026 | Q2 2025 | FY2025 | FY2024 | FY2023 |
|---|---|---|---|---|---|
| Family of Apps | 23,394 | 24,971 | 102,469 | 87,109 | 62,871 |
| Reality Labs | (4,619) | (4,530) | (19,193) | (17,729) | (16,120) |
| Total | 18,775 | 20,441 | 83,276 | 69,380 | 46,751 |
| Family of Apps operating margin | 38.8% | 53.0% | 51.6% | 53.7% | 47.3% |
| Group operating margin | 30.9% | 43.0% | 41.4% | 42.2% | 34.7% |
Source: Form 10-Q for the quarter to 30 June 2026 and Form 10-K for FY2025. Margins are revenue divided into income from operations.
Family of Apps operating income fell 6% in the June 2026 quarter while its revenue rose 28%. The 10-Q attributes the increase in costs and expenses to employee compensation including severance, infrastructure expenses for data centres, technical infrastructure and third party cloud services, legal related costs, and third party AI token costs. In the six months to 30 June 2026, 87% of total costs and expenses sat in Family of Apps and 13% in Reality Labs, against 82% and 18% for the full year 2025. Chapter 2 sets out those costs line by line.
Revenue by geography

Meta publishes two geographic cuts on different bases. Note 2 of the financial statements splits revenue by the addresses of customers, which is the basis charted above and tabled below. Item 2 of the 10-Q quotes growth by user geography, apportioned by the estimated location of the user when a revenue generating activity happens, and the filing states the two allocations differ.
Table 1.3 Revenue by geography, addresses of customers, USD million
| Region | Q2 2026 | Q2 2025 | FY2025 | FY2024 | FY2023 | FY2022 | FY2021 |
|---|---|---|---|---|---|---|---|
| United States & Canada | 23,863 | 18,454 | 78,866 | 63,207 | 52,888 | 50,150 | 51,541 |
| Europe | 14,009 | 11,128 | 46,569 | 38,361 | 31,210 | 26,681 | 29,057 |
| Asia Pacific | 16,073 | 12,858 | 53,817 | 45,009 | 36,154 | 27,760 | 26,739 |
| Rest of World | 6,856 | 5,076 | 21,714 | 17,924 | 14,650 | 12,018 | 10,592 |
| Total revenue | 60,801 | 47,516 | 200,966 | 164,501 | 134,902 | 116,609 | 117,929 |
Source: Form 10-Q for the quarter to 30 June 2026, Form 10-K for FY2025 and Form 10-K for FY2023, accession 0001326801-24-000012. Europe includes Russia and Turkey; Rest of World includes Africa, Latin America and the Middle East.
On the user geography basis, the 10-Q reports June 2026 quarter growth of 32% in United States and Canada, 24% in Europe, 19% in Asia Pacific and 36% in Rest of World, and the FY2025 10-K reports 2025 growth of 21%, 24%, 20% and 27% on the same four regions. On the addresses of customers basis in Table 1.3, Asia Pacific took 26.8% of 2025 revenue against 22.7% of 2021 revenue, and United States and Canada 39.2% against 43.7%. Both filings state that revenue in United States and Canada and in Europe is relatively higher because of the size and maturity of those advertising markets, and that impression growth is concentrated in geographies that monetise at lower rates, such as Asia Pacific.
United States revenue was $74.78 billion in 2025 against $59.73 billion in 2024. The concentration note in the FY2025 10-K states that 37% of 2025 revenue came from marketers and developers based in the United States, and names western Europe, China, Singapore and Brazil as the source of the majority of the rest. The FY2024 10-K carried a dollar figure for China as a footnote to the revenue disaggregation, at $18.35 billion for 2024 and $13.69 billion for 2023. That footnote does not appear in the FY2025 10-K or in the 10-Q for the quarter to 30 June 2026; neither Item 7 of the FY2025 10-K nor Item 2 of that 10-Q carries a replacement figure.
Foreign exchange moved in opposite directions across the two most recent periods. At constant currency, June 2026 quarter revenue would have been $60.12 billion, $685 million lower than reported. At constant currency, full year 2025 revenue would have been $201.38 billion, $418 million higher than reported.
Advertising drivers and Family metrics

Table 1.4 Advertising revenue drivers and Family metrics as reported
| Measure | Q2 2026 | FY2025 | FY2024 | FY2023 | FY2022 | FY2021 |
|---|---|---|---|---|---|---|
| Ad impressions delivered, change on a year earlier | 14% | 12% | 11% | 28% | 18% | 10% |
| Average price per ad, change on a year earlier | 12% | 9% | 10% | (9)% | (16)% | 24% |
| Family daily active people, billion | 3.60 | 3.58 | 3.35 | 3.19 | 2.96 | 2.82 |
| Family daily active people, change on a year earlier | 3% | 7% | 5% | 8% | 5% | n/a |
Source: Forms 10-K for FY2022, FY2023, FY2024 and FY2025 and Form 10-Q for the quarter to 30 June 2026. Daily active people are the average for December of each full year and for June 2026.
Ad impressions delivered rose 14% in the June 2026 quarter and average price per ad rose 12%, against advertising revenue growth of 27%. Both drivers have been positive in every period since the start of 2024, and the years in which price per ad fell are in Table 1.4. The FY2025 10-K attributes the 2025 price increase to higher advertising demand, which it links to improvements in ad targeting and measurement tools, partly offset by more impressions in geographies and products such as Reels that monetise at lower rates. It names online commerce as the largest contributing vertical to the 2025 increase, and the 10-Q names it again for the June 2026 quarter.

Family daily active people averaged 3.60 billion in June 2026, 3% above June 2025, and 3.58 billion in December 2025, 7% above December 2024. The 10-Q states that daily active people declined slightly in the first quarter of 2026 because of internet disruptions in Iran, largely restored in the second quarter, and a restriction on access to WhatsApp in Russia. Meta states an approximate 3% error margin on the worldwide figure. Average revenue per person was $16.86 in the June 2026 quarter, 24% above the same quarter of 2025, against user growth of 3%. Annual average revenue per person for 2025 was $57.03, 15% above 2024. Meta defines it as Family of Apps revenue for a quarter divided by the average of opening and closing daily active people.
2 Financial Analysis & Ratios
Meta Platforms took $60.80 billion of revenue in the quarter to 30 June 2026, 28% more than the same quarter of 2025, and reported income from operations of $18.78 billion, 8% less. Operating margin was 30.9% against 43.0%. Net income was $15.85 billion, down 14%, and diluted earnings per share $6.18 against $7.14. Costs and expenses rose 55% in the quarter, adding $14.95 billion against the $13.29 billion revenue added. Full year 2025 revenue was $200.97 billion, up 22%, with income from operations of $83.28 billion, up 20%, and an operating margin of 41.4% against 42.2% in 2024. Net income for 2025 fell 3% to $60.46 billion, on a provision for income taxes of $25.47 billion against $8.30 billion.
Table 2.1 What changed, USD million except per share amounts
| Q2 2026 | Q2 2025 | % change | FY2025 | FY2024 | % change | |
|---|---|---|---|---|---|---|
| Revenue | 60,801 | 47,516 | 28 | 200,966 | 164,501 | 22 |
| Cost of revenue | 11,330 | 8,491 | 33 | 36,175 | 30,161 | 20 |
| Research and development | 21,656 | 12,942 | 67 | 57,372 | 43,873 | 31 |
| Marketing and sales | 3,431 | 2,979 | 15 | 11,991 | 11,347 | 6 |
| General and administrative | 5,609 | 2,663 | 111 | 12,152 | 9,740 | 25 |
| Total costs and expenses | 42,026 | 27,075 | 55 | 117,690 | 95,121 | 24 |
| Income from operations | 18,775 | 20,441 | (8) | 83,276 | 69,380 | 20 |
| Interest and other income (expense), net | (19) | 93 | (120) | 2,656 | 1,283 | 107 |
| Income before provision for income taxes | 18,756 | 20,534 | (9) | 85,932 | 70,663 | 22 |
| Provision (benefit) for income taxes | 2,908 | 2,197 | 32 | 25,474 | 8,303 | 207 |
| Net income | 15,848 | 18,337 | (14) | 60,458 | 62,360 | (3) |
| Diluted earnings per share | 6.18 | 7.14 | (13) | 23.49 | 23.86 | (2) |
| Diluted shares, million | 2,566 | 2,570 | (0) | 2,574 | 2,614 | (2) |
Source: Form 10-Q for the quarter to 30 June 2026, accession 0001628280-26-050705, and Form 10-K for FY2025, accession 0001628280-26-003942.

Research and development was the largest single addition to cost in the quarter, $8.71 billion more than a year earlier. The 10-Q attributes that increase to higher employee compensation, infrastructure expenses for data centres, technical infrastructure and third party cloud services, and third party AI token costs, and states that the higher employee compensation came mainly from increases in share based compensation expense and severance expenses. General and administrative more than doubled, and the 10-Q attributes the increase primarily to $2.40 billion of charges related to legal proceedings recorded in the quarter. Cost of revenue rose 33%, attributed to higher infrastructure expenses for data centres, technical infrastructure and third party cloud services. Headcount was 75,472 at 30 June 2026, 1% lower than a year earlier, and includes approximately 8,000 employees affected by the May 2026 headcount reduction, who the filing states will mostly leave the headcount by the end of the third quarter of 2026.

Operating margin held between 40.1% and 43.0% across the five quarters from March 2025 to March 2026, then fell to 30.9% in the June 2026 quarter. Gross margin was 81.4% in the quarter against 82.1% a year earlier, and 82.0% for the full year 2025 against 81.7% in 2024. Research and development took 35.6% of revenue in the quarter, against 27.2% a year earlier.
Ratios
Table 2.2 Ratio analysis
| Ratio | FY2023 | FY2024 | FY2025 | 12 months to 30 Jun 2026 |
|---|---|---|---|---|
| Growth, % | ||||
| Revenue | n/a | 21.9 | 22.2 | 27.7 |
| Income from operations | n/a | 48.4 | 20.0 | 10.4 |
| Net income | n/a | 59.5 | (3.0) | (4.8) |
| Margin, % | ||||
| Gross margin | 80.8 | 81.7 | 82.0 | 81.7 |
| Operating margin | 34.7 | 42.2 | 41.4 | 38.1 |
| Net margin | 29.0 | 37.9 | 30.1 | 29.8 |
| Research and development, share of revenue | 28.5 | 26.7 | 28.6 | 31.4 |
| Free cash flow margin | 31.9 | 31.7 | 21.7 | 16.6 |
| Return, % | ||||
| Return on equity | 28.0 | 37.1 | 30.2 | 29.8 |
| Return on capital employed, after tax | 25.1 | 32.0 | 24.1 | 23.8 |
| Return on assets | 18.8 | 24.7 | 18.8 | 18.3 |
| Effective tax rate | 17.6 | 11.8 | 29.6 | 22.2 |
| Leverage and liquidity | ||||
| Long term debt to equity, % | 12.0 | 15.8 | 27.0 | 32.0 |
| Long term debt to operating cash flow, times | 0.26 | 0.32 | 0.51 | 0.64 |
| Net cash, USD million | 47,018 | 48,989 | 22,848 | 6,596 |
| Income from operations to interest expense, times | 104.8 | 97.0 | 71.5 | 42.8 |
| Current ratio, times | 2.67 | 2.98 | 2.60 | 2.23 |
| Efficiency and intensity | ||||
| Days sales outstanding | 43.8 | 37.7 | 35.9 | 32.6 |
| Asset turnover, times | 0.65 | 0.65 | 0.63 | 0.61 |
| Revenue per employee, USD million | 2.00 | 2.22 | 2.55 | 3.02 |
| Capital expenditure, share of revenue, % | 20.8 | 23.8 | 35.9 | 40.5 |
| Capital expenditure, share of operating cash flow, % | 39.5 | 43.0 | 62.4 | 70.9 |
Source: Form 10-K filings for FY2023, FY2024 and FY2025, accessions 0001326801-24-000012, 0001326801-25-000017 and 0001628280-26-003942, and the Form 10-Q filings for the quarters to 30 June 2025 and 30 June 2026, accessions 0001628280-25-036791 and 0001628280-26-050705. The twelve months to 30 June 2026 is the audited 2025 year less the six months to 30 June 2025 plus the six months to 30 June 2026. Returns use average opening and closing balances; capital employed is equity plus long term debt; net cash is cash, cash equivalents and marketable securities less long term debt; revenue per employee uses headcount at the period end as stated in each filing.

Return on equity was 29.8% on the twelve months to 30 June 2026 and 30.2% in 2025, against 37.1% in 2024. After tax return on capital employed was 24.1% in 2025 against 32.0%. Equity grew 19% in 2025 to $217.24 billion and a further 20% in the six months to $261.22 billion, while long term debt grew from $28.83 billion to $83.66 billion across the same eighteen months, so the denominator in both measures rose faster than earnings. The effective tax rate was 29.6% in 2025 against 11.8% in 2024.
The capital expenditure programme

Capital expenditure, which the company defines as purchases of property and equipment plus principal payments on finance leases, was $50.92 billion in the six months to 30 June 2026 and $31.08 billion in the June quarter alone. That compares with $72.22 billion for the whole of 2025 and $39.23 billion for 2024. The FY2024 10-K anticipated capital expenditure of approximately $60 billion to $65 billion in 2025; the outturn was $72.22 billion. The standing outlook is approximately $130 billion to $145 billion for 2026, raised twice from the $115 billion to $135 billion of the FY2025 10-K; chapter 3 carries the full guidance record.
Table 2.3 Capital expenditure, the assets it builds and the commitments behind it, USD million
| FY2023 | FY2024 | FY2025 | H1 2026 | |
|---|---|---|---|---|
| Purchases of property and equipment | 27,045 | 37,256 | 69,691 | 49,113 |
| Principal payments on finance leases | 1,058 | 1,969 | 2,524 | 1,805 |
| Capital expenditure | 28,103 | 39,225 | 72,215 | 50,918 |
| Depreciation and amortisation | 11,178 | 15,498 | 18,616 | 12,355 |
| Net cash provided by operating activities | 71,113 | 91,328 | 115,800 | 64,088 |
| Free cash flow | 43,010 | 52,103 | 43,585 | 13,170 |
| At the period end | ||||
| Property and equipment and finance lease right of use assets, net | 96,587 | 121,346 | 176,400 | 225,724 |
| Operating lease right of use assets | 13,294 | 14,922 | 20,404 | 23,985 |
| Leases signed but not yet commenced | 8,440 | 34,120 | 103,770 | 278,990 |
| Noncancelable contractual commitments | 16,490 | 32,820 | 131,050 | 349,310 |
Source: Form 10-K filings for FY2023, FY2024 and FY2025 and the Form 10-Q for the quarter to 30 June 2026. Free cash flow for the full years is the figure reconciled in Item 7 of the FY2025 10-K; for the six months to 30 June 2026 it is operating cash flow less capital expenditure on the same definition. Leases not yet commenced for FY2023 is the sum of the operating and finance lease amounts stated separately in the leases note of that filing.
Free cash flow was $13.17 billion in the six months to 30 June 2026 against $18.88 billion in the same period of 2025, and $43.59 billion in 2025 against $52.10 billion in 2024. Capital expenditure took 70.9% of operating cash flow over the twelve months to 30 June 2026 and 62.4% in 2025, against 43.0% in 2024. Depreciation and amortisation reached $18.62 billion in 2025. In January 2025 the company completed an assessment of the useful lives of property and equipment and increased the estimated useful lives of most servers and network assets to 5.5 years with effect from 1 January 2025; the FY2025 10-K states that the change reduced 2025 depreciation expense by $2.92 billion and increased net income by $2.59 billion, or $1.00 per diluted share.
Leases signed but not yet commenced were $278.99 billion at 30 June 2026, against $103.77 billion at 31 December 2025, and the 10-Q adds that in July 2026 the company entered further data centre leases with obligations of approximately $68 billion, expected to commence in 2027 and 2028. Noncancelable contractual commitments were $349.31 billion at 30 June 2026, mostly third party cloud capacity arrangements and investments in servers and network infrastructure, data centres and consumer hardware products in the Reality Labs segment, with approximately $53.52 billion due in 2026 and $81.65 billion in 2027. A further $14.72 billion of cloud capacity is a contingent obligation over five years, which the filing states may be reduced if the cloud service provider sells the capacity to other customers.
Cash, debt and the capital return programme

Table 2.4 Cash, debt and capital returned, USD million
| 31 Dec 2023 | 31 Dec 2024 | 31 Dec 2025 | 30 Jun 2026 | |
|---|---|---|---|---|
| Cash and cash equivalents | 41,862 | 43,889 | 35,873 | 15,462 |
| Marketable securities | 23,541 | 33,926 | 45,719 | 74,798 |
| Cash, cash equivalents and marketable securities | 65,403 | 77,815 | 81,592 | 90,260 |
| Long term debt, carrying value | 18,385 | 28,826 | 58,744 | 83,664 |
| Aggregate principal amount of notes | 18,500 | 29,000 | 59,000 | 84,000 |
| Fair value of the notes | 18,480 | 27,830 | 57,220 | 79,750 |
| Net cash | 47,018 | 48,989 | 22,848 | 6,596 |
| Total stockholders' equity | 153,168 | 182,637 | 217,243 | 261,221 |
| Paid in the period | FY2023 | FY2024 | FY2025 | H1 2026 |
| Repurchases of Class A common stock | 19,774 | 30,125 | 26,248 | 0 |
| Dividends and dividend equivalents | 0 | 5,072 | 5,324 | 2,699 |
| Taxes paid on net share settlement of restricted stock units | 7,012 | 13,770 | 18,400 | 8,704 |
| Proceeds from the issuance of long term debt | 8,455 | 10,432 | 29,906 | 24,910 |
Source: Form 10-K filings for FY2023, FY2024 and FY2025 and the Form 10-Q for the quarter to 30 June 2026. Repurchase and dividend figures are cash paid as reported in the statements of cash flows.
Cash, cash equivalents and marketable securities were $90.26 billion at 30 June 2026, $8.67 billion higher than at 31 December 2025. Long term debt was $83.66 billion, so net cash was $6.60 billion, against $22.85 billion at the end of 2025 and $48.99 billion at the end of 2024. The company issued $25.00 billion of fixed rate senior unsecured notes in May 2026 with stated coupons of 4.55% to 6.45%, taking the aggregate principal amount of notes outstanding to $84.00 billion maturing from 2027 through 2066; chapter 5 sets out the terms of that issue and of the November 2025 issue. Interest expense was $783 million in the June quarter against $241 million a year earlier, which the 10-Q attributes to higher long term debt balances. Separately, $10.80 billion of money market funds was reclassified as restricted cash equivalents during the half year under escrow requirements attached to multiyear infrastructure purchase agreements, and the filing states those funds are expected to be released between 2028 and 2030.
No Class A shares were repurchased in the six months to 30 June 2026, against $22.92 billion of cash repurchases in the same period of 2025. The 10-Q attributes the swing in financing cash flow, from $35.47 billion used to $9.41 billion provided, to the net proceeds from the May 2026 notes and the absence of share repurchases in the current period. The authorisation, which commenced in January 2017 and has no expiration date, stood at $25.03 billion available at 30 June 2026, the same figure as at 31 December 2025. The quarterly dividend was $0.525 per share, unchanged since the first quarter of 2025, and $1.35 billion of dividends and dividend equivalents was paid in the June quarter.
Interest, other income and tax
Table 2.5 Interest and other income (expense), net, and the provision for income taxes, USD million
| Q2 2026 | Q2 2025 | FY2025 | FY2024 | FY2023 | |
|---|---|---|---|---|---|
| Interest income | 859 | 481 | 2,123 | 2,517 | 1,639 |
| Interest expense | (783) | (241) | (1,165) | (715) | (446) |
| Foreign currency exchange gain (loss), net | (123) | 196 | 352 | (690) | (366) |
| Gain (loss) on equity investments and other, net | 28 | (343) | 1,346 | 171 | (150) |
| Interest and other income (expense), net | (19) | 93 | 2,656 | 1,283 | 677 |
| Provision (benefit) for income taxes | 2,908 | 2,197 | 25,474 | 8,303 | 8,330 |
| Effective tax rate, % | 16 | 11 | 30 | 12 | 18 |
Source: Item 2 of the Form 10-Q for the quarter to 30 June 2026 and Item 7 of the Form 10-K for FY2025. The FY2023 column is included because it is the last full year before the United States tax law changes enacted in July 2025.
The provision for income taxes rose 207% in 2025 to $25.47 billion. The FY2025 10-K states that the One Big Beautiful Bill Act, enacted on 4 July 2025, introduced immediate expensing of domestic research and development costs and certain capital expenditures from 2025 and an enhanced deduction for foreign derived intangible income from 2026, with the benefits limited by the 15% Corporate Alternative Minimum Tax, and that the company recorded a $15.93 billion charge in the third quarter of 2025, of which $14.03 billion was a valuation allowance against U.S. federal deferred tax assets as of the enactment date. The filing states that absent the valuation allowance charge the 2025 effective tax rate would have been 17 percentage points lower, at 13%. Net income in the September 2025 quarter was $2.71 billion on income before tax of $21.66 billion. Cash paid for income taxes in 2025 was $7.58 billion, against $10.55 billion in 2024.
The six months to 30 June 2026 carried a net benefit for income taxes of $2.11 billion against a $3.94 billion provision a year earlier, which the 10-Q attributes primarily to the income tax benefit from U.S. Treasury Notice 2026-7, providing relief from the Corporate Alternative Minimum Tax related to the expensing of previously capitalised U.S. research and development costs. The effective rate for the June quarter alone was 16% against 11%, and the 10-Q attributes that increase to certain tax benefits, including those from foreign derived deduction eligible income and excess tax benefits from share based compensation, being limited by the Corporate Alternative Minimum Tax regime in 2026. The filing states that absent changes to the tax landscape the effective tax rate for the remaining quarters of 2026 is expected to be between 15% and 17%.
Interest and other income, net, turned to an expense of $19 million in the June 2026 quarter from income of $93 million, and to an expense of $1.14 billion for the half year from income of $919 million. The 10-Q attributes the half year loss on equity investments to unrealised losses on marketable equity investments, partly offset by unrealised gains on nonmarketable equity investments. Nonmarketable equity investments on the balance sheet were $30.16 billion at 30 June 2026 and $27.52 billion at 31 December 2025, against $6.07 billion at 31 December 2024; purchases of nonmarketable equity investments were $18.33 billion in 2025 and $11 million in 2024.
3 MD&A & Management Commentary
Management's own account of the quarter to 30 June 2026 opens on revenue of $60.80 billion, up 28%, and income from operations of $18.78 billion, down $1.67 billion or 8%. The Form 10-Q attributes the fall to higher costs and expenses, and names four drivers: employee compensation including severance expenses, infrastructure expenses for data centres, technical infrastructure and third party cloud services, legal related costs, and third party AI token costs (0001628280-26-050705). The earnings release furnished the same day puts $2.40 billion of charges related to legal proceedings and $1.18 billion of severance in connection with the May 2026 headcount reduction inside the $42.03 billion of total costs and expenses (0001628280-26-050596). For the full year 2025 the Form 10-K reported revenue of $200.97 billion, up 22%, income from operations of $83.28 billion, up 20%, and an effective tax rate of 30% carrying the One Big Beautiful Bill Act charge of $15.93 billion taken in the third quarter of 2025 (0001628280-26-003942).
The quantified forward statements moved across the same three filing dates. The 2026 capital expenditure outlook was $115 billion to $135 billion on 28 January 2026, $125 billion to $145 billion on 29 April, and $130 billion to $145 billion on 29 July. The 2026 total expense outlook held at $162 billion to $169 billion through April, then had its low end raised to $165 billion on 29 July. The effective tax rate outlook was 13% to 16% on the first two dates and 15% to 17% for the remaining quarters of 2026 on the third.
The management commentary record
Table 3.1 What each document says, by Item number
| Filing, filed date, accession | Item | What the Item says, with its figures |
|---|---|---|
| Form 10-K, FY2025, 28 Jan 2026, 0001628280-26-003942 | Part II, Item 7, MD&A | Revenue $200,966m, up 22%; income from operations $83,276m, up 20%, on total costs and expenses of $117,690m; net income $60,458m and diluted earnings per share $23.49; effective tax rate 30%, stated as 13% absent the valuation allowance charge at the enactment date of the One Big Beautiful Bill Act. Family of Apps earned $198,759m of revenue and $102,469m of operating income. Reality Labs earned $2,207m of revenue against a $19,193m operating loss. Daily active people 3.58 billion for December 2025, up 7%; ad impressions up 12%; average price per ad up 9%; annual average revenue per person $57.03. Capital expenditure including finance lease principal $72,215m; free cash flow $43,585m; headcount 78,865. Guides 2026 capital expenditure to approximately $115 billion to $135 billion and the 2026 effective tax rate to 13% to 16%, and states that 2026 Reality Labs operating losses are expected to remain similar to 2025. |
| Form 10-K, FY2025, 28 Jan 2026, 0001628280-26-003942 | Part II, Item 7A, market risk | Foreign currency transaction gains of $352m in 2025 against losses of $690m in 2024. A hypothetical 100 basis point rise in market interest rates is stated to cut the market value of available for sale debt securities and cash equivalents by $711m. Fixed rate senior notes outstanding of $59.0 billion. Marketable equity securities $5.99 billion, with a 10% adverse price move stated at $599m. Nonmarketable equity investments under the measurement alternative $20.08 billion and equity method investments $7.45 billion. |
| Form 8-K, 28 Jan 2026, 0001628280-26-003832 | Item 2.02, results of operations | Furnishes the FY2025 earnings release as Exhibit 99.1 and states the information is not deemed filed for the purposes of Section 18. The release carries the CFO Outlook Commentary: first quarter 2026 revenue of $53.5 to $56.5 billion on an assumed 4% foreign currency tailwind; full year 2026 total expenses of $162 to $169 billion; 2026 capital expenditure of $115 to $135 billion; a full year 2026 tax rate of 13% to 16%; and operating income in 2026 above 2025 operating income. |
| Form 8-K, 28 Jan 2026, 0001628280-26-003832 | Item 9.01, exhibits | Lists Exhibit 99.1, the press release dated January 28, 2026, and Exhibit 104, the cover page interactive data file. |
| Form 10-Q, Q1 2026, 29 Apr 2026, 0001628280-26-028526 | Part I, Item 2, MD&A | Revenue $56,311m, up 33%, and up 29% on a constant currency basis; income from operations $22,872m, up $5,317m or 30%, attributed to higher advertising revenue partly offset by higher infrastructure costs and employee compensation. Net income $26,773m and diluted earnings per share $10.44, carrying an $8.03 billion tax benefit from U.S. Treasury Notice 2026-7 that partly offsets the $15.93 billion charge of the third quarter of 2025. Effective tax rate (23)%, stated as 14% excluding that benefit. Ad impressions up 19%; average price per ad up 12%; daily active people 3.56 billion for March 2026, up 4%, with the quarter on quarter decline attributed to internet disruptions in Iran and a restriction on access to WhatsApp in Russia. Capital expenditure $19,840m. Lease obligations not yet commenced $182.88 billion; noncancelable contractual commitments $237.67 billion, of which $42.25 billion is due in 2026. Guides 2026 capital expenditure to approximately $125 billion to $145 billion and the tax rate for the remaining quarters of 2026 to 13% to 16%. |
| Form 10-Q, Q1 2026, 29 Apr 2026, 0001628280-26-028526 | Part I, Item 3, market risk | States there have been no material changes to market risk exposures during the three months ended March 31, 2026, and refers back to Part II, Item 7A of the FY2025 Form 10-K. |
| Form 8-K, 29 Apr 2026, 0001628280-26-028364 | Item 2.02, results of operations | Furnishes the first quarter 2026 earnings release as Exhibit 99.1. The CFO Outlook Commentary guides second quarter 2026 revenue to $58 to $61 billion on an assumed 2% foreign currency tailwind, holds full year 2026 total expenses at $162 to $169 billion, raises 2026 capital expenditure to $125 to $145 billion, and holds the tax rate for the remaining quarters at 13% to 16%. |
| Form 8-K, 29 Apr 2026, 0001628280-26-028364 | Item 9.01, exhibits | Lists Exhibit 99.1, the press release dated April 29, 2026, and Exhibit 104. |
| Form 10-Q, Q2 2026, 29 Jul 2026, 0001628280-26-050705 | Part I, Item 2, MD&A | Revenue $60,801m, up 28%, and up 27% on a constant currency basis; income from operations $18,775m, down 8%; operating margin 31% against 43%. Family of Apps operating income $23,394m, down 6%; Reality Labs loss $4,619m. General and administrative expenses up 111% to $5,609m, attributed primarily to $2.40 billion of charges related to legal proceedings. Research and development up 67% to $21,656m. Net income $15,848m and diluted earnings per share $6.18; effective tax rate 16%. Ad impressions up 14%; average price per ad up 12%; daily active people 3.60 billion for June 2026, up 3%; average revenue per person $16.86, up 24%. Capital expenditure $31,078m in the quarter and $50,918m in the half year; cash and marketable securities $90.26 billion; long term debt $83.66 billion after $24.91 billion of net proceeds from notes issued in May 2026. Lease obligations not yet commenced $278.99 billion, plus approximately $68 billion of data centre leases entered in July 2026. Noncancelable contractual commitments $349.31 billion, of which $53.52 billion is due in 2026 and $81.65 billion in 2027. Guides 2026 capital expenditure to approximately $130 billion to $145 billion and the tax rate for the remaining quarters to 15% to 17%. |
| Form 10-Q, Q2 2026, 29 Jul 2026, 0001628280-26-050705 | Part I, Item 3, market risk | States there have been no material changes to market risk exposures during the six months ended June 30, 2026, and refers back to Part II, Item 7A of the FY2025 Form 10-K. |
| Form 8-K, 29 Jul 2026, 0001628280-26-050596 | Item 2.02, results of operations | Furnishes the second quarter 2026 earnings release as Exhibit 99.1. The release adds $1.18 billion of severance expenses in connection with the May 2026 headcount reduction to the $2.40 billion of legal charges, reports free cash flow of $784m against $8,549m a year earlier, and guides third quarter 2026 revenue to $61 to $64 billion on an assumed 1% foreign currency headwind. It raises the low end of the full year 2026 expense outlook to $165 billion, narrows capital expenditure to $130 to $145 billion, and raises the tax rate for the remaining quarters to 15% to 17%. |
| Form 8-K, 29 Jul 2026, 0001628280-26-050596 | Item 9.01, exhibits | Lists Exhibit 99.1, the press release dated July 29, 2026, and Exhibit 104. |
Source: Meta Platforms Form 10-K, Form 10-Q and Form 8-K filings, retrieved through the SEC-API.io MCP server.
Each of the three earnings 8-Ks carries only Items 2.02 and 9.01. The Item 2.02 text is the same each quarter: it names the date, states that a press release was issued and a conference call will be held, furnishes the release as Exhibit 99.1, and records that the information is not deemed filed for the purposes of Section 18 of the Securities Exchange Act of 1934. Every quantified statement about the future sits in the Exhibit, in the section headed CFO Outlook Commentary. Conference call transcripts are posted to the company's investor relations website and are not EDGAR documents; nothing in this chapter is taken from them.

The guidance record
Table 3.2 Every quantified forward statement, and what it has since been restated to
| Forward statement | 28 Jan 2026 | 29 Apr 2026 | 29 Jul 2026 | Standing at 6 Sep 2026 | What management filed, and where |
|---|---|---|---|---|---|
| 2026 capital expenditure, including principal payments on finance leases, USD billion | 115 to 135 | 125 to 145 | 130 to 145 | 130 to 145 | The July release states the range was "narrowed from our prior outlook of $125-145 billion"; the April release had raised it and attributed the rise to expectations for higher component pricing and, to a lesser extent, additional data centre costs to support future year capacity (0001628280-26-050596; 0001628280-26-028364). The Form 10-Q of 29 July repeats the figure: "We anticipate making capital expenditures of approximately $130 billion to $145 billion in 2026 to support our AI efforts and core business." (0001628280-26-050705). |
| 2026 total expenses, USD billion | 162 to 169 | 162 to 169 | 165 to 169 | 165 to 169 | The July release raised the low end and gave the reason: "We are raising the lower-end of our expense outlook to incorporate the $2.4 billion charges related to legal proceedings recognized in the second quarter. We now expect full year 2026 total expenses to be in the range of $165-169 billion." (0001628280-26-050596). The April release had described the range as unchanged from the prior outlook (0001628280-26-028364). |
| Effective tax rate, % | 13 to 16, full year 2026 | 13 to 16, remaining quarters | 15 to 17, remaining quarters | 15 to 17 for the remaining quarters | The July release states: "Absent any changes to our tax landscape, we expect our tax rate for the remaining quarters of 2026 to be between 15-17%, an increase from our prior outlook of 13-16%." (0001628280-26-050596). The Form 10-Q of the same date gives the same range and attributes the increase to U.S. tax benefits from foreign derived deduction eligible income and excess tax benefits from share based compensation being limited by the Corporate Alternative Minimum Tax regime (0001628280-26-050705). |
| 2026 operating income against 2025 | above $83,276m | above 2025 | above 2025 | above $83,276m | Filed in all three releases. The July wording: "We continue to expect to deliver operating income this year that is above 2025 operating income." (0001628280-26-050596). Income from operations in the six months to 30 June 2026 was $41,647m, against $83,276m for the whole of 2025 (0001628280-26-050705; 0001628280-26-003942). |
| Reality Labs 2026 operating loss | similar to the 2025 loss of $19,193m | similar to 2025 | similar to 2025 | similar to $19,193m | The FY2025 release states: "At a segment level, we expect expense growth to be driven by the Family of Apps, with Reality Labs operating losses remaining similar to 2025 levels." (0001628280-26-003832). Both 2026 Forms 10-Q repeat it, the second reporting a half year Reality Labs loss of $8,647m (0001628280-26-028526; 0001628280-26-050705). |
| Next quarter total revenue, USD billion | Q1 2026, 53.5 to 56.5 | Q2 2026, 58 to 61 | Q3 2026, 61 to 64 | Q3 2026, 61 to 64 | Each range is set in the release for the prior quarter. Reported revenue was $56,311m for the first quarter and $60,801m for the second, in each case inside the range guided (0001628280-26-028526; 0001628280-26-050705). The third quarter range stands unreported. |
| Assumed foreign currency effect on next quarter revenue growth | 4% tailwind | 2% tailwind | 1% headwind | 1% headwind | Stated in the CFO Outlook Commentary of each release as based on then current exchange rates (0001628280-26-003832; 0001628280-26-028364; 0001628280-26-050596). Foreign exchange added $685m to second quarter revenue and $2.43 billion to the half year (0001628280-26-050705). |
| Lease obligations not yet commenced, USD billion | 103.77 at 31 Dec 2025 | 182.88 at 31 Mar 2026 | 278.99 at 30 Jun 2026 | 278.99, plus approximately 68 entered in July 2026 | The FY2025 Form 10-K puts commencement between 2026 and 2030; the Q2 Form 10-Q extends it through 2036 and adds: "In July 2026, we entered into additional data center leases with lease obligations of approximately $68 billion, which are expected to commence in 2027 and 2028, with lease terms of 18 to 20 years." (0001628280-26-003942; 0001628280-26-050705). |
| Noncancelable contractual commitments, USD billion | 131.05 at 31 Dec 2025 | 237.67 at 31 Mar 2026 | 349.31 at 30 Jun 2026 | 349.31 | Described in each filing as mostly third party cloud capacity arrangements and investments in servers, network infrastructure, data centres and Reality Labs consumer hardware. The Q1 Form 10-Q adds approximately $24 billion of multiyear infrastructure contracts entered in April 2026 (0001628280-26-003942; 0001628280-26-028526; 0001628280-26-050705). |
| Of those commitments, the amount due in 2026, USD billion | 30.63 | 42.25 | 53.52 | 53.52 | Filed alongside the total in each document; the Q2 Form 10-Q also gives $81.65 billion due in 2027 (0001628280-26-050705). |
| Contingent obligation to purchase cloud capacity, USD billion | not stated in the Form 10-K | 14.72 over five years | 14.72 over five years | 14.72 over five years | Both 2026 Forms 10-Q state the obligation may be reduced if the cloud service provider sells the capacity to other customers (0001628280-26-028526; 0001628280-26-050705). |
| Restricted cash held against multiyear infrastructure purchase agreements, USD billion | not applicable | 5.00 at 31 Mar 2026 | 10.80 at 30 Jun 2026 | 10.80, expected to be released between 2028 and 2030 | Money market funds reclassified as restricted cash equivalents under escrow requirements, restricted from general corporate use (0001628280-26-028526; 0001628280-26-050705). |
| Headcount effect of the May 2026 reduction | not applicable | not applicable | approximately 8,000 employees | approximately 8,000, out of headcount by the end of the third quarter of 2026 | The Q2 Form 10-Q and the July release both state: "Our reported headcount includes approximately 8,000 employees impacted by the May 2026 headcount reduction, the majority of whom will no longer be reflected in our headcount by the end of the third quarter of 2026." Headcount was 75,472 at 30 June 2026 against 78,865 at 31 December 2025 (0001628280-26-050705; 0001628280-26-050596; 0001628280-26-003942). |
Source: Meta Platforms Form 10-K, Form 10-Q and Form 8-K Exhibit 99.1 filings, retrieved through the SEC-API.io MCP server.
Six of the twelve statements carry a different figure at 6 September 2026 from the one first filed on 28 January 2026: capital expenditure, total expenses, the tax rate, lease obligations not yet commenced, noncancelable contractual commitments, and the part of those commitments due in 2026. Two more, the next quarter revenue range and the currency assumption behind it, are reset at each reporting date. The remaining four stand as first filed. The $115 billion to $135 billion capital expenditure range of the FY2025 Form 10-K and of the release furnished the same day was superseded on 29 April and again on 29 July, so the $130 billion to $145 billion range is the one that carries forward.

Revenue in the third quarter of 2025 was $51.24 billion (0001628280-25-047240), so the third quarter 2026 range of $61 billion to $64 billion guided on 29 July 2026 is growth of 19% to 25%.

The trends management names
Table 3.3 Trends and risks management flags in its own commentary
| Trend as management states it | Where it appears | Figures it carries |
|---|---|---|
| Advertising revenue adversely affected by limits on ad targeting and measurement from the regulatory environment and from third party mobile operating systems and browsers | Developments in Advertising, in Item 7 of the Form 10-K and Item 2 of both 2026 Forms 10-Q | Named laws include the General Data Protection Regulation, the ePrivacy Directive, the European Digital Services Act and the Digital Markets Act; the 2021 Apple iOS changes are named as having reduced targeting and measurement ability |
| Reels monetises at a lower rate than Feed and Stories, and is expected to continue to | Other Business and Macroeconomic Conditions, all three MD&A sections | Stated without a figure; average price per ad growth of 12% in the June quarter is stated to be partly offset by impressions in products such as Reels that monetise at lower rates |
| Ad impression growth is concentrated in geographies that monetise at lower rates | Trends in Our Revenue by User Geography, all three MD&A sections | June 2026 quarter revenue growth of 32% in United States and Canada, 24% in Europe, 19% in Asia Pacific and 36% in Rest of World; ad impressions up 14% in the quarter |
| Competition has reduced some users' engagement, in particular among younger users | Other Business and Macroeconomic Conditions, all three MD&A sections | Daily active people 3.60 billion for June 2026, up 3%, against up 7% for December 2025 |
| Advertising budgets pressured by inflation, economic policies and international trade, high interest rates and market uncertainty | Other Business and Macroeconomic Conditions, all three MD&A sections | The Q2 2026 Form 10-Q adds the conflict in the Middle East and states this has impacted and could continue to impact results; the FY2025 Form 10-K named only volatility around international trade |
| Regional user base declines from geopolitical conditions | Trends in Our Family Metrics, both 2026 Forms 10-Q | The first quarter decline in daily active people is attributed to internet disruptions in Iran, largely restored in the second quarter, and a restriction on access to WhatsApp in Russia |
| Legal and regulatory scrutiny on youth related issues | CFO Outlook Commentary, all three releases | The July release states the company continues to see scrutiny on youth related issues in several markets and has a number of youth related trials scheduled for this year in the U.S., which may ultimately result in a material loss; $2.40 billion of charges related to legal proceedings were taken in the June quarter |
| Infrastructure investment for AI initiatives increasing | Investment Philosophy, all three MD&A sections | Family of Apps took 87% of total costs and expenses in the half year to 30 June 2026 against 82% in 2025; capital expenditure guidance of $130 billion to $145 billion for 2026 against $72.22 billion spent in 2025 |
| Corporate Alternative Minimum Tax limiting the benefit of other provisions | Provision for income taxes, all three MD&A sections | A $15.93 billion charge in the third quarter of 2025, of which $14.03 billion was a valuation allowance, partly offset by an $8.03 billion benefit in the first quarter of 2026 under Treasury Notice 2026-7 |
| Reality Labs investment directed at products that may only be fully realised in the next decade | Investment Philosophy, all three MD&A sections | Reality Labs reduced operating profit by $19.19 billion in 2025 and by $8.65 billion in the half year to 30 June 2026 |
| Limited visibility into what drives advertiser spending | Other Business and Macroeconomic Conditions, all three MD&A sections | Management states it is "unable to quantify the exact impact that each trend had on our advertising revenue during the periods presented" |
Source: Meta Platforms Form 10-K, Form 10-Q and Form 8-K Exhibit 99.1 filings, retrieved through the SEC-API.io MCP server.
The commentary against the reported figures
The July release opens with a statement from Mark Zuckerberg that "AI is accelerating our core business today, powering our next generation of products, and opening the door to entirely new enterprise opportunities" (0001628280-26-050596). The same document reports income from operations down 8% and free cash flow of $784 million against $8.55 billion a year earlier, on capital expenditure of $31.08 billion in the quarter.
The Q2 2026 Form 10-Q attributes the 12% rise in average price per ad to an increase in advertising demand, which it says is mostly due to ongoing improvements to ad performance from targeting and measurement tools, and to a favourable foreign currency effect. In its section headed Other Business and Macroeconomic Conditions the same document states that "we do not have perfect visibility into the factors driving advertiser spending decisions" (0001628280-26-050705).
Capital expenditure of $50.92 billion in the six months to 30 June 2026 is 39% of the low end of the standing $130 billion to $145 billion range, so the outlook implies $79 billion to $94 billion in the second half. Total costs and expenses of $75.46 billion in the half year are 46% of the low end of the $165 billion to $169 billion expense outlook. The Reality Labs loss of $8.65 billion in the half year, doubled, is 90% of the 2025 loss of $19.19 billion, against a stated expectation that the 2026 loss remains similar to 2025.
4 Sector & Competitor Analysis
Meta reported revenue of $60.80 billion for the three months to 30 June 2026, 28% above the same quarter of 2025, with income from operations of $18.78 billion and an operating margin of 31% against 43% a year earlier (10-Q, accession 0001628280-26-050705). The two segments moved apart inside that quarter. Family of Apps earned $60.37 billion of the revenue and $23.39 billion of income from operations, 6% below the prior year quarter. Reality Labs earned $431 million and lost $4.62 billion. Capital expenditure, including principal payments on finance leases, was $31.08 billion in the quarter.
Each segment competes against a different group of companies, so the comparator set is built on stated dimensions and each name is placed on the dimension it answers. The Competition paragraph in Item 1 of the FY2025 10-K names no company. It describes competition for users, for marketer budgets and for developers, and adds competition in the development and application of AI, particularly frontier models, and in consumer hardware and augmented and virtual reality (accession 0001628280-26-003942). Item 1A of the same filing names Apple and Google as mobile operating system and browser providers whose product changes limit Meta's ability to target and measure advertising, and TikTok as a competing service that has reduced some users' engagement with Meta's products.
The comparator set
Three tests admit a name. First, Meta names it in its own filings. Second, it reports an advertising revenue line and bids for the same marketer budget. Third, it reports capital expenditure of the same order as Meta's on the AI infrastructure Meta says its computing needs now require. Every name in Table 4.1 meets at least one test, and the table states which.
Table 4.1 The comparator set and the basis for each name
| Company | Dimension | Basis for inclusion |
|---|---|---|
| Alphabet | Digital advertising; AI infrastructure | Named in Meta's FY2025 10-K Item 1A as a mobile operating system and browser provider that has integrated competitive products with Android and proposed phasing out third party cookies in Chrome. Reports Google advertising revenue of $294.69 billion for FY2025. |
| Apple | Hardware and XR; platform control | Named in the same Item 1A for iOS changes that limit ad targeting and measurement, for Safari third party cookie limits, and as expanding its own advertising business. Reports Wearables, Home and Accessories net sales of $35.69 billion for FY2025 against Reality Labs revenue of $2.21 billion. |
| Amazon.com | Digital advertising; AI infrastructure | Reports advertising services revenue of $68.64 billion for FY2025, the third largest advertising line disclosed in this set, and capital expenditure of $131.82 billion. |
| Microsoft | AI infrastructure; frontier AI models | Meta states it competes in the development of frontier AI models. Microsoft reports capital expenditure of $115.95 billion for the year to 30 June 2026 and search and news advertising revenue of $15.18 billion. |
| Snap | Social platforms; advertising | Advertising funded social platform reporting advertising revenue of $5.19 billion for FY2025, 87.4% of its total revenue. |
| Social platforms; advertising | Advertising funded platform reporting revenue of $4.22 billion for FY2025 on a single revenue line described as generated from advertising. | |
| Social platforms; advertising | Advertising funded social platform reporting advertising revenue of $2.06 billion for FY2025, 93.6% of its total revenue, grown 74.0% on FY2024. |
Source: each registrant's own Form 10-K and Form 10-Q, through the SEC-API.io MCP server. Accession numbers are in the Sources appendix.
Three candidates were considered and left out. ByteDance, the owner of TikTok, is the one competitor Meta names by product as having reduced engagement with its own services, and it files no periodic reports with the SEC and has no listed equity, so it carries no comparable financial statement and no price; it appears in the competitive discussion below and in no table. X Corp is private on the same grounds. Semiconductor and server makers were considered on the AI infrastructure dimension: Meta's 10-K describes the processing hardware its AI work depends on as third party equipment whose availability and pricing it does not control, which places those makers on the supply side of the capital expenditure programme set out below. They report no share of the advertising revenue in Figure 4.3, so they sit outside the set.
Like for like
Market values in Table 4.2 are struck on the closing prices of 4 September 2026, the as of date this report fixes for every price it prints. META closed at $616.77 that day, which on the 2,547,506,225 Class A and Class B shares stated on the cover of its Form 10-Q for the quarter to 30 June 2026 is a market value of $1,571.2 billion.
Table 4.2 Scale, growth, margin, returns, leverage and valuation, latest reported fiscal year
| Company | Fiscal period | Revenue ($m) | Revenue growth | Gross margin | Operating margin | Return on capital | Net cash (borrowings) ($m) | Market value ($bn) | Market value / operating income |
|---|---|---|---|---|---|---|---|---|---|
| Meta Platforms | FY2025, to 31 Dec 2025 | 200,966 | 22.2% | 82.0% | 41.4% | 25.7% | 22,848 | 1,571.2 | 18.9 |
| Alphabet | FY2025, to 31 Dec 2025 | 402,836 | 15.1% | 59.7% | 32.0% | 26.2% | 80,296 | 4,139.4 | 32.1 |
| Microsoft | FY2026, to 30 Jun 2026 | 331,839 | 17.8% | 67.9% | 46.8% | 26.3% | 36,549 | 3,710.5 | 23.9 |
| Amazon.com | FY2025, to 31 Dec 2025 | 716,924 | 12.4% | n/a | 11.2% | 13.3% | 57,381 | 2,788.4 | 34.9 |
| Apple | FY2025, to 27 Sep 2025 | 416,161 | 6.4% | 46.9% | 32.0% | 68.7% | (43,960) | 4,669.7 | 35.1 |
| FY2025, to 31 Dec 2025 | 2,203 | 69.4% | 91.2% | 20.1% | 14.9% | 2,477 | 29.7 | 67.2 | |
| FY2025, to 31 Dec 2025 | 4,222 | 15.8% | 80.1% | 7.6% | 6.4% | 2,467 | 11.6 | 36.1 | |
| Snap | FY2025, to 31 Dec 2025 | 5,931 | 10.6% | 55.0% | (9.0%) | (8.3%) | (596) | 9.3 | n/a |
Return on capital is income from operations divided by total assets less current liabilities at the fiscal year end, before tax, on the same definition for every name. Net cash is cash and equivalents plus short term investments less borrowings, with operating and finance lease liabilities excluded throughout. Share counts are every class of common stock outstanding on each registrant's latest cover page. Amazon's gross margin reads n/a: its cost of sales line excludes fulfilment, technology and infrastructure, and marketing, so the same arithmetic produces a different measure from the one it produces for the other seven names. Snap's valuation line reads n/a because it reported a loss from operations. Apple's net borrowings figure sits against $77.72 billion of noncurrent marketable securities that this definition of net cash excludes.
The valuation line is struck on income from operations. Alphabet reported FY2025 net income of $132.17 billion against income from operations of $129.04 billion, and net income of $174.77 billion for the six months to 30 June 2026 against income from operations of $80.47 billion, with the difference in nonoperating items. Meta reported FY2025 net income of $60.46 billion against income from operations of $83.28 billion, after a tax charge of $25.47 billion. A price to earnings line across the set would carry both of those effects.
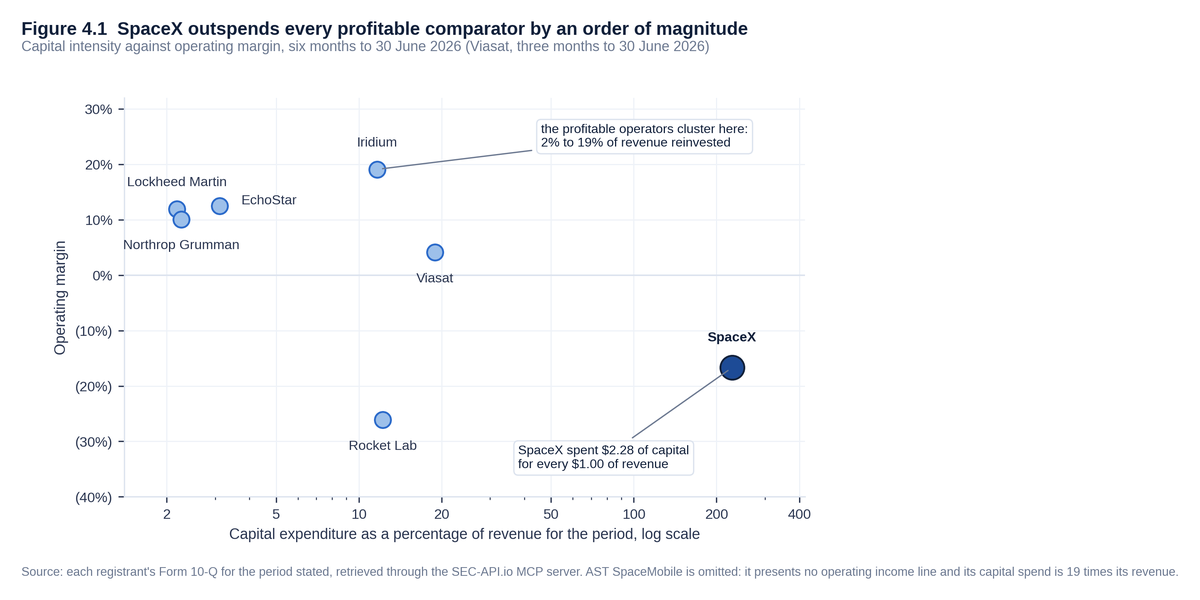
Meta's FY2025 operating margin of 41.4% is the second highest in the set behind Microsoft at 46.8%, and its revenue growth of 22.2% is the highest of the four largest names by revenue. Return on capital lands at 25.7%, within a point of Alphabet at 26.2% and Microsoft at 26.3%, and below Apple at 68.7%, which carries $73.73 billion of equity against $359.24 billion of assets. Inside the group figure, Family of Apps earned income from operations of $102.47 billion on revenue of $198.76 billion in FY2025, a margin of 51.6%, and Reality Labs lost $19.19 billion on revenue of $2.21 billion. Figure 4.1 places the eight names on growth and margin.

Apple, the comparator on the hardware and XR dimension, reported Wearables, Home and Accessories net sales of $35.69 billion in FY2025, sixteen times Reality Labs revenue, inside a company whose income from operations was $133.05 billion. Chapter 1 carries the Reality Labs loss record and the stated 2026 split of its operating expenses.
The AI infrastructure build across the peer group
Table 4.3 The latest filed period for each registrant
| Company | Period | Revenue ($m) | Revenue growth | Operating margin | Capital expenditure ($m) | Capex growth |
|---|---|---|---|---|---|---|
| Meta Platforms | Six months to 30 Jun 2026 | 117,111 | 30.4% | 35.6% | 49,113 | 67% |
| Alphabet | Six months to 30 Jun 2026 | 229,692 | 23.1% | 35.0% | 80,598 | 103% |
| Microsoft | Year to 30 Jun 2026 | 331,839 | 17.8% | 46.8% | 115,948 | n/a |
| Amazon.com | Six months to 30 Jun 2026 | 382,125 | 18.2% | 13.4% | 98,411 | 72% |
| Apple | Nine months to 27 Jun 2026 | 364,357 | 16.2% | 33.6% | 6,799 | (28%) |
| Six months to 30 Jun 2026 | 1,468 | 64.6% | 28.2% | 2 | 50% | |
| Six months to 30 Jun 2026 | 2,187 | 18.0% | (6.2%) | 39 | 115% | |
| Snap | Six months to 30 Jun 2026 | 3,128 | 15.5% | (7.8%) | 96 | (5%) |
Capital expenditure is purchases of property and equipment as reported in each cash flow statement. Microsoft's fiscal year ended on 30 June 2026, so its latest filed period is that year and no half year growth rate applies to it. Capex growth compares each period with the same period of the prior year.
Amazon, Microsoft, Alphabet and Meta together spent $408.9 billion on property and equipment in their latest reported fiscal years. In the six months to 30 June 2026 alone, Amazon spent $98.41 billion, Alphabet $80.60 billion and Meta $49.11 billion, increases of 72%, 103% and 67% on the same six months of 2025. Apple spent $6.80 billion in its nine months to 27 June 2026, 28% below the prior year period. Snap, Pinterest and Reddit together spent $138 million in their six months. Figure 4.2 sets those amounts against revenue.

Meta's capital intensity is the highest in the set on the latest filed period, at 41.9% of revenue for the six months to 30 June 2026, against 35.1% at Alphabet and 25.8% at Amazon over the same six months and 34.9% at Microsoft for its year to 30 June 2026. Snap spent 3.1% of revenue on property and equipment in the six months to 30 June 2026, Pinterest 1.8% and Reddit 0.2%. Meta's 2026 outlook of $130 billion to $145 billion, against $69.69 billion of purchases of property and equipment in FY2025, is funded from the cash, debt and commitments chapter 2 sets out.
The digital advertising market as the filings describe it
The seven registrants in this set that report an advertising line disclosed $586.1 billion of advertising revenue in their latest reported fiscal years. Alphabet's Google advertising revenue of $294.69 billion is 50.3% of that total, Meta's Family of Apps advertising revenue of $196.18 billion is 33.5%, Amazon's advertising services revenue of $68.64 billion is 11.7%, and the remaining four names together are 4.5%. These shares are computed on the advertising revenue disclosed by this group of registrants.

Meta's advertising revenue grew 22.1% in FY2025 and Amazon's advertising services grew 22.1%, against 11.4% at Alphabet and 9.4% at Microsoft's search and news advertising line for the year to 30 June 2026. Reddit grew 74.0% from a base of $1.19 billion and Snap grew 5.8%. Apple's FY2025 10-K disaggregates net sales into iPhone, Mac, iPad, Wearables, Home and Accessories, and Services, so no advertising caption from Apple enters the comparison; Meta's own risk factors state that Apple has been expanding its advertising business while making changes to iOS that limit advertising targeting and measurement.
Pinterest reports a single revenue line and describes that revenue as generated from advertising, so its total revenue stands where an advertising caption sits for the others. Its FY2025 growth of 15.8% came with an operating margin of 7.6%, and it reported a loss from operations of $135 million in the six months to 30 June 2026 against a loss of $40 million a year earlier.
Competition and regulation as Meta describes them
Meta's FY2025 10-K sets out the competitive pressures in its own terms. Mobile operating system and browser providers, named as Apple and Google, have implemented product changes that limit the ability of websites and application developers to collect and use the signals Meta uses to target and measure advertising; the filing states that Meta's advertising revenue has been negatively affected by marketer reaction to the targeting and measurement challenges associated with the iOS changes that began in 2021. It states that each of Apple and Google has integrated competitive products with iOS and Android, that Apple limited third party cookies in Safari, and that Google previously proposed phasing out third party cookies in Chrome. On users, it states that engagement is affected by competitive products and services such as TikTok, which have reduced some users' engagement with Meta's products.
On AI, the filing states that Meta faces significant competition from other companies developing AI features and technologies, including technologies that may be similar or superior or more cost effective to develop and deploy, and that its ability to develop and deploy AI depends on access to third party processing hardware, network capacity, models, computing power and the related energy requirements, whose availability and pricing it states it cannot control. On hardware, it states that Meta has relatively limited experience with consumer hardware products and virtual and augmented reality technology, and that third party mobile platforms do not necessarily give Meta's consumer hardware products the same interoperability they give their own competing products.
The same filing names the regulatory actions and regimes that apply to the business. Meta states that it became subject in 2020 to a lawsuit by the Federal Trade Commission alleging antitrust violations including the acquisitions of Instagram in 2012 and WhatsApp in 2014, with the complaint seeking a permanent injunction and other equitable relief including divestiture or reconstruction of Instagram and WhatsApp. It states that in November 2024 the European Commission issued a fine on a finding that Meta tied Facebook Marketplace to Facebook and used data in a manner infringing European Union competition rules. It names the Digital Markets Act, whose key requirements have been enforceable against designated gatekeeper companies since March 2024 and which imposes restrictions on the combination of data across services, on mergers and acquisitions and on product design; the Digital Services Act, which has applied to Meta since August 2023; the UK Online Safety Act; the EU AI Act; and the UK Digital Markets, Competition and Consumer Act. It names laws in Arkansas, California, Colorado, Florida, New York, Texas and Utah restricting the services Meta can offer to minors without parental consent, and Australian legislation requiring certain social media companies to take reasonable steps to prevent account holding by users under 16.
Filing data in this chapter comes through the SEC-API.io MCP server. Market prices carry no named provider.
5 Material Events & Contracts
Meta filed eleven current reports on Form 8-K in the twelve months to 6 September 2026. Four carried quarterly or annual results, two carried completed note offerings that between them raised $55.00 billion of principal, three concerned directors and officers, one the annual meeting vote, and one a Delaware settlement stipulation distributed to stockholders as an exhibit. The most recent, filed 29 July 2026 under Items 2.02 and 9.01, carried the second quarter 2026 results. Meta filed no Form 6-K; it reports as a domestic issuer.
Table 5.1 Current reports on Form 8-K, twelve months to 6 September 2026
| Filed | Period | Items | What the filing says | Accession |
|---|---|---|---|---|
| 2026-07-29 | 2026-07-29 | 2.02, 9.01 | Exhibit 99.1 reports Q2 2026 revenue of $60.80 billion (up 28%), costs and expenses of $42.03 billion (up 55%) including $2.40 billion of legal charges and $1.18 billion of severance, operating income of $18.78 billion at a 31% margin, diluted EPS of $6.18, capital expenditure including finance lease principal of $31.08 billion, free cash flow of $784m and headcount of 75,472. Q3 2026 revenue guided to $61 billion to $64 billion. | 0001628280-26-050596 |
| 2026-05-29 | 2026-05-27 | 5.07 | Holders of 92.19% of combined voting power were present. All twelve directors were elected; Ernst & Young LLP was ratified with 5,148,139,817 votes for and 29,583,257 against; all ten shareholder proposals failed, the highest support being 1,347,044,885 for an annual vote on executive pay against 3,615,585,963 opposed, and 1,312,681,056 for ending the dual class structure against 3,647,675,248 opposed. | 0001628280-26-039193 |
| 2026-05-04 | 2026-04-30 | 8.01, 9.01 | Completion of a $25.00 billion offering of senior notes in six series, from 4.550% due 2031 to 6.450% due 2066, under registration statement 333-295425. Filed the Underwriting Agreement dated 30 April 2026 (Ex 1.1), the Fifth Supplemental Indenture dated 4 May 2026 (Ex 4.1), the forms of note (Ex 4.2 to 4.7) and a legal opinion (Ex 5.1). | 0001193125-26-204128 |
| 2026-04-29 | 2026-04-29 | 2.02, 9.01 | Exhibit 99.1 reports Q1 2026 revenue of $56.31 billion (up 33%), operating income of $22.87 billion at a 41% margin, net income of $26.77 billion and diluted EPS of $10.44 after an $8.03 billion tax benefit from U.S. Treasury Notice 2026-7, an effective tax rate of (23)%, and capital expenditure of $19.84 billion. | 0001628280-26-028364 |
| 2026-04-14 | 2026-04-08 | 5.02 | Hock E. Tan and Tracey T. Travis notified the company that they would not stand for reelection at the 2026 annual meeting, and continued as directors until that meeting. | 0001628280-26-025108 |
| 2026-01-28 | 2026-01-28 | 2.02, 9.01 | Exhibit 99.1 reports FY2025 revenue of $200.97 billion (up 22%), operating income of $83.28 billion at a 41% margin, net income of $60.46 billion, diluted EPS of $23.49 and an effective tax rate of 30%; Q4 revenue was $59.89 billion. Capital expenditure for 2026 was guided to $115 billion to $135 billion and full year expenses to $162 billion to $169 billion. | 0001628280-26-003832 |
| 2026-01-16 | 2026-01-12 | 5.02 | Dina Powell McCormick was appointed President and Vice Chairman effective 12 January 2026, on a base salary of $1,000,000, a one time cash sign on bonus of $2,000,000, a bonus target of 200% of salary, and restricted stock units with an initial value of $60,000,000 vesting quarterly over four years from 15 May 2026. | 0001628280-26-002429 |
| 2025-12-19 | 2025-12-19 | 5.02 | Dina Powell McCormick resigned as a director with immediate effect. | 0001628280-25-058337 |
| 2025-12-12 | 2025-12-05 | 8.01, 9.01 | The Delaware Court of Chancery entered a scheduling order setting a settlement hearing for 1:30 pm ET on 7 April 2026 in In re Facebook Inc. Derivative Litigation, and required the settlement stipulation (Ex 99.1) and the notice to stockholders (Ex 99.2) to be distributed in the form of this report. | 0001628280-25-056768 |
| 2025-11-03 | 2025-10-30 | 8.01, 9.01 | Completion of a $30.00 billion offering of senior notes in six series, from 4.200% due 2030 to 5.750% due 2065, under registration statement 333-271535. Filed the Underwriting Agreement dated 30 October 2025 (Ex 1.1), the Fourth Supplemental Indenture dated 3 November 2025 (Ex 4.1), the forms of note (Ex 4.2 to 4.7) and a legal opinion (Ex 5.1). | 0001193125-25-262593 |
| 2025-10-29 | 2025-10-29 | 2.02, 9.01 | Exhibit 99.1 reports Q3 2025 revenue of $51.24 billion (up 26%), operating income of $20.54 billion at a 40% margin, and net income of $2.71 billion with diluted EPS of $1.05 after a one time noncash income tax charge of $15.93 billion on enactment of the One Big Beautiful Bill Act; headcount was 78,450. | 0001628280-25-047114 |
Material contracts
Seven contracts are set out below, each row of the register naming the exhibit that was retrieved and read.
Table 5.2 Material contracts register
| Contract and exhibit | Counterparty | What it covers | Term | Filed with |
|---|---|---|---|---|
| Underwriting Agreement dated April 30, 2026 (Ex 1.1) | Citigroup Global Markets Inc. and Morgan Stanley & Co. LLC, as representatives of the underwriters | Purchase of $25.00 billion of senior unsecured notes in six series for resale | Signed 30 Apr 2026, closed 4 May 2026; expense and indemnity clauses survive termination | 8-K, 0001193125-26-204128 |
| Fifth Supplemental Indenture dated May 4, 2026 (Ex 4.1) | U.S. Bank Trust Company, National Association, as trustee | Creates six series of notes, 4.550% to 6.450%, maturing 2031 to 2066 | 4 May 2026 to final maturity 15 May 2066 | 8-K, 0001193125-26-204128 |
| Underwriting Agreement dated October 30, 2025 (Ex 1.1) | Citigroup Global Markets Inc. and Morgan Stanley & Co. LLC, as representatives of the underwriters | Purchase of $30.00 billion of senior unsecured notes in six series for resale | Signed 30 Oct 2025, closed 3 Nov 2025; expense and indemnity clauses survive termination | 8-K, 0001193125-25-262593 |
| Fourth Supplemental Indenture dated November 3, 2025 (Ex 4.1) | U.S. Bank Trust Company, National Association, as trustee | Creates six series of notes, 4.200% to 5.750%, maturing 2030 to 2065 | 3 Nov 2025 to final maturity 15 Nov 2065 | 8-K, 0001193125-25-262593 |
| Indenture dated as of August 9, 2022 (Ex 4.1), listed as Exhibit 4.3 to the FY2025 Form 10-K | U.S. Bank Trust Company, National Association, as trustee | Master terms for every series of notes, including the merger covenant, the reporting covenant and the events of default | Open ended; governs while any series is outstanding | 8-K, 0000950103-22-013830 |
| Stipulation and Agreement of Settlement, Compromise, and Release (Ex 99.1) | Six stockholder plaintiffs, eleven individual defendants, and Meta as nominal defendant | $190,000,000 paid by insurers to Meta plus four sets of governance measures, in exchange for release of the derivative claims | Entered into 20 Nov 2025; governance measures due within 90 business days of the Effective Date | 8-K, 0001628280-25-056768 |
| Amended and Restated Meta Platforms, Inc. Bonus Plan (Ex 10.4) | Participating full time and part time regular nonsales employees | Semiannual cash bonus, formula driven, unfunded and unsecured | Effective 1 Jan 2026; each Term is one calendar year; the company may terminate at any time | 10-K, 0001628280-26-003942 |
The two note offerings
Both offerings work the same way. An underwriting agreement obliges named banks to buy the whole issue from Meta at a fixed price and resell it; a supplemental indenture then creates the series and fixes their terms; and the base indenture of 9 August 2022 supplies the covenants and the default machinery for all of them.
Table 5.3 Terms of the twelve series, as filed in Schedule I and the supplemental indentures
| Series | Coupon, % | Maturity | Principal, USD billion | Price paid to Meta, % of principal | Par call date | Redemption spread over the Treasury Rate, basis points |
|---|---|---|---|---|---|---|
| 4.550% Senior Notes due 2031 | 4.550 | 15 May 2031 | 3.00 | 99.865 | 15 Apr 2031 | 10 |
| 4.875% Senior Notes due 2033 | 4.875 | 15 May 2033 | 2.00 | 99.813 | 15 Mar 2033 | 15 |
| 5.250% Senior Notes due 2036 | 5.250 | 15 May 2036 | 6.00 | 99.520 | 15 Feb 2036 | 15 |
| 6.200% Senior Notes due 2046 | 6.200 | 15 May 2046 | 4.00 | 99.686 | 15 Nov 2045 | 20 |
| 6.300% Senior Notes due 2056 | 6.300 | 15 May 2056 | 6.00 | 99.463 | 15 Nov 2055 | 20 |
| 6.450% Senior Notes due 2066 | 6.450 | 15 May 2066 | 4.00 | 99.454 | 15 Nov 2065 | 25 |
| 4.200% Senior Notes due 2030 | 4.200 | 15 Nov 2030 | 4.00 | 99.762 | 15 Oct 2030 | 10 |
| 4.600% Senior Notes due 2032 | 4.600 | 15 Nov 2032 | 4.00 | 99.842 | 15 Sep 2032 | 15 |
| 4.875% Senior Notes due 2035 | 4.875 | 15 Nov 2035 | 6.50 | 99.782 | 15 Aug 2035 | 15 |
| 5.500% Senior Notes due 2045 | 5.500 | 15 Nov 2045 | 4.50 | 99.517 | 15 May 2045 | 15 |
| 5.625% Senior Notes due 2055 | 5.625 | 15 Nov 2055 | 6.50 | 99.424 | 15 May 2055 | 15 |
| 5.750% Senior Notes due 2065 | 5.750 | 15 Nov 2065 | 4.50 | 99.488 | 15 May 2065 | 20 |
The first six series are the May 2026 issue, accession 0001193125-26-204128. The last six are the November 2025 issue, accession 0001193125-25-262593.

The May 2026 coupons sit above the November 2025 coupons at every matched tenor, by 35 basis points at the five year point and 70 basis points at the forty year point, with the six matched steps spanning 27.5 to 70 basis points. Principal weighted, the November 2025 issue carries a 5.136% coupon and the May 2026 issue 5.732%.
In each agreement the underwriters buy at a stated percentage of principal set out in Schedule I, from 99.424 to 99.865 across the twelve series, plus accrued interest from the closing date. Meta pays the registration, printing, listing, rating agency, trustee, transfer agent and road show costs, including, as the May 2026 agreement puts it, expenses of "travel and lodging expenses of the representatives and officers of the Company"; the underwriters pay their own counsel and any advertising of their own. Interest on all twelve series is payable on 15 May and 15 November, computed on a 360 day year of twelve 30 day months, and the notes are issued in denominations of $2,000 and integral multiples of $1,000 above that.
Closing was conditioned on legal opinions from Davis Polk & Wardwell LLP for Meta and Skadden, Arps, Slate, Meagher & Flom LLP for the underwriters, an officer certificate, and comfort letters from E&Y using a cut off date no more than three days before closing. Between signing and closing Meta agreed not to offer, sell, contract to sell or otherwise dispose of debt securities of its own substantially similar to the notes, other than with the prior written consent of the representatives.
The representatives may walk away before closing on any of five triggers, the broadest being that "there shall have occurred any outbreak or escalation of hostilities, or any change in financial markets or any calamity or crisis that, in the Representatives’ judgment, is material and adverse and which, singly or together with any other event specified in this clause (v), makes it, in the Representatives’ judgment, impracticable or inadvisable to proceed with the offer, sale or delivery of the Securities on the terms and in the manner contemplated in the Time of Sale Prospectus or the Prospectus" (accession 0001193125-26-204128). A fee falls due to the banks on only one of those routes. If the underwriters terminate because Meta failed to comply with the terms or conditions, Meta reimburses them "for all out-of-pocket expenses (including the fees and disbursements of their counsel) reasonably incurred by such Underwriters in connection with this Agreement or the offering contemplated hereunder"; termination for market disruption, a settlement failure, a banking moratorium or the hostilities clause carries no such reimbursement. If underwriters holding more than a tenth of the issue default and substitutes are not found within 36 hours, "this Agreement shall terminate without liability on the part of any non-defaulting Underwriter or the Company"; below that threshold the others must take up the shortfall, capped at one ninth of their own allocation.
The noteholders took securities with no repayment right of their own. Each series is redeemable at Meta's option at the higher of par and the present value of the remaining payments discounted at the Treasury Rate plus the spread in Table 5.3, and on or after the par call date at "100% of the principal amount of the 2031 Notes to be redeemed, plus, in each case, accrued and unpaid interest to, but excluding, the Redemption Date". The filed terms state that "The 2031 Notes will not be subject to any sinking fund", and no change of control put appears in either supplemental indenture. The base indenture of 9 August 2022 sets no leverage, coverage, lien or sale and leaseback limit. Its one balance sheet restraint is on reorganisation: "The Company shall not consolidate with or merge into, or convey, transfer or lease all or substantially all of its properties and assets to, any Person", unless the successor assumes the notes and no default is then continuing (accession 0000950103-22-013830). A breach of any other covenant becomes an event of default only if it "continues uncured for a period of 90 days after there has been given, by registered or certified mail, to the Company by the Trustee or to the Company and the Trustee by the Holders of at least 25% in principal amount of the outstanding Securities of that Series a written notice specifying such default or breach and requiring it to be remedied". Amendments and waivers need holders of a majority in principal amount of each affected series.

Aggregate principal outstanding moved from $29.0 billion at 31 December 2024 to $59.0 billion at 31 December 2025 and $84.0 billion at 30 June 2026. Future interest payment obligations at 30 June 2026 were $4.40 billion short term and $84.98 billion long term, against $2.98 billion and $56.74 billion at 31 December 2025 (accessions 0001628280-26-050705 and 0001628280-26-003942).
Data centre leases and infrastructure commitments
Meta files no exhibit for its data centre leases or its infrastructure purchase agreements. It states them in aggregate in the liquidity section of each report, and the aggregate has risen at each of the last four reporting dates, from $34.12 billion of leases signed and not yet commenced and $32.82 billion of noncancelable contractual commitments at 31 December 2024 to $278.99 billion and $349.31 billion at 30 June 2026 (accessions 0001628280-26-003942 and 0001628280-26-050705). Chapter 2 carries the period by period figures.

The leases not yet commenced at 30 June 2026 are for data centres, colocations and network infrastructure, commencing between the remainder of 2026 and 2036 with terms of greater than one year to 30 years. Both figures exclude the leases signed after the quarter end: "In July 2026, we entered into additional data center leases with lease obligations of approximately $68 billion, which are expected to commence in 2027 and 2028, with lease terms of 18 to 20 years."
The reports disclose three further features of these arrangements. The first quarter 2026 report states that "In April 2026, we entered into additional multi-year infrastructure contracts, related to which our non-cancelable contractual commitments increased by approximately $24 billion" (accession 0001628280-26-028526). Some counterparties require money to be posted in advance, and $10.80 billion of money market funds was reclassified as restricted cash equivalents at 30 June 2026 under escrow requirements in multiyear infrastructure purchase agreements. And one cloud arrangement can shrink: at 30 June 2026 Meta had "contingent obligations to purchase up to $14.72 billion of cloud capacity over a five-year period, which may be reduced if the cloud service provider is able to sell such capacity to other customers" (accession 0001628280-26-050705). The counterparties are not named in the filings, and the reports state that for agreements with variable terms Meta does not estimate the total obligation beyond minimum quantities or pricing.
The derivative settlement
The stipulation attached to the 8-K of 12 December 2025 settles In re Facebook Inc. Derivative Litigation, Consolidated C.A. No. 2018-0307-KSJM in the Delaware Court of Chancery, a stockholder action brought on Meta's behalf against eleven current and former directors and officers over the company's historical privacy practices and the 2019 settlement with the Federal Trade Commission. Meta is the nominal defendant and receives the money, so the contract puts cash into the company. It was made and entered into as of 20 November 2025 among six plaintiffs, led by the California State Teachers' Retirement System, the Construction and General Building Laborers' Local Union No. 79 General Fund and the City of Birmingham Retirement and Relief System.
The consideration is "a monetary payment of one-hundred-and-ninety million United States dollars ($190,000,000) to be paid or caused to be paid by Defendants to Meta as part of the consideration for the Settlement" (accession 0001628280-25-056768). The stipulation directs Defendants to cause the Insurers to make that payment. That sum is capped: "The Monetary Settlement Amount is an all-in settlement number, meaning that it includes not only amounts to resolve claims and allegations in the Action but also all attorneys’ fees and expenses awarded to Plaintiffs’ Counsel." Plaintiffs' counsel may seek fees of no more than 30% of $190,000,000, expenses of no more than $4,800,000 and incentive awards of no more than $20,000 for each co lead plaintiff, the incentive awards payable out of the fee and expense award. Paragraph 22 also records that plaintiffs reserve the right to seek reimbursement of reasonable expenses in addition to a fee award of up to 30% of the monetary settlement amount, so at the fee cap alone $133,000,000 reaches Meta, and $128,200,000 if expenses are awarded at their cap on top of it.
The stipulation also requires governance changes. "Within ninety (90) Business Days after the Effective Date, Meta will undertake the corporate governance measures" set out in Exhibit A: whistleblower reporting language covering privacy violations, with quarterly summaries of identified privacy issues to a designated board committee; a separate director code of conduct; an amendment to the Director Conflicts of Interest Policy removing Mark Zuckerberg's decision making authority over potential director conflicts and passing it to the Lead Independent Director with escalation to the Compensation, Nominating and Governance Committee; and a change to executive trading plans, under which "All 10b5-1 trading plans under Meta’s 10b5-1 Trading Plan Policy for executive officers shall be subject to the approval or ratification of the CLO or CLO’s designee before any stock sales contemplated by such plans may be effectuated, and any such trading plan may only be terminated early or modified (as defined in Meta’s 10b5-1 Trading Plan Policy) once per year."
Either side could terminate within five business days if the court declined to enter the scheduling order or the judgment in any material respect, or modified or reversed the judgment; a change to the fee award alone was defined not to be such a modification. On termination the insurers get the money back, proceedings revert to their status as at 9:00 a.m. ET on 17 July 2025, and the releases are void. The defendants deny liability and the stipulation records no admission of wrongdoing. The court approved the settlement: the first quarter 2026 report states that the parties agreed a settlement in principle on 17 July 2025, "which was approved by the court in April 2026" (accession 0001628280-26-028526).
Compensation contracts and the absence of a credit facility
The only Exhibit 10 filed with the FY2025 Form 10-K is the Amended and Restated Bonus Plan effective 1 January 2026. It pays a semiannual cash bonus calculated as base eligible earnings multiplied by a corporate bonus percentage, an individual performance percentage and a company performance percentage, with the company percentage set in the sole discretion of the Compensation, Nominating and Governance Committee or the board. For executive officers and Section 16 officers the individual factor drops out and the bonus is calculated on the company performance percentage alone. Payment falls typically by 30 September for the January to June period and by 31 March of the following year for the July to December period, and payment is conditional on still being employed: "One of the key purposes of this Plan is to encourage employee retention through and until the date(s) bonuses under this Plan are paid." Bonuses are "an unfunded and unsecured obligation of the Company", the plan is governed by California law, and "The Company reserves the right to modify, suspend or terminate all or any portion of this Plan at any time, provided that any early termination and material modification to the Plan shall be approved by the Plan Administrator or the Board" (accession 0001628280-26-003942).
The one individual arrangement disclosed in the period is Dina Powell McCormick's, set out in the 8-K of 16 January 2026 and summarised in Table 5.1. It carries a severance term: on termination without cause or for good reason before the second anniversary of 12 January 2026, and subject to a release of claims, she "will receive a lump sum cash payment equal to the value of the unvested portion of the Existing Equity Award that would have vested prior to the second anniversary of the Start Date" (accession 0001628280-26-002429).
Meta's filings disclose no bank credit facility in place. The FY2025 Form 10-K states that "Our principal sources of liquidity are our cash, cash equivalents, marketable securities, and cash generated from operations", and the exhibit index at Part IV Item 15 lists no credit agreement among the contracts filed or incorporated by reference. The liquidity sections of the 2026 quarterly reports name the same sources. The last facility on the filing record is in Note 11 of the FY2020 Form 10-K: a $2.00 billion senior unsecured revolving credit facility entered into in May 2016, never drawn, and terminated on 24 December 2020 (accession 0001326801-21-000014). In Meta's filings since that date the words credit facility and credit agreement appear only in the representation and warranty language inside the underwriting agreements for the note offerings. Undrawn bank capacity therefore forms no part of the funding for the $130 billion to $145 billion of 2026 capital expenditure guided in the earnings release of 29 July 2026.
6 Ownership, Voting Power & Annual Meeting
Meta Platforms, Inc. had 2,205,128,509 Class A shares and 342,377,716 Class B shares outstanding on 24 July 2026, the count on the cover of the 10-Q for the quarter to 30 June 2026 (0001628280-26-050705). Class B is 13.4% of those shares and 60.8% of the combined vote. At the 1 April 2026 record date for the annual meeting, Mark Zuckerberg beneficially owned 639,347 Class A shares and 341,823,978 Class B shares, which is 13.5% of all shares and 60.8% of the combined voting power (0001628280-26-025532). At the meeting held on 27 May 2026 the board carried both of its own items, and all ten shareholder proposals were defeated (0001628280-26-039193).
The two classes
Article IV, section 3.2 of the Amended & Restated Certificate of Incorporation gives each Class A share one vote and each Class B share ten votes (Exhibit 3.1 to the 10-Q filed 1 August 2024, 0001326801-24-000069). Section 3.3 requires the two classes to be treated equally and ratably per share on dividends and distributions, and allows a disparate dividend only with the advance approval of a majority of each class voting separately. The charter authorises 5,000,000,000 Class A shares, 4,141,000,000 Class B shares and 100,000,000 preferred shares, each at $0.000006 par.
Section 3.8 sets out how Class B converts into Class A. A holder may convert voluntarily at any time on written notice. Conversion is automatic on any Transfer other than a Permitted Transfer. Section 4.8 restricts Permitted Transfers to family members, permitted entities and permitted trusts of a qualified stockholder, and to a 501(c)(3) organisation provided that the recipient elects irrevocably, no later than the transfer, that the shares convert into Class A on the death of the qualified stockholder or of the grantor behind it. All Class B shares also convert automatically at a date, time or event fixed by the affirmative vote of a majority of the outstanding Class B shares voting as a separate class.
Article IV carries no date trigger, no anniversary trigger and no ownership trigger that ends the ten vote class, and neither does the description of the capital structure in the FY2025 10-K (0001628280-26-003942) or in the 2026 proxy statement. Section 3.7 sets an ownership threshold over a separate matter: the Class B class vote on a Change in Control Transaction runs until the first date on which the outstanding Class B shares represent less than thirty five percent of the total voting power of the shares entitled to vote generally in the election of directors. Ten votes a share therefore continues until Class B holders convert or transfer their shares, or until a majority of the class votes to end it. The one conversion the charter links to a death applies to shares given to a charity under section 4.8(c).
The FY2025 10-K states that Class B holders control the outcome of matters submitted to stockholders so long as Class B represents at least 9.1% of all Class A and Class B shares. Class B sat above that level on 24 July 2026. Against the Class A count on that date, Class B could fall to 220,512,851 shares, a decline of 121,864,865 from where it stands, before the block lost a majority of the combined vote. The same 10-K states that Meta qualifies as a controlled company under the Nasdaq corporate governance rules and is therefore not obliged to have a majority independent board, a compensation committee or an independent nominating function. The 2026 proxy states that every director other than the chief executive is independent under SEC and Nasdaq rules, that each board committee is fully independent, and that Robert M. Kimmitt serves as Lead Independent Director.

Who holds what
Table 6.1 Beneficial ownership at 1 April 2026, economic stake and voting power
| Holder | Class A shares | Class B shares | % of Class A | % of Class B | % of all shares | % of combined voting power |
|---|---|---|---|---|---|---|
| Mark Zuckerberg | 639,347 | 341,823,978 | n/a | 99.8 | 13.5 | 60.8 |
| All current executive officers and directors as a group (20 persons) | 1,555,951 | 341,823,978 | n/a | 99.8 | 13.5 | 60.9 |
| Entities affiliated with BlackRock | 157,849,942 | n/a | 7.2 | n/a | 6.2 | 2.8 |
| Entities affiliated with FMR LLC | 134,555,687 | n/a | 6.1 | n/a | 5.3 | 2.4 |
The share counts, the class percentages and the voting power column are as filed in the 2026 proxy statement, accession 0001628280-26-025532. The proxy marks each holding below 1% with an asterisk in place of a figure, and those cells read n/a here. The percentage of all shares is computed from the 2,196,045,588 Class A and 342,377,716 Class B shares the same filing reports outstanding at that date. Every other named director and named executive officer holds Class A common stock only, each below 1%.
Footnote 2 to that table gives the record holders behind the Zuckerberg row: 639,347 Class A shares held by Chan Zuckerberg Biohub, Inc., over which he has sole voting and investment power and no pecuniary interest, and Class B shares held by The Mark Zuckerberg Trust dated July 7, 2006 (3,388,097), CZI Holdings, LLC (109,373,980), Chan Zuckerberg Holdings, LLC (17,061,801), CZI Holdings I, LLC (12,000,000), four further Chan Zuckerberg Holdings vehicles (50,000,000 each) and CZ Management, LLC (100). The 12,000,000 shares held by CZI Holdings I are pledged as collateral to secure certain indebtedness.
Table 6.2 Mark Zuckerberg's holding across three proxy statements
| Record date | Class A shares | Class B shares | % of Class B | % of all shares | % of combined voting power | Accession |
|---|---|---|---|---|---|---|
| 1 April 2026 | 639,347 | 341,823,978 | 99.8 | 13.5 | 60.8 | 0001628280-26-025532 |
| 1 April 2025 | 141,000 | 342,606,985 | 99.8 | 13.6 | 61.0 | 0001326801-25-000040 |
| 1 April 2024 | 958,000 | 344,515,496 | 99.7 | 13.6 | 61.0 | 0001326801-24-000034 |
Class B outstanding fell from 345,392,201 to 342,377,716 over the two years, and Class A outstanding moved from 2,191,141,974 to 2,196,045,588. Meta repurchased and retired 40 million Class A shares for $26.26 billion including excise taxes during 2025 (0001628280-26-003942).
The institutional register
For the quarter to 30 June 2026, 5,163 Form 13F-HR reports named CUSIP 30303M102, against 5,044 for the quarter to 30 September 2025. The count peaked at 5,285 for the quarter to 31 December 2025.

Table 6.3 Class A shares reported on Form 13F-HR, by manager and quarter
| Manager | Q3 2025 | Q4 2025 | Q1 2026 | Q2 2026 | % of Class A at Q2 2026 |
|---|---|---|---|---|---|
| BlackRock, Inc. | 167,495,652 | 171,505,090 | n/a | 173,396,976 | 7.9 |
| Vanguard Capital Management LLC | n/a | n/a | n/a | 143,440,997 | 6.5 |
| FMR LLC | 130,001,349 | 122,341,612 | 116,614,753 | 95,895,744 | 4.3 |
| State Street Corp | 86,445,582 | 90,841,345 | 88,523,840 | 92,033,963 | 4.2 |
| Geode Capital Management, LLC | 51,928,316 | 52,806,712 | 54,165,192 | 54,949,893 | 2.5 |
Share counts exclude option positions reported against the same CUSIP. The percentage column is measured against the 2,205,128,509 Class A shares on the 10-Q cover for 24 July 2026. Vanguard Capital Management LLC first reported the holding for the quarter to 31 March 2026, after the Vanguard internal realignment described below. BlackRock's holding for the quarter to 31 March 2026, reported on accession 0002012383-26-001841, is not carried here.
Those five managers reported 559,717,573 Class A shares between them at 30 June 2026, 25.4% of the Class A shares outstanding and 9.9% of the combined vote.
The proxy statement and the 13F register describe the same holders at different dates. The proxy's BlackRock row of 157,849,942 shares rests on a Schedule 13G/A filed on 12 February 2024, and its FMR row of 134,555,687 shares on a Schedule 13G/A filed on 7 April 2025 reporting a 29 December 2023 event date. The Form 13F-HR reports for the quarter to 30 June 2026 put BlackRock at 173,396,976 shares and FMR at 95,895,744.
Table 6.4 Schedules 13D and 13G naming Meta Platforms, Inc., two years to 6 September 2026
| Filed | Form | Filer | Event date | Shares | % of Class A | Sole voting power | Accession |
|---|---|---|---|---|---|---|---|
| 6 August 2026 | SC 13G/A | FMR LLC and Abigail P. Johnson | 30 June 2026 | 96,176,348 | 4.4 | 88,062,893 | 0000315066-26-002069 |
| 30 April 2026 | SC 13G | Vanguard Capital Management LLC | 31 March 2026 | 163,839,861 | 7.49 | 21,701,704 | 0002100119-26-000840 |
| 27 March 2026 | SC 13G/A | The Vanguard Group, Inc. | 13 March 2026 | 0 | 0.0 | 0 | 0000102909-26-001886 |
| 7 April 2025 | SC 13G/A | FMR LLC and Abigail P. Johnson | 29 December 2023 | 134,555,687 | 6.1 | 128,222,257 | 0000315066-25-001054 |
Percentages of Class A are as each filer states them on the cover page of its schedule. Those four filings are the whole of the Schedule 13D and 13G record for the two years, searched by CUSIP 30303M102 and by issuer name across the beneficial ownership filing index. No Schedule 13D naming Meta Platforms, Inc. as subject appears in that index at any date.
The Vanguard amendment of 27 March 2026 reports that The Vanguard Group, Inc. beneficially owned no Meta shares as of 13 March 2026 following an internal realignment on 12 January 2026, after which certain subsidiaries and business divisions report separately on a disaggregated basis. Vanguard Capital Management LLC then filed a new Schedule 13G on 30 April 2026 at 7.49% of Class A, with sole voting power over 21,701,704 of the 163,839,861 shares it reports. The FMR amendment of 6 August 2026 takes that holder below the 5% threshold. The 2026 proxy lists BlackRock and FMR as the only holders of more than 5% of either class, and states that as of the filing date no beneficial ownership reports on Meta common stock had been filed by Vanguard subsidiaries or business divisions.
The named holders in this chapter come from three places: the beneficial ownership table in the proxy statement, the Form 13F-HR reports filed against the CUSIP, and the Schedules 13D and 13G. Meta's private placement record consists of one Form D, filed on 20 October 2014 under Item 06b (0001168404-14-000008), and Form D names related persons of the issuer rather than purchasers.
The 2026 annual meeting
The meeting was held on 27 May 2026 by live audio webcast. Holders of 1,758,006,749 Class A shares and 342,307,492 Class B shares were present or represented by proxy, 92.19% of the combined voting power entitled to vote. The Class B shares present carried 3,423,074,920 votes, 66.1% of the 5,181,081,669 votes represented at the meeting.

Table 6.5 2026 annual meeting, results by proposal
| No. | Proposal | Proponent | Board | For | Against | Abstained | Broker nonvotes | Outcome |
|---|---|---|---|---|---|---|---|---|
| 2 | Ratification of Ernst & Young LLP as independent registered public accounting firm | Board | For | 5,148,139,817 | 29,583,257 | 3,810,576 | 0 | Carried |
| 3 | Report on AI data usage oversight | National Legal and Policy Center | Against | 503,719,383 | 4,446,931,952 | 18,025,751 | 212,856,564 | Not approved |
| 4 | Annual vote regarding executive pay | John Chevedden | Against | 1,347,044,885 | 3,615,585,963 | 6,046,238 | 212,856,564 | Not approved |
| 5 | Dual class capital structure | NorthStar Asset Management, Inc. Funded Pension Plan | Against | 1,312,681,056 | 3,647,675,248 | 8,320,782 | 212,856,564 | Not approved |
| 6 | Disclosure of voting results by share class | Treasurer for the State of Illinois, with Schroder International Selection Fund | Against | 998,846,306 | 3,963,963,497 | 5,867,283 | 212,856,564 | Not approved |
| 7 | Report on human rights due diligence | Azzad Asset Management, Inc. | Against | 205,947,302 | 4,728,098,574 | 34,631,210 | 212,856,564 | Not approved |
| 8 | Report on addressing antisemitism and hate in online platforms | JLens on behalf of the Leichtag Foundation | Against | 325,276,488 | 4,618,279,838 | 25,120,760 | 212,856,564 | Not approved |
| 9 | Report on climate change related commitments | As You Sow and the Board of Pensions of the Presbyterian Church (U.S.A.) | Against | 342,645,684 | 4,612,538,135 | 13,493,267 | 212,856,564 | Not approved |
| 10 | Report on integrating child safety improvements into executive compensation | Proxy Impact, with other proponents | Against | 169,180,929 | 4,776,963,503 | 22,532,654 | 212,856,564 | Not approved |
| 11 | Data protection impact assessment on generative AI chatbots | Mercy Investment Services, Inc., with other proponents | Against | 327,510,658 | 4,629,435,907 | 11,730,521 | 212,856,564 | Not approved |
| 12 | Report on risks of anti-American discrimination from H-1B visa programme use | National Center for Public Policy Research | Against | 11,628,532 | 4,943,493,011 | 13,555,543 | 212,856,564 | Not approved |
Vote tallies and outcomes are from the 8-K Item 5.07 filed 29 May 2026 (0001628280-26-039193). Proponents and board recommendations are from the proxy statement (0001628280-26-025532), which recommends a vote for proposals one and two and against each of proposals three through twelve.
Table 6.6 2026 annual meeting, election of directors
| Nominee | For | Withheld | Broker nonvotes |
|---|---|---|---|
| Peggy Alford | 4,291,140,639 | 677,536,447 | 212,856,564 |
| Marc L. Andreessen | 4,766,747,193 | 201,929,893 | 212,856,564 |
| John Arnold | 4,919,233,923 | 49,443,163 | 212,856,564 |
| Patrick Collison | 4,919,253,388 | 49,423,698 | 212,856,564 |
| John Elkann | 4,110,029,835 | 858,647,251 | 212,856,564 |
| Andrew W. Houston | 4,525,080,688 | 443,596,398 | 212,856,564 |
| Nancy Killefer | 4,834,303,472 | 134,373,614 | 212,856,564 |
| Robert M. Kimmitt | 4,826,084,255 | 142,592,831 | 212,856,564 |
| Charles Songhurst | 4,921,551,531 | 47,125,555 | 212,856,564 |
| Dana White | 4,542,071,550 | 426,605,536 | 212,856,564 |
| Tony Xu | 4,530,138,488 | 438,538,598 | 212,856,564 |
| Mark Zuckerberg | 4,650,180,275 | 318,496,811 | 212,856,564 |
Directors are elected by a plurality of the votes of the Class A and Class B shares voting together as a single class, so each of the twelve nominees was elected. The board set the authorised number of directors at twelve with effect from the 2026 meeting, against fifteen nominees at the 2025 meeting.
On every one of the ten shareholder proposals the against tally exceeded the 3,423,074,920 votes attaching to the Class B shares present. The highest support any of them drew was 27.1% of the votes cast for and against, on the proposal asking for an annual advisory vote on executive pay. The proposal to recapitalise into a single class of shares with one vote each drew 26.5%, against 25.8% for the same request at the 2025 meeting. The proposal to publish voting results by share class drew 20.1%, against 20.6% in 2025. The proposal on AI data usage oversight drew 10.2%, against 9.9% in 2025.
The board's response to the recapitalisation proposal states that its compensation, nominating and governance committee reviews the capital structure and that the board continues to believe the structure is appropriate for Meta and its shareholders at this time. Its response to the class by class disclosure proposal states that the proxy statement already discloses the ten votes per Class B share and one vote per Class A share, and the number of Class B shares outstanding.
No advisory vote on executive compensation appeared on the 2026 agenda. At the 2025 meeting shareholders voted 3,542,118,864 for a three year frequency against 1,448,611,643 for one year, and the board determined that the advisory pay vote will be held once every three years, with the next frequency vote expected at the 2031 meeting (0001326801-25-000090). That meeting also approved the 2025 Equity Incentive Plan by 3,753,643,849 votes to 1,235,628,986.
SEC filings in this chapter were retrieved through the SEC-API.io MCP server.
7 Insider Activity
In the twelve months to 6 September 2026, Meta insiders filed 169 Section 16 reports: 167 Forms 4, two Forms 3 and no Form 5, from 22 reporting persons (CIK 1326801). Those reports carry 654 transaction lines. Of the shares that left insider hands, 255,081 were sold under Rule 10b5-1 trading plans for gross proceeds of $160,845,271, and 181,897 were withheld by Meta itself to settle income tax on vesting restricted stock units, valued at $111,990,341 at the prices reported on the same lines. Sales in the open market with no trading plan cited came to 426 shares for $250,907, all on 4 August 2026. No Form 4 in the window reports transaction code P, an open market purchase.
The buy to sell ratio here is computed on open market transactions only, and with zero open market purchases against 426 shares sold no ratio is stated. Plan sales and withheld shares are excluded from the open market count: a plan sale is committed in advance under Rule 10b5-1, and a withheld share is retained by the issuer and never reaches the market.
Table 7.1 How the twelve months of Form 4 activity splits, shares and reported value
| Category | Transaction code | Lines | Shares | Value at reported price |
|---|---|---|---|---|
| Rule 10b5-1 plan sales | S with plan footnote | 241 | 255,081 | $160,845,271 |
| Shares withheld by the issuer for tax | F, and S with withholding footnote | 43 | 181,897 | $111,990,341 |
| Open market sales, no plan cited | S with neither footnote | 4 | 426 | $250,907 |
| Open market purchases | P | 0 | 0 | n/a |
| Restricted stock unit settlements | M | 129 | 326,437 | n/a |
| Class B to Class A conversions | C | 18 | 891,468 | n/a |
| Gifts, disposal side | G | 7 | 1,268,246 | n/a |
Source: Forms 4 filed 6 September 2025 to 6 September 2026, CIK 1326801.

The footnote wording sets the category for each of the 254 lines coded S. The 241 plan sales carry a footnote in the form used on Javier Olivan's Form 4 of 12 August 2026 (0000950103-26-012279): "The sale reported was effected pursuant to a Rule 10b5-1 trading plan adopted by the reporting person on November 17, 2025." Nine of the 254 lines are tax withholding, and the footnote to the 2,127 share line on Susan Li's Form 4 of 18 August 2026 (0000950103-26-012607) reads: "Represents the number of shares of Class A Common Stock that have been withheld by the Issuer to satisfy its income tax withholding and remittance obligations in connection with the net settlement of the Reporting Person's Restricted Stock Units ("RSUs") and does not represent an open market sale." Reading those nine lines by their code would add 27,681 shares and $17,329,653 to the sell side. The four remaining code S lines carry neither footnote and sit in the open market row.

Table 7.2 Every Form 4 line outside the Rule 10b5-1 plans and the vesting pipeline
| Date | Insider | Role | Code | Shares | Price | Holding after | Accession |
|---|---|---|---|---|---|---|---|
| 2026-08-04 | Marc L. Andreessen | Director | S | 250 | $588.16 | 176 | 0001160077-26-000008 |
| 2026-08-04 | Marc L. Andreessen | Director | S | 87 | $589.24 | 89 | 0001160077-26-000008 |
| 2026-08-04 | Marc L. Andreessen | Director | S | 44 | $590.39 | 45 | 0001160077-26-000008 |
| 2026-08-04 | Marc L. Andreessen | Director | S | 45 | $591.69 | 0 | 0001160077-26-000008 |
| 2026-07-31 | Mark Zuckerberg | Chairman and CEO | G | 591,690 | n/a | 0 | 0000950103-26-011908 |
| 2026-02-18 | Aaron Anderson | Chief Accounting Officer | G | 167 | n/a | 7,046 | 0000950103-26-002357 |
| 2025-11-26 | Robert M. Kimmitt | Director | G | 600 | n/a | 6,747 | 0000950103-25-015482 |
| 2025-11-20 | Susan J. Li | Chief Financial Officer | G | 33,583 | n/a | 68,888 | 0000950103-25-015185 |
| 2025-11-19 | Jennifer Newstead | Chief Legal Officer | G | 2,859 | n/a | 31,772 | 0000950103-25-015119 |
| 2025-10-31 | Mark Zuckerberg | Chairman and CEO | G | 397,007 | n/a | 0 | 0000950103-25-014304 |
| 2025-10-31 | Mark Zuckerberg | Chairman and CEO | G | 242,340 | n/a | 0 | 0000950103-25-014304 |
Source: Forms 4 filed 6 September 2025 to 6 September 2026, CIK 1326801. Prices are as reported in column 4; the four sales are weighted averages across multiple executions. Code S is a sale, code G a gift.
The four sales were made from shares held of record by a16z Capital Management, L.L.C., whose members are Marc Andreessen and Benjamin Horowitz. The Form 4 footnote states that a16z Capital had received an aggregate of 426 shares in pro rata distributions in kind for no additional consideration before the transactions reported, and the holding column runs 426 down to zero across the four lines. The gift lines are dispositions without proceeds. Mark Zuckerberg's three gift lines move 1,231,037 Class A shares out of CZI Holdings, LLC and the Chan Zuckerberg Initiative Foundation and into Chan Zuckerberg Biohub, Inc.; each Form 4 footnote states that he is deemed to have sole voting and investment power over the shares held by the recipient and has no pecuniary interest in them, and the October 2025 and July 2026 filings report Class B to Class A conversions of 242,340 and 591,690 shares immediately before the transfers. Zuckerberg filed three Forms 4 in the window and reported no sale in any of them.
Table 7.3 Rule 10b5-1 plans named in the Form 4 footnotes, by adoption date
| Insider | Role | Plan adopted | Form 4 lines under it |
|---|---|---|---|
| Javier Olivan | Chief Operating Officer | 17 November 2025 | 124 |
| Susan J. Li | Chief Financial Officer | 25 November 2025 | 39 |
| Javier Olivan | Chief Operating Officer | 17 August 2024 | 23 |
| Andrew Bosworth | Chief Technology Officer | 31 January 2025 | 19 |
| Jennifer Newstead | Chief Legal Officer | 11 February 2025 | 17 |
| Robert M. Kimmitt | Director | 15 August 2025 | 6 |
| Peggy Alford | Director | 25 November 2025 | 3 |
| Robert M. Kimmitt | Director | 25 February 2026 | 3 |
| Curtis J. Mahoney | Chief Legal Officer | 25 February 2026 | 2 |
| Robert M. Kimmitt | Director | 14 February 2025 | 2 |
| Susan J. Li | Chief Financial Officer | 12 February 2025 | 1 |
| Peggy Alford | Director | 27 November 2024 | 1 |
| Aaron Anderson | Chief Accounting Officer | 12 February 2024 | 1 |
Source: Rule 10b5-1 adoption dates as stated in the footnotes to Forms 4 filed 6 September 2025 to 6 September 2026, CIK 1326801.
The February 2026 spike in Figure 7.1 is one plan. Susan Li sold 131,062 shares across 20, 24 and 27 February 2026 for $83,977,169, under the plan she adopted on 25 November 2025; the other four sellers that month accounted for 12,451 shares.
The notice of the stockholder derivative settlement, filed as Exhibit 99.2 to the 8-K of 12 December 2025 (0001628280-25-056768), lists the governance measures Meta agreed to undertake. Item 4 of that list reads: "Insider Trading Policy: The Company will make all 10b5-1 trading plans under Meta’s 10b5-1 Trading Plan Policy for executive officers subject to the approval or ratification of the Company’s Chief Legal Officer (or designee) before any stock sales contemplated by such plans may be effectuated, and any such trading plan may only be terminated early or modified (as defined in Meta’s 10b5-1 Trading Plan Policy) once per year." The same 8-K states that the Court of Chancery scheduling order of 5 December 2025 set the settlement hearing for 7 April 2026. Reading the footnotes and remarks of all 169 Section 16 filings in the window returns no reference to approval or ratification of a plan by the Chief Legal Officer or a designee, and the latest plan adoption date any footnote states is 25 February 2026, which precedes the settlement hearing date. No Form 4 in the window therefore records the measure operating.
Table 7.4 Who filed, and what they reported
| Insider | Role as filed | Form 4 | Form 3 | Plan sale shares | Withheld shares | Open market sale shares |
|---|---|---|---|---|---|---|
| Javier Olivan | Chief Operating Officer | 45 | 0 | 49,170 | 31,357 | 0 |
| Jennifer Newstead | Chief Legal Officer to January 2026 | 18 | 0 | 8,820 | 8,294 | 0 |
| Robert M. Kimmitt | Director | 14 | 0 | 5,934 | 0 | 0 |
| Susan J. Li | Chief Financial Officer | 10 | 0 | 149,453 | 53,712 | 0 |
| Andrew Bosworth | Chief Technology Officer | 8 | 0 | 35,474 | 36,756 | 0 |
| Peggy Alford | Director | 6 | 0 | 1,866 | 0 | 0 |
| Aaron Anderson | Chief Accounting Officer | 6 | 0 | 726 | 4,424 | 0 |
| Curtis J. Mahoney | Chief Legal Officer from January 2026 | 6 | 1 | 3,638 | 5,504 | 0 |
| Dina H. Powell McCormick | President and Vice Chairman | 6 | 1 | 0 | 8,823 | 0 |
| Christopher K. Cox | Chief Product Officer | 5 | 0 | 0 | 32,788 | 0 |
| John Elkann | Director | 5 | 0 | 0 | 95 | 0 |
| Charles Songhurst | Director | 5 | 0 | 0 | 144 | 0 |
| Dana White | Director | 5 | 0 | 0 | 0 | 0 |
| John Douglas Arnold | Director | 5 | 0 | 0 | 0 | 0 |
| Patrick Collison | Director | 5 | 0 | 0 | 0 | 0 |
| Tony Xu | Director | 4 | 0 | 0 | 0 | 0 |
| Marc L. Andreessen | Director | 3 | 0 | 0 | 0 | 426 |
| Mark Zuckerberg | Chairman, Chief Executive Officer and director | 3 | 0 | 0 | 0 | 0 |
| Hock E. Tan | Director, standing down at the 2026 annual meeting | 3 | 0 | 0 | 0 | 0 |
| Andrew Houston | Director | 2 | 0 | 0 | 0 | 0 |
| Nancy Killefer | Director | 2 | 0 | 0 | 0 | 0 |
| Tracey T. Travis | Director, standing down at the 2026 annual meeting | 1 | 0 | 0 | 0 | 0 |
Source: Forms 3 and 4 filed 6 September 2025 to 6 September 2026, CIK 1326801. Roles are the relationship stated on each person's most recent filing in the window.
Both Forms 3 in the window were filed by an officer on taking a new capacity at Meta. Curtis J. Mahoney filed on 20 January 2026 for an event dated 7 January 2026 as Chief Legal Officer (0000950103-26-000702), reporting no holdings. A full text search of Meta's 8-K, 10-K and DEF 14A filings over the window returns Mahoney's name in one document, the 2026 proxy statement filed 16 April 2026 (0001628280-26-025532); Jennifer Newstead's last Form 4 as Chief Legal Officer was filed on 30 December 2025. Dina H. Powell McCormick filed on 22 January 2026 for an event dated 12 January 2026 as President and Vice Chairman (0000950103-26-000872), holding 258 Class A shares and restricted stock units over 32,388 shares. The 8-K of 16 January 2026 (0001628280-26-002429) reports her appointment effective 12 January 2026, and the 8-K of 19 December 2025 (0001628280-25-058337) reports her resignation from the board effective immediately, so her Form 3 records a move from director to officer. The 8-K of 14 April 2026 (0001628280-26-025108) reports that Hock E. Tan and Tracey T. Travis will not stand for reelection at the 2026 annual meeting. Seven Forms 3 sit on the record for the two years to 6 September 2026, and those two are the only ones inside the twelve month window.
Forms 144, the notices insiders file before selling restricted stock, corroborate the split. Ninety three were filed in the window, 92 Forms 144 and one Form 144/A, covering 258,931 shares with an aggregate market value of $163,441,997. Every one names a Rule 10b5-1 trading plan, in the notice remarks or in the plan adoption date on the signature block, and every share in them was acquired through a restricted stock unit lapse. Seven people filed them: Susan Li, Javier Olivan, Andrew Bosworth, Jennifer Newstead, Robert Kimmitt, Curtis Mahoney and Peggy Alford. Those seven account for 254,355 of the 255,081 plan shares sold on Form 4; the balance is Aaron Anderson's single sale of 726 shares on 18 November 2025, and no Form 144 in his name was filed in the window.
Table II of the Forms 4 in the window records 460,657 restricted stock units and options over 3,024,131 shares granted across 60 lines, with 129 settlement lines delivering 326,437 shares on vesting. None of that sits in the open market figures above: a grant and its settlement carry no purchase price and no market execution.
8 Risk Factors
Meta Platforms disclosed 48 risk factors in Part II, Item 1A of the 10-Q for the quarter to 30 June 2026 (0001628280-26-050705), the same 48 it set out in Item 1A of the FY2025 10-K (0001628280-26-003942) and the same count as the FY2024 10-K (0001326801-25-000017). No risk factor was added and none was dropped across the year. Thirteen were materially reworded, twenty eight carry minor edits, and seven stand word for word.
Four of the 48 FY2025 headings differ from FY2024 in more than a page reference, so a comparison of heading text alone would report almost no change. This chapter diffs the extracted body text instead. Item 1A was pulled from each filing as HTML through the SEC-API.io tools, split into risk factor records using the filing's own typography (each category banner and each risk factor heading is set bold, the banners being the bold blocks that open with the words Risks Related to and each risk factor opening at the next bold block), matched across filings by heading similarity, then compared word by word within each matched pair. A risk factor is called materially reworded when its heading text changed, when at least 10% of the FY2025 body has no match in FY2024, or when word level similarity falls below 0.90.
Word counts and change shares below are this report's own measurement over the extracted text rather than figures the filing discloses.
What the disclosure covers and how it is weighted
Meta groups the 48 risk factors into five categories and prefixes them with a Summary Risk Factors list of 19 bullets, so 19 summary bullets stand over 48 detailed risk factors.
Table 8.1 Item 1A by risk category, count and word weight
| Category | Risk factors | FY2024 | FY2025 | Q1 2026 | Q2 2026 | Share of FY2025 |
|---|---|---|---|---|---|---|
| Our Product Offerings | 10 | 7,044 | 7,286 | 7,291 | 7,318 | 25.0% |
| Our Business Operations and Financial Results | 23 | 10,510 | 10,892 | 11,058 | 11,114 | 37.3% |
| Government Regulation and Enforcement | 6 | 6,499 | 6,531 | 6,514 | 6,561 | 22.4% |
| Data, Security, Platform Integrity, and Intellectual Property | 5 | 2,711 | 2,976 | 3,158 | 3,192 | 10.2% |
| Ownership of Our Class A Common Stock | 4 | 1,512 | 1,506 | 1,507 | 1,495 | 5.2% |
| Total | 48 | 28,276 | 29,191 | 29,528 | 29,680 | 100.0% |
Word counts are this report's measurement over the Item 1A text as extracted. Category names are as filed. Source: Item 1A of the 10-K for FY2025 (0001628280-26-003942) and FY2024 (0001326801-25-000017); Part II, Item 1A of the 10-Q for Q1 2026 (0001628280-26-028526) and Q2 2026 (0001628280-26-050705), via the SEC-API.io MCP server.

Six risk factors carry 30.8% of the text between them. The single longest is the privacy, data, content, AI and competition law risk factor at 2,592 words in FY2025, 8.9% of Item 1A on its own, followed by the metrics accuracy risk factor at 1,706 words and the user retention risk factor at 1,380 words.
The change register
Table 8.2 Risk factors in the FY2025 10-K against the FY2024 10-K, by category
Status is set by the word level diff described above. Short names are this report's labels; each filed heading runs to a full sentence.
| Category | Risk factor | Status | What changed |
|---|---|---|---|
| Product | User retention and engagement | Minor edit | References to the covid 19 pandemic and to the California Consumer Privacy Act removed |
| Product | Loss of marketers or reduced ad spending | Minor edit | Adds trade policies to the list of conditions that can cut marketer spending |
| Product | Availability of ad targeting data signals | Reworded | Adds the April 2025 European Commission decision that the subscription for no ads model does not comply, the modifications made to less personalised ads since, and the appeal |
| Product | Operation with mobile operating systems | Minor edit | Wording unchanged apart from pagination |
| Product | New products failing to attract users | Minor edit | AI profiles and videos added as examples; mixed reality removed |
| Product | Artificial intelligence initiatives | Reworded | Superintelligence added alongside generative AI; FTC, Congressional and state attorney general scrutiny of AI chatbots added; access to models, computing power and specialised talent named as dependencies |
| Product | Decisions not prioritising short term results | Minor edit | Wording unchanged apart from pagination |
| Product | Reality Labs strategy and investments | Minor edit | Metaverse and wearables description dropped; medical devices added; mixed reality removed |
| Product | Maintaining and enhancing the brands | Minor edit | Superintelligence added; content enforcement wording widened from remove to enforce against or disable |
| Product | Third party content and integrated apps | Reworded | Heading extended to cover creator content on the platform, with new text on product changes and tools to promote creative content |
| Operations | Competition | Minor edit | Competition now framed around the development and application of AI, including frontier AI models, and around creator supply |
| Operations | Quarter to quarter fluctuation in results | Minor edit | Strategic transactions, infrastructure and consumer protection added to the list of drivers |
| Operations | Unfavourable media coverage | Reworded | Younger users added to well being coverage; new text stating that several bellwether trials in youth related litigation are scheduled for 2026 and beyond |
| Operations | Catastrophic events and crises | Minor edit | Pandemic reference removed |
| Operations | Operating expenses and AI and Reality Labs investment | Reworded | Largest rewrite in the item. Reality Labs drag restated from about $17.73 billion in 2024 to about $19.19 billion in 2025, with 2026 losses expected to remain similar to 2025 rather than to increase; new text on raising debt or equity, fixed obligations, interest expense and dilution |
| Operations | Scaling technical infrastructure | Unchanged | Text unchanged |
| Operations | Building and operating infrastructure | Minor edit | Environmental health and safety compliance added to the delay and disruption list |
| Operations | Accuracy of community and other metrics | Minor edit | Violating accounts estimate moved from less than 3% of worldwide daily active people in Q4 2024 to less than 5% in Q4 2025, attributed to a Q4 2025 methodology update |
| Operations | Managing scale | Minor edit | Wording unchanged apart from pagination |
| Operations | International operations | Minor edit | Wording unchanged apart from pagination |
| Operations | Consumer hardware design and supply chain | Minor edit | Wording unchanged apart from pagination |
| Operations | Consumer hardware inventory | Minor edit | Wording unchanged apart from pagination |
| Operations | Class action lawsuits and other litigation | Minor edit | Younger users, unfair and deceptive trade practices and improperly scraped or acquired training data added to the claim types; new sentence recording an increase in litigation and threatened claims over services to younger users |
| Operations | Acquisitions and strategic transactions | Minor edit | Other strategic transactions added alongside acquisitions |
| Operations | Integrating acquisitions | Unchanged | Text unchanged |
| Operations | Greater than anticipated tax liabilities | Reworded | Heading changed from a risk that may arise to one that has arisen: we have had, and may in the future have, exposure. Body shifts from jurisdictions are aggressively interpreting to certain jurisdictions have applied novel or aggressive interpretations |
| Operations | Changes in tax laws or tax rulings | Reworded | The 2017 Tax Cuts and Jobs Act example replaced by the One Big Beautiful Bill Act enacted in July 2025 and its effect on the Q3 2025 tax charge and effective rate; new text on unilateral digital services taxes outside treaty frameworks |
| Operations | Share based compensation and the tax rate | Reworded | The FY2024 example quantifying a $3.22 billion reduction in the tax provision removed; replaced by text stating excess tax benefits may not be realisable under the Corporate Alternative Minimum Tax after the One Big Beautiful Bill Act |
| Operations | Goodwill and intangible asset impairment | Unchanged | Text unchanged |
| Operations | Loss of key personnel | Minor edit | Science research and AI research added to the specialised roles named |
| Operations | CEO control over key decision making | Unchanged | Text unchanged |
| Operations | Share repurchase programme | Minor edit | Wording unchanged apart from pagination |
| Operations | Continuation of cash dividends | Unchanged | Text unchanged |
| Regulation | Government restrictions on access | Minor edit | Wording unchanged apart from pagination |
| Regulation | Privacy, data, content, AI and competition law | Reworded | AI added to the heading. Body adds the UK Online Safety Act, the April 2025 European Commission decision on the subscription for no ads model, state content moderation laws, and the Australian ban on users under 16 as enacted rather than expected |
| Regulation | Investigations, enforcement actions and settlements | Minor edit | Consumer hardware and software, virtual reality products and generative AI added to the subjects of investigation |
| Regulation | FTC consent order and privacy compliance | Reworded | The UK Online Safety Act added to the heading; UK GDPR added to the compliance list in the body |
| Regulation | Liability for content on the products | Minor edit | Adds the June 2025 Brazilian Supreme Court decision partially invalidating the intermediary liability framework and the product and operational changes anticipated in response |
| Regulation | Payment related activities | Minor edit | The Consumer Financial Protection Bureau larger participant rule example removed |
| Data and IP | Security breaches and cyber incidents | Reworded | AI models, internal and third party AI tools and AI applications named as new attack surface, with prompt injection and compromise of source code and model weights |
| Data and IP | Intentional misuse by third parties | Minor edit | Use of AI technologies added to the misuse types; the January 2025 content policy change reference removed |
| Data and IP | Errors and vulnerabilities in software and hardware | Reworded | Public cloud providers and AI technologies and services added to the dependency list; new text on errors introduced through the use of AI to develop or maintain software |
| Data and IP | Protecting intellectual property | Unchanged | Text unchanged |
| Data and IP | Patent, trademark and copyright lawsuits | Reworded | New text on copyright litigation over the acquisition, distribution and use of copyrighted material for AI training and reproduction in AI outputs, the fair use defence, and statutory damages calculated per work |
| Ownership | Class A share price volatility | Minor edit | Trading range high updated from $638.40 through 31 December 2024 to $796.25 through 31 December 2025 |
| Ownership | Dual class structure and voting control | Unchanged | Text unchanged |
| Ownership | Controlled company status | Minor edit | Wording unchanged apart from pagination |
| Ownership | Delaware law and charter provisions | Minor edit | Wording unchanged apart from pagination |
Source: Item 1A of the 10-K for FY2025 (0001628280-26-003942) and FY2024 (0001326801-25-000017), via the SEC-API.io MCP server.

The changes that carry a number
Four risk factors changed a figure printed inside Item 1A. Two of the four are among the thirteen materially reworded.
The operating expense risk factor carries the largest rewrite, with 40% of its FY2025 body having no match in FY2024. It restates the Reality Labs drag on overall operating profit from approximately $17.73 billion in 2024 to approximately $19.19 billion in 2025, and changes the forward statement from an expectation that Reality Labs losses increase in 2025 to an expectation that 2026 losses remain similar to 2025. It also adds a passage on raising capital through debt, equity or other financing arrangements, on increased fixed obligations and interest expense, and on dilution to stockholders. FY2024 carried no such passage in this risk factor.
The two tax risk factors moved together. The example in the changes in tax laws risk factor was replaced: the 2017 Tax Cuts and Jobs Act example gave way to the One Big Beautiful Bill Act enacted in July 2025, which the filing states had a significant impact on tax obligations and the effective tax rate for the third quarter of 2025. The share based compensation risk factor dropped the FY2024 figure of a $3.22 billion reduction in the income tax provision and replaced it with text stating that excess tax benefits may not be realisable as a result of the Corporate Alternative Minimum Tax. The tax liabilities risk factor changed its heading from a prospective form to one that records the exposure has already arisen.
The metrics accuracy risk factor moved the violating accounts estimate from less than 3% of worldwide daily active people in the fourth quarter of 2024 to less than 5% in the fourth quarter of 2025, and attributes the increase to a fourth quarter 2025 methodology update that incorporated updated data signals and focused on the most recent account activity.
The Class A share price risk factor updated the disclosed trading range from $17.55 to $638.40 through 31 December 2024, to $17.55 to $796.25 through 31 December 2025.
Artificial intelligence wording was added across eleven of the risk factors. AI was added to the heading of the largest risk factor in the item, the privacy, data, content and competition law one. Superintelligence was added to the AI initiatives risk factor and to the brands risk factor. Frontier AI models were added to the competition risk factor, AI research to the key personnel risk factor, AI training data to the copyright and to the class action risk factors, AI tools and model weights to the security breaches risk factor, and AI generated code to the software errors risk factor.
What the 2026 10-Q Item 1A does
Part II, Item 1A of both 2026 10-Qs restates the risk factors in full. Each carries the same preamble, the same Summary Risk Factors list of 19 bullets, and the same 48 detailed risk factors, running to 29,528 words in the March quarter filing and 29,680 words in the June quarter filing against 29,191 in the FY2025 10-K. Neither filing states that there have been no material changes and neither substitutes a cross reference to the 10-K for the risk factors themselves.
Against the FY2025 10-K, the Q1 2026 filing materially reworded four risk factors and made minor edits to a further 28; against Q1, the Q2 filing materially reworded two more.
Table 8.3 Risk factors changed in the 2026 10-Q filings
| Risk factor | Filing | Words | What changed |
|---|---|---|---|
| Building and operating infrastructure | Q2 2026 | 460 to 512 | Adds shifting public sentiment toward data centre development in the United States, related state and local legislative developments, and the effect on capital expenditure or operating costs of any tax changes on data centre operations |
| FTC consent order and privacy compliance | Q2 2026 | 734 to 741 | The EU AI Act added to the heading and to the list of requirements a compliance failure could breach |
| Operating expenses and AI and Reality Labs investment | Q2 2026 | 504 to 528 | Adds that significant indebtedness and other contractual commitments, including lease obligations, have been incurred to finance the investments, with more expected |
| Scaling technical infrastructure | Q2 2026 | 744 | Commitment figure updated to $349.31 billion as of 30 June 2026 |
| Artificial intelligence initiatives | Q2 2026 | 994 to 1,018 | Adds model extraction or theft, US state AI laws, and the release of frontier AI models to the public |
| Scaling technical infrastructure | Q1 2026 | 639 to 744 | Adds multiyear purchase commitments and the figure of $237.67 billion of noncancelable contractual commitments as of 31 March 2026, mostly third party cloud capacity and technical infrastructure. Adds that infrastructure in excess of actual needs may lead to impairment of assets |
| Security breaches and cyber incidents | Q1 2026 | 1,017 to 1,139 | Adds AI agents as a source of error and as a target, supply chain vulnerabilities across the industry, and the discovery of security vulnerabilities at unprecedented speed and scale through AI |
| Errors and vulnerabilities in software and hardware | Q1 2026 | 486 to 545 | Adds AI generated code and AI agents as sources of error, and the risk that vulnerabilities are found and exploited before they can be remediated |
| Operating expenses and AI and Reality Labs investment | Q1 2026 | 506 to 504 | Cash flows added alongside operating margin and profitability as what the investments reduce |
| Changes in tax laws or tax rulings | Q1 2026 | 589 to 628 | Adds the January 2026 OECD side by side safe harbor, under which US headquartered companies remain subject only to US global minimum taxes, specifically the Corporate Alternative Minimum Tax, and are exempt from Pillar Two |
Source: Part II, Item 1A of the 10-Q for Q1 2026 (0001628280-26-028526) and Q2 2026 (0001628280-26-050705), against Item 1A of the FY2025 10-K (0001628280-26-003942), via the SEC-API.io MCP server.
The 10-Q adds a contractual commitment figure that Item 1A of neither 10-K carries. Beyond the Class A trading range set out above and the May 2012 initial public offering price the same risk factor carries, Item 1A of the FY2025 10-K prints one dollar figure, the $19.19 billion Reality Labs drag; Item 1A of the FY2024 10-K prints two, the $17.73 billion drag and the $3.22 billion tax benefit. The Q1 2026 filing states $237.67 billion of noncancelable contractual commitments as of 31 March 2026 and the Q2 2026 filing states $349.31 billion as of 30 June 2026, an increase of $111.64 billion in one quarter. Note 9 of the Q2 2026 10-Q sets approximately $53.52 billion of that as due in 2026 and $81.65 billion in 2027, and separately discloses operating and finance leases not yet commenced of approximately $278.99 billion, plus a further approximately $68 billion of data centre leases entered into in July 2026.
Risks that have already partly materialised
Table 8.4 Amounts recorded in the period against disclosed risk factors
| Item | Period | Amount, USD billion | Risk factor it sits under | Source |
|---|---|---|---|---|
| Charges related to legal proceedings, within general and administrative expenses | Q2 2026 | 2.40 | Class action lawsuits and other litigation | 10-Q Q2 2026, 0001628280-26-050705 |
| Income tax benefit on Corporate Alternative Minimum Tax transitional relief under Treasury Notice 2026-7, partially offsetting the Q3 2025 charge | Q2 2026 | (8.03) | Changes in tax laws or tax rulings | 10-Q Q2 2026, 0001628280-26-050705 |
| Monetary settlement payable to Meta by the defendants, funded by their insurers, In re Facebook Inc. Derivative Litigation, Delaware Court of Chancery C.A. No. 2018-0307-KSJM, stipulation dated 20 November 2025 | Nov 2025 | (0.19) | Class action lawsuits and other litigation | 8-K 12 December 2025, 0001628280-25-056768, Exhibit 99.1 |
| Discrete income tax charge on enactment of the One Big Beautiful Bill Act | Q3 2025 | 15.93 | Changes in tax laws or tax rulings | 10-Q Q2 2026, 0001628280-26-050705 |
Amounts in parentheses are credits or receipts. Risk factor names are the short labels used in Table 8.2. Source: SEC filings via the SEC-API.io MCP server.

The FY2025 10-K rewrote the changes in tax laws risk factor around the One Big Beautiful Bill Act after the charge had been taken; the FY2024 version, filed six months before the Act was enacted in July 2025, named only the 2017 Tax Cuts and Jobs Act. The Q2 2026 10-Q then records an income tax benefit of $8.03 billion partially offsetting the $15.93 billion charge, attributed to Corporate Alternative Minimum Tax transitional relief provided under Treasury Notice 2026-7, share based compensation tax effects, research tax credits and the foreign derived deduction eligible income benefit. The same 10-Q states that the Corporate Alternative Minimum Tax regime limits the full benefit of foreign derived deduction eligible income and of excess tax benefits from share based compensation in 2026, which is the mechanism the share based compensation risk factor was rewritten to describe.
The $2.40 billion of charges related to legal proceedings sits in general and administrative expenses for the three months to 30 June 2026, and the 10-Q attributes the 111% increase in that line, from $2,663m to $5,609m, primarily to those charges. The filing does not allocate the $2.40 billion to a named matter. Part II, Item 1 of the same 10-Q records the outcomes in the period: a New Mexico jury verdict on 24 March 2026 ordering a civil penalty of $375 million, a first user bellwether verdict on 25 March 2026 awarding $6 million in compensatory and punitive damages between Meta and YouTube allocated 70% to Meta, a settlement of the first school district bellwether case in May 2026, and a European Commission interim measure in June 2026 requiring WhatsApp to open its Business API to general purpose AI providers for free. The Q2 2026 10-Q also states that the maximum aggregate monetary damages or penalties sought across the various legal proceedings could amount to an aggregate of up to hundreds of billions of dollars.
The unfavourable media coverage risk factor and the class action risk factor were both rewritten for FY2025 around youth related litigation, before the March 2026 verdicts. The class action risk factor added that Meta has seen an increase in litigation and threatened claims related to the provision of its services to younger users; the media coverage risk factor added that several bellwether trials in the youth related matters are scheduled for 2026 and beyond. Trials are listed for the second half of 2026 and 2027, including the next two user bellwethers on 28 October 2026 and the multidistrict state attorneys general trial from 12 August 2026.
The $190,000,000 is the monetary settlement amount in the stipulation filed as Exhibit 99.1 to the 8-K of 12 December 2025, payable by the defendant directors and officers to Meta in the consolidated Delaware derivative action over the company's privacy practices, and it is stated to be an all in number covering plaintiffs' fees and expenses. Chapter 5 sets out the stipulation and the governance measures attached to it.
The Reality Labs risk factor carries a quantified drag of approximately $19.19 billion on 2025 overall operating profit, disclosed inside Item 1A itself. The security breaches risk factor, rewritten in the FY2025 10-K and again in both 2026 10-Qs around AI agents, prompt injection and model weight theft, carries no incident and no loss amount in Item 1A of either 10-K, in Part II Item 1A of either 2026 10-Q, or in Part II Item 1 of the Q2 2026 10-Q.
9 Stock Price, Scenarios & Sensitivity
The price block fixed in chapter 4 puts META's market value at $1,571.2 billion on 4 September 2026, the as of date for this report. That is 26.0 times FY2025 net income of $60,458m and 23.1 times the $68,098m of net income reported in the twelve months to 30 June 2026, both multiples struck by this report on that block. The three cases set out below carry FY2029 implied values of $1,388, $708 and $235 a share, a range of six times between the worst and the best on assumptions that are all listed as numbers in Table 9.2. The base case is an estimate built by this report, and the input that moves it furthest is the exit multiple, which no filing sets.
The price record

Table 9.1 Closing price record to 4 September 2026
| Measure | Date | Close ($) | Against the 4 Sep 2026 close |
|---|---|---|---|
| Highest daily close, twelve months | 18 Sep 2025 | 780.25 | (21.0%) |
| Lowest daily close, twelve months | 27 Mar 2026 | 525.72 | 17.3% |
| Highest weekly close, five years | week to 15 Aug 2025 | 785.23 | (21.5%) |
| Lowest weekly close, five years | week to 4 Nov 2022 | 90.79 | 579.3% |
| Close twelve months earlier | 5 Sep 2025 | 752.45 | (18.0%) |
| Close five years earlier | week to 10 Sep 2021 | 378.69 | 62.9% |
Closing prices are regular trading hours. The final column compares each level with the close in the report's price block. Market price data carries no named provider. Percentage changes are this report's arithmetic.
Figure 9.1 marks the session after each of the four most recent results releases. Three of the four fell and one rose. The largest fall followed the third quarter of 2025, the quarter carrying the $15.93 billion charge from the One Big Beautiful Bill Act. The most recent fall followed the second quarter of 2026, the quarter in which the operating margin was 30.9%, the lowest of the six quarters from March 2025 to June 2026 charted in Figure 2.2 (accessions 0001628280-26-003942 and 0001628280-26-050705).
Three cases to FY2029
Every case starts from the same filed figures and the same guidance, then separates on stated inputs. Revenue for 2026 is the $117,111m reported for the half year to 30 June 2026, plus a point taken from the third quarter 2026 revenue range of $61 billion to $64 billion guided on 29 July 2026, plus a fourth quarter grown on the $59,893m of the fourth quarter of 2025 at the year over year rate that third quarter point implies, less three percentage points of deceleration in every case. Income from operations for 2026 is that revenue less a point from the full year expense outlook of $165 billion to $169 billion. FY2027 to FY2029 apply the stated growth rate and the stated operating margin. Nonoperating income is held at nil in all three cases, against the $(19)m reported for the quarter to 30 June 2026; each $1 billion a year of net nonoperating expense would take $0.32 off FY2029 earnings per share at the base case tax rate and share count.
Table 9.2 Scenario inputs and outputs, FY2026 to FY2029
| Best | Base | Worst | |
|---|---|---|---|
| Inputs | |||
| Q3 2026 revenue, point in the guided range ($m) | 64,000 | 62,500 | 61,000 |
| Q4 2026 revenue growth on Q4 2025 | 21.9% | 19.0% | 16.0% |
| FY2026 total expenses, point in the guided range ($m) | 165,000 | 167,000 | 169,000 |
| Revenue growth FY2027 | 22.0% | 16.0% | 8.0% |
| Revenue growth FY2028 | 19.0% | 13.0% | 4.0% |
| Revenue growth FY2029 | 16.0% | 11.0% | 1.0% |
| Operating margin FY2027 | 34.0% | 32.0% | 27.0% |
| Operating margin FY2028 | 35.0% | 31.0% | 24.0% |
| Operating margin FY2029 | 36.0% | 30.0% | 21.0% |
| Tax rate, FY2026 to FY2029 | 15.0% | 17.0% | 19.0% |
| Diluted shares, change a year | (1.5%) | nil | 1.0% |
| Exit multiple, market value over net income | 26.0x | 20.0x | 13.0x |
| FY2026 | |||
| Revenue ($m) | 254,119 | 250,866 | 247,613 |
| Revenue growth on FY2025 | 26.4% | 24.8% | 23.2% |
| Income from operations ($m) | 89,119 | 83,866 | 78,613 |
| Operating margin | 35.1% | 33.4% | 31.7% |
| FY2029 | |||
| Revenue ($m) | 427,959 | 365,007 | 280,900 |
| Revenue CAGR, FY2026 to FY2029 | 19.0% | 13.3% | 4.3% |
| Income from operations ($m) | 154,065 | 109,502 | 58,989 |
| Net income ($m) | 130,955 | 90,887 | 47,781 |
| Diluted shares (m) | 2,452 | 2,566 | 2,644 |
| Earnings per share ($) | 53.40 | 35.42 | 18.07 |
| Result | |||
| Implied value per share ($) | 1,388 | 708 | 235 |
| Implied market value ($bn) | 3,405 | 1,818 | 621 |
| Against the close in the price block | 125% | 15% | (62%) |
| Compound change a year, 3.32 years | 27.7% | 4.3% | (25.2%) |
Filed figures come from the Form 10-K for FY2025 (0001628280-26-003942), the Form 10-Q for the quarter to 30 June 2026 (0001628280-26-050705) and the earnings release furnished as Exhibit 99.1 to the Form 8-K of 29 July 2026 (0001628280-26-050596), through the SEC-API.io MCP server. Every scenario input and every projected figure is this report's own.

The base case earns $27.13 a share in 2026 against the $23.49 reported for 2025, then compounds revenue at 13.3% to FY2029 while the operating margin settles at 30.0%, close to the 30.9% of the quarter to 30 June 2026 and below the 41.4% of FY2025. Its FY2026 income from operations of $83,866m clears the $83,276m earned in 2025, the level the 29 July 2026 release said it continues to expect to exceed. The worst case reaches $78,613m in 2026, $4,663m below that level, so the FY2026 outcome separates the two cases within the first year of the forecast.
Core assumptions and where each is set
Table 9.3 The base case assumptions and the filed figure each is set against
| Assumption | Base case | Set against |
|---|---|---|
| Q3 2026 revenue | $62,500m | Midpoint of the $61 billion to $64 billion guided on 29 July 2026, on an assumed 1% foreign currency headwind (0001628280-26-050596) |
| Q4 2026 revenue growth | 19.0% | Three points below the year over year growth the Q3 midpoint implies against Q3 2025 revenue of $51,242m (0001628280-25-047240) |
| FY2026 total expenses | $167,000m | Midpoint of the $165 billion to $169 billion guided on 29 July 2026, itself 40.2% to 43.6% above the $117,690m of FY2025 costs and expenses (0001628280-26-003942) |
| Revenue growth FY2027 to FY2029 | 16.0%, 13.0%, 11.0% | Deceleration from the 28% of the quarter to 30 June 2026, the 22.2% of FY2025 and the 21.9% of FY2024 (0001628280-26-050705, 0001628280-26-003942) |
| Operating margin FY2027 to FY2029 | 32.0%, 31.0%, 30.0% | The 30.9% of the quarter to 30 June 2026, against 41.4% for FY2025, with depreciation carried by 2026 capital expenditure of $130 billion to $145 billion and by $278.99 billion of lease obligations signed and not yet commenced (0001628280-26-050705) |
| Reality Labs | Loss held inside the group margin | The segment reported an FY2025 operating loss of $19,193m, expected to remain similar in 2026, and a cumulative FY2021 to FY2025 loss of $76,952m (0001628280-26-003942) |
| Tax rate | 17.0% | Top of the 15% to 17% guided on 29 July 2026 for the remaining quarters of 2026 (0001628280-26-050596) |
| Nonoperating income | nil | $(19)m for the quarter to 30 June 2026 (0001628280-26-050705) |
| Diluted shares | 2,566m held flat | Diluted weighted average for the quarter to 30 June 2026, with no repurchases in the half year to 30 June 2026 against $22,921m in the same half of 2025, and $25,030m of repurchase authorisation remaining (0001628280-26-050705, 0001628280-26-003942) |
| Exit multiple | 20.0x net income | Below the 26.0x the price block strikes on FY2025 net income and the 23.1x on the twelve months to 30 June 2026. Chapter 4 puts the same market value at 18.9x FY2025 income from operations, against 23.9x to 35.1x for the four largest comparators |
Guidance is the outlook standing at 6 September 2026. The FY2025 Form 10-K, the Forms 10-Q for the first and second quarters of 2026 and the three 2026 earnings releases furnished with Forms 8-K carry outlook items for 2026 alone: third quarter revenue, full year expenses, full year capital expenditure, the tax rate for the remaining quarters and a statement on full year operating income. The most recent revenue figure guided is the third quarter of 2026, so FY2027 to FY2029 rest on the assumptions in this table.
What drives demand
Advertising on the Family of Apps produced $59,363m of the $60,801m of revenue in the quarter to 30 June 2026. Meta reports two drivers behind that line, and in the quarter both rose: ad impressions delivered up 14% and the average price per ad up 12%. For FY2025 the same pair read 12% and 9%, and for FY2024 11% and 10%. Family daily active people reached 3.60 billion for June 2026, up 3%, and average revenue per person was $16.86, up 24%, so price per person carried the larger part of the growth. By user geography, revenue grew 32% in the United States and Canada, 24% in Europe, 19% in Asia Pacific and 36% in the rest of the world. Foreign exchange added $685m to the quarter, which the filing states as constant currency revenue of $60,116m, and the outlook assumes a 1% headwind for the third quarter (0001628280-26-050705, 0001628280-26-050596).
The Form 10-Q states that Meta does not have perfect visibility into the factors driving advertiser spending decisions. Reality Labs earned $431m in the quarter against an operating loss of $4,619m, so the demand that carries all three cases is advertising demand.
The critical factors behind the best case
The best case reaches $1,388 a share on revenue of $427,959m and a 36.0% operating margin in FY2029. Five conditions carry it, each measured against a filed figure.
- Both advertising drivers keep rising together. Impressions and price per ad were both positive in the quarter to 30 June 2026 and in each of FY2024 and FY2025. The best case needs 22% revenue growth in 2027, inside the 19% to 25% year over year range the third quarter 2026 guidance implies and below the 28% of the quarter to 30 June 2026.
- Capital expenditure converts into revenue faster than into depreciation. Capital expenditure including finance lease principal took 70.9% of operating cash flow in the twelve months to 30 June 2026, against 43.0% in FY2024, and the 2026 outlook of $130 billion to $145 billion was raised twice from the $115 billion to $135 billion given in January 2026. The best case adds $173,840m of revenue between FY2026 and FY2029 on that installed base.
- Expense growth drops below revenue growth from 2028. The FY2026 expense outlook is 40.2% to 43.6% above FY2025 costs and expenses. The best case carries expense growth of 24.0% in 2027, 17.2% in 2028 and 14.2% in 2029 against revenue growth of 22%, 19% and 16%, which takes the margin to 34.0% in 2027 and back to 36.0% by 2029.
- The Reality Labs loss stops growing. The segment lost $19,193m in FY2025 and $8,647m in the half year to 30 June 2026, and the FY2025 10-K states 2026 losses are expected to remain similar to 2025. Held at that level against best case revenue, the loss falls from 7.6% of FY2026 revenue to 4.5% of FY2029 revenue.
- Repurchases resume and the tax rate holds at the low end. No shares were repurchased in the half year to 30 June 2026, with $25,030m of authorisation remaining, and cash and marketable securities of $90,260m stood against long term debt of $83,664m at 30 June 2026, net cash of $6,596m against $48,989m at the end of 2024. The best case takes the diluted count down 1.5% a year and taxes at 15%, the low end of the guided range; those two together carry $93 of the $1,388, being $62 from the share count and $31 from the tax rate.
Sensitivity

Each bar in Figure 9.3 replaces one base case input with its worst case and best case value and leaves the other four unchanged. The exit multiple moves implied value per share furthest, from $460 to $921 against the $708 of the base case, and it is the one input no filing sets. The FY2029 operating margin is second and is the widest of the inputs the filings speak to: the 21% to 36% range sits below the 41.4% of FY2025 throughout and brackets the 30.9% of the quarter to 30 June 2026. Revenue growth is third, the diluted share count fourth and the tax rate fifth, and the tax range of 13% to 21% brackets the 15% to 17% guided for the remaining quarters of 2026.
Two break even points follow from the same arithmetic. Holding the base case revenue path and a 20.0x exit multiple, an FY2029 operating margin of 26.1% returns the close in the price block. Holding the 30.0% base case margin, an exit multiple of 17.4x returns the same close.

The grid crosses the two widest inputs and holds base case revenue, tax and share count. Thirteen of its thirty cells sit at or below the close in the price block, and every cell in the 14.0x column does so whatever the margin.
What would break the base case
Table 9.4 Observable markers, with the level at which the base case fails
| Marker | Where it stands now | The level that breaks the base case |
|---|---|---|
| Q3 2026 revenue | Guided to $61 billion to $64 billion on 29 July 2026; $62,500m assumed | Revenue below $61,000m puts FY2026 under the base case path in the first quarter of the forecast |
| FY2026 income from operations | Base case $83,866m against $83,276m earned in FY2025 | Any outcome below $83,276m, the level the July 2026 release said it continues to expect to exceed |
| FY2026 total expenses | Guided to $165 billion to $169 billion, raised at the low end on 29 July 2026 | A further increase above $169,000m, which the base case has no revenue to absorb |
| Capital expenditure | 2026 guided to $130 billion to $145 billion, raised twice from $115 billion to $135 billion | A 2027 outlook above the 2026 range, which adds depreciation to the FY2027 to FY2029 margins the base case holds at 30% to 32% |
| Lease and purchase commitments | $278.99 billion of lease obligations signed and not yet commenced at 30 June 2026, plus approximately $68 billion entered in July 2026; noncancelable contractual commitments $349.31 billion, of which $53.52 billion falls due in 2026 and $81.65 billion in 2027 | Commitments commencing faster than revenue, which lands in the same margin line |
| Reality Labs | FY2025 loss $19,193m, 2026 expected similar; cumulative FY2021 to FY2025 loss $76,952m | A 2026 loss materially wider than $19,193m, which the base case margin path does not carry |
| Tax rate | 15% to 17% guided for the remaining quarters of 2026 | A rate above 17%, taking FY2029 earnings per share below $35.42 |
| Cash generation | Free cash flow $784m in the quarter to 30 June 2026, $13,170m in the half year, against $43,585m for FY2025 and $52,103m for FY2024 | Free cash flow that stays near the quarterly level, which removes the repurchases the best case assumes and holds the share count on the worst case path |
Sources for this table: the Form 10-K for FY2025 (0001628280-26-003942), the Form 10-Q for the quarter to 30 June 2026 (0001628280-26-050705) and the earnings releases furnished with the Forms 8-K of 28 January, 29 April and 29 July 2026 (0001628280-26-003832, 0001628280-26-028364, 0001628280-26-050596), through the SEC-API.io MCP server.
Each of the three cases is a range under the stated assumptions in Table 9.2 and carries no recommendation. The figures for FY2026 to FY2029 are this report's own estimates.
10 Sources
Every figure, table and statement in this report is drawn from filings made with the Securities and Exchange Commission and retrieved through the SEC-API.io MCP server, or from closing market prices. Market prices carry no named provider and sit outside that credit. Prices are closing prices of 4 September 2026, the as of date fixed in chapter 4 and used in chapters 4 and 9. Growth rates, margins, returns, per share and per employee figures, multiples, word counts and the scenarios of chapter 9 are this report's own arithmetic over the filed figures, and are marked as such where they appear. This is independent analysis of filings made with the SEC. It is not a publication of the SEC and the SEC has neither reviewed nor endorsed it.
Table 10.1 Meta Platforms, Inc. filings cited, CIK 1326801
| Form | Period or event | Filed | Accession |
|---|---|---|---|
| 10-K | FY2025 | 28 Jan 2026 | 0001628280-26-003942 |
| 10-K | FY2024 | 29 Jan 2025 | 0001326801-25-000017 |
| 10-K | FY2023 | 1 Feb 2024 | 0001326801-24-000012 |
| 10-K | FY2022 | 1 Feb 2023 | 0001326801-23-000013 |
| 10-K | FY2020, for the revolving credit facility since terminated | 27 Jan 2021 | 0001326801-21-000014 |
| 10-Q | Quarter to 30 Jun 2026 | 29 Jul 2026 | 0001628280-26-050705 |
| 10-Q | Quarter to 31 Mar 2026 | 29 Apr 2026 | 0001628280-26-028526 |
| 10-Q | Quarter to 30 Sep 2025 | 29 Oct 2025 | 0001628280-25-047240 |
| 10-Q | Quarter to 30 Jun 2025 | 30 Jul 2025 | 0001628280-25-036791 |
| 10-Q | Quarter to 31 Mar 2025 | 30 Apr 2025 | 0001326801-25-000054 |
| 10-Q | Quarter to 30 Jun 2024, Exhibit 3.1, the charter | 1 Aug 2024 | 0001326801-24-000069 |
| DEF 14A | 2026 annual meeting | 16 Apr 2026 | 0001628280-26-025532 |
| DEF 14A | 2025 annual meeting | 17 Apr 2025 | 0001326801-25-000040 |
| DEF 14A | 2024 annual meeting | 18 Apr 2024 | 0001326801-24-000034 |
| 8-K | Q2 2026 results, Items 2.02 and 9.01 | 29 Jul 2026 | 0001628280-26-050596 |
| 8-K | 2026 annual meeting vote, Item 5.07 | 29 May 2026 | 0001628280-26-039193 |
| 8-K | May 2026 note offering, Items 8.01 and 9.01 | 4 May 2026 | 0001193125-26-204128 |
| 8-K | Q1 2026 results, Items 2.02 and 9.01 | 29 Apr 2026 | 0001628280-26-028364 |
| 8-K | Directors not standing for reelection, Item 5.02 | 14 Apr 2026 | 0001628280-26-025108 |
| 8-K | FY2025 results, Items 2.02 and 9.01 | 28 Jan 2026 | 0001628280-26-003832 |
| 8-K | Appointment of the President and Vice Chairman, Item 5.02 | 16 Jan 2026 | 0001628280-26-002429 |
| 8-K | Director resignation, Item 5.02 | 19 Dec 2025 | 0001628280-25-058337 |
| 8-K | Derivative settlement stipulation and notice, Items 8.01 and 9.01 | 12 Dec 2025 | 0001628280-25-056768 |
| 8-K | November 2025 note offering, Items 8.01 and 9.01 | 3 Nov 2025 | 0001193125-25-262593 |
| 8-K | Q3 2025 results, Items 2.02 and 9.01 | 29 Oct 2025 | 0001628280-25-047114 |
| 8-K | 2025 annual meeting vote, Item 5.07 | 30 May 2025 | 0001326801-25-000090 |
| 8-K | Base indenture of 9 August 2022, Exhibit 4.1 | 9 Aug 2022 | 0000950103-22-013830 |
| S-3ASR | Shelf registration 333-295425 | 30 Apr 2026 | 0001193125-26-194008 |
| D | Private placement notice, Item 06b | 20 Oct 2014 | 0001168404-14-000008 |
Table 10.2 Section 16 reports cited, Forms 3 and 4
| Reporting person | Event date | Filed | Accession |
|---|---|---|---|
| Susan J. Li | 15 Aug 2026 | 18 Aug 2026 | 0000950103-26-012607 |
| Javier Olivan | 10 Aug 2026 | 12 Aug 2026 | 0000950103-26-012279 |
| Marc L. Andreessen | 4 Aug 2026 | 6 Aug 2026 | 0001160077-26-000008 |
| Mark Zuckerberg | 31 Jul 2026 | 4 Aug 2026 | 0000950103-26-011908 |
| Aaron Anderson | 18 Feb 2026 | 18 Feb 2026 | 0000950103-26-002357 |
| Dina H. Powell McCormick, Form 3 | 12 Jan 2026 | 22 Jan 2026 | 0000950103-26-000872 |
| Curtis J. Mahoney, Form 3 | 7 Jan 2026 | 20 Jan 2026 | 0000950103-26-000702 |
| Robert M. Kimmitt | 26 Nov 2025 | 28 Nov 2025 | 0000950103-25-015482 |
| Susan J. Li | 20 Nov 2025 | 24 Nov 2025 | 0000950103-25-015185 |
| Jennifer Newstead | 19 Nov 2025 | 20 Nov 2025 | 0000950103-25-015119 |
| Mark Zuckerberg | 31 Oct 2025 | 4 Nov 2025 | 0000950103-25-014304 |
The counts in chapter 7 are taken over all 169 Forms 3 and 4 filed against CIK 1326801 in the twelve months to 6 September 2026 and over all 93 Forms 144 and 144/A filed in the same window. The eleven reports above are the ones the chapter cites by accession.
Table 10.3 Schedules 13G naming Meta Platforms, Inc. as subject
| Filer | Form | Event date | Filed | Accession |
|---|---|---|---|---|
| FMR LLC and Abigail P. Johnson | SC 13G/A | 30 Jun 2026 | 6 Aug 2026 | 0000315066-26-002069 |
| Vanguard Capital Management LLC | SC 13G | 31 Mar 2026 | 30 Apr 2026 | 0002100119-26-000840 |
| The Vanguard Group, Inc. | SC 13G/A | 13 Mar 2026 | 27 Mar 2026 | 0000102909-26-001886 |
| FMR LLC and Abigail P. Johnson | SC 13G/A | 29 Dec 2023 | 7 Apr 2025 | 0000315066-25-001054 |
| BlackRock, Inc. | SC 13G/A | 31 Dec 2023 | 12 Feb 2024 | 0001086364-24-006971 |
Table 10.4 Forms 13F-HR read for the institutional register, filed under each manager's own CIK
| Manager | Quarter to 30 Sep 2025 | Quarter to 31 Dec 2025 | Quarter to 31 Mar 2026 | Quarter to 30 Jun 2026 |
|---|---|---|---|---|
| BlackRock, Inc. | 0002012383-25-002949 | 0002012383-26-000920 | 0002012383-26-001841 | 0002012383-26-003238 |
| FMR LLC | 0000315066-25-002929 | 0000315066-26-000611 | 0000315066-26-001390 | 0000315066-26-002260 |
| State Street Corp | 0000093751-25-000651 | 0000093751-26-000100 | 0000093751-26-000315 | 0000093751-26-000507 |
| Geode Capital Management, LLC | 0001214717-25-000016 | 0001214717-26-000003 | 0001214717-26-000006 | 0001214717-26-000008 |
| Vanguard Capital Management LLC | n/a | n/a | n/a | 0002100119-26-001527 |
BlackRock's report for the quarter to 31 March 2026 is listed for completeness and its share count is not carried in Table 6.3.
Table 10.5 Comparator filings cited in chapter 4
| Company | Form and period | Accession |
|---|---|---|
| Alphabet Inc. | 10-K, FY2025 | 0001652044-26-000018 |
| Alphabet Inc. | 10-Q, six months to 30 Jun 2026 | 0001652044-26-000071 |
| Microsoft Corporation | 10-K, year to 30 Jun 2026 | 0001193125-26-323660 |
| Amazon.com, Inc. | 10-K, FY2025 | 0001018724-26-000004 |
| Amazon.com, Inc. | 10-Q, six months to 30 Jun 2026 | 0001018724-26-000026 |
| Apple Inc. | 10-K, year to 27 Sep 2025 | 0000320193-25-000079 |
| Apple Inc. | 10-Q, nine months to 27 Jun 2026 | 0000320193-26-000020 |
| Snap Inc. | 10-K, FY2025 | 0001564408-26-000013 |
| Snap Inc. | 10-Q, six months to 30 Jun 2026 | 0001564408-26-000052 |
| Pinterest, Inc. | 10-K, FY2025 | 0001506293-26-000021 |
| Pinterest, Inc. | 10-Q, six months to 30 Jun 2026 | 0001506293-26-000104 |
| Reddit, Inc. | 10-K, FY2025 | 0001713445-26-000022 |
| Reddit, Inc. | 10-Q, six months to 30 Jun 2026 | 0001713445-26-000100 |
Disclaimer
This report is not financial advice, and it is not an offer, a solicitation or a recommendation to buy, sell or hold any security. It is independent analysis of public filings, prepared for information only. It is not a publication of the Securities and Exchange Commission, and the SEC has neither reviewed nor endorsed it. No investment objective, financial situation or particular need of any reader has been considered.
The filing record behind it is the one set out under the headline and in the Sources appendix: three annual reports on Form 10-K covering FY2023 to FY2025, five quarterly reports on Form 10-Q covering the quarters from March 2025 to June 2026, thirteen current reports on Form 8-K filed since May 2025, three proxy statements on Form DEF 14A, the Section 16 reports and Forms 144 filed in the twelve months to 6 September 2026, the Schedules 13G filed over the two years to that date, and the Forms 13F-HR filed by holders under their own CIKs. The most recent audited period is the year to 31 December 2025 and the most recent reported period is the quarter to 30 June 2026; nothing later than the Form 10-Q filed on 29 July 2026 and the Form 8-K filed the same day has been reported by the company. Meta Platforms is a large accelerated filer with a full annual and quarterly record, so no part of this report rests on an unaudited or interim substitute for an annual report.
Figures described as filed are reproduced from those documents. Everything else, including every growth rate, margin, return, multiple, word count and each of the three cases in chapter 9, is this report's own arithmetic or estimate on stated assumptions, and each of those assumptions may prove wrong. Forward looking statements taken from the filings are management's own and were current only at the date filed; a later filing may already have changed them. Market prices move, and the closing prices of 4 September 2026 used throughout will not be the prices at which any reader can transact.