Insights derived from analysing SEC filings. Independent analysis, not a publication of the SEC.
Figures are read from the Forms 10-K for FY2021 to FY2025, the Forms 10-Q for 2023 to 2026, the Forms 8-K from Jul 2024 to Jul 2026 and their quarterly earnings exhibits 99.1, the 2026 proxy statement, Schedules 13D and 13G, Forms 13F and Forms 3, 4 and 5 on the record for central index key 1065280, together with the comparable filings of seven peers. Accession numbers for every filing used appear in the Sources appendix. Market prices are the closing prices of 29 September 2026.
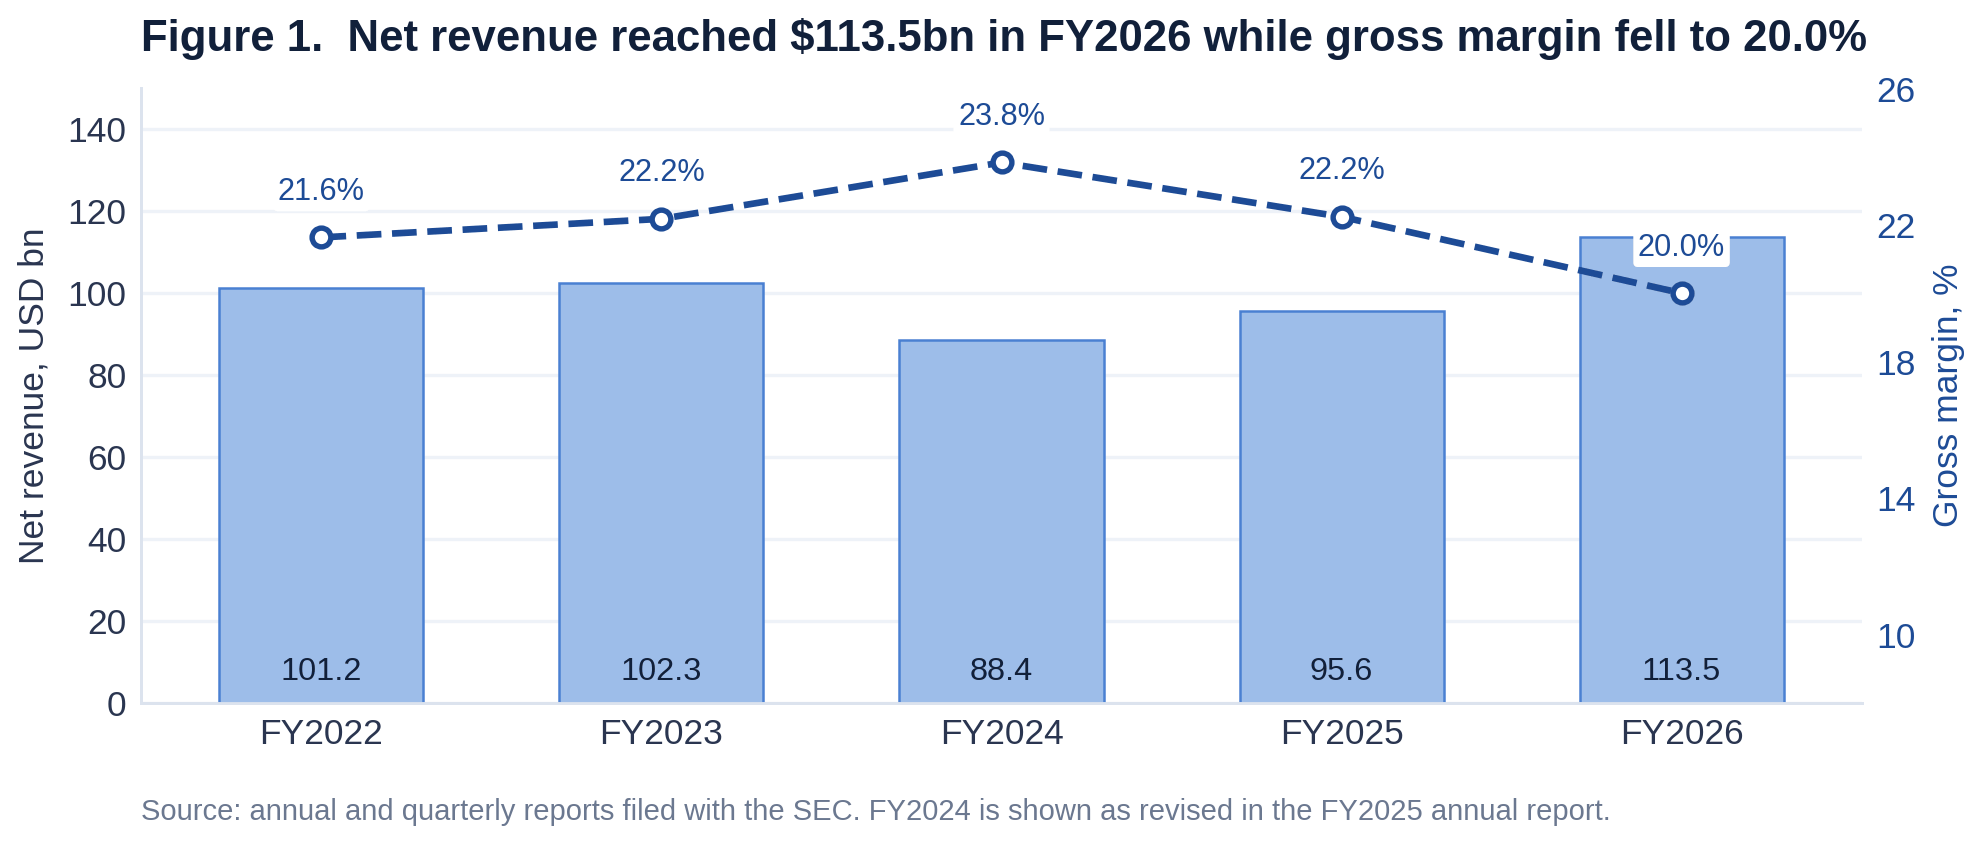
Revenue growth is slowing while margins keep rising. FY2025 revenue was USD 45.2bn (+15.9%) at a
29.5% operating margin. FY2026 guidance is USD 51.0bn to 51.4bn (+13% to 14%) at 31.5%. Guided Q3 2026 growth of
11.7% is the lowest of the eleven quarters from Q1 2024, against 17.6% in Q4 2025.
Content efficiency explains most of the margin gain. Content amortization fell from 44.4% of revenue in FY2022
to 35.8% TTM (8.6 points), while operating margin rose 11.9 points to 29.7%.
Cash content spend ran at 1.04x amortization in FY2025, against 1.45x in FY2021.
Free cash flow goes to buybacks. FY2025 FCF was USD 9.5bn and repurchases USD 9.1bn (96% of FCF). Shares outstanding fell
6.2% from end FY2021 to 30 Jun 2026. Q2 2026 repurchases were USD 4.7bn at an average of about USD 88 per share; USD 27.1bn of authorization
remains, 9.3% of market capitalization.
Netflix earns the highest streaming margin among media peers. TTM operating margin of 29.7% compares with
18.4% at Disney (segment basis), 14.7% at Comcast, 3.7% at Paramount Skydance and (3.5%) at Warner Bros. Discovery; Alphabet reports 33.1%.
In US TV time, Netflix held 7.9% in June 2026 against 13.5% for YouTube (Nielsen).
The share price fell 43% from its 52 week closing high of USD 124.14 (21 Oct 2025) to USD 70.31, spanning the Warner Bros. Discovery
bid (Dec 2025 to Feb 2026) and slower growth guidance. The stock trades at 22.1x TTM GAAP EPS and 25.2x core EPS, which excludes
the USD 2.8bn WBD termination fee and the USD 619m Brazil tax charge.
Scenario values for end 2029 are USD 60 (worst), 122 (base) and 184 (best) per share.
The current price equals 19.9x worst case, 13.9x base case and 11.4x best case FY2029 core EPS.
Exit multiple and FY2029 operating margin drive the widest range in the sensitivity analysis.
Views on these results differ. Arguments for a lower multiple cite decelerating revenue growth, view hours up 2% in H1 2026
and YouTube's larger share of TV time. Arguments for a higher multiple cite rising margins, the USD 3bn ad revenue target for 2026 and buyback capacity. This report presents
filed data and model arithmetic; it is not financial advice.
Netflix reports one segment. Revenue comes from monthly membership fees; paid plans ranged from USD 1 to USD 38 a month at 30 Jun 2026
(10-Q 0001065280-26-000212). Advertising, consumer products and live experiences are other revenue sources; the company describes them as immaterial
for 2023 to 2025.
Members and pricing. Paid memberships exceeded 325m at the end of 2025 (Q4 2025 letter). Netflix stopped reporting memberships and ARM in 2025;
FY2024 ARM was USD 11.70 a month (FY2021: USD 11.67). H1 2026 price increases in the US, Mexico and Spain met company
expectations (Q2 2026 letter).
Advertising. Ad revenue exceeded USD 1.5bn in 2025, more than 2.5x 2024. The 2026 target is about USD 3bn, 5.9% of guided revenue.
The ad plan (USD 8.99 in the US) took more than 60% of sign ups in ad markets in Q1 2026; advertisers exceeded 4,000 (+70%).
Live and engagement. Live events take just over 5% of content spend and about 1% of view hours; 6 of the 10 largest sign up days in five years
came from live events (Q2 2026 interview). View hours were 96bn in H2 2025 (+2%) and more than 97bn in H1 2026 (+2%).
FX. 56% of FY2025 revenue and 31% of operating expenses were in non USD currencies (Item 7A). FX reduced FY2025 growth by about 1 point and
added about 2 points in H1 2026.
Table 1.1. Revenue by region, USD bn, and growth
Region
FY2021
FY2022
FY2023
FY2024
FY2025
TTM
FY2025 y/y
H1 2026 y/y
TTM share
UCAN
13.0
14.1
14.9
17.4
20.0
21.1
15.0%
11.8%
43.6%
EMEA
9.7
9.7
10.6
12.4
14.5
15.6
17.2%
15.7%
32.3%
LATAM
3.6
4.1
4.4
4.8
5.4
5.9
10.7%
20.0%
12.1%
APAC
3.3
3.6
3.8
4.4
5.4
5.8
21.3%
17.7%
12.0%
Total streaming
29.5
31.5
33.6
39.0
45.2
48.4
15.9%
14.7%
100.0%
FY2021 to FY2023 totals include DVD revenue of USD 182m, 146m and 83m. FY2025 revenue includes hedging losses of USD 91m.
H1 2026 revenue rose 14.7% to USD 24.8bn and operating income 14.4% to USD
8.1bn. Q2 2026 operating margin was 33.4%, against 34.1% in Q2 2025, as technology and marketing costs grew faster than
revenue (10-Q, MD&A). TTM ROE of 49.5% includes the USD 2.8bn WBD fee; FY2025 ROE was 42.8%.
Table 2.1. Income statement, USD bn; TTM = Q3 2025 to Q2 2026
USD bn
FY2021
FY2022
FY2023
FY2024
FY2025
TTM
Revenue
29.70
31.62
33.72
39.00
45.18
48.37
Cost of revenues
(17.33)
(19.17)
(19.72)
(21.04)
(23.28)
(24.61)
Gross profit
12.37
12.45
14.01
17.96
21.91
23.76
Sales and marketing
(2.55)
(2.53)
(2.66)
(2.92)
(3.30)
(3.57)
Technology and development
(2.27)
(2.71)
(2.68)
(2.93)
(3.39)
(3.71)
General and administrative
(1.35)
(1.57)
(1.72)
(1.70)
(1.89)
(2.13)
Operating income
6.19
5.63
6.95
10.42
13.33
14.35
Interest expense
(0.77)
(0.71)
(0.70)
(0.72)
(0.78)
(0.85)
Interest and other income
0.41
0.34
(0.05)
0.27
0.17
2.99
Income tax
(0.72)
(0.77)
(0.80)
(1.25)
(1.74)
(2.84)
Net income
5.12
4.49
5.41
8.71
10.98
13.65
Diluted EPS, USD (split adjusted)
1.12
0.99
1.20
1.98
2.53
3.18
Diluted shares, bn
4.55
4.51
4.49
4.39
4.34
4.30
FY2025 sales and marketing is the renamed marketing line. TTM diluted shares are the average of three reported quarters; derived Q4 2025 EPS of USD 0.56 is from the Q4 2025 letter.
Table 2.2. What changed: FY2025 against FY2024 and H1 2026 against H1 2025, USD bn
Full year
First half
USD bn
FY2024
FY2025
Change
H1 2025
H1 2026
Change
Revenue
39.00
45.18
15.9%
21.62
24.81
14.7%
Cost of revenues
21.04
23.28
10.6%
10.59
11.93
12.6%
Content amortization
15.30
16.42
7.3%
7.66
8.53
11.4%
Sales and marketing
2.92
3.30
13.2%
1.40
1.67
18.9%
Technology and development
2.93
3.39
15.9%
1.65
1.97
19.4%
General and administrative
1.70
1.89
10.9%
0.86
1.10
27.7%
Operating income
10.42
13.33
27.9%
7.12
8.15
14.4%
Net income
8.71
10.98
26.1%
6.02
8.68
44.4%
Operating cash flow
7.36
10.15
37.9%
5.21
7.03
34.9%
Free cash flow
6.92
9.46
36.7%
4.93
6.62
34.3%
Content cash additions
16.22
17.10
5.4%
7.39
9.77
32.3%
Share repurchases
6.26
9.13
45.7%
5.19
5.98
15.3%
Operating margin
26.7%
29.5%
2.8 pts
32.9%
32.8%
(0.1) pts
Table 2.3. Core earnings reconciliation, USD bn
USD bn
FY2025
TTM
Operating income, GAAP
13.33
14.35
Add: Brazil non income tax charge of USD 619m (Q3 2025)
0.62
0.62
Operating income, core
13.95
14.97
Operating margin, core
30.9%
31.0%
Net income, GAAP
10.98
13.65
Add: Brazil charge (treated as non deductible)
0.62
0.62
Less: WBD termination fee after tax (Q1 2026)
0.00
(2.26)
Net income, core
11.60
12.01
Diluted EPS, GAAP / core, USD
2.53 / 2.67
3.18 / 2.79
WBD fee taxed at the Q1 2026 effective rate of 19.3%. Sources: 8-K 0001065280-25-000404 (Brazil), 8-K 0001193125-26-082247 (fee).
Table 2.4. Ratio analysis, FY2021 to FY2025 and TTM
Ratio
FY2021
FY2022
FY2023
FY2024
FY2025
TTM
Growth
Revenue growth
n/a
6.5%
6.7%
15.6%
15.9%
16.0%
EPS growth
n/a
(11.5%)
20.9%
64.8%
27.6%
n/a
Profitability
Gross margin
41.6%
39.4%
41.5%
46.1%
48.5%
49.1%
Operating margin
20.9%
17.8%
20.6%
26.7%
29.5%
29.7%
Net margin
17.2%
14.2%
16.0%
22.3%
24.3%
28.2%
FCF margin
(0.4%)
5.1%
20.5%
17.7%
20.9%
23.1%
ROE
32.3%
24.5%
26.1%
38.4%
42.8%
49.5%
ROA
11.5%
9.6%
11.1%
17.0%
20.1%
24.5%
ROIC (after tax)
17.4%
13.7%
17.3%
22.6%
28.0%
26.7%
Cost structure
Content amortization / revenue
41.2%
44.4%
42.1%
39.2%
36.3%
35.8%
Marketing / revenue
8.6%
8.0%
7.9%
7.5%
7.3%
7.4%
Tech and development / revenue
7.7%
8.6%
7.9%
7.5%
7.5%
7.7%
SBC / revenue
1.4%
1.8%
1.0%
0.7%
0.8%
1.0%
Content cash / amortization
1.45x
1.20x
0.88x
1.06x
1.04x
1.13x
Effective tax rate
12.4%
14.7%
12.9%
12.6%
13.7%
17.2%
Efficiency and liquidity
Asset turnover
0.67x
0.68x
0.69x
0.76x
0.83x
0.87x
Current ratio
0.95x
1.17x
1.12x
1.22x
1.19x
1.14x
Leverage
Debt / equity
0.97x
0.69x
0.71x
0.63x
0.54x
0.47x
Net debt / EBITDA
1.46x
1.39x
1.01x
0.56x
0.40x
0.35x
Interest coverage
8.1x
8.0x
9.9x
14.5x
17.2x
16.9x
Capital return and valuation
Buybacks / FCF
n/a
0%
87%
90%
96%
89%
P/E at year end
53.6x
29.6x
40.5x
44.9x
37.1x
22.1x
FCF yield at year end
0.0%
1.2%
3.3%
1.8%
2.4%
3.8%
Returns use average equity and assets. EBITDA = operating income plus depreciation of property; content amortization stays in operating costs. P/E and FCF yield use split adjusted closes.
Table 2.5. Balance sheet and liquidity, USD bn, period end
USD bn
FY2021
FY2022
FY2023
FY2024
FY2025
30 Jun 2026
Cash and short term investments
6.03
6.06
7.14
9.58
9.06
9.13
Content assets, net
30.92
32.74
31.66
32.45
32.78
33.84
Total assets
44.58
48.59
48.73
53.63
55.60
58.45
Content liabilities, on balance sheet
7.39
7.56
7.04
6.17
5.66
5.49
Total debt
15.39
14.35
14.54
15.58
14.46
14.31
Net debt
9.37
8.29
7.41
6.00
5.40
5.18
Stockholders' equity
15.85
20.78
20.59
24.74
26.62
30.15
Shares outstanding, bn (split adjusted)
4.44
4.45
4.33
4.28
4.22
4.16
Total content obligations were USD 25.1bn at 30 Jun 2026, of which USD 19.6bn sat off the balance sheet. Senior notes of USD 14.4bn are fixed rate across 12 tranches maturing 2026 to 2054; USD 1.0bn of 5.25% notes due 2036 were issued in Jul 2026 to repay the Nov 2026 notes.
Management raised the FY2026 FCF target to about USD 12.5bn after the WBD fee and narrowed the revenue range to USD 51.0bn to 51.4bn.
Table 3.1. Company guidance and actuals
Item
FY2025 actual
FY2026 guide, Jan 2026
FY2026 guide, Jul 2026
Q3 2026 guide
Revenue
USD 45.2bn (+15.9%)
USD 50.7bn to 51.7bn
USD 51.0bn to 51.4bn (+13% to 14%)
USD 12.86bn (+11.7%)
Operating margin
29.5%
31.5%
31.5%
33.2%
Free cash flow
USD 9.5bn
about USD 11bn
about USD 12.5bn (incl. fee)
n/a
Diluted EPS
USD 2.53
n/a
n/a
USD 0.82
Ad revenue
above USD 1.5bn
about USD 3bn
about USD 3bn
n/a
Content
USD 16.4bn amortization; 1.04x cash
cash about 1.1x amortization
amortization +10%
n/a
Sources: shareholder letters, 8-K Ex 99.1 0001065280-26-000033 and 0001065280-26-000211.
MD&A, FY2025 10-K. Growth came from more members, price increases and ad revenue. Cost of revenues was 52% of revenue; content amortization
rose USD 1.1bn and other cost of revenues USD 1.1bn, mainly the Brazil charge. Content obligations of USD 24.0bn at year end included USD 11.5bn due within one year.
MD&A, Q2 2026 10-Q. H1 revenue +15% (+13% FX neutral). Netflix paid USD 729m on Brazil tax assessments in H1 2026 and made an acquisition
for about USD 587m. 57% of revenue was in non USD currencies.
Earnings interview, 16 Jul 2026 (Netflix investor relations transcript). CFO Spencer Neumann said 2026 tracks the plan: about USD 6bn of added revenue
and content expense growth of about 10%. Co CEO Greg Peters said revenue per member on the ad plan is closing the gap with the standard plan. Co CEO Ted
Sarandos said Netflix prefers building its own business to acquisitions when asked about M&A, and said generative AI has been used on about 300 titles.
Themes management flags. Guild contracts (WGA, SAG AFTRA, DGA) all expire in 2026 (Item 1A). Live sports expand in 2026 and 2027: NFL games on
Christmas, Thanksgiving Eve, week 1 and the final week, plus boxing, WWE and MLB events.
Netflix combines the second highest TTM operating margin in the peer set (29.7%, behind Alphabet at 33.1%) with
14.7% H1 2026 growth. Legacy media peers grew between (6.3%) and 6.2% and their streaming units earned between (20.4%) and 12.6% in FY2025.
TV time. Streaming reached 49.0% of US TV viewing in Jul 2026 (broadcast 19.5%, cable 18.7%); YouTube held 14.2%. In Jun 2026 Netflix held 7.9%
and YouTube 13.5% (Nielsen, The Gauge). Nielsen changes its measurement basis from the new TV season.
Consolidation. Paramount Skydance agreed to acquire Warner Bros. Discovery after WBD ended its agreement with Netflix on 27 Feb 2026; about
USD 44.4bn of notes for that deal were in the market in late Sep 2026. Comcast spun off its cable networks (Versant) on 2 Jan 2026.
Advertising market. Industry estimates of US connected TV ad spend for 2026 range from USD 29.3bn to USD 38.0bn; the
Netflix target of USD 3bn equals 8% to 10% of that range.
Valuation. Netflix trades at 22.1x TTM earnings (Disney 21.8x, Alphabet 16.8x, Comcast 7.0x)
and 20.2x EV/EBITDA (Disney 9.4x, Alphabet 23.0x).
Table 4.1. Peer comparison, TTM to Jun 2026 (Disney to Jun 2026 fiscal Q3); market data at 27 to 29 Sep 2026
Company
Revenue, bn
Growth, H1 y/y
Operating margin
FCF margin
Net debt / EBITDA
Market cap, USD bn
P/E TTM
EV / EBITDA
Netflix
48.4
14.7%
29.7%
23.1%
0.35x
293
22.1x
20.2x
Disney
98.9
6.2%
18.4%
8.4%
1.72x
182
21.8x
9.4x
Warner Bros. Discovery
36.1
(6.3%)
(3.5%)
6.0%
7.53x
77
n/m
27.9x
Paramount Skydance
29.1
1.6%
3.7%
1.6%
5.59x
11
n/m
10.2x
Spotify (EUR)
18.1
11.1%
14.6%
18.0%
(3.41x)
102
33.1x
n/a
Roku
5.2
22.1%
5.2%
13.6%
(7.47x)
23
113.6x
59.2x
Alphabet
445.9
23.1%
33.1%
11.9%
(0.82x)
4,125
16.8x
23.0x
Comcast
124.9
2.0%
14.7%
16.4%
2.43x
77
7.0x
4.7x
Disney operating margin uses total segment operating income. Growth for Disney is nine months of FY2026. n/m: negative earnings. EV/EBITDA computed from latest filed net debt and TTM operating income plus D&A.
Table 4.2. Streaming units, FY2025
Company
Unit
Revenue, bn
Margin
Measure
Subscribers, m
Netflix
Whole company
45.2
29.5%
GAAP operating income
above 325 (end 2025)
Disney
Direct to Consumer
24.6
5.4%
DTC operating income
Disney+ 131.6; Hulu 64.1
Warner Bros. Discovery
Streaming
10.9
12.6%
Adjusted EBITDA
n/a
Paramount Skydance
Direct to Consumer
8.6
2.7%
Adjusted OIBDA
Paramount+ 78.9
Comcast
Peacock
5.4
(20.4%)
Revenue less costs
44
Spotify (EUR)
Premium
15.3
33.7%
Segment gross margin
290 premium
Alphabet
YouTube ads
40.4
n/a
profit undisclosed
n/a
Measures differ across companies. Peacock result derived from disclosed revenue and costs. Spotify premium subscribers at FY2025 end.
The Warner Bros. Discovery transaction dominated the last twelve months: Netflix signed on 5 Dec 2025, moved to all cash on 20 Jan 2026 and
received a USD 2.8bn termination fee on 27 Feb 2026 when WBD accepted a Paramount Skydance offer. All deal financing then terminated.
Table 5.1. Form 8-K events, Jun 2025 to Jul 2026
Filed
Items
Event
30 Jul 2026
5.02
Director Anne Sweeney resigned (effective 26 Jul 2026)
22 Jul 2026
8.01
USD 1.0bn 5.25% notes due 2036 issued to repay 4.375% notes due Nov 2026
16 Jul 2026
2.02
Q2 2026 results; FY2026 revenue range narrowed to USD 51.0bn to 51.4bn
5 Jun 2026
5.07, 8.01
Annual meeting results; Jay Hoag named independent Chairman
Q1 2026 results; Reed Hastings to leave the board at the 2026 annual meeting
27 Feb 2026
1.02
WBD merger agreement terminated; Netflix received USD 2.8bn termination fee
20 Jan 2026
1.01, 2.02
Q4 2025 results; WBD offer amended to all cash at USD 27.75 per share; bridge USD 42.2bn
22 Dec 2025
1.01, 2.03
USD 5bn revolving credit facility and USD 20bn delayed draw term loans
5 Dec 2025
1.01, 7.01
Agreement to acquire Warner Bros. (studios, HBO, HBO Max); EV USD 82.7bn, USD 59bn bridge
14 Nov 2025
5.03
Charter amendment; 10 for 1 stock split effective
4 Nov 2025
5.02
Executive severance plan and equity award amendments
21 Oct 2025
2.02
Q3 2025 results; USD 619m Brazil non income tax charge
17 Jul 2025
2.02
Q2 2025 results
24 Jun 2025
5.02, 8.01
Board rejected Jay Hoag's resignation after a failed majority vote
24 Form 8-K filings from Jul 2024 to Sep 2026; full log with accession numbers in the appendix data. Earnings exhibits are Ex 99.1 shareholder letters.
Table 5.2. FY2025 10-K items and Q2 2026 10-Q updates
Item
Content
Item 1, Business
One segment; about 16,000 employees (68% in UCAN); membership and ARM reporting ended in 2025.
Item 1A, Risk factors
33 risks, up from 31. New: two WBD transaction risks (USD 5.8bn reverse fee, integration). Reworded: debt (WBD financing), labor (2026 guild expiries), regulation (EU DMA), reputation (now covers ads). Generative AI added to IP and device partner risks. The Q2 2026 10-Q reports the risk factors unchanged in substance.
Item 1C, Cybersecurity
Enterprise program with bug bounty and red team testing; Audit Committee oversight; past incidents immaterial.
Item 3, Legal proceedings
Ordinary course claims including patents. Brazil non income tax: USD 619m probable loss expensed Q3 2025; USD 729m paid in H1 2026.
Item 5, Equity
Q4 2025 repurchases 18.9m shares at about USD 110; FY2025 86.5m shares for USD 9.1bn. Dividends: none paid to date.
Item 7A, Market risk
56% of revenue in non USD currencies. A 10% weaker USD lowers the revenue hedge value by USD 2.3bn (AOCI). Debt all fixed rate.
Item 9A, Controls
Controls effective; Ernst & Young issued a clean opinion.
10-K 0001065280-26-000034; 10-Q 0001065280-26-000212; risk factor comparison against 10-K 0001065280-25-000044.
Shareholders elected all 12 directors and approved the auditor and say on pay; all four shareholder proposals failed. Holders of
3.60bn of 4.21bn shares (85.6%) were represented, against 86.7% in 2025.
Jay Hoag received 93.1% support, up from 21.6% in 2025, and became independent Chairman after the meeting.
Board changes. Reed Hastings left the board at the meeting (8-K 0001065280-26-000137); Jay Hoag became independent Chairman and the separate
Lead Independent Director role ended (8-K 0001065280-26-000189). Anne Sweeney resigned on 26 Jul 2026 (8-K 0001065280-26-000214), leaving 11 directors.
2025 meeting. Hoag received 21.6% support and offered his resignation; the board rejected it on 22 Jun 2025, citing 2024 attendance below 75%
as the likely cause of the vote (8-K 0001065280-25-000287).
Pay. Say on pay support fell from 85.6% to 83.7%. 2025 total pay was USD 53.9m for
Ted Sarandos and USD 53.2m for Greg Peters, each with USD 41.4m in stock awards and a bonus at 117.6% of target; CEO pay ratios 255:1 and 252:1 (DEF 14A 0001193125-26-159286).
Shareholder rights. The written consent proposal drew 44.6%, the highest support for a shareholder proposal at the two
meetings; a resubmitted 2025 proposal drew 42.2%.
Table 6.1. Proposals and support, 2026 and 2025 meetings (for as % of for plus against)
Proposal
Board view
2026
2025
Outcome
2. Ratify Ernst & Young as auditor
For
96.8%
98.5%
Approved
3. Say on pay
For
83.7%
85.6%
Approved
4. Shareholder right to act by written consent (shareholder)
Against
44.6%
n/a
Rejected
5. ESG ROI Report (shareholder)
Against
1.0%
n/a
Rejected
6. Politicized Brand Misalignment (shareholder)
Against
1.0%
n/a
Rejected
7. Cumulative Voting (shareholder)
Against
3.0%
n/a
Rejected
2025: Climate transition plan (shareholder)
Against
n/a
10.5%
Rejected
2025: Resubmitted proposal with 45% prior support (shareholder)
Broker non votes: 413.5m in 2026 and 36.5m in 2025 (pre split) on each item except the auditor. Sources: 8-K 0001065280-26-000189 and 0001065280-25-000286.
Table 6.2. Director elections, support as % of for plus against
Director
2026
2025
Richard Barton
90.8%
91.0%
Elinor Mertz
91.2%
n/a
Jay Hoag
93.1%
21.6%
Ann Mather
93.4%
95.3%
Leslie Kilgore
94.9%
95.8%
Brad Smith
95.9%
97.1%
Susan Rice
96.2%
98.5%
Anne Sweeney
96.2%
96.7%
Strive Masiyiwa
96.4%
97.4%
Mathias Dopfner
97.2%
97.7%
Ted Sarandos
98.5%
98.1%
Greg Peters
98.5%
98.1%
Reed Hastings (left the board 2026)
n/a
95.3%
Lowest 2026 support: Richard Barton. All directors required a majority of votes cast.
Insiders sold USD 402.5m of stock and bought none in the twelve months to Sep 2026; 95% of sales ran under Rule 10b5-1 plans, and Reed
Hastings accounted for USD 309m. Vanguard (8.4%) and BlackRock (8.4%) are the largest holders.
Table 6.3. Largest institutional holders from Form 13F, shares m
Holder
30 Jun 2026
% of shares
31 Mar 2026
31 Dec 2025
Change since Dec 2025
Vanguard
350.1
8.4%
349.8
390.0
(10.2%)
BlackRock, Inc.
348.8
8.4%
n/a
348.5
0.1%
State Street Corp
180.1
4.3%
171.7
176.8
1.9%
FMR LLC
135.9
3.3%
204.7
195.8
(30.6%)
Invesco Ltd.
135.4
3.3%
88.6
95.2
42.3%
Geode Capital Management
110.3
2.6%
103.5
99.6
10.8%
Morgan Stanley
99.7
2.4%
99.0
85.3
16.8%
T. Rowe Price Associates
93.6
2.2%
99.0
86.1
8.7%
Capital World Investors
87.3
2.1%
99.1
89.3
(2.2%)
Capital Research Global Investors
68.7
1.6%
68.0
42.4
62.2%
Holders selected from the largest asset managers, a subset of the 3,486 filers holding NFLX; n/a: filing unretrieved. Invesco figures use amended 13F-HR/A filings. 13G: Vanguard 7.49% (Mar 2026); FMR 3.3% (Jun 2026).
Table 6.4. Insider sales, Oct 2025 to Sep 2026, USD m (Form 4)
Insider
Role
Sales
Of which 10b5-1
Reed Hastings
Director
308.9
308.9
David Hyman
Chief Legal Officer
38.0
36.7
Greg Peters
Co CEO
17.7
8.8
Spencer Neumann
CFO
17.0
13.9
Ted Sarandos
Co CEO
14.4
9.7
Bradford Smith
Director
5.6
5.6
Others (2)
Officer, director
0.9
0.3
Total
402.5
384.0
179 Form 4 filings. Open market purchases: zero. Grants and option exercises excluded from the sales totals.
The P/E multiple fell from 44.9x at end 2024 to 22.1x while TTM EPS rose to USD 3.18;
the price is near its Jun 2024 close of USD 67.49. Company buybacks in Q2 2026 averaged about USD 88 per share, 25% above the 29 Sep 2026 close.
On model assumptions anchored to FY2026 guidance, FY2029 core EPS reaches USD 3.53 (worst), USD
5.07 (base) and USD 6.14 (best), against USD 3.08 implied for FY2026. Implied values per
share at end 2029 are USD 60, 122 and 184.
Table 8.1. Scenario assumptions, FY2027 to FY2029
Driver
Worst
Base
Best
Subscription revenue growth 2027 / 2028 / 2029
5.0% / 4.0% / 3.5%
8.5% / 8.0% / 7.5%
11.0% / 10.5% / 10.0%
Ad revenue 2027 / 2028 / 2029, USD bn
3.5 / 3.9 / 4.3
4.3 / 5.6 / 6.8
5.0 / 7.0 / 9.0
Operating margin 2027 / 2028 / 2029
31.0% / 30.5% / 30.0%
33.0% / 34.5% / 36.0%
34.5% / 37.0% / 39.0%
Diluted share count change a year
(1.5%)
(2.5%)
(3.0%)
Exit P/E on FY2029 core EPS
17x
24x
30x
Common to all
FY2026 anchor: revenue USD 51.2bn (guidance midpoint), ads USD 3.0bn, margin 31.5%. Net interest and other USD (0.6)bn a year; tax rate 16%.
Demand. Revenue splits into subscription (members times price) and advertising. Base case subscription growth of 8.5% to 7.5% combines low single
digit member growth with price increases; the worst case assumes 3.5% to 5% as member growth stalls in UCAN and EMEA, which hold 76% of revenue.
Margin. Base case margin rises 1.5 points a year, the FY2025 to FY2026 guided pace (29.5% to 31.5%) slowed by a quarter. The worst case lets margin slip
to 30% from renewed content and sports rights cost growth.
Per share. Buybacks reduce diluted shares 1.5% to 3% a year; the FY2021 to FY2025 average was 1.2% a year.
Excluded. Large acquisitions, changes in the tax regime, FX moves beyond FY2026 guidance and one off items such as the WBD fee.
The exit multiple moves base case value by USD 101 to 142 across 20x to 28x; FY2029 margin between 33% and 39%
moves it by USD 111 to 132. In Figure 9.1 only the 16x P/E and 30% margin cell falls below today's price (USD 67). At a 24x multiple, every combination of
5% to 13% revenue CAGR and 30% to 42% margin exceeds USD 70.31; the lowest cell in Table 9.1 is USD 88.
Table 9.1. Value per share, end 2029, by revenue CAGR and FY2029 operating margin, 24x exit P/E
Margin \ CAGR
5%
7%
9%
11%
13%
30%
88
94
99
105
111
33%
97
103
109
116
122
36%
106
113
119
126
133
39%
116
122
130
137
145
42%
125
132
140
148
156
Shading: values above USD 110 in blue.
Revenue. A 1 point revenue shortfall in FY2027 at an unchanged cost base reduces FY2027 core EPS by about USD 0.11.
FX. With 56% to 57% of revenue in non USD currencies, a 10% stronger USD would reduce reported revenue by about 5.7% before hedges;
the revenue hedge program offsets part of this (hedge value sensitivity USD 2.3bn per 10%, Item 7A).
Rates. All senior notes are fixed rate, so rate moves affect refinancing only: USD 1.0bn matures in Nov 2026 (refinanced) and USD 1.5bn in May 2027.
Data. Financial statements from XBRL in the 10-K for FY2021 to FY2025 and 10-Q filings for Q1 2023 to Q2 2026, retrieved through the SEC-API.io MCP
server. Q4 figures equal the full year less the nine month year to date. Per share data are adjusted for the 10 for 1 split of 14 Nov 2025.
Other sources. Earnings interview transcript of 16 Jul 2026 from Netflix investor relations. Peer data from peer 10-K, 10-Q, 20-F and 6-K filings.
TV share: Nielsen. Market prices: 27 to 29 Sep 2026.
Definitions. FCF = operating cash flow less purchases of property and equipment. Core earnings exclude the Brazil charge and the WBD fee
(Table 2.3). EBITDA = operating income plus depreciation of property. Net debt = total debt less cash and short term investments. ROIC = operating income after
tax over debt plus equity.
Scenario model. Revenue = subscription revenue grown at scenario rates plus scenario ad revenue. EPS = (revenue x margin less USD 0.6bn) x (1 less 16%)
over diluted shares. Implied value = FY2029 EPS x exit P/E, undiscounted. These are model outputs, separate from company guidance, which covers FY2026 only.
Disclaimer: for information only, not financial advice. This report is not a recommendation to buy, sell or hold any
security. Figures come from SEC filings retrieved through the SEC-API.io MCP server and from the sources named above. Scenario values are arithmetic
results of stated assumptions. Consult a licensed adviser before investing.