Applied Materials, Inc. (AMAT), Financial Analysis
Insights derived from analysing SEC filings. Independent analysis, not a publication of the SEC.
Figures are read from the Forms 10-K for FY2021 to FY2025, the Forms 10-Q for Q3 FY2013, Q2 FY2022 and Q1 FY2025 to Q3 FY2026, the Forms 8-K of November 2024 to August 2026 with their quarterly earnings exhibits 99.1, credit agreement exhibits 10.1 and supplemental indenture exhibit 4.1, the proxy statement of January 2026, Schedules 13G, Forms 13F and Forms 3, 4 and 144 on the record for central index key 6951, together with the comparable filings of seven peers and three chip makers. Accession numbers for every filing used appear in the Sources appendix. Market prices are closing prices of 9 October 2026.
Applied Materials (AMAT) guides Q4 FY2026 revenue to $10.25bn, 50.7% above Q4 FY2025, after Q3 FY2026 revenue of $9.12bn, up 25%. China supplied 28% of Q3 revenue against 35% a year earlier. Shares closed at $507.03 on 9 October 2026, 43.7x diluted GAAP EPS of $11.60 for the trailing twelve months (TTM).
Key findings
- Q3 FY2026 (quarter ended 26 July 2026) revenue was $9.12bn, up 25% year on year, with GAAP operating margin of 33.7% (30.6% a year earlier), diluted GAAP EPS of $3.17 and non GAAP EPS of $3.50; Q4 FY2026 guidance is revenue of $10.25bn ± $500m and non GAAP EPS of $4.02 ± $0.20.
- China revenue was $2.51bn in Q3 FY2026, 28% of total, against 35% a year earlier and 37% in FY2024; on 11 February 2026 the company settled with the Bureau of Industry and Security (BIS) for $252.5m, and the Department of Justice and the SEC closed their inquiries with no enforcement action.
- Cash and investments were $14.50bn and debt $6.54bn at 26 July 2026, net cash of $7.96bn; TTM free cash flow (FCF, operating cash flow less capital expenditure) was $5.62bn, 18.2% of revenue, with capital expenditure at 9.0% of TTM revenue against 4.4% in FY2024.
- At $507.03 shares trade at 12.8x enterprise value (EV) to TTM sales, 43.7x price to earnings (P / E) and 71.6x P / FCF, against medians of 14.0x, 55.4x and 60.9x for seven equipment peers; TTM revenue growth was 7.8% against a peer median of 11.7%.
- Cost of shares repurchased was $400m in Q3 FY2026 against $1.04bn a year earlier, the quarterly dividend rose 15% to $0.53 per share in March 2026, and repurchase authority of $12.8bn remained at 26 July 2026.
- One class of common stock carries one vote per share; the ten largest positions identified in Form 13F filings held 38.0% of shares at 30 June 2026, and at the 12 March 2026 annual meeting the advisory pay vote received 92.2%, auditor ratification 93.0% and director Kevin P. March 89.6% (97.0% in 2025).
- Forms 4 report open market sales of 307,925 shares for $180.64m and open market purchases of 0 in the twelve months to 10 October 2026; June 2026 holds 276,692 of those shares, and sales after 26 July 2026 total 9,225 shares for $4.45m.
- Three sets of stated assumptions for FY2027 to FY2029 give arithmetic outcomes of $194, $613 and $1,110 per share at end FY2029; base case price equals the current price at revenue growth of 6.1% per year.
Table 0.1 Applied Materials at a glance
| Measure | Value | Basis |
|---|---|---|
Share price | $507.03 | Close, 9 October 2026 |
Market cap | $402.38bn | 793.6m shares, 10-Q cover, 26 July 2026 |
Net cash | $7.96bn | Cash and investments $14.50bn less debt $6.54bn, 26 July 2026 |
EV | $394.42bn | Market cap less net cash |
TTM revenue | $30.84bn | Q4 FY2025 to Q3 FY2026 |
Revenue growth | 25% in Q3 FY2026; 7.8% TTM | Against the same periods a year earlier |
Operating margin, Q3 FY2026 | 33.7% GAAP; 34.0% non GAAP | Non GAAP excludes $21m of acquisition items |
TTM FCF margin | 18.2% | FCF of $5.62bn |
Backlog | $15.00bn | 26 October 2025; filed once a year in the 10-K |
Remaining performance obligations (RPO) | $1.0bn | 26 July 2026; contracts with an original duration of one year or more |
EV / sales | 12.8x | TTM revenue; peer median 14.0x |
P / E | 43.7x | TTM diluted GAAP EPS of $11.60; peer median 55.4x |
P / FCF | 71.6x | Market cap over TTM FCF; peer median 60.9x |
Diluted shares | 800m | Q3 FY2026 weighted average |
Source: 10-Q Q3 FY2026, 10-K FY2025, 8-K Exhibit 99.1 of 13 August 2026, SEC filings via SEC-API.io; Market data, 9 October 2026. TTM = last four reported quarters; peer medians from Table 4.5
1 Revenue & Business Model
Revenue was $9.12bn in Q3 FY2026, up 25% year on year, and $24.04bn for the first nine months (9M), up 11% (10-Q Q3 FY2026). Semiconductor Systems, the segment that sells chip making equipment, produced 77% of Q3 revenue; Applied Global Services (AGS), which sells services, spares and software for the installed base, produced 20%.
Applied Materials business model and segment revenue
Table 1.1 Segments, Q3 FY2026
| Segment | What it sells | Revenue | Share | Year on year | Operating income | Operating margin |
|---|---|---|---|---|---|---|
Semiconductor Systems | Equipment for patterning, transistor and interconnect fabrication, process control and advanced packaging; 200mm equipment from Q1 FY2026 | $7.04bn | 77% | 27% | $2.66bn | 37.7% |
Applied Global Services | Transactional and subscription services, spares, factory automation software | $1.78bn | 20% | 22% | $536m | 30.1% |
Other | Operating segments below the reporting threshold, including display equipment | $294m | 3% | 7% | ($118m) | n/a |
Total | $9.12bn | 100% | 25% | $3.08bn | 33.7% |
Source: 10-Q Q3 FY2026, Note 14 and Item 2; 10-K FY2025, Item 1; SEC filings via SEC-API.io
Sales run through a direct sales force; manufacturing is assembly, integration and test of vendor supplied parts in seven countries. Purchase obligations were $10.6bn at 26 October 2025 (10-K FY2025, Items 1 and 7).

Table 1.2 Segment revenue and operating income by fiscal year
| FY2021 | FY2022 | FY2023 | FY2024 | FY2025 | |
|---|---|---|---|---|---|
Revenue | $23.06bn | $25.79bn | $26.52bn | $27.18bn | $28.37bn |
Semiconductor Systems | $16.29bn | $18.80bn | $19.70bn | $19.91bn | $20.80bn |
Applied Global Services | $5.01bn | $5.54bn | $5.73bn | $6.23bn | $6.39bn |
Display | $1.63bn | $1.33bn | $868m | $885m | n/a |
Display, Corporate and Other | $1.76bn | $1.45bn | $1.09bn | $1.04bn | $1.19bn |
Operating income | $6.89bn | $7.79bn | $7.65bn | $7.87bn | $8.29bn |
Operating income, Semiconductor Systems | $6.31bn | $6.97bn | $6.88bn | $6.98bn | $7.38bn |
Operating income, Applied Global Services | $1.51bn | $1.66bn | $1.53bn | $1.81bn | $1.79bn |
Operating income, Display, Corporate and Other | ($930m) | ($842m) | ($754m) | ($926m) | ($882m) |
Semiconductor Systems operating margin | 38.8% | 37.1% | 34.9% | 35.1% | 35.5% |
Applied Global Services operating margin | 30.1% | 30.0% | 26.7% | 29.1% | 28.1% |
Source: 10-K FY2023 for FY2021 and FY2022; 10-K FY2024 for FY2024 Display revenue; 10-K FY2025 for FY2023 to FY2025. Segment operating income for FY2021 and FY2022 is on the cost allocation of the FY2023 10-K; FY2023 to FY2025 on that of the FY2025 10-K; SEC filings via SEC-API.io
FY2025 10-K moved Display into Corporate and Other, leaving two reportable segments. From Q1 FY2026 the 200mm equipment business moved from AGS to Semiconductor Systems; the recast shifted $524m of 9M FY2025 revenue.
Table 1.3 Segment revenue and operating income by quarter
| Q2 FY2025 | Q3 FY2025 | Q4 FY2025 | Q1 FY2026 | Q2 FY2026 | Q3 FY2026 | |
|---|---|---|---|---|---|---|
Revenue | $7.10bn | $7.30bn | $6.80bn | $7.01bn | $7.91bn | $9.12bn |
Semiconductor Systems | $5.40bn | $5.56bn | $4.76bn * | $5.14bn | $5.97bn | $7.04bn |
Applied Global Services | $1.42bn | $1.46bn | $1.63bn * | $1.56bn | $1.67bn | $1.78bn |
Other | $279m | $275m | $415m * | $312m | $280m | $294m |
Operating income | $2.17bn | $2.23bn | $1.71bn | $1.83bn | $2.52bn | $3.08bn |
Operating income, Semiconductor Systems | $1.77bn | $1.84bn | n/a | $1.43bn | $2.09bn | $2.66bn |
Operating income, Applied Global Services | $378m | $400m | n/a | $438m | $487m | $536m |
Operating income, Other | $21m | ($4m) | n/a | ($34m) | ($56m) | ($118m) |
Semiconductor Systems operating margin | 32.8% | 33.0% | n/a | 27.8% | 35.1% | 37.7% |
Applied Global Services operating margin | 26.6% | 27.3% | n/a | 28.1% | 29.2% | 30.1% |
Source: 10-Q Q2 FY2026, 10-Q Q3 FY2026, 10-Q Q1 FY2026, 10-K FY2025, 10-Q Q3 FY2025. FY2025 quarters are as recast in the FY2026 10-Q filings. * Q4 FY2025 is full year less nine months on the FY2025 10-K basis, with 200mm equipment in AGS; SEC filings via SEC-API.io
Semiconductor Systems revenue by end market: foundry and logic, DRAM, NAND
DRAM (memory chips used for working data) was 29% of Semiconductor Systems revenue in 9M FY2026 against 25% a year earlier.

Table 1.4 Semiconductor Systems revenue by end market, share as filed
| End market | FY2021 | FY2022 | FY2023 | FY2024 | FY2025 | 9M FY2025 | 9M FY2026 | Q3 FY2025 | Q3 FY2026 |
|---|---|---|---|---|---|---|---|---|---|
Foundry, logic and other | 60% | 66% | 77% | 68% | 67% | 68% | 65% | 69% | 67% |
DRAM | 19% | 19% | 17% | 28% | 26% | 25% | 29% | 22% | 26% |
Flash memory (NAND) | 21% | 15% | 6% | 4% | 7% | 7% | 6% | 9% | 7% |
Source: 10-K FY2023, 10-K FY2025, 10-Q Q3 FY2026. FY2026 and recast FY2025 periods include 200mm equipment; SEC filings via SEC-API.io
Revenue by region, China share and customer concentration
China revenue was $2.51bn in Q3 FY2026, (2)% year on year, and United States revenue rose 100% to $1.37bn. Figure 3.3 shows China revenue by quarter.

Table 1.5 Revenue by region by fiscal year, by location of customer facility
| Region | FY2021 | FY2022 | FY2023 | FY2024 | FY2025 | 9M FY2025 | 9M FY2026 |
|---|---|---|---|---|---|---|---|
China | $7.54bn | $7.25bn | $7.25bn | $10.12bn | $8.53bn | $6.57bn | $6.69bn |
Korea | $5.01bn | $4.40bn | $4.61bn | $4.49bn | $5.61bn | $4.39bn | $4.55bn |
Taiwan | $4.74bn | $6.26bn | $5.67bn | $4.01bn | $6.86bn | $5.02bn | $5.90bn |
Japan | $1.96bn | $2.01bn | $2.08bn | $2.15bn | $2.27bn | $1.83bn | $1.99bn |
Southeast Asia | $677m | $1.08bn | $758m | $1.14bn | $1.08bn | $616m | $894m |
United States | $2.04bn | $3.10bn | $4.01bn | $3.82bn | $3.06bn | $2.41bn | $2.96bn |
Europe | $1.10bn | $1.67bn | $2.15bn | $1.44bn | $962m | $742m | $1.05bn |
Total | $23.06bn | $25.79bn | $26.52bn | $27.18bn | $28.37bn | $21.57bn | $24.04bn |
China share | 33% | 28% | 27% | 37% | 30% | 30% | 28% |
Asia Pacific share | 86% | 81% | 77% | 81% | 86% | 85% | 84% |
Source: 10-K FY2023, 10-K FY2025, 10-Q Q3 FY2026; SEC filings via SEC-API.io
Table 1.6 Revenue by region by quarter
| Region | Q2 FY2025 | Q3 FY2025 | Q4 FY2025 | Q1 FY2026 | Q2 FY2026 | Q3 FY2026 | Q3 year on year |
|---|---|---|---|---|---|---|---|
China | $1.77bn | $2.55bn | $1.96bn | $2.10bn | $2.09bn | $2.51bn | (2)% |
Korea | $1.56bn | $1.16bn | $1.22bn | $1.46bn | $1.57bn | $1.52bn | 31% |
Taiwan | $2.00bn | $1.84bn | $1.83bn | $1.72bn | $2.16bn | $2.03bn | 10% |
Japan | $572m | $713m | $448m | $525m | $623m | $839m | 18% |
Southeast Asia | $135m | $195m | $460m | $335m | $185m | $374m | 92% |
United States | $808m | $683m | $655m | $656m | $941m | $1.37bn | 100% |
Europe | $252m | $160m | $220m | $221m | $347m | $483m | 202% |
Total | $7.10bn | $7.30bn | $6.80bn | $7.01bn | $7.91bn | $9.12bn | 25% |
Source: 10-Q Q2 FY2026, 10-Q Q3 FY2026, 10-Q Q1 FY2026, 10-K FY2025. Q4 FY2025 is full year less nine months; SEC filings via SEC-API.io
Table 1.7 Customers at or above 10% of revenue
| Period | Customer | Share of revenue |
|---|---|---|
FY2021 | Samsung Electronics | 20% |
FY2021 | Taiwan Semiconductor Manufacturing Company (TSMC) | 15% |
FY2022 | Taiwan Semiconductor Manufacturing Company (TSMC) | 20% |
FY2022 | Samsung Electronics | 12% |
FY2022 | Intel | 10% |
FY2023 | Taiwan Semiconductor Manufacturing Company (TSMC) | 19% |
FY2023 | Samsung Electronics | 15% |
FY2024 | Samsung Electronics | 12% |
FY2024 | Taiwan Semiconductor Manufacturing Company (TSMC) | 11% |
FY2025 | Largest customer, unnamed | 19% |
FY2025 | Second largest customer, unnamed | 15% |
9M FY2026 | Largest customer, unnamed | 20% |
9M FY2026 | Second largest customer, unnamed | 14% |
Source: 10-K FY2023, 10-K FY2024, 10-K FY2025, 10-Q Q3 FY2026. FY2025 10-K and FY2026 10-Q filings give percentages without customer names; SEC filings via SEC-API.io
Backlog, remaining performance obligations and contract liabilities
Table 1.8 Backlog and contract balances at period end
| FY2021 | FY2022 | FY2023 | FY2024 | FY2025 | Q3 FY2026 | |
|---|---|---|---|---|---|---|
Backlog | $11.76bn | $19.01bn | $17.17bn | $15.87bn | $15.00bn | n/a |
Semiconductor Systems | $6.68bn | $12.69bn | $11.13bn | $8.26bn | $7.11bn | n/a |
Applied Global Services | $4.34bn | $5.64bn | $5.16bn | $6.77bn | $7.14bn | n/a |
Display, Corporate and Other | $744m | $677m | $882m | $847m | $756m | n/a |
Backlog due beyond 12 months | n/a | 32% | 30% | 31% | 31% | n/a |
RPO, contracts with an original duration of one year or more | n/a | $4.8bn | $6.0bn | $3.7bn | $1.7bn | $1.0bn |
RPO recognized within 12 months | n/a | 28% | 59% | 62% | 53% | 73% |
Contract liabilities | n/a | $3.14bn | $2.98bn | $2.85bn | $2.57bn | $3.27bn |
Source: 10-K FY2022, 10-K FY2023, 10-K FY2024, 10-K FY2025, 10-Q Q3 FY2026. Backlog is filed once a year in Item 1 of the 10-K; SEC filings via SEC-API.io. FY2025 and earlier backlog by segment is on the segment basis before the 200mm recast
AGS backlog was $7.14bn at 26 October 2025 and Semiconductor Systems backlog $7.11bn, both on the FY2025 segment basis before the 200mm recast, with 200mm equipment in AGS; three years earlier the figures were $5.64bn and $12.69bn.
2 Financial Analysis & Ratios
GAAP operating margin was 33.7% in Q3 FY2026 against 30.6% a year earlier, on gross margin of 50.3% against 48.8%. Diluted EPS of $3.17 includes a $213m loss on equity investments and a 12.7% tax rate.
Applied Materials Q3 FY2026 results year on year
Table 2.1 Q3 FY2026 and nine months FY2026 against the prior year
| Metric | Q3 FY2026 | Q3 FY2025 | Change | Nine months FY2026 | Nine months FY2025 | Change |
|---|---|---|---|---|---|---|
Revenue | $9.12bn | $7.30bn | 25% | $24.04bn | $21.57bn | 11% |
Gross profit | $4.59bn | $3.56bn | 29% | $11.97bn | $10.54bn | 14% |
Gross margin | 50.3% | 48.8% | 1.5 pts | 49.8% | 48.9% | 0.9 pts |
Research, development and engineering | $1.10bn | $901m | 22% | $3.06bn | $2.65bn | 15% |
Operating income | $3.08bn | $2.23bn | 38% | $7.43bn | $6.58bn | 13% |
Operating margin | 33.7% | 30.6% | 3.1 pts | 30.9% | 30.5% | 0.4 pts |
Interest and other income (expense), net | ($100m) | $396m | n/a | $1.24bn | $625m | 98% |
of which gain (loss) on equity investments | ($213m) | $298m | n/a | $927m | $299m | 210% |
Effective tax rate | 12.7% | 30.6% | (17.9) pts | 12.9% | 27.2% | (14.3) pts |
Net income | $2.54bn | $1.78bn | 43% | $7.37bn | $5.10bn | 44% |
Diluted EPS | $3.17 | $2.22 | 43% | $9.22 | $6.29 | 47% |
Operating cash flow | $3.04bn | $2.63bn | 15% | $5.57bn | $5.13bn | 9% |
Capital expenditure | $707m | $584m | 21% | $1.99bn | $1.48bn | 35% |
FCF | $2.33bn | $2.05bn | 14% | $3.58bn | $3.66bn | (2)% |
Cost of shares repurchased | $400m | $1.04bn | (61)% | $1.14bn | $4.04bn | (72)% |
Dividends paid | $420m | $368m | 14% | $1.15bn | $1.02bn | 13% |
Source: 10-Q Q3 FY2026, 10-Q Q2 FY2026, 10-Q Q3 FY2025, 10-Q Q2 FY2025; SEC filings via SEC-API.io
Nine month operating cash flow is stated after a $2.51bn increase in receivables.

Applied Materials financial ratios FY2021 to FY2025
Days sales outstanding were 77 on the quarterly basis the company reports and 91 on TTM revenue.
Table 2.2 Ratio analysis, FY2021 to FY2025 and TTM to Q3 FY2026
| Ratio | FY2021 | FY2022 | FY2023 | FY2024 | FY2025 | TTM to Q3 FY2026 |
|---|---|---|---|---|---|---|
Revenue | $23.06bn | $25.79bn | $26.52bn | $27.18bn | $28.37bn | $30.84bn |
Revenue growth | 34.1% | 11.8% | 2.8% | 2.5% | 4.4% | 7.8% |
Diluted EPS | $6.40 | $7.44 | $8.11 | $8.61 | $8.66 | $11.60 |
Diluted EPS growth | 63.3% | 16.3% | 9.0% | 6.2% | 0.6% | 38.3% |
Gross margin | 47.3% | 46.5% | 46.7% | 47.5% | 48.7% | 49.4% |
Operating margin | 29.9% | 30.2% | 28.9% | 28.9% | 29.2% | 29.6% |
Net margin | 25.5% | 25.3% | 25.9% | 26.4% | 24.7% | 30.1% |
FCF margin | 20.7% | 17.9% | 28.6% | 27.6% | 20.1% | 18.2% |
SBC (share based compensation) % of revenue | 1.5% | 1.6% | 1.8% | 2.1% | 2.4% | 2.3% |
RD&E % of revenue | 10.8% | 10.7% | 11.7% | 11.9% | 12.6% | 12.9% |
Capex % of revenue | 2.9% | 3.1% | 4.2% | 4.4% | 8.0% | 9.0% |
Effective tax rate | 13.0% | 14.1% | 11.1% | 12.0% | 24.5% | 13.6% |
ROE | 51.6% | 53.4% | 48.0% | 40.6% | 35.5% | 41.1% |
ROIC (return on invested capital) | 63.3% | 57.5% | 52.6% | 53.8% | 46.2% | 48.9% |
ROA | 24.4% | 24.8% | 23.9% | 22.0% | 19.8% | 23.8% |
Current ratio | 2.54x | 2.16x | 2.60x | 2.51x | 2.61x | 2.42x |
Debt / equity | 0.45x | 0.45x | 0.34x | 0.33x | 0.32x | 0.26x |
Net cash (cash and investments less debt) | $2.06bn | ($896m) | $3.59bn | $6.00bn | $6.35bn | $7.96bn |
Interest cover | 29.2x | 34.2x | 32.2x | 31.9x | 30.8x | 33.0x |
DSO (days sales outstanding) | 78 | 86 | 71 | 70 | 67 | 91 |
Inventory days | 129 | 157 | 148 | 139 | 148 | 154 |
Inventory turns | 2.96x | 2.69x | 2.42x | 2.56x | 2.57x | 2.52x |
Asset turnover | 0.96x | 0.98x | 0.92x | 0.83x | 0.80x | 0.79x |
FCF per share | $5.19 | $5.26 | $8.99 | $8.98 | $7.05 | $7.04 |
Diluted shares | 919m | 877m | 845m | 834m | 808m | 799m |
Source: 10-K FY2025, 10-K FY2023, 10-K FY2021, 10-Q Q3 FY2026, 10-Q Q3 FY2025, 8-K of 13 November 2025; SEC filings via SEC-API.io. Returns use average balances; ROIC is operating income after the period tax rate over debt plus equity less cash and investments; DSO and inventory days use period end balances over full period flows; FY2021 had 53 weeks
GAAP and non GAAP earnings, one off items and equity investment gains
Nine month FY2026 diluted EPS rose 47% to $9.22 on a GAAP basis and 20% to $8.73 on the company's non GAAP basis, which excludes $927m of equity investment gains and the $253m legal settlement. Equity investment gains are reported in interest and other income, below operating income. Non GAAP tax rate for Q3 FY2026 was 11.0%.
Table 2.3 GAAP and non GAAP operating income, net income and EPS, from 8-K Exhibit 99.1
| Item | Q3 FY2026 | Q3 FY2025 | Nine months FY2026 | Nine months FY2025 | FY2025 | FY2024 |
|---|---|---|---|---|---|---|
GAAP operating income | $3.08bn | $2.23bn | $7.43bn | $6.58bn | $8.29bn | $7.87bn |
Acquisition items, deal costs, impairments | $21m | $12m | $45m | $38m | $92m | $57m |
Legal settlement | $0m | $0m | $253m | $0m | $0m | $0m |
Restructuring charges | $0m | $0m | $12m | $0m | $181m | $0m |
Non GAAP operating income | $3.10bn | $2.25bn | $7.74bn | $6.62bn | $8.56bn | $7.92bn |
Non GAAP operating margin | 34.0% | 30.7% | 32.2% | 30.7% | 30.2% | 29.2% |
GAAP net income | $2.54bn | $1.78bn | $7.37bn | $5.10bn | $7.00bn | $7.18bn |
Operating adjustments above | $21m | $12m | $310m | $38m | $273m | $57m |
Strategic investment loss (gain) | $213m | ($298m) | ($927m) | ($299m) | ($821m) | ($20m) |
Asset sale gain and currency loss on investment purchase | $0m | $0m | $0m | ($21m) | ($21m) | $0m |
Income tax items | $23m | $496m | $227m | $1.06bn | $1.18bn | ($4m) |
Non GAAP net income | $2.80bn | $1.99bn | $6.98bn | $5.88bn | $7.61bn | $7.21bn |
GAAP diluted EPS | $3.17 | $2.22 | $9.22 | $6.29 | $8.66 | $8.61 |
Non GAAP diluted EPS | $3.50 | $2.48 | $8.73 | $7.25 | $9.42 | $8.65 |
Source: 8-K of 13 August 2026, 8-K of 13 November 2025; SEC filings via SEC-API.io
Table 2.4 One off and non operating items
| Item | Period | Amount | Detail |
|---|---|---|---|
Fiscal 2025 Restructuring Plan, estimate at approval | 23 October 2025 | $160m to $180m | About 4% of global workforce |
Restructuring charge recognized | Q4 FY2025 | $181m | Severance $154m, asset impairments $27m |
Restructuring charge recognized | Nine months FY2026 | $12m | Reserve fell from $165m to $12m at 26 July 2026 |
Legal settlement, export controls matter | Q1 FY2026 | $253m | Paid in Q2 FY2026 |
Goodwill impairment | Q4 FY2025 | $41m | Within general and administrative expense |
Deferred tax asset remeasurement, Singapore | FY2025 | $659m | Added 7.1 points to FY2025 tax rate |
Valuation allowance, corporate alternative minimum tax (CAMT) credits | FY2025 | $407m | Added 4.4 points to FY2025 tax rate |
Gain on equity investments, net | FY2025 | $821m | FY2024 $20m |
Gain on equity investments, net | Nine months FY2026 | $927m | Q3 FY2026 loss $213m |
Source: 8-K of 23 October 2025, 10-K FY2025, 10-Q Q3 FY2026; SEC filings via SEC-API.io

Balance sheet, capital expenditure, dividends and buybacks against FCF
Table 2.5 Working capital and balance sheet by quarter
| Quarter end | Q3 FY2025 | Q4 FY2025 | Q1 FY2026 | Q2 FY2026 | Q3 FY2026 |
|---|---|---|---|---|---|
Accounts receivable | $5.77bn | $5.19bn | $4.98bn | $6.37bn | $7.69bn |
DSO, quarter basis (days) | 72 | 69 | 65 | 73 | 77 |
Inventories | $5.81bn | $5.92bn | $6.00bn | $6.34bn | $6.56bn |
Inventory days, quarter basis | 141 | 152 | 153 | 146 | 132 |
Contract liabilities | $2.47bn | $2.57bn | $2.47bn | $2.57bn | $3.27bn |
Property, plant and equipment, net | $4.12bn | $4.61bn | $4.95bn | $5.26bn | $5.61bn |
Cash and investments | $11.15bn | $12.90bn | $13.48bn | $13.38bn | $14.50bn |
Total debt | $6.26bn | $6.56bn | $6.55bn | $6.46bn | $6.54bn |
Net cash | $4.89bn | $6.35bn | $6.93bn | $6.93bn | $7.96bn |
Stockholders equity | $19.50bn | $20.42bn | $21.72bn | $23.91bn | $25.63bn |
Source: 10-Q Q3 FY2026, 10-Q Q2 FY2026, 10-Q Q1 FY2026, 10-K FY2025, 10-Q Q3 FY2025; SEC filings via SEC-API.io
Contract liabilities rose $705m in nine months. Inventories of $6.56bn include raw materials of $2.32bn and customer service spares of $1.87bn.
Table 2.6 Cash returned to shareholders against FCF
| Capital return | FY2021 | FY2022 | FY2023 | FY2024 | FY2025 | Nine months FY2026 |
|---|---|---|---|---|---|---|
Operating cash flow | $5.44bn | $5.40bn | $8.70bn | $8.68bn | $7.96bn | $5.57bn |
Capital expenditure | $668m | $787m | $1.11bn | $1.19bn | $2.26bn | $1.99bn |
FCF | $4.77bn | $4.61bn | $7.59bn | $7.49bn | $5.70bn | $3.58bn |
Dividends paid | $838m | $873m | $975m | $1.19bn | $1.38bn | $1.15bn |
Share repurchases, cash paid | $3.75bn | $6.10bn | $2.19bn | $3.82bn | $4.90bn | $1.18bn |
Dividends plus repurchases | $4.59bn | $6.98bn | $3.16bn | $5.02bn | $6.28bn | $2.33bn |
Returned as % of FCF | 96% | 151% | 42% | 67% | 110% | 65% |
Dividends declared per share | $0.94 | $1.02 | $1.22 | $1.52 | $1.78 | $1.52 |
Shares repurchased | 28m | 54m | 18m | 20m | 30m | 3m |
Average repurchase price | $134.03 | $113.84 | $123.63 | $190.27 | $162.85 | $343.16 |
Source: 10-K FY2025, 10-K FY2023, 10-Q Q3 FY2026; SEC filings via SEC-API.io. Repurchases in this table are cash paid ($440m in Q3 FY2026); average repurchase price is cost of shares over shares repurchased, on a nine month FY2026 cost of $1.14bn

Construction in progress reached $2.04bn at 26 July 2026. 10-Q Q3 FY2026 names the Equipment and Process Innovation and Commercialization (EPIC) Center among major infrastructure projects. Senior notes total $6.5bn in principal, of which $1.2bn at 3.300% falls due in 2027 (Figure 5.3).
3 MD&A & Management Commentary
Applied Materials guides Q4 FY2026 revenue to $10.25bn ± $500m and non GAAP diluted EPS to $4.02 ± $0.20, 50.7% and 85.3% above Q4 FY2025 at midpoint, after Q3 FY2026 revenue came in 1.8% above guidance midpoint (8-K of 13 August 2026). Nine months reported plus Q4 midpoint gives FY2026 revenue of $34.29bn, 20.9% above FY2025.
Applied Materials guidance against actual results
Revenue and non GAAP EPS reached or exceeded guidance midpoint in each of the last seven quarters; Q2 FY2026 EPS of $2.86 exceeded the $2.84 top of the range.

Table 3.1 Quarterly guidance against actual, Q1 FY2025 to Q4 FY2026
| Quarter | Guidance given | Revenue guidance | Revenue actual | Against midpoint | Non GAAP EPS guidance | Non GAAP EPS actual | Against midpoint | Non GAAP gross margin guidance | Non GAAP gross margin actual |
|---|---|---|---|---|---|---|---|---|---|
Q4 FY2026 | 13 Aug 2026 | $10.25bn ± $500m | n/a | n/a | $4.02 ± $0.20 | n/a | n/a | 50.4% | n/a |
Q3 FY2026 | 14 May 2026 | $8.95bn ± $500m | $9.12bn | 1.8% | $3.36 ± $0.20 | $3.50 | $0.14 | 50.1% | 50.4% |
Q2 FY2026 | 12 Feb 2026 | $7.65bn ± $500m | $7.91bn | 3.4% | $2.64 ± $0.20 | $2.86 | $0.22 | 49.3% | 50.0% |
Q1 FY2026 | 13 Nov 2025 | $6.85bn ± $500m | $7.01bn | 2.4% | $2.18 ± $0.20 | $2.38 | $0.20 | 48.4% | 49.1% |
Q4 FY2025 | 14 Aug 2025 | $6.70bn ± $500m | $6.80bn | 1.5% | $2.11 ± $0.20 | $2.17 | $0.06 | 48.1% | 48.1% |
Q3 FY2025 | 15 May 2025 | $7.20bn ± $500m | $7.30bn | 1.4% | $2.35 ± $0.20 | $2.48 | $0.13 | 48.3% | 48.9% |
Q2 FY2025 | 13 Feb 2025 | $7.10bn ± $400m | $7.10bn | 0.0% | $2.30 ± $0.18 | $2.39 | $0.09 | 48.4% | 49.2% |
Q1 FY2025 | 14 Nov 2024 | $7.15bn ± $400m | $7.17bn | 0.2% | $2.29 ± $0.18 | $2.38 | $0.09 | n/a | 48.9% |
Source: SEC filings via SEC-API.io, 8-K Exhibit 99.1 of 14 Nov 2024, 13 Feb 2025, 15 May 2025, 14 Aug 2025, 13 Nov 2025, 12 Feb 2026, 14 May 2026, 13 Aug 2026. Gross margin guidance for Q1 FY2026 to Q4 FY2026: earnings calls of the dates shown
Gross margin drivers
10-Q Q3 FY2026 attributes the 1.5 point rise in GAAP gross margin to "higher revenue, increases in average selling prices, and lower material and manufacturing costs" and product mix. Gross margin was 55.3% against 53.4% in Semiconductor Systems and 35.6% against 33.8% in AGS.

China revenue share and export controls
China was 28% of Q3 FY2026 revenue against 35% a year earlier and 45% in Q1 FY2024.

Table 3.2 China and export control effects quantified by management
| Date | Source | What management stated |
|---|---|---|
13 Aug 2026 | Earnings call | China was 26% of Semiconductor Systems plus AGS revenue in Q3 FY2026; China revenue is expected to increase in calendar 2026. |
13 Aug 2026 | 8-K Item 2.02, Exhibit 99.1 | China revenue $2.51bn, 28% of total, against $2.55bn and 35% in Q3 FY2025. |
14 May 2026 | Earnings call | China was 24% of Semiconductor Systems plus AGS revenue in Q2 FY2026 (27% of total revenue in Exhibit 99.1). |
12 Feb 2026 | Earnings call | China was 27% of Semiconductor Systems plus AGS revenue and 30% of total in Q1 FY2026; outlook for China described as flattish. |
11 Feb 2026 | 8-K Item 8.01 | Settlement with BIS: one payment of $252.5m for China customer shipments between November 2020 and July 2022; the Department of Justice and the SEC closed their inquiries with no enforcement action. 10-Q records a $253m legal settlement charge in the first nine months of FY2026. |
13 Nov 2025 | Earnings call | China fell to 28% of systems and service revenue in FY2025 and 25% in Q4 FY2025. Restrictions covered around 10% of the China wafer fabrication equipment market in FY2024 and well over 20% in FY2025. CFO stated that the BIS Affiliates Rule had been suspended, that the $110m would ship in Q1 FY2026 and that $600m remained the estimate for the rest of FY2026. |
2 Oct 2025 | 8-K Item 7.01 | The BIS Affiliates Rule of 29 Sep 2025 was estimated to reduce net revenue by about $110m in Q4 FY2025 and about $600m in FY2026. |
14 Aug 2025 | 8-K Item 2.02, Exhibit 99.1 | The CFO expected a Q4 FY2025 revenue decline from digestion of capacity in China and uneven demand from leading edge customers. |
13 Feb 2025 | 8-K Item 2.02, Exhibit 99.1 | Q2 FY2025 outlook stated as including the estimated impact of recently announced U.S. export regulations. |
Source: SEC filings via SEC-API.io, 8-K of 13 Aug 2026, 11 Feb 2026, 2 Oct 2025, 14 Aug 2025, 13 Feb 2025; 10-Q for Q3 FY2026. Earnings call rows: company earnings calls of the dates shown
DRAM, leading edge foundry and logic, advanced packaging

Table 3.3 Trends and risks management names
| Theme | What management stated | Source and date |
|---|---|---|
Calendar 2026 and 2027 outlook | Semiconductor equipment growth expectation for calendar 2026 raised from over 20% (12 Feb 2026) to more than 30% (14 May 2026) and raised again on 13 Aug 2026 in qualitative terms; another growth year expected in 2027. | 8-K Exhibit 99.1, 12 Feb, 14 May and 13 Aug 2026 |
DRAM and high bandwidth memory (HBM) | DRAM revenue including HBM packaging rose 52% year on year in Q3 FY2026; an increase is expected in the second half of calendar 2026. HBM revenue was about $1.5bn in FY2025 with a target of $3bn or more over the next few years. | Earnings calls, 13 Aug 2026 and 13 Nov 2025 |
Leading edge foundry and logic | 10-Q: higher foundry and logic spending reflected demand for leading edge technologies, partly offset over nine months by lower demand for trailing edge logic systems. Call: leading edge foundry logic, DRAM and advanced packaging expected to be around 80% of wafer fabrication equipment growth in 2026 and 2027. | 10-Q, 20 Aug 2026; earnings call, 13 Aug 2026 |
Advanced packaging | Packaging revenue growth expected for calendar 2026 raised from more than 50% to more than 70%; six new systems for DRAM and advanced packaging introduced. | Earnings calls, 14 May and 13 Aug 2026; 8-K Exhibit 99.1, 13 Aug 2026 |
Services | AGS revenue $1.78bn, up 22%, on long term service agreements and spares; growth above 20% expected for calendar 2026. | 10-Q, 20 Aug 2026; earnings call, 13 Aug 2026 |
Capacity and supply | Additional manufacturing capacity investments planned to support demand through the end of the decade; $500m Tampines Campus in Singapore; capacity to double quarterly system output by 2028; capital expenditure $2.0bn in nine months. | 8-K Exhibit 99.1 and earnings call, 13 Aug 2026; 10-Q |
Operating expenses | RD&E $1.10bn against $901m on added headcount and depreciation; G&A $162m against $204m. Q4 FY2026 non GAAP operating expenses guided to about $1.58bn; Q1 FY2027 has 14 weeks. | 10-Q, 20 Aug 2026; earnings call, 13 Aug 2026 |
Trade policy and tariffs | Export rules have limited sales to China for several years; tariff changes have caused substantial uncertainty and retaliatory measures. Tariffs partly offset cost reductions in FY2025. | 10-Q, 20 Aug 2026; earnings call, 13 Nov 2025 |
Tax | Effective tax rate 12.7% against 30.6%; the global minimum tax in Singapore is expected to materially increase foreign taxes from Q1 FY2026. | 10-Q, 20 Aug 2026 |
Receivables | DSO 77 days against 72, on down payment invoices and lower factoring. | 10-Q, 20 Aug 2026 |
Source: SEC filings via SEC-API.io, 10-Q for Q3 FY2026; 8-K Exhibit 99.1 of 12 Feb 2026, 14 May 2026, 13 Aug 2026. Earnings call rows: company earnings calls of the dates shown
4 Sector & Competitor Analysis
Applied Materials TTM revenue grew 7.8% to $30.84bn, against an 11.7% median for seven equipment peers, at a 29.6% operating margin against 30.2%. Shares trade at 12.8x EV / sales and 43.7x P / E against medians of 14.0x and 55.4x (Market data, 9 October 2026).
Wafer fabrication equipment market size and forecast
SEMI, the equipment industry association, forecasts wafer fabrication equipment (WFE) sales of $143.9bn in 2026, up 23.1%. World Semiconductor Trade Statistics (WSTS) forecasts chip sales of $1.51tn, up 89.9%.

Table 4.1 Named research on equipment and semiconductor markets
| Source | Date | Finding |
|---|---|---|
| 14 Jul 2026 | Total equipment sales $165.9bn in 2026, up 23.2%, and $229.5bn in 2028; WFE $116.9bn in 2025, $143.9bn in 2026, growth of 21.8% in 2027 and 14.1% in 2028 | |
Same SEMI release | 14 Jul 2026 | 2026 WFE by application: foundry and logic $78.0bn, up 18.9%; DRAM $38.8bn, up 39.0%; NAND $13.9bn, up 30.7%. Test equipment (back end, outside WFE) $15.3bn, up 31.0% |
Same SEMI release | 14 Jul 2026 | China, Taiwan and Korea are the three largest destinations for equipment spending through 2028; China growth moderates in 2026 |
| 2 Jun 2026 | Semiconductor market $795.6bn in 2025, up 26.2%; $1.51tn in 2026, up 89.9%; $1.91tn in 2027, up 26.6% | |
Same WSTS release | 2 Jun 2026 | Memory $803.9bn in 2026, up 249.5%, and $1.06tn in 2027; logic $411.4bn in 2026, up 37.3% |
Source: SEMI and WSTS releases linked in the table
Micron capital expenditure rose 93.7% to $30.7bn in its year to 3 September 2026; Intel spent $6.2bn in H1 2026, down 29.1%.
Table 4.2 Capital expenditure of five chip makers
| Company | Latest fiscal year | Capex | Prior year | Change | Latest update |
|---|---|---|---|---|---|
TSMC | FY2025 | NT$1.27tn ($40.6bn) | NT$956bn | 33.1% | H1 2026 $26.8bn, up 36%; 2026 guidance $60bn to $64bn, raised from $52bn to $56bn (16 Jul 2026) |
Samsung Electronics | FY2025 | KRW 52.7tn | n/a | n/a | Semiconductor division KRW 47.5tn of the FY2025 total (29 Jan 2026) |
Intel | FY2025 | $14.6bn | $23.9bn | (38.8)% | H1 2026 $6.2bn against $8.7bn, (29.1)% |
Micron | FY to 3 Sep 2026 | $30.7bn | $15.9bn | 93.7% | 10-K filed 9 Oct 2026 |
SK hynix | 2026 plan | KRW 45tn or more (about $31bn) | n/a | about 50% | Plan reported 3 Aug 2026 |
Source: TSMC 20-F 0001628280-26-025362, Intel 10-K 0000050863-26-000011, Intel 10-Q 0000050863-26-000157, Micron 10-K 0000723125-26-000023, SEC filings via SEC-API.io; TSMC Q2 2026 results as reported by Focus Taiwan; Samsung FY 2025 CAPEX Results; SK hynix plan as reported by Bits&Chips. Capex is purchases of property, plant and equipment; TSMC US dollar figure is the 20-F convenience translation
China share of revenue by equipment maker
China was 27.8% of Applied Materials revenue in 9M FY2026 and 30.1% in FY2025, against a 23.7% peer median. ASML China share was 19% in Q1 2026 (TrendForce, 22 Jun 2026).

Table 4.3 China revenue and share of total revenue
| Company | Fiscal year | China revenue | Share | Latest year to date | China revenue | Share |
|---|---|---|---|---|---|---|
Applied Materials | FY2025 | $8.53bn | 30.1% | 9M FY2026 | $6.69bn | 27.8% |
Lam Research | FY to Jun 2026 | $7.86bn | 33.8% | n/a | n/a | n/a |
KLA | FY to Jun 2026 | $4.05bn | 29.8% | n/a | n/a | n/a |
ASML | FY2025 | €9.52bn | 29.1% | n/a | n/a | n/a |
Teradyne | FY2025 | $451m | 14.1% | n/a | n/a | n/a |
Onto Innovation | FY2025 | $71m | 7.0% | H1 2026 | $32m | 5.0% |
Entegris | FY2025 | $658m | 20.6% | H1 2026 | $316m | 18.6% |
MKS | FY2025 | $931m | 23.7% | H1 2026 | $543m | 23.3% |
Source: Applied Materials 10-K 0001628280-25-056742, Applied Materials 10-Q 0001628280-26-058235, Lam Research 10-K 0000707549-26-000037, KLA 10-K 0000319201-26-000027, ASML 20-F 0001628280-26-011378, Teradyne 10-K 0001193125-26-059002, Onto Innovation 10-K 0001193125-26-066937, Onto Innovation 10-Q 0001193125-26-338401, Entegris 10-K 0001101302-26-000012, Entegris 10-Q 0001101302-26-000150, MKS 10-K 0001193125-26-066820, MKS 10-Q 0001193125-26-337821, SEC filings via SEC-API.io. Revenue by customer or ship to location as each company files it
Applied Materials versus Lam Research, KLA, ASML, Teradyne, Onto Innovation, Entegris and MKS
Peer set: SEC registrants selling equipment, subsystems or materials to chip makers, with TTM revenue above $1bn. ROIC of 48.9% ranks fourth of eight; FCF margin is 18.2% against a 21.1% median.

Table 4.4 Like for like operating comparison, latest twelve months
| Metric | Applied Materials | Lam Research | KLA | ASML | Teradyne | Onto Innovation | Entegris | MKS | Peer median |
|---|---|---|---|---|---|---|---|---|---|
Period | TTM to 26 Jul 2026 | FY to 28 Jun 2026 | FY to 30 Jun 2026 | TTM to 28 Jun 2026 | TTM to 28 Jun 2026 | TTM to 30 Jun 2026 | TTM to 27 Jun 2026 | TTM to 30 Jun 2026 | |
Revenue | $30.84bn | $23.23bn | $13.58bn | €35.33bn | $4.46bn | $1.12bn | $3.33bn | $4.35bn | |
Revenue growth | 7.8% | 26.0% | 11.7% | 9.8% | 57.9% | 8.1% | 3.2% | 16.2% | 11.7% |
Gross margin | 49.4% | 50.5% | 61.3% | 52.7% | 59.2% | 50.4% | 45.5% | 47.0% | 50.5% |
Operating margin | 29.6% | 35.3% | 41.7% | 35.4% | 30.2% | 12.0% | 16.0% | 15.7% | 30.2% |
FCF margin | 18.2% | 21.1% | 27.7% | 28.4% | 17.9% | 22.5% | 17.3% | 10.5% | 21.1% |
SBC % of revenue | 2.3% | 1.7% | 2.3% | 0.6% | 1.7% | 2.8% | 2.2% | 1.3% | 1.7% |
R&D % of revenue | 12.9% | 10.2% | 11.3% | 13.7% | 12.5% | 12.7% | 9.6% | 7.2% | 11.3% |
Inventory days | 154 | 136 | 253 | 257 | 81 | 249 | 142 | 164 | 164 |
ROIC | 48.9% | 77.6% | 72.7% | 65.1% | 44.3% | 8.8% | 6.7% | 9.8% | 44.3% |
Net cash (debt) | $7.96bn | $1.84bn | ($985m) | €5.21bn | $517m | $410m | ($3.10bn) | ($3.33bn) | |
Debt / equity | 0.26x | 0.30x | 0.93x | 0.17x | 0.00x | 0.77x | 0.83x | 1.32x | 0.77x |
Backlog or RPO | Backlog $15.0bn, 26 Oct 2025 | RPO $2.43bn, 28 Jun 2026 | n/a | RPO €46.5bn, 31 Dec 2025 | RPO $130m, 28 Jun 2026 | n/a | n/a | n/a |
Source: Applied Materials 10-Q 0001628280-26-058235, Applied Materials 10-K 0001628280-25-056742, Applied Materials 10-Q 0000006951-25-000037, Lam Research 10-K 0000707549-26-000037, KLA 10-K 0000319201-26-000027, ASML 6-K 0001628280-26-048235, ASML 6-K 0001628280-25-034992, ASML 20-F 0001628280-26-011378, Teradyne 10-K 0001193125-26-059002, Teradyne 10-Q 0001193125-26-327715, Teradyne 10-Q 0000950170-25-101248, Onto Innovation 10-K 0001193125-26-066937, Onto Innovation 10-Q 0001193125-26-338401, Onto Innovation 10-Q 0000950170-25-105161, Entegris 10-K 0001101302-26-000012, Entegris 10-Q 0001101302-26-000150, Entegris 10-Q 0001101302-25-000079, MKS 10-K 0001193125-26-066820, MKS 10-Q 0001193125-26-337821, MKS 10-Q 0001193125-25-175092, SEC filings via SEC-API.io. ROIC as defined under Table 2.2; inventory days use period end inventory over TTM cost of sales. KLA operating income is revenue less costs of revenues, R&D and selling, general and administrative expense. ASML debt at 28 June 2026 is debt at 31 December 2025 less H1 2026 repayments
Valuation multiples against peers
P / FCF is 71.6x against a 60.9x median, and market cap of $402.4bn compares with $399.0bn for Lam Research.

Table 4.5 Valuation at the close on 9 October 2026
| Company | Share price | Shares outstanding | Market cap | EV | EV / sales | P / E | P / FCF |
|---|---|---|---|---|---|---|---|
Applied Materials | $507.03 | 794m | $402.4bn | $394.4bn | 12.8x | 43.7x | 71.6x |
Lam Research | $318.84 | 1.25bn | $399.0bn | $397.1bn | 17.1x | 55.4x | 81.6x |
KLA | $195.57 | 1.31bn | $255.5bn | $256.5bn | 18.9x | 53.4x | 67.8x |
ASML | $1,780.34 | 385m | $686.2bn | $680.3bn | 17.2x | 57.6x | 60.9x |
Teradyne | $402.68 | 156m | $63.0bn | $62.4bn | 14.0x | 55.3x | 78.7x |
Onto Innovation | $294.53 | 49m | $14.5bn | $14.0bn | 12.5x | 110.3x | 57.2x |
Entegris | $159.28 | 153m | $24.3bn | $27.4bn | 8.3x | 79.6x | 42.3x |
MKS | $263.93 | 68m | $17.8bn | $21.2bn | 4.9x | 42.0x | 39.2x |
Peer median | 14.0x | 55.4x | 60.9x |
Source: Market data, 9 October 2026; share counts from the cover of each latest 10-Q, 10-K or 20-F and TTM figures from the filings under Table 4.4, SEC filings via SEC-API.io. P / E is share price over TTM diluted GAAP EPS; EV is market cap less net cash; ASML euro figures converted at $1.1227 per euro. Entegris and Onto Innovation closes are single source figures; an Entegris close of $165.79 from a second source gives P / E of 82.9x, with all three medians unchanged
Table 4.6 Equipment makers outside SEC registration, public figures
| Company | Period | Revenue | Growth | Operating margin | Outlook |
|---|---|---|---|---|---|
Tokyo Electron | Year to 31 Mar 2026 | ¥2.44tn | 0.5% | 25.6% | H1 of year to March 2027: sales ¥1.57tn, up 33.1% |
ASM International | Q2 2026 | €1.00bn | 20% | 32.2% | Q3 2026 revenue €1.1bn ± 5% at constant currency |
Source: Japan Credit Rating Agency sector report, 26 May 2026; ASM International Q2 2026 results, 28 Jul 2026
5 Material Events & Contracts
Applied Materials filed 8 current reports (Form 8-K) between 10 October 2025 and 10 October 2026; the two largest by amount are the $252.5m export control settlement of 11 February 2026 and the workforce reduction of 23 October 2025, which produced $193m of charges.

Applied Materials 8-K filings last twelve months
Table 5.1 Applied Materials 8-K filings, 10 October 2025 to 10 October 2026, newest first
| Filed | Items | Event summary | Accession number |
|---|---|---|---|
27 Aug 2026 | 5.02, 7.01, 9.01 | Board elected Akash Palkhiwala, CFO and Chief Operating Officer of Qualcomm Incorporated, as director and Audit Committee member, effective 27 August 2026; standard non employee director pay applies: $100,000 annual retainer, $25,000 Audit Committee retainer and restricted stock units (RSU) valued at $250,000, each prorated, with RSU vesting on 1 March 2027. | 0001628280-26-059257 |
13 Aug 2026 | 2.02, 9.01 | Q3 FY2026 revenue $9.12bn, up 25% year on year; GAAP diluted EPS $3.17 and non GAAP $3.50; $420m of dividends; Q4 FY2026 outlook of $10.25bn revenue ± $500m and non GAAP diluted EPS of $4.02 ± $0.20. | 0001628280-26-056699 |
14 May 2026 | 2.02, 9.01 | Q2 FY2026 revenue $7.91bn, up 11% year on year; GAAP diluted EPS $3.51 and non GAAP $2.86; quarterly dividend raised 15% from $0.46 to $0.53 per share; agreement with ASMPT Limited to acquire its NEXX business, a supplier of large area advanced packaging deposition equipment; Q3 FY2026 outlook of $8.95bn revenue. | 0001628280-26-035071 |
13 Mar 2026 | 5.07 | Annual meeting of 12 March 2026: 10 directors elected for one year terms with 89.6% (Kevin P. March) to 99.7% (Rani Borkar) of votes for and against; advisory pay vote approved and KPMG LLP ratified as auditor (Table 6.4). | 0001193125-26-106339 |
12 Feb 2026 | 2.02, 9.01 | Q1 FY2026 revenue $7.01bn, down 2% year on year; GAAP diluted EPS $2.54 after a $253m legal settlement charge and $12m of restructuring charges; non GAAP diluted EPS $2.38; Q2 FY2026 outlook of $7.65bn revenue. | 0001628280-26-007661 |
11 Feb 2026 | 7.01, 8.01, 9.01 | Settlement agreement with BIS of 11 February 2026 resolves its inquiry relating to certain China customer shipments, dated November 2020 to July 2022 in Exhibit 99.1, and export controls compliance; one payment of $252.5m; internal audits of the export controls compliance program, training and reporting mechanisms agreed; 8-K states that Department of Justice and SEC closed their inquiries and that neither agency took enforcement action. | 0001628280-26-007444 |
13 Nov 2025 | 2.02, 9.01 | Q4 FY2025 revenue $6.80bn, down 3% year on year, and FY2025 revenue $28.37bn, up 4%; Q4 GAAP diluted EPS $2.38 after $181m of restructuring charges; non GAAP diluted EPS $2.17; Q1 FY2026 outlook of $6.85bn revenue. | 0001628280-25-051998 |
23 Oct 2025 | 2.05, 7.01, 9.01 | Workforce reduction plan approved on 23 October 2025 covering about 4% of the global workforce, across all levels and groups; charges estimated at $160m to $180m, mostly severance paid in cash; most charges expected in Q4 FY2025 and completion in Q1 FY2026. | 0001628280-25-046107 |
Source: Applied Materials Forms 8-K with Exhibit 99.1, SEC filings via SEC-API.io
Form 8-K reports under Items 1.01, 2.01, 2.03 and 5.03 in the window: 0. Form 8-K/A filings in the window: 0.
Applied Materials export control settlement and restructuring charges
BIS payment was recorded as a $253m charge in Q1 FY2026 and paid in full in Q2 FY2026. Restructuring charges reached $193m against the $160m to $180m estimate, and $12m of reserve remained at 26 July 2026.

Table 5.2 Events disclosed in periodic reports and results releases, newest first
| Event date | Where disclosed | Event summary |
|---|---|---|
26 Jul 2026 | 8-K of 13 Aug 2026, Exhibit 99.1 | Regular full time employees 38,900 at the end of Q3 FY2026 against 36,100 at the end of Q3 FY2025. |
26 Jul 2026 | 10-Q Q3 FY2026, Note 13 | BIS settlement agreement includes a denial order that is suspended and will be waived three years after the date of the order, provided the audit requirements are completed on time; standby letters of credit and guarantee instruments carry a maximum exposure of about $282m, and parent guarantees to banks total about $293m. |
26 Jul 2026 | 10-Q Q3 FY2026, Note 6 and MD&A | Government incentives: capital expenditure related incentives reduced gross property, plant and equipment by $1.8bn ($1.2bn at 26 October 2025); investment tax credits recorded $1.2bn ($781m), of which $1.2bn is expected to be refunded in cash; the CHIPS Act credit rate rises from 25% to 35% for qualifying property placed in service after 31 December 2025. |
26 Jul 2026 | 10-Q Q3 FY2026, Notes 3 and 4 | Equity investments $2.42bn: publicly traded securities $1.98bn ($2.11bn at 26 October 2025) and privately held companies $442m ($370m); net gain on equity investments $927m in the first nine months of FY2026 and net loss of $213m in Q3 FY2026. |
26 Jul 2026 | 10-Q Q3 FY2026, cash flow statement | Cash paid for acquisitions, net of cash acquired: $262m in the first nine months of FY2026, of which $175m in Q2 and $87m in Q3 ($29m in the first nine months of FY2025). |
26 Jul 2026 | 10-Q Q3 FY2026, Part II Item 5 | Rule 10b5-1 trading arrangements adopted or terminated by directors and officers in Q3 FY2026: 0; the same count applies to Q1 and Q2 FY2026 and Q4 FY2025. |
Q2 FY2026 | 10-Q Q2 FY2026, Note 13 | $253m paid to BIS in full during the quarter. |
25 Jan 2026 | 10-Q Q1 FY2026, Note 13 | $253m charge recorded as legal settlement in Q1 FY2026, with a matching accrued liability; Department of Justice and SEC informed the company during the quarter that their inquiries were closed. |
12 Dec 2025 | 10-K FY2025, Note 14 | Subpoenas received since 2022 from the Department of Justice, BIS and the SEC on certain China customer shipments and export control compliance; further Department of Justice subpoenas on certain federal award applications and information submitted to the federal government. |
26 Oct 2025 | 10-K FY2025, Note 10 and Item 1 | Q4 FY2025 restructuring charges $181m: $154m of severance and other employee charges and $27m of asset impairments; 36,500 regular full time employees in 25 countries at 26 October 2025. |
26 Oct 2025 | 10-K FY2025, Item 7 | Purchase obligations for goods and services $10.6bn, of which $7.3bn is payable within 12 months; operating lease obligations $565m, of which $104m within 12 months; future interest on senior notes $2.9bn. |
Source: filings linked in each row, SEC filings via SEC-API.io
Applied Materials material contracts, senior notes and credit agreements
Committed bank lines total $4.0bn across two revolving credit agreements, both undrawn at 26 July 2026, against $6.5bn of senior unsecured notes and $100m of commercial paper. Termination date of 364 day agreement is 24 September 2026. Form 8-K filings between 28 August 2026 and 10 October 2026: 0.

Table 5.3 Material contracts register
| Contract and date | Counterparty | What it does | Terms | Filed in |
|---|---|---|---|---|
Five year credit agreement, 24 February 2025 | Bank of America, N.A. as administrative agent, and a lender group | Unsecured revolving credit facility of $2.0bn for general corporate purposes; it replaced a $1.5bn agreement dated 21 February 2020. | Matures 24 February 2030; may rise to $2.5bn with lender commitments; letter of credit sublimit $400m; interest at Term SOFR (secured overnight financing rate plus 0.10%) plus a margin of 0.50% to 1.00% set by public debt ratings, or at a base rate; commitment fee 0.04% to 0.10% a year on unused commitments; covenant: adjusted EBITDA (earnings before interest, tax, depreciation and amortization) for four quarters to net interest expense of at least 3.00 to 1.00; an event of default lets lenders end commitments and demand repayment. Drawn at 26 July 2026: $0. | 8-K of 27 Feb 2025, Exhibit 10.1; 10-K exhibit 10.20 |
364 day credit agreement, 25 September 2025 | Bank of America, N.A. as administrative agent, and a lender group | Unsecured revolving credit facility of $2.0bn for general corporate purposes. | Termination date 24 September 2026; may rise to $3.0bn with lender commitments; margin over Term SOFR 0.50% to 1.00% and commitment fee 0.04% to 0.10% by rating; loans outstanding at termination may convert to term loans due one year later for a fee of 0.75% of the converted principal; same 3.00 to 1.00 interest coverage covenant. Drawn at 26 July 2026: $0. | 8-K of 26 Sep 2025, Exhibit 10.1; 10-K exhibit 10.21 |
Second supplemental indenture, 18 September 2025 | The Bank of New York Mellon Trust Company, N.A. as trustee; underwriters led by Citigroup, Mizuho and MUFG | Issue of $550m 4.000% senior notes due 2031 and $450m 4.600% senior notes due 2036; part of the proceeds repaid $700m of 3.900% notes on 1 October 2025. | Interest paid on 15 January and 15 July; redeemable at any time at a make whole price of Treasury rate plus 10 basis points before the par call dates of 15 December 2030 and 15 October 2035, and at par afterwards; holders may require repurchase at 101% of principal on a change of control with a rating downgrade below investment grade; covenants limit liens on principal property, sale and leaseback transactions and mergers. | 8-K of 19 Sep 2025, Exhibit 4.1; 10-K exhibit 4.9 |
Commercial paper program | Note holders | Short term unsecured notes for general corporate purposes. | Limit $4.0bn, raised from $2.0bn in Q4 FY2025; $100m outstanding at 26 July 2026 at a weighted average rate of 3.78% and maturities of 69 days; $0 outstanding at 26 April 2026. | 10-Q Q3 FY2026, Note 9; 10-K FY2025, Note 9 |
Share repurchase program, approved March 2025 | Board of Directors authorization | Authorizes $10.0bn of common stock repurchases, adding to the $10.0bn program approved in March 2023. | $12.8bn remained available at 26 July 2026; the 1% federal excise tax on repurchases is recorded in equity and reduces the amount available. | 10-Q Q3 FY2026, Note 11 and Part II Item 2 |
BIS settlement agreement, 11 February 2026 | US Commerce Department Bureau of Industry and Security | Resolves the export control inquiry on certain China customer shipments. | One payment of $252.5m, paid in Q2 FY2026; internal audits of the export control compliance program, plus training and reporting mechanisms; a suspended denial order is waived three years after the order date if audit requirements are met on time. | 8-K of 11 Feb 2026; 10-Q Q3 FY2026, Note 13 |
Offer letter, signed 14 August 2013 | Gary E. Dickerson, President and Chief Executive Officer | Sets employment terms from 1 September 2013; employment is at will. | Base salary $980,000 and target bonus of 175% of salary at signing; option over 1.0m shares vesting over four years; on termination by the company other than for cause, death or disability, a lump sum of 275% of base salary, conditional on a release of claims effective within 60 days. | 10-Q of 22 Aug 2013, Exhibit 10.2; 10-K exhibit 10.10 |
Offer letter, 26 February 2022 | Brice Hill, Senior Vice President and Chief Financial Officer | Sets employment terms from 7 March 2022. | Base salary $675,000 and target bonus of 135% of salary at signing; sign on and retention bonus of $2.0m with a 24 month repayment condition; new hire RSU award of $8.5m vesting over three years. | 10-Q of 26 May 2022, Exhibit 10.1; 10-K exhibit 10.19 |
Forms of performance share unit and RSU agreements for executive staff, Q1 FY2026 | Members of senior management | Set the terms of FY2026 long term equity awards under the Employee Stock Incentive Plan. | Performance awards vest after three years at 0% to 200% of target, weighted 50% on non GAAP economic profit and 50% on total shareholder return against the S&P 500 companies; vesting requires continued employment, with partial vesting on a qualifying retirement. | 10-Q Q1 FY2026, Exhibit 10.1 and Note 11 |
First amendment to the 2016 Deferred Compensation Plan, 6 January 2026 | Plan participants | Amends the restated plan with effect from 1 January 2026. | A divorce or annulment order revokes a former spouse's beneficiary designation; plan administration moves to the Vice President, Total Rewards. | 10-Q Q1 FY2026, Exhibit 10.3 |
Form of director indemnification agreement | Directors and certain officers, including the director elected on 27 August 2026 | Company indemnifies directors to the fullest extent permitted by law and advances expenses in proceedings, subject to conditions. | Standard form; entered into on election. | 8-K of 27 Aug 2026; 10-K exhibit 10.1 |
Source: filings and exhibits linked in each row; exhibit numbers from the 10-K FY2025 exhibit index, SEC filings via SEC-API.io
Applied Materials dividend and share repurchase authorization
Cost of shares repurchased was $400m in Q3 FY2026 at an average of $455.43 per share and $1.14bn in 9M FY2026 at $343.16. Board raised the quarterly dividend 15% to $0.53 per share in March 2026.

Table 5.4 Cost of shares repurchased, dividends and repurchase authority by quarter
| Quarter | Repurchase cost including excise tax | Average price per share | Dividends paid | Dividend declared per share | Authority remaining at quarter end |
|---|---|---|---|---|---|
Q3 FY2026 | $400m | $455.43 | $420m | $0.53 | $12.84bn |
Q2 FY2026 | $400m | $352.63 | $365m | $0.53 | $13.24bn |
Q1 FY2026 | $337m | $259.17 | $365m | $0.46 | $13.64bn |
Q4 FY2025 | $856m | $172.46 | $365m | $0.46 | $13.98bn |
Q3 FY2025 | $1.04bn | $164.47 | $368m | $0.46 | n/a |
Q2 FY2025 | $1.69bn | $148.88 | $325m | $0.46 | n/a |
Q1 FY2025 | $1.31bn | n/a | $326m | $0.40 | n/a |
Source: 10-Q Q3 FY2026, 10-Q Q2 FY2026, 10-Q Q1 FY2026, 10-K FY2025, 10-Q Q1 FY2025, results releases in 8-K of 13 Aug 2026, 8-K of 14 May 2026, 8-K of 12 Feb 2026 and 8-K of 13 Nov 2025, SEC filings via SEC-API.io
6 Ownership, Voting Power & Annual Meeting
Applied Materials has one class of common stock with one vote per share, and the ten largest positions identified in Form 13F filings (quarterly institutional holdings reports) at 30 June 2026 total 301.3m shares, 38.0% of 793.6m shares outstanding (10-Q Q3 FY2026). Directors and executive officers as a group hold 2.4m shares, below 1%.
Applied Materials major shareholders and voting power
Table 6.1 Beneficial ownership at 31 December 2025, common stock, one vote per share
| Holder | Role | Shares | % of shares and votes, as filed |
|---|---|---|---|
BlackRock, Inc. | 5% holder; Schedule 13G/A filed 2 Feb 2024 | 76.8m | 9.69% |
The Vanguard Group | 5% holder; Schedule 13G/A filed 13 Feb 2024 | 74.1m | 9.35% |
Gary E. Dickerson | President and CEO, director | 1.4m | below 1% |
Prabu G. Raja | President, Semiconductor Products Group | 406,740 | below 1% |
Omkaram Nalamasu | Senior Vice President, Chief Technology Officer | 122,402 | below 1% |
Aart J. de Geus | Director | 111,042 | below 1% |
Timothy M. Deane | Senior Vice President, Applied Global Services | 80,037 | below 1% |
Brice Hill | Senior Vice President, CFO | 58,062 | below 1% |
Thomas J. Iannotti | Director | 50,568 | below 1% |
Xun (Eric) Chen | Director | 45,229 | below 1% |
Judy Bruner | Director | 34,141 | below 1% |
Scott A. McGregor | Director | 23,836 | below 1% |
Alexander A. Karsner | Director | 16,108 | below 1% |
Rani Borkar | Director | 9,199 | below 1% |
Kevin P. March | Director | 5,939 | below 1% |
James R. Anderson | Director | 806 | below 1% |
Directors and executive officers as a group | 15 persons | 2.4m | below 1% |
Source: DEF 14A, accession 0001193125-26-027307, SEC filings via SEC-API.io
Proxy table takes both 5% holdings from Schedule 13G amendments filed in February 2024 and divides them by 792.7m shares outstanding at 31 December 2025.
Applied Materials 13F institutional holders and Schedule 13G filings

13F filings reporting the stock rose 46.8% from 2,451 to 3,599 over three quarters. Eight holder groups in Figure 6.1 are the Vanguard entities combined, State Street, Invesco, Capital Research Global Investors, Geode, JPMorgan, Morgan Stanley and T. Rowe Price.

Table 6.2 Ten largest 13F positions identified at 30 June 2026 and the prior three quarter ends
| Holder | 30 Sep 2025 | 31 Dec 2025 | 31 Mar 2026 | 30 Jun 2026 | % of shares outstanding |
|---|---|---|---|---|---|
| 74.4m | 75.3m | n/a | 80.2m | 10.1% | |
| n/a | n/a | 51.6m | 51.8m | 6.5% | |
| 38.2m | 37.9m | 37.5m | 38.2m | 4.8% | |
| 8.0m | 25.9m | 26.4m | 28.3m | 3.6% | |
| 14.9m | 32.7m | 29.5m | 22.2m | 2.8% | |
| 20.9m | 18.6m | 21.9m | 22.0m | 2.8% | |
| n/a | n/a | 17.3m | 18.6m | 2.3% | |
| 6.0m | 3.5m | 4.9m | 13.9m | 1.7% | |
| 11.1m | 11.5m | 11.8m | 13.5m | 1.7% | |
| 4.5m | 5.4m | 6.1m | 12.6m | 1.6% | |
The Vanguard Group, filer until Q4 2025 | 76.4m | 76.8m | n/a | n/a | n/a |
Source: 13F-HR and 13F-HR/A filings linked per holder; % on 793.6m shares from the 10-Q cover; SEC filings via SEC-API.io
Invesco figures for 31 December 2025 and 31 March 2026 include 17.9m and 16.7m shares added through 13F-HR/A filings of 15 July 2026 marked as new holdings (Q4 2025, Q1 2026).
Table 6.3 Schedule 13G filings on Applied Materials, 1 January 2024 to 10 October 2026; Schedule 13D filings: 0
| Filed | Filer | Form | Event date | Shares | % of class | Sole voting power | Accession |
|---|---|---|---|---|---|---|---|
29 Apr 2026 | Vanguard Capital Management | SC 13G | 31 Mar 2026 | 59.5m | 7.49% | 7.9m | 0002100119-26-000140 |
26 Mar 2026 | The Vanguard Group | SC 13G/A, amendment 11 | 13 Mar 2026 | 0 | 0% | 0 | 0000102909-26-000678 |
13 Feb 2024 | The Vanguard Group | SC 13G/A | 29 Dec 2023 | 74.1m | 8.92% | 0 | 0001104659-24-020310 |
2 Feb 2024 | BlackRock, Inc. | SC 13G/A | 31 Dec 2023 | 76.8m | 9.2% | 69.1m | 0001086364-24-006194 |
Source: Schedule 13G filings linked by accession number, SEC filings via SEC-API.io
Applied Materials annual meeting voting results 2026
Table 6.4 Annual meeting voting results, 12 March 2026
| Item | Matter | Board position | For | Against | Abstain | Broker non votes | % for |
|---|---|---|---|---|---|---|---|
1 | Elect James R. Anderson | FOR | 590.2m | 8.3m | 666,796 | 85.1m | 98.6% |
1 | Elect Rani Borkar | FOR | 597.0m | 1.5m | 626,246 | 85.1m | 99.7% |
1 | Elect Judy Bruner | FOR | 577.1m | 21.1m | 997,579 | 85.1m | 96.5% |
1 | Elect Xun (Eric) Chen | FOR | 587.8m | 10.8m | 652,724 | 85.1m | 98.2% |
1 | Elect Aart J. de Geus | FOR | 585.5m | 13.0m | 647,643 | 85.1m | 97.8% |
1 | Elect Gary E. Dickerson | FOR | 590.1m | 8.4m | 651,097 | 85.1m | 98.6% |
1 | Elect Thomas J. Iannotti | FOR | 555.4m | 43.2m | 637,190 | 85.1m | 92.8% |
1 | Elect Alexander A. Karsner | FOR | 561.5m | 37.0m | 647,941 | 85.1m | 93.8% |
1 | Elect Kevin P. March | FOR | 536.1m | 62.1m | 984,238 | 85.1m | 89.6% |
1 | Elect Scott A. McGregor | FOR | 591.6m | 6.9m | 650,328 | 85.1m | 98.8% |
2 | Advisory vote on fiscal 2025 executive pay | FOR | 552.5m | 41.5m | 5.2m | 85.1m | 92.2% |
3 | Ratify KPMG LLP as auditor for fiscal 2026 | FOR | 636.4m | 46.8m | 1.0m | 0 | 93.0% |
Source: 8-K Item 5.07, accession 0001193125-26-106339; board positions from the DEF 14A; SEC filings via SEC-API.io. % for is votes for over votes for and against for directors, and over votes for, against and abstain for items 2 and 3

Shares represented were 684.3m, 86.2% of 793.7m entitled to vote. Kevin P. March received 89.6% for, and 97.0% in 2025. Shareholder proposals: 0 in 2026 and 0 in 2025.
Applied Materials CEO pay and pay ratio
Table 6.5 Executive compensation headline figures by fiscal year
| Measure | FY2025 | FY2024 | FY2023 |
|---|---|---|---|
CEO total compensation, Gary E. Dickerson | $29.6m | $27.8m | $26.9m |
of which stock awards | $26.9m | $24.9m | $24.0m |
Median employee total compensation | $89,744 | n/a | n/a |
CEO pay ratio | 330 to 1 | n/a | n/a |
Say on pay support at the following annual meeting | 92.2% | 91.4% | n/a |
Source: DEF 14A; say on pay from 8-K Item 5.07 filings of 13 March 2026 and 10 March 2025; SEC filings via SEC-API.io
7 Insider Activity
Applied Materials insiders sold 9,225 shares for $4.45m in the open market after the Q3 FY2026 quarter end on 26 July 2026 and bought 0; over the twelve months to 10 October 2026 sales total 307,925 shares for $180.64m, 0.04% of 793.6m shares outstanding. Buy to sell ratio on open market transactions (Form 4 codes P and S) is 0.00. Filed in the period: 55 Forms 4, 1 Form 3 and 0 Forms 5 by 17 reporting persons; Forms 4 with the Rule 10b5-1 box checked: 0.
Insider buying and selling by month

June 2026 carries 276,692 shares and $169.03m, 94% of twelve month sale value, from 6 insiders.
Table 7.1 Insider transactions by month, shares
| Month | Sold (S) | Bought (P) | Sale value | Sellers | Awards (A) | Withheld for tax (F) | Gifted (G) |
|---|---|---|---|---|---|---|---|
Oct 2025 | 0 | 0 | 0 | 0 | 149,914 | 147,344 | 0 |
Nov 2025 | 8,000 | 0 | $1.89m | 1 | 0 | 0 | 45 |
Dec 2025 | 609 | 0 | $0.16m | 1 | 363,159 | 244,555 | 265 |
Jan 2026 | 0 | 0 | 0 | 0 | 0 | 2,215 | 0 |
Feb 2026 | 12,003 | 0 | $4.48m | 3 | 0 | 0 | 0 |
Mar 2026 | 0 | 0 | 0 | 0 | 6,669 | 0 | 0 |
Apr 2026 | 0 | 0 | 0 | 0 | 0 | 125 | 0 |
May 2026 | 1,396 | 0 | $0.62m | 2 | 0 | 0 | 17,855 |
Jun 2026 | 276,692 | 0 | $169.03m | 6 | 0 | 0 | 19,295 |
Jul 2026 | 0 | 0 | 0 | 0 | 0 | 125 | 0 |
Aug 2026 | 7,500 | 0 | $3.59m | 1 | 279 | 0 | 0 |
Sep 2026 | 1,000 | 0 | $0.47m | 1 | 0 | 0 | 0 |
Oct 2026 | 725 | 0 | $0.39m | 1 | 0 | 2,913 | 0 |
Total | 307,925 | 0 | $180.64m | 9 | 520,021 | 397,277 | 37,460 |
Source: Forms 3 and 4 filed 10 Oct 2025 to 10 Oct 2026, SEC filings via SEC-API.io. Awards are RSUs and performance share units (PSUs); the period contains 0 option exercises (code M)
Insider sales by person
President and CEO Gary Dickerson sold 161,321 shares for $104.79m in June 2026, 58% of twelve month sale value, and reports 1,599,843 shares and units held afterwards.

Table 7.2 Open market sales (code S) by Form 4 filing, latest first
| Sale date | Insider | Role on Form 4 | Code | Shares sold | Average price | Value | Held after sale | Form 4 |
|---|---|---|---|---|---|---|---|---|
2 Oct 2026 | Adam Sanders | Corporate Controller, Chief Accounting Officer | S | 725 | $544.56 | $0.39m | 3,181 | 0001628280-26-065097 |
8 Sep 2026 | Judy Bruner | Director | S | 1,000 | $465.00 | $0.47m | 25,544 (trust) | 0001628280-26-061408 |
25 Aug 2026 | Brice Hill | SVP, Chief Financial Officer | S | 7,500 | $479.25 | $3.59m | 128,613 | 0001628280-26-059277 |
29 to 30 Jun 2026 | Gary Dickerson | President and CEO, director | S | 78,321 | $709.26 | $55.55m | 1,599,843 | 0001628280-26-046609 |
18 Jun 2026 | Prabu Raja | President, Semiconductor Products Group | S | 10,000 | $633.53 | $6.34m | 346,642 (trust) | 0001628280-26-044741 |
16 Jun 2026 | Thomas Iannotti | Director | S | 9,250 | $599.77 | $5.55m | 40,559 | 0001628280-26-044050 |
15 to 16 Jun 2026 | Omkaram Nalamasu | SVP, Chief Technology Officer | S | 35,000 | $592.98 | $20.75m | 146,916 | 0001628280-26-044048 |
15 to 16 Jun 2026 | Gary Dickerson | President and CEO, director | S | 83,000 | $593.24 | $49.24m | 1,695,164 | 0001628280-26-044046 |
15 Jun 2026 | Timothy Deane | SVP, Applied Global Services | S | 8,621 | $590.76 | $5.09m | 134,631 | 0001628280-26-044039 |
4 Jun 2026 | Prabu Raja | President, Semiconductor Products Group | S | 50,000 | $505.28 | $25.26m | 356,642 (trust) | 0001628280-26-041314 |
3 Jun 2026 | Brice Hill | SVP, Chief Financial Officer | S | 2,500 | $498.86 | $1.25m | 136,113 | 0001628280-26-041310 |
26 May 2026 | Judy Bruner | Director | S | 1,128 | $450.00 | $0.51m | 26,544 (trust) | 0001628280-26-038923 |
22 May 2026 | Adam Sanders | Corporate Controller, Chief Accounting Officer | S | 268 | $434.22 | $0.12m | 4,280 | 0001628280-26-038261 |
25 Feb 2026 | Judy Bruner | Director | S | 2,500 | $391.71 | $0.98m | 26,089 (trust) | 0001628280-26-012916 |
24 Feb 2026 | Adam Sanders | Corporate Controller, Chief Accounting Officer | S | 534 | $379.16 | $0.20m | 4,625 | 0001628280-26-011307 |
23 Feb 2026 | Judy Bruner | Director | S | 3,969 | $377.02 | $1.50m | 28,589 (trust) | 0001628280-26-011308 |
17 Feb 2026 | Brice Hill | SVP, Chief Financial Officer | S | 5,000 | $361.21 | $1.81m | 138,565 | 0001628280-26-009327 |
1 Dec 2025 | Adam Sanders | Corporate Controller, Chief Accounting Officer | S | 609 | $255.53 | $0.16m | 4,413 | 0001628280-25-055159 |
25 Nov 2025 | Teri Little | SVP, Chief Legal Officer | S | 4,000 | $238.24 | $0.95m | 84,351 | 0001628280-25-054205 |
19 Nov 2025 | Teri Little | SVP, Chief Legal Officer | S | 4,000 | $234.08 | $0.94m | 88,351 | 0001628280-25-053663 |
Total | 307,925 | $586.63 | $180.64m |
Source: Forms 4 linked in the table, SEC filings via SEC-API.io. Held after sale is the holding line sold from, as reported, including unvested RSUs and PSUs at target; Judy Bruner and Prabu Raja sold from family trusts

Table 7.3 Sellers: twelve month sales, plan transactions and latest reported holding
| Insider | Role | Sale filings | Shares sold | Sale value | Awards (A) | Withheld for tax (F) | Gifted (G) | Held directly | Held indirectly | Latest Form 4 |
|---|---|---|---|---|---|---|---|---|---|---|
Gary Dickerson | President and CEO, director | 2 | 161,321 | $104.79m | 307,365 | 245,357 | 17,000 | 1,599,843 | 0 | 0001628280-26-046609 |
Prabu Raja | President, Semiconductor Products Group | 2 | 60,000 | $31.60m | 83,646 | 66,236 | 95 | 100,663 | 346,642 | 0001628280-26-044741 |
Omkaram Nalamasu | SVP, Chief Technology Officer | 1 | 35,000 | $20.75m | 28,802 | 20,307 | 15 | 146,916 | 0 | 0001628280-26-044048 |
Brice Hill | SVP, Chief Financial Officer | 3 | 15,000 | $6.65m | 41,102 | 28,062 | 0 | 128,613 | 0 | 0001628280-26-059277 |
Thomas Iannotti | Director | 1 | 9,250 | $5.55m | 741 | 0 | 950 | 39,809 | 1,500 | 0001628280-26-044050 |
Timothy Deane | SVP, Applied Global Services | 1 | 8,621 | $5.09m | 27,831 | 21,000 | 1,545 | 130,462 | 0 | 0001628280-26-065093 |
Judy Bruner | Director | 4 | 8,597 | $3.45m | 741 | 0 | 0 | 741 | 25,544 | 0001628280-26-061408 |
Teri Little | SVP, Chief Legal Officer | 2 | 8,000 | $1.89m | 23,070 | 15,472 | 0 | 91,949 | 0 | 0001628280-25-058747 |
Adam Sanders | Corporate Controller, Chief Accounting Officer | 4 | 2,136 | $0.87m | 1,070 | 843 | 0 | 3,181 | 0 | 0001628280-26-065097 |
Total | 20 | 307,925 | $180.64m | 514,368 | 397,277 | 19,605 |
Source: Forms 4 filed 10 Oct 2025 to 10 Oct 2026, SEC filings via SEC-API.io. Holdings are those on each insider's latest Form 4 in the period
Table 7.4 Ten largest single sale transactions by value
| Date | Insider | Shares | Price | Value | Held after | Form 4 |
|---|---|---|---|---|---|---|
29 Jun 2026 | Gary Dickerson | 50,332 | $700.21 | $35.24m | 1,627,832 | 0001628280-26-046609 |
30 Jun 2026 | Gary Dickerson | 19,970 | $735.22 | $14.68m | 1,599,873 | 0001628280-26-046609 |
4 Jun 2026 | Prabu Raja | 25,309 | $504.66 | $12.77m | 381,333 | 0001628280-26-041314 |
16 Jun 2026 | Gary Dickerson | 15,755 | $590.52 | $9.30m | 1,751,136 | 0001628280-26-044046 |
16 Jun 2026 | Gary Dickerson | 13,505 | $596.82 | $8.06m | 1,702,884 | 0001628280-26-044046 |
4 Jun 2026 | Prabu Raja | 15,083 | $505.51 | $7.62m | 366,250 | 0001628280-26-041314 |
15 Jun 2026 | Gary Dickerson | 11,273 | $590.03 | $6.65m | 1,766,891 | 0001628280-26-044046 |
18 Jun 2026 | Prabu Raja | 10,000 | $633.53 | $6.34m | 346,642 | 0001628280-26-044741 |
16 Jun 2026 | Gary Dickerson | 10,411 | $592.18 | $6.17m | 1,731,539 | 0001628280-26-044046 |
29 Jun 2026 | Gary Dickerson | 7,989 | $701.33 | $5.60m | 1,619,843 | 0001628280-26-046609 |
Source: Forms 4 linked in the table, SEC filings via SEC-API.io. Prices as reported; Forms 4 give a weighted average where a line was executed at several prices
Stock awards, tax withholding and gifts
Shares withheld for tax on vesting total 397,277 ($98.65m), 1.29 times the shares sold in the open market.

Table 7.5 Insider transactions by type
| Type | Code | Transactions | Insiders | Shares or units | Value at reported price |
|---|---|---|---|---|---|
Open market purchase | P | 0 | 0 | 0 | 0 |
Open market sale | S | 45 | 9 | 307,925 | $180.64m |
Shares withheld for tax on vesting | F | 14 | 7 | 397,277 | $98.65m |
PSUs earned on performance goals | A | 8 | 6 | 285,788 | n/a |
PSUs granted at target, 11 Dec 2025 | A | 6 | 6 | 140,318 | n/a |
RSUs granted to officers, 11 Dec 2025 | A | 7 | 7 | 86,780 | n/a |
RSUs granted to directors | A | 11 | 10 | 7,135 | n/a |
Gift, shares disposed | G | 8 | 6 | 37,460 | n/a |
Option exercise | M | 0 | 0 | 0 | 0 |
Source: Forms 4 filed 10 Oct 2025 to 10 Oct 2026, SEC filings via SEC-API.io. PSUs earned include 149,914 units that vested on 26 October 2025 and 135,874 units earned on 11 December 2025. Gifts include 17,855 shares by director Aart de Geus on 21 May 2026 and 17,000 shares by Gary Dickerson on 16 June 2026
Form 144 notices of proposed sale and Form 3
Form 144 notices cover 347,968 shares at a stated market value of $202.72m, against 307,925 shares reported sold on Forms 4. Director Akash Palkhiwala filed a Form 3 with an event date of 27 August 2026 and 0 securities owned, and received 279 RSUs that day (Form 4).
Table 7.6 Form 144 notices filed 10 Oct 2025 to 10 Oct 2026, by person
| Person for whose account | Relationship stated | Notices | Filed | Shares to be sold | Stated market value | Shares sold on Forms 4 | Form 144 |
|---|---|---|---|---|---|---|---|
Gary Dickerson | Officer | 2 | 15 to 29 Jun 2026 | 200,000 | $129.00m | 161,321 | 1, 2 |
Prabu Raja | Officer | 1 | 4 Jun 2026 | 60,000 | $30.24m | 60,000 | 1 |
Omkaram Nalamasu | Officer | 1 | 15 Jun 2026 | 35,000 | $20.65m | 35,000 | 1 |
Brice Hill | Officer | 3 | 17 Feb to 25 Aug 2026 | 17,500 | $6.63m | 15,000 | 1, 2, 3 |
Thomas Iannotti | Director, Board Chair | 1 | 16 Jun 2026 | 9,250 | $5.55m | 9,250 | 1 |
Timothy Deane | Officer | 1 | 15 Jun 2026 | 8,621 | $5.09m | 8,621 | 1 |
Judy Bruner | Director | 4 | 23 Feb to 8 Sep 2026 | 8,597 | $3.45m | 8,597 | 1, 2, 3, 4 |
Teri Little | Officer | 1 | 19 Nov 2025 | 9,000 | $2.11m | 8,000 | 1 |
Total | 14 | 347,968 | $202.72m | 307,925 |
Source: Forms 144 linked in the table, SEC filings via SEC-API.io. Adam Sanders (2,136 shares sold) filed 0 Forms 144
8 Risk Factors
Q3 FY2026 10-Q lists 25 risk factors in 9,186 words, (7.2)% against the FY2025 10-K, and replaces the subpoena disclosure carried since 2022 with a $253m export controls settlement that carries a suspended denial order for three years. 10 factors carry new substance since the FY2025 10-K, which itself added 1 factor (tariffs), reworded 16 and merged 2 into 1.
Applied Materials risk factor count and word count by category

Table 8.1 Risk factors and words by category as filed
| Category | FY2024 10-K factors | FY2024 10-K words | FY2025 10-K factors | FY2025 10-K words | Q3 FY2026 10-Q factors | Q3 FY2026 10-Q words |
|---|---|---|---|---|---|---|
Business and Industry Risks | 12 | 6,355 | 12 | 5,484 | 12 | 5,240 |
Operational and Financial Risks | 9 | 3,325 | 9 | 3,466 | 9 | 3,146 |
Legal, Compliance and Other Risks | 4 | 1,004 | 4 | 944 | 4 | 800 |
Total | 25 | 10,684 | 25 | 9,894 | 25 | 9,186 |
Source: FY2024 10-K, FY2025 10-K, Q3 FY2026 10-Q (Item 1A; words counted per factor heading and body); SEC filings via SEC-API.io
Risk factors added, reworded and dropped
Table 8.2 Status of each risk factor: FY2025 10-K against FY2024 10-K, and Q3 FY2026 10-Q against FY2025 10-K
| Risk factor | Words FY2024 / FY2025 / Q3 FY2026 | FY2025 10-K status | Q3 FY2026 10-Q status | What changed |
|---|---|---|---|---|
| Business and Industry Risks | ||||
Industry volatility and AI demand | 278 / 289 / 320 | Reworded | Reworded | FY2025 describes AI as "a significant demand driver" (FY2024: "a relatively new demand driver"); Q2 FY2026 adds that failing to meet customer demand may cost business or customer trust and that costs may be incurred ahead of demand that is then unrealized. |
Global economy | 576 / 327 / 274 | Reworded | Unchanged | FY2025 adds tariffs and trade policies to the listed adverse conditions and removes the parts shortage passage; Q1 FY2026 shortens the wording. |
Global business, export controls and China | 1,596 / 1,246 / 1,307 | Reworded | Reworded | Revenue outside United States was 86% in FY2024, 89% in FY2025 and 85% in Q3 FY2026; Q1 FY2026 replaces the open subpoena text with the $253m settlement and suspended denial order; Q2 FY2026 adds a sentence on conflict in the Middle East. |
Trade policy and tariffs | 0 / 400 / 400 | New | Unchanged | New 400 word factor: tariffs raise input costs and customers' import costs, and China's 2025 export controls cover rare earth minerals used in certain products. |
Customer concentration | 359 / 334 / 228 | Reworded | Unchanged | FY2025 names China, Taiwan and Korea (FY2024 also Japan); two customers were 19% and 15% of FY2025 revenue and 20% and 14% of revenue for nine months of FY2026. |
Supply chain | 995 / 780 / 680 | Reworded | Reworded | FY2025 adds rare earth export restrictions, tariff uncertainty and supplier cybersecurity incidents as causes; Q2 FY2026 adds fixed costs from underutilized capacity and lower gross margin if expected demand is unrealized. |
Industry factors including semiconductors | 392 / 709 / 613 | Reworded | Reworded | FY2025 merges two FY2024 factors (392 and 526 words) and removes the bullet on lower service revenue per wafer start in Korea and Taiwan; Q1 FY2026 adds the timing, level and technology of data center buildout driven by AI. |
Semiconductor industry factors (FY2024 heading) | 526 / 0 / 0 | Dropped | Dropped | Heading removed in FY2025; content merged into the industry factors row above. |
Competition and technology change | 452 / 399 / 346 | Reworded | Unchanged | FY2025 names the EPIC Center as a project to complete on schedule and on budget; company wide construction in progress was $2.04bn at Q3 FY2026 ($1.46bn at FY2025 year end). |
Government incentives | 192 / 191 / 185 | Unchanged | Unchanged | Clawback, audit and compliance terms are carried over; capital expenditure incentives had reduced gross property, plant and equipment by $1.8bn at Q3 FY2026 ($1.2bn at FY2025 year end). |
Display industry | 385 / 193 / 187 | Reworded | Unchanged | FY2025 cuts the text from 385 to 193 words in the year Display stopped being a separately reported segment. |
New and related markets | 303 / 297 / 366 | Unchanged | Reworded | Q1 FY2026 adds that the company expects to continue "investing significant resources" and that failure of a target market or industry could affect results. |
Use of AI | 301 / 319 / 334 | Reworded | Reworded | FY2025 adds reliance on third party AI providers; Q3 FY2026 adds AI agents that may disrupt business processes or lose intellectual property or critical data. |
| Operational and Financial Risks | ||||
Intellectual property | 401 / 385 / 386 | Unchanged | Unchanged | Sentences are shortened and the listed exposures are the same in all three filings. |
Cybersecurity | 719 / 698 / 596 | Reworded | Reworded | FY2025 adds quantum computing as a threat to encryption; Q2 FY2026 adds operational technology systems, attacks enabled by large language models and automated attacks that shorten response time. |
Acquisitions and divestitures | 767 / 786 / 687 | Reworded | Unchanged | FY2025 adds post closing investigations of transactions completed without notification, acquired trade control programs and government enforcement actions. |
Key employees | 166 / 175 / 164 | Unchanged | Unchanged | FY2025 adds hiring and integrating workers in different countries; Q3 FY2026 cites immigration and work authorization requirements. |
Tax law | 485 / 622 / 557 | Reworded | Reworded | FY2025 adds the One Big Beautiful Bill Act and a full valuation allowance on corporate alternative minimum tax credits ($407m; effective tax rate 24.5% against 12.0% in FY2024); Q1 FY2026 states that global minimum tax laws materially increase foreign taxes from Q1 FY2026. |
Indebtedness | 260 / 272 / 255 | Reworded | Reworded | Senior notes cited: $6.2bn, $6.5bn and $6.5bn; revolving credit capacity cited: $1.5bn, $4.1bn and $4.0bn. |
Information systems | 173 / 170 / 153 | Unchanged | Unchanged | Implementation risk for new enterprise systems is carried over in shorter sentences. |
Impairment | 182 / 186 / 182 | Reworded | Unchanged | FY2025 states that impairment charges have been recorded; a $41m goodwill impairment was recognized in Q4 FY2025. |
Dividends and repurchases | 172 / 172 / 166 | Unchanged | Unchanged | Text is carried over; $12.8bn of repurchase authorization remained at Q3 FY2026. |
| Legal, Compliance and Other Risks | ||||
Legal proceedings and investigations | 232 / 238 / 214 | Reworded | Reworded | FY2025 adds anti corruption and government contracting compliance; Q1 FY2026 removes the sentence on subpoenas covering China shipments, export controls and federal award applications. |
Global regulation | 202 / 158 / 158 | Unchanged | Unchanged | The list of regulated areas is carried over with the sustainability and climate qualifier removed in FY2025. |
Sustainability targets | 356 / 334 / 235 | Reworded | Unchanged | FY2025 removes the list of target areas (emissions, diversity and inclusion, human rights) and cites International Sustainability Standards Board standards in place of the SEC climate rule. |
Environment, health and safety | 214 / 214 / 193 | Unchanged | Unchanged | FY2025 adds import and export to the product restrictions that a compliance failure could trigger. |
Source: FY2024 10-K, FY2025 10-K, Q1 FY2026 10-Q, Q2 FY2026 10-Q, Q3 FY2026 10-Q; SEC filings via SEC-API.io

Tariff mentions rose from 6 in the FY2024 10-K to 17 in the FY2025 10-K, and subpoena mentions fell from 5 to 2 after the settlement.

Export controls settlement and government investigations
BIS settlement equals 3.4% of nine month FY2026 operating income of $7.43bn. 10-Q states that a breach of its terms could end the suspension of the denial order and prohibit exports of certain products.
Table 8.3 Government investigations as disclosed
| Filing | Filed | Disclosure |
|---|---|---|
FY2024 10-K | 13 Dec 2024 | Multiple subpoenas since 2022 from the Department of Justice (DOJ), BIS and the SEC on certain China customer shipments and export controls compliance; subpoenas also covered certain federal award applications. |
FY2025 10-K | 12 Dec 2025 | Same disclosure; Note 14 gives no estimate of a range of loss or penalties. |
8-K | 11 Feb 2026 | DOJ and SEC informed the company that they closed their inquiries with no enforcement action; settlement agreement with BIS for a single payment of $252.5m plus internal audits, training and reporting mechanisms. |
Q1 FY2026 10-Q | 19 Feb 2026 | Risk factor text rewritten around the settlement; the legal proceedings factor drops its subpoena sentence. |
Q3 FY2026 10-Q | 20 Aug 2026 | $253m paid in full in Q2 FY2026 and recorded as a legal settlement charge; denial order is suspended and will be waived three years after the order date if audit requirements are completed on time. |
Source: FY2024 10-K, FY2025 10-K, 8-K filed 11 February 2026, Q1 FY2026 10-Q, Q3 FY2026 10-Q; SEC filings via SEC-API.io
Market risk sensitivities and cybersecurity disclosure
Currency hedge sensitivity to a 10% adverse move rose to $301m at Q3 FY2026 from $177m at FY2025 year end. Item 1C of the FY2025 10-K reports zero cybersecurity incidents with a material effect and quarterly reports by the Chief Information Security Officer to the Audit Committee.

Table 8.4 Item 7A market risk disclosures
| Measure | 27 Oct 2024 | 26 Oct 2025 | 26 Jul 2026 |
|---|---|---|---|
Available for sale investments, market value | $3.2bn | $3.2bn | $5.0bn |
Fair value loss on investments, rates up 100 basis points | $36m | $36m | $49m |
Long term senior notes, principal | $5.5bn | $6.5bn | $5.3bn |
Long term senior notes, estimated fair value | $5.1bn | $6.2bn | $4.7bn |
Fair value increase of notes, rates down 100 basis points | $428m | $462m | $390m |
Fair value loss on currency hedges, 10% adverse move | $141m | $177m | $301m |
Fair value loss on interest rate hedges, rates up 100 basis points | n/a | n/a | $34m |
Source: FY2024 10-K and FY2025 10-K (Item 7A), Q3 FY2026 10-Q (Part I Item 3); SEC filings via SEC-API.io
9 Stock Price, Scenarios & Sensitivity
AMAT closed at $507.03 on 9 October 2026, 43.7x TTM diluted GAAP EPS of $11.60; the multiple at fiscal year end ranged from 11.9x to 26.9x for FY2021 to FY2025. Three sets of stated assumptions for FY2027 to FY2029 give arithmetic outcomes of $194, $613 and $1,110 per share at end FY2029.
AMAT share price and moves after results
Table 9.1 Share price range, price change and further TTM multiples
| Measure | Value | Basis |
|---|---|---|
52 week closing range | $209.95 to $723.00 | Low on 10 October 2025, high on 30 June 2026 |
52 week intraday range | $203.40 to $739.67 | Low on 14 November 2025, high on 30 June 2026 |
Change since October 2021 month end | 271% | From $136.65 |
Change since 31 December 2025 | 97.3% | From $256.99 |
EV / operating income | 43.1x | TTM operating income $9.14bn |
FCF yield | 1.4% | TTM FCF $5.62bn over market cap |
Dividend yield | 0.42% | Quarterly dividend of $0.53 per share, annualized |
Source: Market data, 9 October 2026; 10-Q Q3 FY2026, 10-K FY2025; SEC filings via SEC-API.io. Price, market cap, EV and the main multiples are in Table 0.1. TTM net income includes $1.45bn of pretax gains on equity investments

Table 9.2 Share price after the last four results releases
| Release | Quarter | Revenue | Year on year | Diluted EPS | Close on release day | Next session close | Next session change | Change after five sessions |
|---|---|---|---|---|---|---|---|---|
13 November 2025 | Q4 FY2025 | $6.80bn | (3.5)% | $2.38 | $223.23 | $226.01 | 1.2% | (1.3)% |
12 February 2026 | Q1 FY2026 | $7.01bn | (2.1)% | $2.54 | $328.39 | $354.91 | 8.1% | 14.3% |
14 May 2026 | Q2 FY2026 | $7.91bn | 11.4% | $3.51 | $440.56 | $436.62 | (0.9)% | (3.0)% |
13 August 2026 | Q3 FY2026 | $9.12bn | 24.8% | $3.17 | $534.54 | $507.18 | (5.1)% | (7.2)% |
Source: 8-K of 13 November 2025, 8-K of 12 February 2026, 8-K of 14 May 2026, 8-K of 13 August 2026; Market data, 9 October 2026; SEC filings via SEC-API.io. All four releases followed the market close
Scenario analysis FY2027 to FY2029: worst, base and best case
Base case implied price of $613 equals the current price of $507.03 at revenue growth of 6.1% per year, at an exit P / E of 26.5x or at an operating margin of 28.5%, each changed alone.
Table 9.3 FY2026 estimate: nine months filed plus Q4 FY2026 guidance
| Item | Nine months FY2026 filed | Q4 FY2026 | FY2026 estimate | Basis of the Q4 FY2026 figure |
|---|---|---|---|---|
Revenue | $24.04bn | $10.25bn | $34.29bn | Company guidance midpoint, range of $500m either side |
Revenue growth, year on year | 11.4% | 50.7% | 20.9% | Derived |
Semiconductor Systems revenue | $18.15bn | $7.90bn | $26.05bn | Earnings call, 13 August 2026 |
Applied Global Services revenue | $5.00bn | $1.84bn | $6.84bn | Earnings call, 13 August 2026 |
Other revenue | $886m | $510m | $1.40bn | Earnings call, 13 August 2026 |
Gross margin (GAAP) | 49.8% | 50.3% | 49.9% | Non GAAP gross margin of about 50.4% (earnings call, 13 August 2026) less $11m of acquisition items, the Q3 FY2026 amount |
Operating income (GAAP) | $7.43bn | $3.56bn | $10.99bn | Non GAAP gross profit less non GAAP operating expenses of about $1.58bn (earnings call, 13 August 2026) and $21m of adjustments, the Q3 FY2026 amount |
Operating margin (GAAP) | 30.9% | 34.8% | 32.1% | Derived |
Gains on equity investments, pretax | $927m | $0 | $927m | Assumption |
Effective tax rate | 12.9% | 12.9% | 12.9% | Assumption: nine month rate |
Diluted shares | 799m | 800m | 799m | Assumption: Q3 FY2026 count |
Diluted GAAP EPS | $9.22 | $3.92 | $13.14 | Derived; interest income and expense at Q3 FY2026 amounts |
Diluted EPS, equity investment gains set to zero | $8.21 | $3.92 | $12.13 | Derived |
FCF | $3.58bn | $2.62bn | $6.20bn | Assumption: Q3 FY2026 FCF margin of 25.6% |
Source: 10-Q Q3 FY2026, 8-K Exhibit 99.1 of 13 August 2026; SEC filings via SEC-API.io. Company guidance for Q4 FY2026 non GAAP diluted EPS is $4.02, range of $0.20 either side. Nine month operating income includes a legal settlement charge of $253m
Table 9.4 Scenario assumptions and definitions
| Input, FY2027 to FY2029 | Worst | Base | Best | Basis |
|---|---|---|---|---|
Starting point | FY2026 estimate | FY2026 estimate | FY2026 estimate | Table 9.3 and 800m diluted shares |
WFE market growth, FY2027, FY2028, FY2029 | 3%, (12)%, (2)% | 21.8%, 14.1%, 5% | 28%, 20%, 12% | Assumption. Base case FY2027 and FY2028 apply the SEMI forecast for calendar 2027 and 2028 (Table 4.1) to fiscal years ending in October |
Semiconductor Systems growth against market, points per year | (2) | 0 | 2 | Assumption. Segment revenue grows at the market rate plus the stated points |
AGS revenue growth per year | 6% | 12% | 15% | Assumption. Q3 FY2026 growth was 22% |
Other revenue per year | $1.60bn | $1.60bn | $1.60bn | Assumption: $400m per quarter. Nine month FY2026 Other revenue was $886m |
China share of revenue | 20% | 25% | 22% | Assumption. Nine month FY2026 share was 28% |
Gross margin | 48.0% | 50.5% | 52.0% | Assumption. Q3 FY2026 gross margin was 50.3% |
Operating margin (GAAP) | 28.0% | 34.5% | 37.0% | Assumption. Q3 FY2026 operating margin was 33.7% |
Gains and losses on equity investments | $0 | $0 | $0 | Assumption |
Interest income per year | $401m | $401m | $401m | Assumption: FY2026 estimate held constant |
Interest expense per year | $274m | $274m | $274m | Assumption: FY2026 estimate held constant |
Effective tax rate | 13% | 13% | 13% | Assumption. Nine month FY2026 rate was 12.9% |
FCF margin | 17% | 23% | 26% | Assumption. TTM FCF margin was 18.2% |
Share of FCF paid out as dividends and repurchases | 80% | 90% | 100% | Assumption. Nine month FY2026 share was 65% |
Dividend per share growth per year, from $2.05 in FY2026 | 15% | 15% | 15% | Assumption. March 2026 increase was 15% |
Repurchase price per share | $507.03 | $507.03 | $507.03 | Assumption: close on 9 October 2026 |
Shares issued under stock plans per year | 5m | 5m | 5m | Assumption. Nine month FY2026 issuance was 4m |
Exit P / E on FY2029 EPS | 20x | 32x | 44x | Assumption. FY2021 to FY2025 average of October month end close over fiscal year diluted GAAP EPS is 19.5x, current TTM multiple is 43.7x and their midpoint is 31.6x |
Net income | Derived | Derived | Derived | (Operating income plus interest income less interest expense) times (1 less tax rate) |
Repurchases each year | Derived | Derived | Derived | FCF times payout share less dividends; shares retired equal repurchases over repurchase price |
Diluted EPS | Derived | Derived | Derived | Net income over the average of opening and closing diluted shares |
Implied price | Derived | Derived | Derived | FY2029 diluted EPS times exit P / E, undiscounted |
Source: 10-Q Q3 FY2026, 8-K Exhibit 99.1 of 13 August 2026, 10-K FY2025; SEC filings via SEC-API.io; Market data, 9 October 2026; SEMI forecast of 14 July 2026 linked in Table 4.1
Table 9.5 FY2029 scenario outcomes
| Outcome | Worst | Base | Best |
|---|---|---|---|
FY2029 revenue | $31.47bn | $49.22bn | $59.10bn |
Revenue growth per year, FY2026E to FY2029 | (2.8)% | 12.8% | 19.9% |
FY2029 Semiconductor Systems revenue | $21.72bn | $38.01bn | $47.09bn |
FY2029 Applied Global Services revenue | $8.15bn | $9.62bn | $10.41bn |
FY2029 China revenue (TTM $8.65bn) | $6.29bn | $12.31bn | $13.00bn |
FY2029 gross profit | $15.11bn | $24.86bn | $30.73bn |
FY2029 operating income | $8.81bn | $16.98bn | $21.87bn |
FY2029 net income | $7.78bn | $14.88bn | $19.14bn |
FY2029 FCF | $5.35bn | $11.32bn | $15.37bn |
FCF, FY2027 to FY2029 cumulative | $16.75bn | $31.42bn | $40.14bn |
Dividends, FY2027 to FY2029 cumulative | $6.55bn | $6.47bn | $6.42bn |
Repurchases, FY2027 to FY2029 cumulative | $6.86bn | $21.80bn | $33.73bn |
Diluted shares, end of FY2029 | 801m | 772m | 748m |
Diluted share count change per year | 0.1% | (1.2)% | (2.2)% |
FY2029 diluted EPS | $9.71 | $19.15 | $25.22 |
Implied price, end FY2029 | $194 | $613 | $1,110 |
Against close of $507.03 | (62)% | 21% | 119% |
Source: arithmetic outcomes of the assumptions in Table 9.4

Table 9.6 Scenario paths by fiscal year
| Case | Fiscal year | Revenue | Growth | Operating income | FCF | Dividends | Repurchases | Diluted shares, year end | Diluted EPS |
|---|---|---|---|---|---|---|---|---|---|
Worst | FY2027 | $35.16bn | 2.6% | $9.85bn | $5.98bn | $1.89bn | $2.90bn | 799m | $10.85 |
Worst | FY2028 | $31.91bn | (9.2)% | $8.94bn | $5.43bn | $2.17bn | $2.17bn | 800m | $9.86 |
Worst | FY2029 | $31.47bn | (1.4)% | $8.81bn | $5.35bn | $2.49bn | $1.79bn | 801m | $9.71 |
Base | FY2027 | $40.99bn | 19.6% | $14.14bn | $9.43bn | $1.89bn | $6.60bn | 792m | $15.60 |
Base | FY2028 | $46.38bn | 13.2% | $16.00bn | $10.67bn | $2.15bn | $7.45bn | 782m | $17.83 |
Base | FY2029 | $49.22bn | 6.1% | $16.98bn | $11.32bn | $2.44bn | $7.75bn | 772m | $19.15 |
Best | FY2027 | $43.33bn | 26.4% | $16.03bn | $11.27bn | $1.89bn | $9.38bn | 786m | $17.72 |
Best | FY2028 | $51.96bn | 19.9% | $19.23bn | $13.51bn | $2.13bn | $11.38bn | 769m | $21.65 |
Best | FY2029 | $59.10bn | 13.7% | $21.87bn | $15.37bn | $2.40bn | $12.97bn | 748m | $25.22 |
Source: arithmetic outcomes of the assumptions in Table 9.4
Critical factors behind the best case and demand drivers
Earnings call, 13 August 2026: management stated a plan to double quarterly system output from current levels by 2028 and a long term AGS growth rate in the mid teens.
Table 9.7 Best case factors and the filed data point for each
| Factor | Filed data point | Best case input it supports |
|---|---|---|
Q4 FY2026 revenue guidance | $10.25bn at midpoint, 51% above Q4 FY2025 and 12% above Q3 FY2026; four quarters at that level equal $41.00bn | Market growth of 28% in FY2027 |
Semiconductor Systems demand | Q3 FY2026 segment revenue $7.04bn, up 27% year on year; DRAM 29% of nine month segment revenue against 25% a year earlier | Market growth path and 2 points above market |
Customer prepayments | Contract liabilities $3.27bn at 26 July 2026, up 27% from $2.57bn at 26 October 2025 | Market growth path |
Manufacturing capacity | Nine month capital expenditure $1.99bn against $1.48bn a year earlier; property, plant and equipment $5.61bn against $4.61bn at 26 October 2025 | FY2029 Semiconductor Systems revenue of $47.09bn |
Revenue outside China | United States revenue $1.37bn in Q3 FY2026, up 100% year on year; China $2.51bn, 28% of revenue against 35% a year earlier | China share of 22% with China revenue of $13.00bn |
Services | AGS revenue $1.78bn in Q3 FY2026, up 22% year on year, at an operating margin of 30.1% | AGS growth of 15% per year |
Gross margin | 50.3% in Q3 FY2026 against 48.8% a year earlier; the 10-Q attributes the increase to higher revenue, higher average selling prices, lower material and manufacturing costs and product mix | Gross margin of 52.0% |
Operating margin | 33.7% in Q3 FY2026; Semiconductor Systems segment margin 37.7% | Operating margin of 37.0% |
Capital return capacity | Repurchase authorization remaining $12.8bn; nine month cost of shares repurchased $1.14bn at an average of $343.16 per share and dividends $1.15bn; net cash $7.96bn | Payout of 100% of FCF and share count change of (2.2)% per year |
Source: 10-Q Q3 FY2026, 8-K Exhibit 99.1 of 13 August 2026, 10-K FY2025; SEC filings via SEC-API.io
Sensitivity analysis: growth, exit multiple and operating margin
Exit P / E moves the base case implied price between $383 and $843, the market growth path between $424 and $700, and operating margin between $498 and $657. A China share of 15% with base case revenue outside China unchanged gives $538; a share of 30% gives $659.


Table 9.8 Filed history FY2021 to FY2025, FY2026 estimate and scenario inputs
| Measure | FY2021 | FY2022 | FY2023 | FY2024 | FY2025 | FY2026E | Worst | Base | Best |
|---|---|---|---|---|---|---|---|---|---|
Revenue growth | 34.1% | 11.8% | 2.8% | 2.5% | 4.4% | 20.9% | (2.8)% | 12.8% | 19.9% |
Gross margin | 47.3% | 46.5% | 46.7% | 47.5% | 48.7% | 49.9% | 48.0% | 50.5% | 52.0% |
Operating margin (GAAP) | 29.9% | 30.2% | 28.9% | 28.9% | 29.2% | 32.1% | 28.0% | 34.5% | 37.0% |
FCF margin | 20.7% | 17.9% | 28.6% | 27.6% | 20.1% | 18.1% | 17.0% | 23.0% | 26.0% |
Effective tax rate | 13.0% | 14.1% | 11.1% | 12.0% | 24.5% | 12.9% | 13.0% | 13.0% | 13.0% |
China share of revenue | 33% | 28% | 27% | 37% | 30% | 28% | 20% | 25% | 22% |
Gains on equity investments, pretax | $99m | $7m | $27m | $20m | $821m | $927m | $0 | $0 | $0 |
Dividends and repurchases, share of FCF | 96% | 151% | 42% | 67% | 110% | 65% | 80% | 90% | 100% |
Diluted share count change | n/a | (4.6)% | (3.6)% | (1.3)% | (3.1)% | (1.1)% | 0.1% | (1.2)% | (2.2)% |
Diluted EPS | $6.40 | $7.44 | $8.11 | $8.61 | $8.66 | $12.13 | $9.71 | $19.15 | $25.22 |
P / E, October month end close | 21.4x | 11.9x | 16.3x | 21.1x | 26.9x | 41.8x | 20x | 32x | 44x |
Source: 10-K FY2021, 10-K FY2023, 10-K FY2025, 10-Q Q3 FY2026, 8-K Exhibit 99.1 of 13 August 2026; Market data, 9 October 2026; SEC filings via SEC-API.io. Scenario columns show the annual input for FY2027 to FY2029, FY2029 EPS and the exit multiple. FY2026E China share, gains and payout cover the nine months filed; FY2026E EPS sets equity investment gains to zero and its P / E uses the 9 October 2026 close
Sources and method
Filings used: 10-K FY2025 and the 10-K filings for FY2021 to FY2024; 10-Q Q3 FY2026 and the 10-Q filings for Q1 and Q2 FY2026; DEF 14A of 2026; 8-K filings of 13 August 2026 (Q3 FY2026 results), 11 February 2026 (BIS settlement), 13 March 2026 (annual meeting votes) and 23 October 2025 (workforce reduction); Forms 3, 4 and 144, Form 13F and Schedule 13G filings; peer 10-K, 10-Q, 20-F and 6-K filings linked under each table.
SEC filing data retrieved through SEC-API.io.
Market data as of 9 October 2026. Peer and market research figures from SEMI, WSTS and the other named publishers carry their publication dates.
Earnings call material comes from public transcripts and is given in indirect speech with the call date.
Scenario figures are arithmetic outcomes of stated assumptions.
Sources appendix
Every filing referenced in this analysis, sorted by form and then by date. Each accession number links to the filing on sec.gov. Count: 162 filings.
Table A.1 Applied Materials, Inc. filings, with ownership filings by holders and insiders
Table A.2 Filings of peers and other companies
| Company | Form | Period or filing date | Accession number |
|---|---|---|---|
| ASML | 20-F | 31 Dec 2025 | 0001628280-26-011378 |
| ASML | 6-K | 28 Jun 2026 | 0001628280-26-048235 |
| ASML | 6-K | 29 Jun 2025 | 0001628280-25-034992 |
| Entegris | 10-K | 31 Dec 2025 | 0001101302-26-000012 |
| Entegris | 10-Q | 27 Jun 2026 | 0001101302-26-000150 |
| Entegris | 10-Q | 28 Jun 2025 | 0001101302-25-000079 |
| Intel | 10-K | 27 Dec 2025 | 0000050863-26-000011 |
| Intel | 10-Q | 27 Jun 2026 | 0000050863-26-000157 |
| KLA | 10-K | 30 Jun 2026 | 0000319201-26-000027 |
| Lam Research | 10-K | 28 Jun 2026 | 0000707549-26-000037 |
| MKS | 10-K | 31 Dec 2025 | 0001193125-26-066820 |
| MKS | 10-Q | 30 Jun 2026 | 0001193125-26-337821 |
| MKS | 10-Q | 30 Jun 2025 | 0001193125-25-175092 |
| Micron | 10-K | 3 Sep 2026 | 0000723125-26-000023 |
| Onto Innovation | 10-K | 3 Jan 2026 | 0001193125-26-066937 |
| Onto Innovation | 10-Q | 30 Jun 2026 | 0001193125-26-338401 |
| Onto Innovation | 10-Q | 28 Jun 2025 | 0000950170-25-105161 |
| TSMC | 20-F | 31 Dec 2025 | 0001628280-26-025362 |
| Teradyne | 10-K | 31 Dec 2025 | 0001193125-26-059002 |
| Teradyne | 10-Q | 28 Jun 2026 | 0001193125-26-327715 |
| Teradyne | 10-Q | 29 Jun 2025 | 0000950170-25-101248 |
This report is for information only and is not financial advice.
Read next
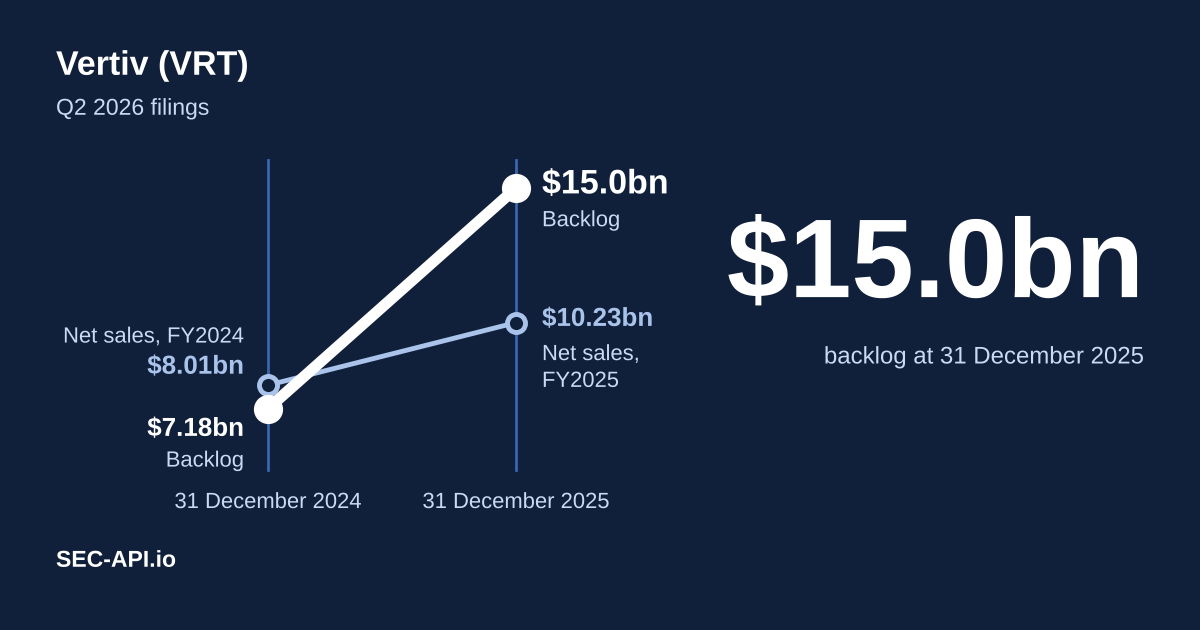
Vertiv (VRT) Q2 2026 results and outlook: backlog, data center demand, acquisitions, valuation against peers and scenarios to FY2029
October 12, 2026·72 min read
Arista Networks (ANET) stock analysis Q2 2026: AI networking revenue, deferred revenue, customer concentration, insider sales and scenarios to FY2029
October 12, 2026·71 min read