Vertiv Holdings Co (VRT), Financial Analysis
Insights derived from analysing SEC filings. Independent analysis, not a publication of the SEC.
Figures are read from the Forms 10-K for FY2021 to FY2025, the Forms 10-Q for Q1 2025 to Q2 2026, the Forms 8-K of February 2022 to September 2026 with their quarterly earnings exhibits 99.1, acquisition agreement exhibits 2.1 and financing exhibits 1.1, 4.1, 4.2 and 10.1, the proxy statement of April 2026, Schedules 13D from the February 2020 listing through a merger with GS Acquisition Holdings Corp to August 2023, Schedules 13G, Forms 13F and Forms 3, 4 and 144 on the record for central index key 1674101, together with the comparable filings of seven peers and five data center operators. Accession numbers for every filing used appear in the Sources appendix. Market prices are closing prices of 9 October 2026.
Vertiv (VRT) closed at $242.78 on 9 October 2026, 54.9x TTM (trailing twelve months) diluted GAAP EPS of $4.42 and (36.1)% from its 52 week high of $379.94. Q2 2026 net sales rose 24.1% year on year to $3.27bn, organic growth of 17.8% was below guidance of 20% to 24%, and FY2026 net sales guidance rose to $13.8bn to $14.2bn.
Key findings
- Q2 2026 net sales were $3.27bn, up 24.1% year on year, with organic growth of 17.8% against guidance of 20% to 24%; GAAP operating margin was 19.5% against 16.8%, adjusted operating margin 22.6%, diluted GAAP EPS $1.27 and adjusted diluted EPS $1.52.
- Vertiv raised FY2026 guidance for a second time on 29 July 2026, to net sales of $13.8bn to $14.2bn and adjusted diluted EPS of $6.65 to $6.75 (GAAP $5.82 to $5.92); guidance midpoints imply H2 2026 net sales of $8.08bn, 45.4% above H2 2025.
- Backlog was $15.0bn at 31 December 2025, up 108.9% and equal to 1.07x FY2026 guided net sales; management said quarterly reporting of orders and backlog ends (earnings call, 11 February 2026), and current deferred revenue rose from $1.81bn to $3.63bn in H1 2026.
- Net cash was $171m at 30 June 2026 against net debt of $1.09bn at 31 December 2025; TTM FCF (free cash flow, operating cash flow less capital expenditure) was $2.93bn, 25.5% of net sales, and the agreed UtilityInnovation Group purchase takes $1.45bn of cash at closing plus up to $1.15bn of earnout.
- At the 9 October 2026 close Vertiv traded at 8.1x EV (enterprise value) to TTM sales, 54.9x P / E and 31.9x P / FCF, against peer medians of 4.8x, 38.3x and 30.1x; latest quarter growth was 24.1% against a peer median of 15.3% and TTM FCF margin 25.5% against 13.1%.
- Vertiv has one share class with one vote per share; Schedule 13G filings report BlackRock at 7.8% and Vanguard Capital Management at 7.48% at 31 March 2026, and at the 17 June 2026 annual meeting director Joseph van Dokkum received 54.2% of votes for and executive pay 88.4%.
- Insiders sold 510,549 shares for $128.17m on open market in 12 months to 10 October 2026 and bought 0; 17 Form 144 notices cover 2.08m shares with a stated market value of $543.20m.
- Three scenarios give implied FY2029 prices of $126 (worst case), $308 (base case) and $532 (best case) on adjusted diluted EPS at exit multiples of 20x, 28x and 36x; each is an arithmetic outcome of the assumptions in Table 9.2.
Table 0.1 Vertiv at a glance
| Item | Value | Basis |
|---|---|---|
Share price | $242.78 | Close, 9 October 2026 |
Market cap | $93.5bn | Price times 385.0m shares outstanding at 27 July 2026, 10-Q cover |
Enterprise value (EV) | $93.3bn | Market cap less net cash |
Net cash | $171m | Cash and short term investments of $3.11bn less debt of $2.94bn, 30 June 2026 |
TTM net sales | $11.48bn | Four quarters to 30 June 2026, up 26.2% |
Q2 2026 net sales growth | 24.1% | Year on year; organic 17.8% |
TTM GAAP operating margin | 18.9% | Q2 2026: 19.5% |
TTM adjusted (non GAAP) operating margin | 22.3% | Company measure; Q2 2026: 22.6% |
TTM FCF margin | 25.5% | FCF of $2.93bn; operating cash flow less capital expenditure |
Backlog | $15.0bn | 31 December 2025, latest filed; RPO (remaining performance obligations) is n/a in the filings |
EV / sales | 8.1x | TTM net sales |
P / E | 54.9x | Price over TTM diluted GAAP EPS of $4.42; 45.9x TTM adjusted diluted EPS of $5.29 |
P / FCF | 31.9x | Market cap over TTM FCF |
Diluted shares | 392.7m | Q2 2026 weighted average |
FY2029 scenario prices | $126, $308, $532 | Worst, base and best case; built on adjusted diluted EPS, while P / E of 54.9x is on GAAP diluted EPS (FY2026 guidance midpoints: $5.87 GAAP, $6.70 adjusted) |
Source: 10-Q Q2 2026, 10-K FY2025 and 8-K Exhibit 99.1 of 29 July 2026, SEC filings via SEC-API.io; market data, 9 October 2026.
1 Revenue & Business Model
Vertiv's Q2 2026 net sales were $3.27bn, up 24.1% year on year, and the Americas segment supplied 63.2% of net sales and 72.2% of segment operating profit (10-Q).
Vertiv business model and revenue sources
Vertiv designs, manufactures and services power and cooling equipment for data centers, communication networks and commercial and industrial sites.
Table 1.1 Vertiv business model as filed in the FY2025 10-K
| Item | Filed fact |
|---|---|
| Reportable segments | Americas, Asia Pacific, and Europe, Middle East & Africa (EMEA) |
| Products | AC and DC power management, air cooled and liquid cooled thermal management, low and medium voltage switchgear, busbar, integrated modular solutions, racks, uninterruptible power supplies (UPS), energy storage, software for managing IT equipment |
| Services & spares | Preventative maintenance, project management, acceptance testing, remote monitoring, fluid management, spare parts and infrastructure software, delivered from over 300 service centers by about 5,000 service engineers |
| End markets | Data centers (cloud and hyperscale, colocation, neocloud, enterprise), communication networks, commercial and industrial |
| Revenue recognition | Majority of sales agreements are satisfied at a point in time; $2.19bn of FY2025 net sales was recognized over time |
| Backlog definition | Product and service orders with a customer purchase order or purchase commitment received and delivery outstanding; orders may be canceled or rescheduled by the customer |
| Sales channels | Direct sales by about 3,000 salespeople, plus independent sales representatives, channel partners, distributors and original equipment manufacturers |
| Competitors named | Schneider Electric, Eaton, Legrand, Huawei, Delta Electronics, Stulz, Johnson Controls, Socomec |
| Engineering, research and development | $442m in FY2025 |
| Listing | New York Stock Exchange since 7 February 2020, through a business combination with GS Acquisition Holdings Corp |
Source: 10-K FY2025, SEC filings via SEC-API.io.
Vertiv revenue by segment and region
H1 2026 Americas net sales rose 39.4% to $3.89bn and EMEA net sales fell 8.4% to $805m; the 10-Q attributes the EMEA decline to softer market demand from prior periods. Acquisitions added $130m to Q2 2026 net sales.

Table 1.2 Vertiv net sales by segment, excluding intersegment sales, with share of total
| Period | Americas | Asia Pacific | EMEA | Net sales | Change year on year |
|---|---|---|---|---|---|
Q2 2026 | $2.07bn (63.2%) | $720m (22.0%) | $484m (14.8%) | $3.27bn | 24.1% |
H1 2026 | $3.89bn (65.6%) | $1.23bn (20.8%) | $805m (13.6%) | $5.92bn | 26.7% |
FY2025 | $6.39bn (62.4%) | $2.02bn (19.7%) | $1.82bn (17.8%) | $10.23bn | 27.7% |
FY2024 | $4.50bn (56.2%) | $1.72bn (21.4%) | $1.79bn (22.4%) | $8.01bn | 16.7% |
FY2023 | $3.84bn (56.0%) | $1.53bn (22.3%) | $1.49bn (21.7%) | $6.86bn | 20.6% |
FY2022 | $2.73bn (47.9%) | $1.60bn (28.1%) | $1.36bn (23.9%) | $5.69bn | 13.9% |
FY2021 | $2.19bn (43.8%) | $1.61bn (32.2%) | $1.20bn (24.0%) | $5.00bn | 14.4% |
Source: 10-Q Q2 2026, 10-K FY2025, 10-K FY2023, 10-K FY2021, SEC filings via SEC-API.io.

Table 1.3 Vertiv segment operating profit, before corporate costs, currency and amortization of intangibles, and margin on segment net sales
| Period | Americas | Margin | Asia Pacific | Margin | EMEA | Margin | Consolidated operating profit |
|---|---|---|---|---|---|---|---|
Q2 2026 | $571m | 27.6% | $96m | 13.3% | $124m | 25.7% | $638m |
Q2 2025 | $385m | 24.0% | $59m | 10.6% | $104m | 21.9% | $442m |
H1 2026 | $1.06bn | 27.3% | $163m | 13.2% | $178m | 22.1% | $1.08bn |
H1 2025 | $644m | 23.1% | $105m | 10.4% | $183m | 20.8% | $733m |
FY2025 | $1.71bn | 26.8% | $222m | 11.0% | $377m | 20.7% | $1.83bn |
FY2024 | $1.10bn | 24.4% | $175m | 10.2% | $439m | 24.5% | $1.37bn |
FY2023 | $762m | 19.8% | $147m | 9.6% | $298m | 20.0% | $872m |
FY2022 | $238m | 8.7% | $177m | 11.0% | $157m | 11.5% | $223m |
Source: 10-Q Q2 2026, 10-K FY2025, 10-K FY2024, SEC filings via SEC-API.io.
Table 1.4 Vertiv sales by destination, with share of net sales
| Destination | FY2025 | FY2024 | FY2023 | FY2022 | FY2021 |
|---|---|---|---|---|---|
United States | $6.01bn (58.8%) | $4.09bn (51.0%) | $3.43bn (50.0%) | $2.43bn (42.7%) | $1.87bn (37.5%) |
Asia | $2.02bn (19.7%) | $1.70bn (21.2%) | $1.48bn (21.6%) | $1.54bn (27.1%) | $1.56bn (31.2%) |
Europe | $1.47bn (14.4%) | $1.52bn (19.0%) | $1.31bn (19.0%) | $1.15bn (20.2%) | $1.05bn (21.1%) |
Latin America and Canada | $437m (4.3%) | $427m (5.3%) | $449m (6.5%) | $377m (6.6%) | $319m (6.4%) |
Middle East and Africa | $285m (2.8%) | $274m (3.4%) | $197m (2.9%) | $188m (3.3%) | $189m (3.8%) |
Source: 10-K FY2025, 10-K FY2024, 10-K FY2023, SEC filings via SEC-API.io.
Vertiv products and services revenue
Services & spares net sales grew 28.6% in Q2 2026 against 23.0% for products, and were 20.4% of net sales against 19.8% in FY2025.

Table 1.5 Vertiv net sales by offering
| Period | Products | Change year on year | Services & spares | Change year on year | Services & spares share |
|---|---|---|---|---|---|
Q2 2026 | $2.61bn | 23.0% | $668m | 28.6% | 20.4% |
H1 2026 | $4.70bn | 25.9% | $1.23bn | 29.9% | 20.7% |
FY2025 | $8.21bn | 31.4% | $2.02bn | 14.5% | 19.8% |
FY2024 | $6.25bn | 18.5% | $1.77bn | 11.0% | 22.0% |
FY2023 | $5.27bn | 25.2% | $1.59bn | 7.5% | 23.2% |
FY2022 | $4.21bn | 18.3% | $1.48bn | 2.9% | 26.0% |
FY2021 | $3.56bn | 16.6% | $1.44bn | 9.2% | 28.8% |
Source: 10-Q Q2 2026, 10-K FY2025, 10-K FY2024, 10-K FY2023, 10-K FY2021, SEC filings via SEC-API.io.
Vertiv backlog and manufacturing footprint
Backlog of $15.0bn at 31 December 2025 equaled 1.07x the FY2026 net sales guidance midpoint of $14.0bn, against 0.70x a year earlier. Management said it would stop reporting quarterly orders and backlog and keep backlog in the annual report (earnings call, 11 February 2026); the last quarterly order figures are in Table 3.4.

Table 1.6 Vertiv order backlog at 31 December
| 31 December | Backlog | Change year on year | Americas | Asia Pacific | EMEA | Backlog / net sales of following year |
|---|---|---|---|---|---|---|
2025 | $15.0bn | 108.9% | n/a | n/a | n/a | 1.07x |
2024 | $7.18bn | 29.9% | $4.67bn | $911m | $1.59bn | 0.70x |
2023 | $5.53bn | 16.2% | $3.37bn | $616m | $1.55bn | 0.69x |
2022 | $4.75bn | 49.0% | $3.34bn | $480m | $937m | 0.69x |
2021 | $3.19bn | 73.0% | $1.89bn | $484m | $821m | 0.56x |
Source: 10-K FY2025, 10-K FY2024, 10-K FY2023, 10-K FY2022, 10-K FY2021, SEC filings via SEC-API.io. Ratio for 2025 uses the FY2026 guidance midpoint of 29 July 2026.
Table 1.7 Vertiv customers, footprint and supply model
| Item | Filed fact | Period |
|---|---|---|
Large customers | Communication network, cloud and hyperscale, neocloud and colocation providers form a material portion of the customer base | FY2025 |
Locations | About 300 offices and manufacturing facilities in over 40 countries | FY2025 |
Employees | About 34,000, of which about 41% in manufacturing operations | 31 Dec 2025 |
Intersegment sales | EMEA $400m, Asia Pacific $333m, Americas $16m | H1 2026 |
Capacity additions | Switchgear, busbar and integrated power capacity more than doubled since late 2021; 215,000 square foot plant in Pelzer, South Carolina and a thermal plant in Pune, India added in 2024 | FY2025 |
Supply | Raw materials generally from more than one supplier; commodity exposure to steel, copper, aluminum and electronic components | FY2025 |
Source: 10-K FY2025, 10-Q Q2 2026, SEC filings via SEC-API.io.
Table 1.8 Changes in Vertiv segment and metric definitions
| Change | Detail | First filed |
|---|---|---|
Offering categories | Critical infrastructure & solutions and integrated rack solutions merged into products; services & spares unchanged | FY2024 10-K |
Segment operating profit | Costs moved from corporate to segments; FY2023 segment operating profit reduced by $196m in Americas, $101m in Asia Pacific and $82m in EMEA | FY2024 10-K |
Backlog delivery period | Majority expected to ship within 12 to 18 months; earlier filings stated within one year | FY2025 10-K |
Backlog by segment | Segment table last filed for 31 December 2024; FY2025 gives the total | FY2025 10-K |
Sales by destination | Canada grouped with Latin America; earlier filings grouped it with the United States, and FY2021 here sums the filed Canada and Latin America amounts | FY2024 10-K |
Source: 10-K FY2025, 10-K FY2024, 10-K FY2023, SEC filings via SEC-API.io.
2 Financial Analysis & Ratios
Q2 2026 operating profit rose 44.2% year on year to $638m on net sales growth of 24.1%, and FCF was $926m, 28.3% of net sales against 10.5% a year earlier (10-Q).
Vertiv Q2 2026 results year on year
Table 2.1 Q2 2026 and H1 2026 against the prior year periods
| Line | Q2 2026 | Q2 2025 | Change | H1 2026 | H1 2025 | Change |
|---|---|---|---|---|---|---|
Revenue | $3.27bn | $2.64bn | 24.1% | $5.92bn | $4.67bn | 26.7% |
Gross profit | $1.23bn | $897m | 37.7% | $2.23bn | $1.58bn | 41.2% |
Gross margin | 37.7% | 34.0% | 3.7 pp | 37.7% | 33.9% | 3.9 pp |
Operating profit | $638m | $442m | 44.2% | $1.08bn | $733m | 47.0% |
Operating margin | 19.5% | 16.8% | 2.7 pp | 18.2% | 15.7% | 2.5 pp |
Adjusted operating profit | $738m | $489m | 50.9% | $1.29bn | $826m | 56.2% |
Adjusted operating margin | 22.6% | 18.5% | 4.0 pp | 21.8% | 17.7% | 4.1 pp |
Interest expense, net | $17m | $21m | (18.3)% | $13m | $47m | (72.1)% |
Income tax expense | $122m | $97m | 26.1% | $170m | $198m | (13.9)% |
Net income | $498m | $324m | 53.5% | $888m | $489m | 81.7% |
EPS diluted | $1.27 | $0.83 | 53.0% | $2.26 | $1.25 | 80.8% |
Adjusted EPS diluted | $1.52 | $0.95 | 60.0% | $2.70 | $1.59 | 69.8% |
Operating cash flow | $1.10bn | $323m | 240.6% | $1.87bn | $626m | 198.1% |
Capital expenditure | $173m | $45m | 285.1% | $286m | $82m | 250.8% |
Free cash flow | $926m | $278m | 233.4% | $1.58bn | $545m | 190.2% |
Free cash flow margin | 28.3% | 10.5% | 17.8 pp | 26.7% | 11.7% | 15.0 pp |
Adjusted free cash flow (company definition) | $925m | $277m | 234.0% | $1.58bn | $542m | 191.4% |
Stock based compensation | $14m | $13m | 3.8% | $31m | $24m | 25.7% |
Source: 10-Q Q2 2026; adjusted rows from 8-K Exhibit 99.1 of 29 July 2026; SEC filings via SEC-API.io. Free cash flow (FCF) throughout this report is operating cash flow less capital expenditure; the company's adjusted free cash flow also deducts capitalized software. pp = percentage points.

Vertiv adjusted operating profit and adjusted EPS against GAAP
Amortization of intangibles is $151m of the $213m between H1 2026 operating profit and adjusted operating profit. Adjusted EPS is the company's non GAAP measure; GAAP EPS includes those costs.
Table 2.2 Operating profit and diluted EPS, GAAP to adjusted
| Line | FY2021 | FY2022 | FY2023 | FY2024 | FY2025 | H1 2026 |
|---|---|---|---|---|---|---|
Operating profit | $260m | $223m | $872m | $1.37bn | $1.83bn | $1.08bn |
Amortization of intangibles | $144m | $216m | $181m | $184m | $200m | $151m |
Acquisition, contingent consideration, restructuring and litigation items | $67m | $0m | $0m | $0m | $60m | $61m |
Adjusted operating profit | $471m | $439m | $1.05bn | $1.55bn | $2.09bn | $1.29bn |
EPS diluted | $0.33 | ($0.04) | $1.19 | $1.28 | $3.41 | $2.26 |
Amortization of intangibles, per share | $0.40 | $0.57 | $0.47 | $0.48 | $0.52 | $0.39 |
Change in warrant liability, per share | $0.17 | $0.00 | $0.41 | $1.16 | $0.00 | $0.00 |
Other items, per share | ($0.14) | $0.00 | ($0.30) | ($0.07) | $0.27 | $0.05 |
Adjusted EPS diluted | $0.76 | $0.53 | $1.77 | $2.85 | $4.20 | $2.70 |
Source: 8-K Exhibit 99.1 for FY2021, FY2022, FY2023, FY2024, FY2025 and H1 2026, SEC filings via SEC-API.io. Other items per share: nonrecurring tax items, the FY2021 tax receivable agreement gain, term loan amendment and repayment effects and the operating items above. FY2022 diluted EPS of ($0.04) excludes a $91m warrant gain from the numerator; net income was $77m.
Vertiv cash flow and working capital
H1 2026 operating cash flow was $1.87bn against $626m. Current deferred revenue, cash received ahead of delivery, rose $1.82bn in six months to $3.63bn and inventory rose $1.07bn to $2.52bn. Against 30 June 2025, current deferred revenue rose 189.0%, cash and short term investments 78.9%, inventory 78.5%, payables 54.1%, stockholders' equity 52.2%, receivables 32.5% and debt 0.6% (balances in Table 2.7).

Table 2.3 Fixed assets, intangible assets and working capital ratios at 30 June 2026
| Line | 30 Jun 2026 | 31 Dec 2025 | 30 Jun 2025 | Change year on year |
|---|---|---|---|---|
Property, plant and equipment | $1.18bn | $922m | $666m | 77.7% |
Goodwill | $2.28bn | $2.03bn | $1.37bn | 66.2% |
Other intangible assets | $1.80bn | $1.89bn | $1.45bn | 23.8% |
Current ratio | 1.38x | 1.55x | 1.74x | n/a |
DSO, days | 119 | 111 | 114 | n/a |
Inventory days | 129 | 82 | 88 | n/a |
Payable days | 127 | 98 | 100 | n/a |
Source: 10-Q Q2 2026, 10-Q Q2 2025, 10-K FY2025, SEC filings via SEC-API.io. DSO (days sales outstanding), inventory days and payable days use period end balances over TTM net sales or cost of sales.

Vertiv debt, leverage and acquisitions
On 3 March 2026 Vertiv issued $2.10bn of senior unsecured notes, repaid the $2.08bn term loan and replaced an $800m asset based facility with a $2.50bn unsecured revolver (8-K; terms in Tables 5.3 and 5.4). H1 2026 net interest expense of $13m includes a $22.9m gain on settled interest rate swaps per the earnings release reconciliation; TTM interest cover is 41.4x, or 28.8x excluding that gain.
Table 2.4 Debt at 30 June 2026 and 31 December 2025
| Instrument | Rate | 30 Jun 2026 | 31 Dec 2025 |
|---|---|---|---|
Term Loan due 2032 | 5.61% at 31 Dec 2025 | $0m | $2.08bn |
Senior Secured Notes due 2028 | 4.125% | $850m | $850m |
Senior Notes due 2036 | 4.850% | $600m | $0m |
Senior Notes due 2046 | 5.650% | $500m | $0m |
Senior Notes due 2056 | 5.800% | $500m | $0m |
Senior Notes due 2066 | 5.950% | $500m | $0m |
Other notes, 2027 to 2036 | 0.55% to 5.12% | $17m | $0m |
Unamortized discount and issuance costs | n/a | ($27m) | ($13m) |
Total debt | n/a | $2.94bn | $2.91bn |
Revolving credit facility commitment | n/a | $2.50bn | $800m |
Liquidity as stated by company | n/a | $5.6bn | $2.6bn |
Source: 10-Q Q2 2026, note 6; liquidity from 8-K Exhibit 99.1 of 29 July 2026 and 11 February 2026; SEC filings via SEC-API.io. Revolver covenant caps consolidated net debt at 4.00 times EBITDA (earnings before interest, taxes, depreciation and amortization).

Table 2.5 Acquisitions closed from Q3 2025 to Q2 2026
| Acquisition | Closed | Gross consideration | Cash | Contingent consideration | Goodwill | Intangible assets |
|---|---|---|---|---|---|---|
PurgeRite | 4 Dec 2025 | $1.15bn | $1.00bn | $139m | $589m | $445m |
Great Lakes | 20 Aug 2025 | $204m | n/a | n/a | $67m | $108m |
Three acquisitions | Q2 2026 | $336m | $278m | $29m | $260m | $67m |
Source: 10-Q Q2 2026, note 3, SEC filings via SEC-API.io. PurgeRite gross consideration of $1.15bn is $1.00bn cash, $139m contingent consideration at fair value and $10m other; net of $14m cash acquired it is $1.14bn. PurgeRite earnout liability was $206m at 30 June 2026 against a $250m cap. Cash paid for acquisitions, net of cash acquired, was $1.18bn in FY2025 and $278m in H1 2026.
Vertiv income statement, cash flow and balance sheet, five years and by quarter
Table 2.6 Annual financials, FY2021 to FY2025
| Line | FY2021 | FY2022 | FY2023 | FY2024 | FY2025 |
|---|---|---|---|---|---|
Revenue | $5.00bn | $5.69bn | $6.86bn | $8.01bn | $10.23bn |
Gross profit | $1.52bn | $1.62bn | $2.40bn | $2.93bn | $3.72bn |
Operating profit | $260m | $223m | $872m | $1.37bn | $1.83bn |
Interest expense, net | $91m | $147m | $180m | $150m | $86m |
Income tax expense | $47m | $90m | $74m | $270m | $409m |
Net income | $120m | $77m | $460m | $496m | $1.33bn |
Operating cash flow | $211m | ($153m) | $900m | $1.32bn | $2.11bn |
Capital expenditure | $73m | $100m | $128m | $167m | $220m |
Free cash flow | $138m | ($253m) | $773m | $1.15bn | $1.89bn |
Adjusted free cash flow (company definition) | $136m | ($260m) | $778m | $1.14bn | $1.89bn |
Stock based compensation | $23m | $25m | $25m | $35m | $46m |
Acquisitions, net of cash acquired | $1.16bn | $5.0m | $29m | $18m | $1.18bn |
Cash and short term investments | $439m | $261m | $780m | $1.23bn | $1.83bn |
Debt | $2.97bn | $3.19bn | $2.94bn | $2.93bn | $2.91bn |
Stockholders' equity | $1.42bn | $1.44bn | $2.01bn | $2.43bn | $3.94bn |
Total assets | $6.94bn | $7.10bn | $8.00bn | $9.13bn | $12.21bn |
Goodwill and other intangible assets | $3.47bn | $3.10bn | $3.00bn | $2.81bn | $3.93bn |
Inventory | $616m | $822m | $884m | $1.24bn | $1.46bn |
Deferred revenue, current | $239m | $359m | $639m | $1.06bn | $1.81bn |
Source: 10-K for FY2021, FY2022, FY2023, FY2024 and FY2025; adjusted free cash flow from the 8-K Exhibit 99.1 filings under Table 2.2, which also carries adjusted operating profit; SEC filings via SEC-API.io. FY2022 deferred revenue is the figure recast in the FY2023 10-K. Net income includes warrant liability losses of $62m in FY2021, $158m in FY2023 and $449m in FY2024 and a gain of $91m in FY2022.
Table 2.7 Quarterly financials, Q1 2025 to Q2 2026
| Line | Q1 2025 | Q2 2025 | Q3 2025 | Q4 2025 | Q1 2026 | Q2 2026 |
|---|---|---|---|---|---|---|
Revenue | $2.04bn | $2.64bn | $2.68bn | $2.88bn | $2.65bn | $3.27bn |
Revenue growth year on year | 24.2% | 35.1% | 29.0% | 22.7% | 30.1% | 24.1% |
Gross profit | $686m | $897m | $1.01bn | $1.12bn | $1.00bn | $1.23bn |
Gross margin | 33.7% | 34.0% | 37.8% | 38.9% | 37.7% | 37.7% |
Operating profit | $291m | $442m | $517m | $580m | $440m | $638m |
Operating margin | 14.3% | 16.8% | 19.3% | 20.1% | 16.6% | 19.5% |
Adjusted operating profit | $337m | $489m | $596m | $668m | $551m | $738m |
Adjusted operating margin | 16.5% | 18.5% | 22.3% | 23.2% | 20.8% | 22.6% |
Net income | $164m | $324m | $399m | $446m | $390m | $498m |
EPS diluted | $0.42 | $0.83 | $1.02 | $1.14 | $0.99 | $1.27 |
Adjusted EPS diluted | $0.64 | $0.95 | $1.24 | $1.36 | $1.17 | $1.52 |
Operating cash flow | $303m | $323m | $509m* | $1.00bn | $767m | $1.10bn |
Capital expenditure | $36m | $45m | $45m | $93m | $113m | $173m |
Free cash flow | $267m | $278m | $464m* | $912m | $654m | $926m |
Adjusted free cash flow (company definition) | $264m | $277m | $462m | $910m | $653m | $925m |
Stock based compensation | $11m | $13m | $14m | $7.2m | $17m | $14m |
Cash and short term investments | $1.47bn | $1.74bn | $1.94bn | $1.83bn | $2.50bn | $3.11bn |
Debt | $2.93bn | $2.92bn | $2.92bn | $2.91bn | $2.92bn | $2.94bn |
Net cash (net debt) | ($1.46bn) | ($1.18bn) | ($978m) | ($1.09bn) | ($422m) | $171m |
Stockholders' equity | $2.67bn | $3.13bn | $3.51bn | $3.94bn | $4.24bn | $4.76bn |
Receivables | $2.31bn | $2.83bn | $2.81bn | $3.11bn | $3.15bn | $3.75bn |
Inventory | $1.38bn | $1.41bn | $1.44bn | $1.46bn | $1.83bn | $2.52bn |
Payables | $1.41bn | $1.61bn | $1.72bn | $1.76bn | $1.95bn | $2.47bn |
Deferred revenue, current | $1.10bn | $1.26bn | $1.13bn | $1.81bn | $2.46bn | $3.63bn |
Diluted shares | 390.1m | 389.8m | 390.9m | 391.7m | 392.1m | 392.7m |
Source: 10-Q for Q1 2025, Q2 2025, Q3 2025, Q1 2026 and Q2 2026; 10-K FY2025; 8-K Exhibit 99.1 for Q1 2025, Q2 2025, Q3 2025, Q4 2025, Q1 2026 and Q2 2026; SEC filings via SEC-API.io. Q4 2025 cash flow is the three month column of the 8-K. *Q3 2025 is as first reported; the full year statements move $26.0m of that quarter's acquisition payment from investing to operating, which gives $483m operating cash flow and $438m free cash flow for Q3 2025.
Vertiv ratio analysis: margins, returns, leverage and efficiency
Table 2.8 Ratio analysis, FY2021 to TTM Q2 2026
| Ratio | FY2021 | FY2022 | FY2023 | FY2024 | FY2025 | TTM Q2 2026 |
|---|---|---|---|---|---|---|
Revenue growth | 14.4% | 13.9% | 20.6% | 16.7% | 27.7% | 26.2% |
Gross margin | 30.5% | 28.4% | 35.0% | 36.6% | 36.3% | 38.0% |
Operating margin | 5.2% | 3.9% | 12.7% | 17.1% | 17.9% | 18.9% |
Adjusted operating margin | 9.4% | 7.7% | 15.3% | 19.4% | 20.4% | 22.3% |
Net margin | 2.4% | 1.3% | 6.7% | 6.2% | 13.0% | 15.1% |
Free cash flow margin | 2.8% | (4.4)% | 11.3% | 14.4% | 18.5% | 25.5% |
Stock based compensation / revenue | 0.5% | 0.4% | 0.4% | 0.4% | 0.4% | 0.5% |
Capital expenditure / revenue | 1.5% | 1.8% | 1.9% | 2.1% | 2.2% | 3.7% |
ROE | 12.4% | 5.4% | 26.6% | 22.3% | 41.8% | 43.9% |
ROIC | 5.8% | 3.9% | 14.4% | 20.9% | 23.7% | 25.0% |
ROA | 2.0% | 1.1% | 6.1% | 5.8% | 12.5% | 13.2% |
Asset turnover | 0.83x | 0.81x | 0.91x | 0.94x | 0.96x | 0.87x |
Current ratio | 1.45x | 1.66x | 1.74x | 1.65x | 1.55x | 1.38x |
Debt / equity | 2.10x | 2.21x | 1.46x | 1.20x | 0.74x | 0.62x |
Net debt (net cash) | $2.53bn | $2.93bn | $2.16bn | $1.70bn | $1.09bn | ($171m) |
Debt / EBITDA | 6.1x | 6.1x | 2.6x | 1.8x | 1.4x | 1.1x |
Net debt / EBITDA | 5.2x | 5.6x | 1.9x | 1.0x | 0.5x | (0.1x) |
Interest cover | 2.9x | 1.5x | 4.8x | 9.1x | 21.3x | 41.4x |
DSO, days | 112 | 121 | 116 | 108 | 111 | 119 |
Inventory days | 65 | 74 | 72 | 89 | 82 | 129 |
Inventory turns | 5.6x | 5.0x | 5.0x | 4.1x | 4.5x | 2.8x |
Payable days | 90 | 88 | 81 | 95 | 98 | 127 |
Deferred revenue / revenue | 4.8% | 6.3% | 9.3% | 13.3% | 17.7% | 31.7% |
Source: calculated from the filings under Tables 2.6 and 2.7, SEC filings via SEC-API.io. TTM balance sheet ratios are at 30 June 2026. ROE and ROA use average balances. ROIC (return on invested capital) is operating profit taxed at 21% over average equity plus debt; on period end equity plus debt at 30 June 2026 it is 22.3%, the basis used for all companies in Table 4.4. EBITDA is operating profit plus depreciation and amortization; interest cover is operating profit over net interest expense.
Vertiv dividends, buybacks and per share figures
Repurchases were 9.08m shares for $600m in Q1 2024 and $0 since; $2.4bn of the $3.0bn authorization remained at 30 June 2026. Quarterly dividend rose to $0.0625 per share in November 2025 from $0.0375. TTM diluted EPS is $4.42 and TTM adjusted diluted EPS $5.29, each the sum of the last four quarters in Table 2.7; annual EPS is in Table 2.2.
Table 2.9 Free cash flow per share, diluted shares and capital return
| Line | FY2021 | FY2022 | FY2023 | FY2024 | FY2025 | TTM Q2 2026 |
|---|---|---|---|---|---|---|
Free cash flow per share | $0.38 | ($0.67) | $2.00 | $2.98 | $4.85 | $7.48 |
Diluted shares | 360.1m | 378.2m | 386.2m | 386.3m | 390.7m | 391.9m |
Dividends paid | $3.8m | $3.8m | $9.5m | $42m | $67m | $86m |
Share repurchases | $0m | $0m | $0m | $600m | $0m | $0m |
Dividends and repurchases / free cash flow | 2.8% | n/a | 1.2% | 55.7% | 3.5% | 2.9% |
Source: filings under Tables 2.6 and 2.7; 10-K FY2025, Item 5; 10-Q Q2 2026, Part II Item 2; SEC filings via SEC-API.io. Stock splits in the period: 0.
3 MD&A & Management Commentary
Vertiv raised FY2026 guidance for a second time on 29 July 2026, to net sales of $13.8bn to $14.2bn and adjusted diluted EPS of $6.65 to $6.75, while Q2 2026 organic net sales growth of 17.8% was below its guided range of 20% to 24% (8-K Exhibit 99.1). Adjusted diluted EPS exceeded the high end of quarterly guidance in each of the last six quarters.
Vertiv guidance versus actual results

Table 3.1 Quarterly guidance and reported result, Q1 2025 to Q2 2026, with Q3 2026 guidance outstanding
| Quarter | Net sales: guidance, reported | Organic growth: guidance, reported | Adjusted operating margin: guidance, reported | Adjusted diluted EPS: guidance, reported | Reported against guidance | Guidance issued | Result issued |
|---|---|---|---|---|---|---|---|
Q3 2026 | $3.65bn to $3.85bn, n/a | 34% to 36%, n/a | 24.0% to 25.0%, n/a | $1.77 to $1.83, n/a | Adjusted operating profit guided at $898m to $938m | 29 Jul 2026 | n/a |
Q2 2026 | $3.25bn to $3.45bn, $3.27bn | 20% to 24%, 17.8% | 20.7% to 21.7%, 22.6% | $1.37 to $1.43, $1.52 | Net sales $76m below midpoint; organic growth below range; EPS $0.09 above high end | 22 Apr 2026 | 29 Jul 2026 |
Q1 2026 | $2.50bn to $2.70bn, $2.65bn | 18% to 26%, 22.6% | 18.5% to 19.5%, 20.8% | $0.95 to $1.01, $1.17 | Net sales $50m above midpoint; margin 1.3 points and EPS $0.16 above high end | 11 Feb 2026 | 22 Apr 2026 |
Q4 2025 | $2.81bn to $2.89bn, $2.88bn | 18% to 22%, 19.3% | 22.1% to 22.7%, 23.2% | $1.23 to $1.29, $1.36 | Net sales $30m above midpoint; adjusted free cash flow $910m against $470m to $530m guided | 22 Oct 2025 | 11 Feb 2026 |
Q3 2025 | $2.51bn to $2.59bn, $2.68bn | 20% to 24%, 28.4% | 19.75% to 20.25%, 22.3% | $0.94 to $1.00, $1.24 | Net sales $86m, margin 2.05 points and EPS $0.24 above high end | 30 Jul 2025 | 22 Oct 2025 |
Q2 2025 | $2.33bn to $2.38bn, $2.64bn | 19% to 23%, 34.0% | 18.0% to 19.0%, 18.5% | $0.77 to $0.85, $0.95 | Net sales $263m and EPS $0.10 above high end; margin at midpoint | 23 Apr 2025 | 30 Jul 2025 |
Q1 2025 | $1.90bn to $1.95bn, $2.04bn | 17% to 21%, 25.3% | 16.7% to 17.1%, 16.5% | $0.57 to $0.63, $0.64 | Net sales $86m above high end; margin 0.2 points below low end | 12 Feb 2025 | 23 Apr 2025 |
Source: 8-K Exhibit 99.1 earnings releases of 12 Feb 2025, 23 Apr 2025, 30 Jul 2025, 22 Oct 2025, 11 Feb 2026, 22 Apr 2026 and 29 Jul 2026, SEC filings via SEC-API.io. Adjusted measures are Vertiv's own non GAAP measures.
Vertiv full year 2026 guidance changes
Table 3.2 Full year guidance at each earnings release, FY2026 and FY2025
| Year | Issued | Net sales | Organic growth | Adjusted operating profit | Adjusted operating margin | Adjusted diluted EPS | Adjusted free cash flow | What management said |
|---|---|---|---|---|---|---|---|---|
FY2026 | 29 Jul 2026 | $13.80bn to $14.20bn | 30% to 32% | $3.29bn to $3.37bn | 23.3% to 24.3% | $6.65 to $6.75 | $2.4bn to $2.6bn | Current guidance. Release cites demand, growing pipelines and capacity expansions under way; capital expenditure expected at about 4.0% of revenue, the high end of its range. |
FY2026 | 22 Apr 2026 | $13.50bn to $14.00bn | 29% to 31% | $3.14bn to $3.26bn | 22.8% to 23.8% | $6.30 to $6.40 | $2.1bn to $2.3bn | Superseded. Raised after Q1 2026 adjusted operating margin of 20.8%; release states capacity expansion is being accelerated. |
FY2026 | 11 Feb 2026 | $13.25bn to $13.75bn | 27% to 29% | $2.98bn to $3.10bn | 22.0% to 23.0% | $5.97 to $6.07 | $2.1bn to $2.3bn | Superseded. First FY2026 guide, issued with backlog of $15.0bn; release states ER&D (engineering, research and development) spending and production capacity are being increased. |
FY2025 | Reported 11 Feb 2026 | $10.23bn | 26.3% | $2.09bn | 20.4% | $4.20 | $1.89bn | Reported FY2025 result on the same non GAAP basis. |
FY2025 | 22 Oct 2025 | $10.16bn to $10.24bn | 26% to 28% | $2.04bn to $2.08bn | 20.0% to 20.5% | $4.07 to $4.13 | $1.47bn to $1.53bn | Final FY2025 guide. Based on tariff rates active on 20 October 2025; 2025 capital expenditure expected at about $250m. |
FY2025 | 30 Jul 2025 | $9.93bn to $10.08bn | 23% to 25% | $1.95bn to $2.03bn | 19.7% to 20.3% | $3.75 to $3.85 | $1.38bn to $1.43bn | Margin midpoint lowered to 20.0% from 20.5% on tariff mitigation costs and operational inefficiencies; long term target of 25% adjusted operating margin by 2029 stated. |
FY2025 | 23 Apr 2025 | $9.33bn to $9.58bn | 16.5% to 19.5% | $1.89bn to $1.99bn | 19.75% to 21.25% | $3.45 to $3.65 | $1.25bn to $1.35bn | Net sales midpoint raised by $250m; EPS midpoint held at $3.55 with tariff rates of 22 April 2025 assumed through year end. |
FY2025 | 12 Feb 2025 | $9.13bn to $9.28bn | 15% to 17% | $1.91bn to $1.96bn | 20.8% to 21.2% | $3.50 to $3.60 | $1.28bn to $1.33bn | First FY2025 guide; excluded potential effects of tariff and tax policy changes by the new U.S. administration. |
Source: 8-K Exhibit 99.1 earnings releases linked under Table 3.1, SEC filings via SEC-API.io.

Guidance midpoints place 58% of FY2026 net sales in H2 2026.
Table 3.3 H2 2026 implied by arithmetic on H1 2026 results and guidance midpoints of 29 July 2026
| Measure | H1 2026 reported | Q3 2026 guidance midpoint | Q4 2026 implied | H2 2026 implied | FY2026 guidance midpoint |
|---|---|---|---|---|---|
Net sales | $5.92bn | $3.75bn | $4.33bn | $8.08bn | $14.00bn |
Change year on year | 26.7% | 40.1% | 50.2% | 45.4% | 36.9% |
Adjusted operating profit | $1.29bn | $918m | $1.12bn | $2.03bn | $3.33bn |
Adjusted operating margin | 21.8% | 24.5% | 25.8% | 25.2% | 23.8% |
Adjusted diluted EPS | $2.70 | $1.80 | $2.20 | $4.00 | $6.70 |
Adjusted free cash flow | $1.58bn | n/a | n/a | $922m | $2.50bn |
Source: 8-K Exhibit 99.1 of 29 July 2026, SEC filings via SEC-API.io.
Vertiv orders, book to bill and backlog

Table 3.4 Order metrics as stated in each earnings release, Q4 2024 to Q4 2025, the latest quarter with order metrics
| Quarter | Organic orders, year on year | Organic orders, sequential | TTM organic orders | Book to bill | Backlog |
|---|---|---|---|---|---|
Q4 2025 | about 252% | 117% | about 81% | about 2.9x | $15.0bn, up 109% |
Q3 2025 | about 60% | 20% | 21% | about 1.4x | $9.5bn |
Q2 2025 | about 15% | about 11% | about 11% | about 1.2x | $8.5bn |
Q1 2025 | about 13% | about 21% | about 20% | about 1.4x | $7.9bn |
Q4 2024 | n/a | n/a | about 30% | n/a | n/a |
Source: 8-K Exhibit 99.1 earnings releases linked under Table 3.1, SEC filings via SEC-API.io. Book to bill is orders divided by net sales. Current deferred revenue by quarter is in Table 2.7.
Vertiv's 10-Q attributes a $679m H1 2026 trade working capital inflow primarily to deferred revenue.
Vertiv regional trends in Americas, Asia Pacific and EMEA
Table 3.5 Organic net sales growth and adjusted operating margin by region
| Quarter | Americas organic growth | Americas margin | Asia Pacific organic growth | Asia Pacific margin | EMEA organic growth | EMEA margin |
|---|---|---|---|---|---|---|
Q2 2026 | 21.1% | 27.6% | 25.7% | 13.3% | (2.4)% | 25.7% |
Q1 2026 | 44.3% | 27.0% | 12.0% | 13.1% | (29.4)% | 16.6% |
Q4 2025 | 46.2% | 30.1% | (9.3)% | 9.9% | (14.1)% | 22.1% |
Q3 2025 | 43.0% | 29.3% | 21.3% | 13.2% | (4.0)% | 18.8% |
Q2 2025 | 43.2% | 24.0% | 36.8% | 10.6% | 7.0% | 21.9% |
Q1 2025 | 28.8% | 21.9% | 36.4% | 10.2% | 7.2% | 19.5% |
Source: 8-K Exhibit 99.1 earnings releases linked under Table 3.1, SEC filings via SEC-API.io.

Organic net sales in EMEA fell in each of the last four quarters. Management guided Q3 2026 organic growth in the high 30s% for Americas and Asia Pacific and in the mid to high teens for EMEA, and FY2026 EMEA organic growth in low single digits (earnings call, 29 July 2026).
Vertiv tariffs, capacity expansion and liquid cooling
Table 3.6 Trends and risks management names, with source and date
| Theme | What management said | Source and date |
|---|---|---|
AI demand | MD&A reports continued growth in demand for data centers supporting AI and high performance compute, and capital investment in Q2 2026 above the Q2 2025 level. | 10-Q, 29 Jul 2026 |
Revenue timing | Release states that Q2 2026 revenue reflected minor timing shifts, caused by temporary supply chain congestion and project execution in several phases. Management placed the shifts mainly in Americas, expected them to resolve in H2 2026 and said guidance allows for continued congestion (Earnings call, 29 July 2026). | 8-K Exhibit 99.1, 29 Jul 2026 |
Tariffs | Supreme Court invalidated tariffs under the International Emergency Economic Powers Act (IEEPA) in February 2026. Vertiv has started submitting refund claims; amount, timing and likelihood of recovery are stated as uncertain and any gain is recognized on realization. | 10-Q, 29 Jul 2026 |
Tariffs and margin | FY2025 gross margin was 36.3% against 36.6%; MD&A states that "benefits from higher sales volume and improved price realization were offset by cost inflation, particularly related to tariffs". Q2 2026 gross margin was 37.7% against 34.0%, attributed to product and service mix. | 10-K, 13 Feb 2026; 10-Q, 29 Jul 2026 |
Price and cost | Q2 2026 adjusted operating margin of 22.6%, up 410 basis points, is attributed to operational execution, productivity and favorable price against cost including tariff effects and countermeasures. | 8-K Exhibit 99.1, 29 Jul 2026 |
Capacity expansion | FY2026 capital expenditure including capitalized software is expected at $550m to $570m, up from $425m to $525m in the annual report and $226.4m spent in FY2025; H1 2026 spend was $288.5m. Management named Johor in Malaysia, five plant expansions in Americas and chiller capacity in EMEA (Earnings call, 29 July 2026). | 10-Q, 29 Jul 2026; 10-K, 13 Feb 2026 |
Liquid cooling | MD&A names hybrid air and liquid cooling, converged physical infrastructure and high voltage direct current power as the directions of customer requirements. Management gave customer validation of 800V direct current at rack level in 2026 and deployment in 2027 (Earnings call, 29 July 2026). | 10-Q, 29 Jul 2026 |
EMEA | Release announced an accelerated EMEA restructuring program and expected improving EMEA market conditions in H2 2026; FY2025 restructuring costs were $54.5m. H1 2026 EMEA net sales fell 8.4%, attributed to softer market demand in prior periods. | 8-K Exhibit 99.1, 22 Oct 2025; 10-K, 13 Feb 2026; 10-Q, 29 Jul 2026 |
Capital return | Management said share repurchases are evaluated as opportunities arise (Earnings call, 29 July 2026). Dividend payments rose by $19.4m in H1 2026. | 10-Q, 29 Jul 2026 |
Source: 10-Q Q2 2026, 10-K FY2025 and earnings releases linked under Table 3.1, SEC filings via SEC-API.io; earnings call statements in indirect speech.
Adjusted operating profit excluded amortization of intangibles alone through Q2 2025; restructuring costs were added in Q3 2025, contingent consideration and merger costs in Q4 2025.
Table 3.7 Operating profit, GAAP to adjusted, three months ended 30 June
| Line, $m | Q2 2026 | Q2 2025 | Change |
|---|---|---|---|
Operating profit, GAAP | 637.9 | 442.4 | 44.2% |
Amortization of intangibles | 73.7 | 46.9 | 57.1% |
Contingent consideration | 28.8 | 0.0 | n/a |
Restructuring costs, global programs | (3.9) | 0.0 | n/a |
Mergers and acquisition costs | 1.9 | 0.0 | n/a |
Adjusted operating profit | 738.4 | 489.3 | 50.9% |
Source: 8-K Exhibit 99.1 of 29 July 2026, SEC filings via SEC-API.io.
4 Sector & Competitor Analysis
Vertiv trades at 8.1x EV to TTM net sales and 54.9x TTM diluted GAAP EPS at the 9 October 2026 close of $242.78, against peer medians of 4.8x and 38.3x. Q2 2026 net sales growth of 24.1% compares with a peer median of 15.3%, and TTM FCF margin of 25.5% with 13.1%.
Data center power and cooling market size
Table 4.1 Sector size and demand estimates from named public research
| Measure | Base | Estimate | Growth | Source |
|---|---|---|---|---|
Data center physical infrastructure, manufacturer revenue, world | $12bn in Q1 2026 | n/a | 28% year on year; thermal management nearly 50% | Dell'Oro Group, reported 7 July 2026 |
Data center physical infrastructure, manufacturer revenue, world | 2025 | $120bn in 2030 | 22% compound annual growth rate, 2025 to 2030 | Dell'Oro Group five year forecast of July 2026, reported 19 August 2026 |
Data center electricity consumption, world | 415 TWh in 2024, 1.5% of world consumption | 945 TWh in 2030; 1,200 TWh in 2035 | 12% a year since 2017 | IEA, Energy and AI, April 2025 |
Data center electricity demand, world | 2025 | n/a | 17% in 2025 against 3% for all electricity demand | IEA, Key Questions on Energy and AI, reported 20 April 2026 |
Data center electricity use, United States | 176 TWh in 2023, 4.4% of US electricity | 325 TWh to 580 TWh in 2028, 6.7% to 12% | n/a | Lawrence Berkeley National Laboratory, December 2024 |

Hyperscaler capital expenditure from filings
Microsoft, Meta, Alphabet, Amazon and Oracle bought $465bn of property and equipment in their latest fiscal years against $259bn a year earlier (up 79.7%), and $586bn in the TTM to their latest filings.
Table 4.2 Purchases of property and equipment, cash flow statement
| Company | Latest fiscal year | Amount | Prior fiscal year | Growth | Latest year to date | Same period a year earlier | TTM |
|---|---|---|---|---|---|---|---|
Microsoft | FY2026 (June) | $115.9bn | $64.6bn | 79.6% | n/a | n/a | $115.9bn |
Meta | FY2025 | $69.7bn | $37.3bn | 87.1% | $49.1bn (H1 2026) | $29.5bn | $89.3bn |
Alphabet | FY2025 | $91.4bn | $52.5bn | 74.1% | $80.6bn (H1 2026) | $39.6bn | $132.4bn |
Amazon | FY2025 | $131.8bn | $83.0bn | 58.8% | $98.4bn (H1 2026) | $57.2bn | $173.0bn |
Oracle | FY2026 (May) | $55.7bn | $21.2bn | 162.4% | $28.5bn (Q1 FY2027) | $8.5bn | $75.7bn |
Total | n/a | $464.6bn | $258.6bn | 79.7% | n/a | n/a | $586.4bn |
Source: SEC filings via SEC-API.io: Microsoft 10-K; Meta 10-K and 10-Q; Alphabet 10-K and 10-Q; Amazon 10-K and 10-Q; Oracle 10-K and 10-Q. Finance leases are excluded.

Vertiv versus Eaton, nVent, Trane and other peers
Peer set: seven US listed companies with a current 10-K and 10-Q that sell data center power, switchgear or cooling equipment; Vertiv's 10-K names Eaton and Johnson Controls as competitors.
Table 4.3 Growth, margins and cash flow, GAAP, TTM to 30 June 2026
| Company | TTM revenue | Latest quarter growth | Latest fiscal year growth | Gross margin | Operating margin | FCF margin | SBC % of revenue | R&D % of revenue |
|---|---|---|---|---|---|---|---|---|
Vertiv (VRT) | $11.5bn | 24.1% | 27.7% | 38.0% | 18.9% | 25.5% | 0.5% | 4.3% |
Eaton (ETN) | $30.0bn | 21.4% | 10.3% | 35.9% | 17.5% | 13.1% | n/a | 2.9% |
nVent (NVT) | $4.8bn | 52.8% | 29.5% | 37.0% | 17.1% | 13.7% | 0.8% | 2.0% |
Hubbell (HUBB) | $6.2bn | 15.3% | 3.8% | 35.2% | 20.2% | 14.5% | 0.5% | about 1% |
Modine (MOD), Q1 FY2027 | $3.4bn | 28.0% | 23.1% | 22.2% | 10.1% | 3.0% | 0.7% | 0.9% |
Trane Technologies (TT) | $22.2bn | 10.6% | 7.5% | 35.4% | 17.9% | 16.1% | 0.4% | 1.6% |
Carrier (CARR) | $22.1bn | 3.9% | (3.3)% | 24.3% | 7.8% | 8.3% | 0.3% | 2.9% |
Johnson Controls (JCI), Q3 FY2026 | $25.0bn | 9.3% | 2.8% | 36.7% | 12.0% | 12.7% | 0.5% | 1.2% |
Peer median, excluding Vertiv | n/a | 15.3% | 7.5% | 35.4% | 17.1% | 13.1% | 0.5% | 1.8% |
Source: SEC filings via SEC-API.io: Vertiv 10-K and 10-Q; Eaton 10-K and 10-Q; nVent 10-K and 10-Q; Hubbell 10-K and 10-Q; Modine 10-K and 10-Q; Trane Technologies 10-K and 10-Q; Carrier 10-K and 10-Q; Johnson Controls 10-K and 10-Q. Latest quarter is Q2 2026 unless stated. Margins are TTM; R&D is for the latest fiscal year, and Hubbell files it as a rounded share of net sales. SBC = share based compensation. Operating income for Eaton and Johnson Controls is income before income taxes plus interest expense or net financing charges.

Table 4.4 Returns, leverage and order book at 30 June 2026
| Company | Inventory days | ROIC | Total debt | Net debt (net cash) | Net debt / EBITDA | RPO | RPO / TTM revenue |
|---|---|---|---|---|---|---|---|
Vertiv (VRT) | 129 | 22.3% | $2.9bn | ($171m) | (0.1)x | n/a | n/a |
Eaton (ETN) | 103 | 10.2% | $20.6bn | $19.9bn | 3.1x | $24.1bn | 0.80x |
nVent (NVT) | 63 | 11.9% | $1.5bn | $1.2bn | 1.2x | $2.5bn | 0.52x |
Hubbell (HUBB) | 115 | 10.7% | $5.4bn | $5.0bn | 3.3x | n/a | n/a |
Modine (MOD) | 85 | 15.5% | $528m | $433m | 1.0x | n/a | n/a |
Trane Technologies (TT) | 67 | 23.7% | $4.6bn | $3.3bn | 0.8x | n/a | n/a |
Carrier (CARR) | 60 | 5.4% | $12.0bn | $10.6bn | 3.5x | n/a | n/a |
Johnson Controls (JCI) | 45 | 10.3% | $9.5bn | $8.8bn | 2.3x | $27.1bn | 1.08x |
Peer median, excluding Vertiv | 67 | 10.7% | n/a | n/a | 2.3x | n/a | n/a |
Source: SEC filings listed under Table 4.3, via SEC-API.io. ROIC = TTM operating income taxed at 21% over period end debt plus equity. Eaton's total debt rose from $9.9bn and Hubbell's from $2.3bn at 31 December 2025.
Vertiv valuation multiples versus peers
Table 4.5 Valuation at the 9 October 2026 close
| Company | Share price | Shares outstanding | Market cap | EV | EV / sales | EV / EBITDA | P / E | P / FCF |
|---|---|---|---|---|---|---|---|---|
Vertiv (VRT) | $242.78 | 385.0m | $93.5bn | $93.3bn | 8.1x | 36.4x | 54.9x | 31.9x |
Eaton (ETN) | $429.65 | 388.4m | $166.9bn | $186.8bn | 6.2x | 29.0x | 43.8x | 42.4x |
nVent (NVT) | $167.43 | 161.9m | $27.1bn | $28.3bn | 5.9x | 26.8x | 45.9x | 41.1x |
Hubbell (HUBB) | $474.11 | 52.8m | $25.0bn | $30.0bn | 4.8x | 20.1x | 28.1x | 27.8x |
Modine (MOD) | $181.56 | 53.1m | $9.6bn | $10.1bn | 3.0x | 23.8x | 67.7x | 96.2x |
Trane Technologies (TT) | $476.98 | 220.0m | $104.9bn | $108.2bn | 4.9x | 24.7x | 36.1x | 29.3x |
Carrier (CARR) | $55.56 | 824.3m | $45.8bn | $56.4bn | 2.6x | 18.8x | 38.3x | 25.0x |
Johnson Controls (JCI) | $157.44 | 605.7m | $95.4bn | $104.2bn | 4.2x | 27.7x | 27.7x | 30.1x |
Peer median, excluding Vertiv | n/a | n/a | n/a | n/a | 4.8x | 24.7x | 38.3x | 30.1x |
Source: market data, 9 October 2026; share counts and financial data from the SEC filings listed under Table 4.3, via SEC-API.io. Market cap uses shares on the latest 10-Q cover. EV = market cap plus net debt. P / E = price over TTM diluted GAAP EPS. P / FCF = market cap over TTM FCF.
On FY2026 net sales guidance of $14.0bn at the midpoint, Vertiv's EV is 6.7x sales.

Schneider Electric and Legrand data center exposure
Table 4.6 European competitors, H1 2026 company reported figures
| Company | Revenue | Reported growth | Organic growth | Adjusted operating margin | Data center disclosure |
|---|---|---|---|---|---|
Schneider Electric | €21.2bn | 9.8% | 14.0% | 19.3% (adjusted EBITA) | Data center and networks sales grew at a double digit rate in Q2 2026 |
Legrand | €5.4bn | 13.1% | 9.8% | 20.8% | Data centers 32% of revenue, organic growth above 30% |
Source: Schneider Electric half year 2026 results, 30 July 2026; Legrand 2026 first half results, 29 July 2026.
5 Material Events & Contracts
Vertiv agreed on 1 September 2026 to buy UtilityInnovation Group (UIG), a maker of microgrid controls and switchgear for data centers, for $1.45bn cash at closing plus up to $1.15bn of earnout; closing is expected in Q4 2026 (8-K). Vertiv filed 19 reports on Form 8-K between 10 October 2025 and 10 October 2026: 8 on acquisitions, 4 on results, 4 on dividends and 1 each on financing, a CFO change and the annual meeting.

Vertiv 8-K filings in the last twelve months
Table 5.1 Form 8-K filings, 10 October 2025 to 10 October 2026, newest first
| Filed | Items | Event | Accession number |
|---|---|---|---|
24 Sep 2026 | 7.01, 9.01 | Agreement to acquire King Environmental Services Ltd., a fluid management, commissioning and load testing provider based near Dublin, Ireland; closing expected in Q4 2026; financial terms undisclosed and described as immaterial to results. | 0001628280-26-063311 |
2 Sep 2026 | 1.01, 7.01, 9.01 | Merger agreement of 1 September 2026 to acquire Utility Innovation Holdings, Inc. for about $1.45bn cash at closing plus up to $1.15bn in two earnout tranches; press release puts the closing price at about 13x expected 2027 EBITDA. | 0001193125-26-379306 |
2 Sep 2026 | 8.01, 9.01 | Quarterly cash dividend of $0.0625 per share declared, payable 24 September 2026; cutoff date for holders 14 September 2026. | 0001628280-26-059961 |
29 Jul 2026 | 2.02, 7.01, 9.01 | Q2 2026 results (Table 2.1); FY2026 guidance raised (Table 3.2); liquidity $5.6bn. | 0001628280-26-050323 |
18 Jun 2026 | 5.07 | Annual meeting of 17 June 2026: 330.5m of 384.1m shares represented (86.05%); voting results in Table 6.5. | 0001628280-26-044317 |
12 Jun 2026 | 7.01, 9.01 | Acquisition of ThermoKey S.p.A. completed; ThermoKey, founded in 1991, makes dry coolers and heat exchangers in Rivarotta, Italy. | 0001628280-26-042641 |
3 Jun 2026 | 8.01, 9.01 | Quarterly cash dividend of $0.0625 per share declared, payable 25 June 2026; cutoff date for holders 15 June 2026. | 0001628280-26-040031 |
27 Apr 2026 | 7.01, 9.01 | Acquisition of Strategic Thermal Labs LLC, a designer of cold plates and server side liquid cooling; price undisclosed. | 0001628280-26-027297 |
22 Apr 2026 | 2.02, 7.01, 9.01 | Q1 2026 results (Table 2.7); FY2026 guidance raised (Table 3.2); liquidity $5.0bn. | 0001628280-26-026379 |
13 Apr 2026 | 7.01, 9.01 | Acquisition of BMarko Structures LLC, a structural fabricator in Williamston, South Carolina with a facility of about 560,000 square feet; price undisclosed. | 0001628280-26-024824 |
24 Mar 2026 | 7.01, 9.01 | Agreement of 23 March 2026 to acquire ThermoKey S.p.A.; closing expected in Q2 2026; price undisclosed. | 0001193125-26-120863 |
6 Mar 2026 | 8.01, 9.01 | Quarterly cash dividend of $0.0625 per share declared, payable 26 March 2026; cutoff date for holders 17 March 2026. | 0001628280-26-015494 |
3 Mar 2026 | 1.01, 1.02, 2.03, 7.01, 8.01, 9.01 | $2.1bn of senior unsecured notes issued (Table 5.3); new $2.5bn unsecured revolving credit facility; term loan repaid in full and $800m asset based revolver replaced (Table 5.4); ratings Baa3 from Moody's and BBB minus from S&P and Fitch. | 0001193125-26-088484 |
11 Feb 2026 | 2.02, 7.01, 9.01 | Q4 2025 and FY2025 results (Table 2.6); backlog $15.0bn; first FY2026 guidance (Table 3.2). | 0001674101-26-000006 |
5 Dec 2025 | 2.01, 7.01, 9.01 | Acquisition of Purge Rite Intermediate, LLC completed on 4 December 2025 for about $1.0bn cash plus up to $250m contingent cash. | 0001674101-25-000031 |
14 Nov 2025 | 7.01, 9.01 | Regular annual dividend raised 67% from $0.15 to $0.25 per share; Q4 2025 dividend of $0.0625 declared on 13 November 2025, payable 18 December 2025; cutoff date for holders 25 November 2025. | 0001674101-25-000028 |
3 Nov 2025 | 1.01, 7.01, 9.01 | Securities purchase agreement of 31 October 2025 to acquire Purge Rite Intermediate, LLC for about $1.0bn cash plus up to $250m contingent cash; the press release names Milton Street Capital LLC as the seller and puts the price at about 10.0x expected 2026 EBITDA including cost synergies. | 0001193125-25-261623 |
22 Oct 2025 | 2.02, 7.01, 9.01 | Q3 2025 results (Table 2.7); backlog $9.5bn (Table 3.4). | 0001674101-25-000020 |
14 Oct 2025 | 5.02, 7.01, 9.01 | Craig Chamberlin appointed CFO effective 10 November 2025; David Fallon retired as CFO effective 9 November 2025 and consults through 31 December 2026. | 0001628280-25-044836 |
Source: Forms 8-K and exhibits linked in each row, SEC filings via SEC-API.io.
Vertiv acquisitions: UtilityInnovation Group, PurgeRite, ThermoKey
PurgeRite's earnout liability of $206m at 30 June 2026 is 82% of the $250m cap, after a $62.0m charge in H1 2026. UIG's $1.45bn closing payment compares with $3.11bn of cash and short term investments at 30 June 2026; the press release puts the price at about 13x expected 2027 EBITDA.

Table 5.2 Acquisition agreements and completed acquisitions
| Target | Business | Signed and closed | Consideration | Earnout and price adjustment | Conditions and termination |
|---|---|---|---|---|---|
Utility Innovation Holdings, Inc. (UIG), Raleigh, North Carolina | Microgrid controls, microgrid switchgear and behind the meter power design for data centers; founded 2020 | Signed 1 Sep 2026; closing expected Q4 2026 | Base purchase price $1.45bn cash, adjusted for working capital, cash, debt and transaction expenses; paid to stockholders, vested option holders and warrant holders through a merger with Vultra Merger Sub, Inc. | Two tranches of up to $575m each: tranche one on adjusted EBITDA for 1 Oct 2026 to 30 Sep 2027, tranche two on cumulative adjusted EBITDA for 1 Oct 2026 to 30 Sep 2028; each pays $575m times actual over target, $0 below 50% of target, capped at $575m; targets sit in Schedule 2.09(a), which the filed exhibit omits; UIG's Storm and UtilityInfrastructure segments are excluded from earnout EBITDA | Expiry of the HSR Act antitrust waiting period, listed foreign antitrust and foreign investment approvals, absence of a prohibiting court order, stockholder approval by written consent; either side can terminate after the 120th day from signing (30 Dec 2026), extended to the 210th day (30 Mar 2027) where regulatory conditions are the sole open conditions; after termination liability is limited to fraud and willful breach |
Purge Rite Intermediate, LLC (PurgeRite), Houston, Texas | Mechanical flushing, purging and filtration of liquid cooling loops in data centers | Signed 31 Oct 2025; closed 4 Dec 2025; amended 4 Dec 2025 on option holder payment mechanics | Base purchase price $1.0bn; recorded consideration, goodwill and intangible assets in Table 2.5 | Earnout equals 2026 gross profit of the flushing business times 5.65, less $1.0bn; capped at $250m; unpaid earnout accrues 10% interest per year; $10.0m adjustment escrow; working capital collar of $33.4m to $53.4m | Closed inside the 29 Jan 2026 outside date; HSR Act waiting period was a closing condition; buyer side representation and warranty insurance policy |
ThermoKey S.p.A., BMarko Structures LLC, Strategic Thermal Labs LLC | Heat rejection and heat exchange; structural fabrication; cold plate and server side liquid cooling | BMarko closed 10 Apr 2026; Strategic Thermal Labs closed 24 Apr 2026; ThermoKey signed 23 Mar 2026 and closed 11 Jun 2026 | Prices undisclosed in the 8-K filings; aggregate recorded consideration in Table 2.5 | Up to $35.0m of additional cash on one acquisition if specified events occur | n/a |
King Environmental Services Ltd., near Dublin, Ireland | Fluid management, commissioning and load testing for liquid cooled data centers in Europe, Middle East and Africa | Announced 24 Sep 2026; closing expected Q4 2026 | Undisclosed | n/a | n/a |
Source: Exhibit 2.1 to 8-K of 2 September 2026; Exhibit 2.1 to 8-K of 3 November 2025; Exhibit 2.4 to 10-K FY2025; 10-Q Q2 2026; 8-K filings in Table 5.1; SEC filings via SEC-API.io. Completion dates for the three Q2 2026 acquisitions are from the 10-Q. Outside dates for UIG are counted from the signing date. HSR Act = Hart Scott Rodino Antitrust Improvements Act.

Vertiv refinancing March 2026: senior notes, revolving credit facility, debt maturities
Refinancing of 3 March 2026 replaced a $2.08bn secured term loan carrying 5.61% with $2.1bn of unsecured notes at a weighted average coupon of 5.53%, and moved the first maturity after 2028 from 2032 to 2036.

Table 5.3 Senior unsecured notes issued 3 March 2026
| Series | Principal | Coupon | Maturity | Price to public | Yield to maturity | Price paid by underwriters | Par call date |
|---|---|---|---|---|---|---|---|
2036 Notes | $600m | 4.850% | 15 Mar 2036 | 99.770% | 4.879% | 99.120% | 15 Dec 2035 |
2046 Notes | $500m | 5.650% | 15 Mar 2046 | 99.558% | 5.687% | 98.808% | 15 Sep 2045 |
2056 Notes | $500m | 5.800% | 15 Mar 2056 | 99.955% | 5.803% | 99.080% | 15 Sep 2055 |
2066 Notes | $500m | 5.950% | 15 Mar 2066 | 99.951% | 5.953% | 99.076% | 15 Sep 2065 |
Total | $2.1bn | 5.53% | n/a | n/a | n/a | $2.08bn | n/a |
Source: 8-K of 3 March 2026, Exhibit 1.1 and Exhibit 4.2; par call dates from note 6 in 10-Q Q2 2026; SEC filings via SEC-API.io. Total coupon is the principal weighted average.
Table 5.4 Material contracts and commitments
| Counterparty | What the contract does | Economics and obligations | Term and termination | Filed as |
|---|---|---|---|---|
U.S. Bank Trust Company, National Association, as trustee | Indenture and first supplemental indenture of 3 March 2026: terms of the four series of senior unsecured notes issued by Vertiv Holdings Co | $2.1bn principal; interest paid on 15 March and 15 September from 15 September 2026; covenants limit liens securing debt and sale and leaseback transactions; holders of 25% of a series can accelerate after an event of default | Maturities 2036 to 2066; redeemable at any time at a make whole price, and at 100% of principal from each par call date; repurchase offer at 101% of principal after a change of control repurchase event | Exhibit 4.1 and Exhibit 4.2 to 8-K 3 Mar 2026 |
BofA Securities, Citigroup, Goldman Sachs, ING, J.P. Morgan and Wells Fargo Securities as representatives of the underwriters | Underwriting agreement of 23 February 2026: sale of the notes to the underwriters under the automatic shelf registration statement on Form S-3 | Underwriters paid 98.808% to 99.120% of principal, $2.08bn in total; spreads of 85 to 125 basis points over benchmark Treasuries | Settled 3 March 2026 | Exhibit 1.1 to 8-K 3 Mar 2026 |
JPMorgan Chase Bank, N.A. as administrative agent, with a lender syndicate | Credit agreement of 3 March 2026: a senior unsecured revolving credit line that Vertiv can draw, repay and use for letters of credit in five currencies | $2.5bn committed, with an option to add up to $1.0bn; at the ratings in place on 3 March 2026 the margin is 1.25% over Term SOFR and the fee on undrawn commitments is 0.15%, within grids of 1.00% to 1.75% and 0.09% to 0.25%; consolidated net debt to EBITDA capped at 4.00 to 1.00, or 4.50 to 1.00 for four quarters after a debt financed acquisition with at least $750m of cash consideration; $2.48bn available at 30 June 2026 after $16.4m of letters of credit | Matures 3 March 2031; two extensions of one year each on request; lenders can accelerate after an event of default, including a change of control | Exhibit 10.1 to 8-K 3 Mar 2026; Note 6 in 10-Q Q2 2026 |
Citibank, N.A. as administrative agent and collateral agent | Term loan credit agreement of 2 March 2020, terminated 3 March 2026: secured term loan to Vertiv Group Corporation | $2.08bn outstanding at 5.61% at 31 December 2025, due 2032; repaid from note proceeds and cash on hand; $6.2m loss on extinguishment in H1 2026 | Terminated 3 March 2026; guarantees and liens released | Exhibits 10.25 to 10.31 in 10-K FY2025; Item 1.02 of 8-K 3 Mar 2026 |
JPMorgan Chase Bank, N.A. as administrative agent | Revolving credit agreement of 30 November 2016, replaced 3 March 2026: asset based lending (ABL) revolver secured on working capital | $800m facility due 2029; undrawn with $784.0m available at 31 December 2025 | Commitments terminated 3 March 2026 | Exhibits 10.15 to 10.24 in 10-K FY2025 |
UMB Bank, N.A. as trustee and collateral agent | Indenture of 22 October 2021: terms of the 4.125% Senior Secured Notes due 2028 issued by Vertiv Group Corporation | $850m principal, issued at par; covenants restrict liens, asset sales, dividends, debt and investments of the issuer and certain subsidiaries | Due 15 November 2028; outstanding at 30 June 2026 | Exhibits 4.1 and 4.2 in 10-K FY2025 |
Craig Chamberlin, CFO from 10 November 2025 | Offer letter: pay terms of the new CFO | Base salary $750,000; target bonus 100% of salary; annual equity grant of $2,000,000 target value from March 2026; sign on cash of $300,000; sign on restricted stock units of $1,050,700 vesting 50%, 30% and 20% after one, two and three years | Severance under the Executive Employment Policy on termination without cause or resignation for good reason; Change of Control Plan benefits; non compete and non solicit covenants | Exhibit 10.1 to 10-Q Q3 2025; 8-K 14 Oct 2025 |
David Fallon, CFO until 9 November 2025 | Transition and consulting agreement of 28 May 2025: service as CFO until a successor starts, then consulting as an independent contractor | Up to 145,613 stock options stay eligible to vest in March 2026; bonus for 2025 prorated to the transition date; Executive Employment Policy severance excluded | Consulting through 31 December 2026; non compete and non solicit run 12 months after that; either side can terminate for material breach | Exhibit 10.1 to 10-Q Q2 2025 |
Holders of Class A common stock | Board authorizations for share repurchases and dividends | Repurchase program of up to $3.0bn approved 29 November 2023, with $2.4bn remaining at 30 June 2026 and 0 shares repurchased in 2026; quarterly dividend of $0.0625 per share; dividends paid $47.8m in H1 2026 | Repurchase authorization runs through 31 December 2027; board can modify or suspend it | Part II Item 2 in 10-Q Q2 2026; 10-K FY2025 |
Landlords, customers and banks | Operating leases, and bank guarantees and bonds that pay customers on non performance | Undiscounted lease payments $403.3m, of which $92.9m due in 2026; bank guarantees and bonds $184.0m | Weighted average remaining lease term 5.8 years at 31 December 2025 | Notes 7 and 16 in 10-K FY2025 |
Source: exhibits and filings linked in each row, SEC filings via SEC-API.io.
6 Ownership, Voting Power & Annual Meeting
Vertiv has one class of common stock with one vote per share, and the ten largest positions identified in Form 13F filings (quarterly institutional holdings reports) at 30 June 2026 total 144.4m shares, 37.5% of 385.0m shares outstanding. Directors and executive officers as a group hold 4.2m shares (1.10%), of which 3.5m are options exercisable within 60 days.
Vertiv major shareholders and voting power
Table 6.1 Beneficial ownership at 15 April 2026, Class A common stock, one vote per share
| Holder | Role | Shares | Of which options | % of shares and votes, as filed |
|---|---|---|---|---|
BlackRock, Inc. | 5% holder, Schedule 13G/A filed 17 Apr 2025 | 21.3m | n/a | 5.55% |
Giordano Albertazzi | CEO and director | 1.6m | 1.5m | below 1% |
David Fallon | Former CFO | 653,216 | 492,091 | below 1% |
David M. Cote | Executive Chairman | 481,587 | 459,329 | below 1% |
Stephanie Gill | Chief Legal Officer | 338,656 | 302,156 | below 1% |
Roger Fradin | Director | 301,317 | 149,691 | below 1% |
Anand Sanghi | President, Americas | 280,038 | 243,438 | below 1% |
Steven S. Reinemund | Director | 218,024 | 149,691 | below 1% |
Jacob Kotzubei | Director, Co President of Platinum Equity | 149,691 | 149,691 | below 1% |
Matthew Louie | Director, Managing Director at Platinum Equity | 149,691 | 149,691 | below 1% |
Joseph J. DeAngelo | Director | 122,219 | 50,619 | below 1% |
Joseph van Dokkum | Director | 97,397 | 72,397 | below 1% |
Edward L. Monser | Director | 89,815 | 72,397 | below 1% |
Scott Armul | Chief Product & Technology Officer | 81,105 | 46,366 | below 1% |
Jakki L. Haussler | Director | 25,267 | 20,636 | below 1% |
Craig Chamberlin | CFO since 10 Nov 2025 | 5,657 | 0 | below 1% |
Krishna Mikkilineni | Director | 778 | 0 | below 1% |
Directors and executive officers as a group | 20 persons | 4.2m | 3.5m | 1.10% |
Source: DEF 14A, SEC filings via SEC-API.io. Later Schedule 13G filings: BlackRock 29.9m shares (7.8%) and Vanguard Capital Management 28.6m shares (7.48%) at 31 March 2026 (Table 6.4). David M. Cote's 481,587 shares consist of 459,329 options held through two trusts and 22,258 shares held by his spouse.
Platinum Equity and SPAC sponsor holdings in Vertiv

Table 6.2 Holdings of the owner before listing and of the SPAC (special purpose acquisition company) sponsors, as last filed
| Holder | Role at the February 2020 listing | Last filed holding | Filing |
|---|---|---|---|
VPE Holdings, LLC (Platinum Equity) | Owner of Vertiv before the business combination, 118.3m shares (36.0%) | 0 shares after selling 8.0m at $65.98 on 29 Feb 2024 | Form 4, accession 0001104659-24-030006 |
GS Sponsor LLC (Schedule 13G/A filed by GSAM Holdings LLC) | Sponsor of GS Acquisition Holdings Corp | 0 shares | SC 13G/A filed 27 Mar 2023 |
David M. Cote and Cote SPAC 1 LLC | Sponsor of GS Acquisition Holdings Corp | 15.9m (4.8%) at 31 Dec 2020; 481,587 at 15 April 2026 | SC 13G/A filed 16 Feb 2021; DEF 14A |
Source: filings linked in the table, SEC filings via SEC-API.io.
Platinum Equity executives Jacob Kotzubei and Matthew Louie are directors; each Platinum Equity Advisors 13F from 30 June 2024 to 30 June 2026 reports 0 Vertiv shares.
Vertiv 13F institutional holders and Schedule 13G filings

13F filings reporting the stock rose 41.5% from 1,503 to 2,127 over three quarters. State Street's position rose from 8.7m shares at 31 December 2025 to 16.5m at 30 June 2026.

Table 6.3 Ten largest 13F positions identified at 30 June 2026 and the prior three quarter ends
| Holder | 30 Sep 2025 | 31 Dec 2025 | 31 Mar 2026 | 30 Jun 2026 | % of shares outstanding |
|---|---|---|---|---|---|
| 36.1m | 32.0m | n/a | 35.9m | 9.3% | |
| n/a | n/a | 24.9m | 25.1m | 6.5% | |
| n/a | n/a | 17.9m | 17.9m | 4.7% | |
| 8.5m | 8.7m | 15.8m | 16.5m | 4.3% | |
| 4.2m | 4.0m | 6.1m | 10.1m | 2.6% | |
| 7.1m | 6.7m | 7.9m | 9.1m | 2.4% | |
| 6.9m | 7.1m | 10.9m | 9.0m | 2.3% | |
| 9.7m | 9.2m | 8.4m | 8.3m | 2.2% | |
| 6.4m | 6.3m | 6.7m | 6.9m | 1.8% | |
| 5.9m | 6.0m | 6.5m | 5.5m | 1.4% | |
The Vanguard Group, filer until Q4 2025 | 38.8m | 38.3m | n/a | n/a | n/a |
Source: 13F-HR and 13F-HR/A filings linked per holder; % on 385.0m shares from the 10-Q cover; SEC filings via SEC-API.io.
Table 6.4 Schedule 13G filings on Vertiv, 10 October 2024 to 10 October 2026; Schedule 13D filings: 0
| Filed | Filer | Form | Event date | Shares | % of class | Sole voting power | Accession |
|---|---|---|---|---|---|---|---|
30 Apr 2026 | Vanguard Capital Management | SC 13G | 31 Mar 2026 | 28.6m | 7.48% | 3.8m | 0002100119-26-001190 |
24 Apr 2026 | BlackRock, Inc. | SC 13G/A, amendment 3 | 31 Mar 2026 | 29.9m | 7.8% | 27.7m | 0002012383-26-001474 |
27 Mar 2026 | The Vanguard Group | SC 13G/A, amendment 7 | 13 Mar 2026 | 0 | 0% | 0 | 0000102909-26-002519 |
7 Aug 2025 | The Vanguard Group | SC 13G/A, amendment 6 | 31 Jul 2025 | 38.2m | 10.0% | 0 | 0000932471-25-001116 |
17 Apr 2025 | BlackRock, Inc. | SC 13G/A, amendment 2 | 31 Mar 2025 | 21.3m | 5.6% | 19.0m | 0001576419-25-000834 |
13 Nov 2024 | Barrow Hanley Global Investors | SC 13G | 30 Sep 2024 | 0 | 0% | 0 | 0000313028-24-000062 |
12 Nov 2024 | The Vanguard Group | SC 13G/A | 30 Sep 2024 | 35.1m | 9.35% | 0 | 0000932471-24-001242 |
12 Nov 2024 | BlackRock, Inc. | SC 13G/A | 30 Sep 2024 | 37.1m | 9.9% | 34.6m | 0002012383-24-004343 |
12 Nov 2024 | FMR LLC | SC 13G/A | n/a | 12.2m | 3.248% | 10.8m | 0000315066-24-002881 |
4 Nov 2024 | The Vanguard Group | SC 13G/A | 30 Sep 2024 | 35.1m | 9.35% | 0 | 0000932471-24-000675 |
21 Oct 2024 | BlackRock, Inc. | SC 13G/A | 30 Sep 2024 | 37.1m | 9.9% | 0 | 0002012383-24-000906 |
Source: Schedule 13G filings linked by accession number, SEC filings via SEC-API.io.
Vertiv annual meeting voting results 2026
Shares represented were 330.5m, 86.05% of those entitled to vote (83.46% in 2025). Directors are elected by plurality. Joseph van Dokkum received 54.2% for and six further nominees between 70% and 87%. Shareholder proposals: 0.
Table 6.5 Annual meeting 17 June 2026; % for is votes for over votes for plus withheld or against
| Item | Matter | Board position | For | Withheld or against | Abstain | Broker non votes | % for |
|---|---|---|---|---|---|---|---|
1 | Elect David M. Cote | FOR | 267.1m | 28.3m | n/a | 35.1m | 90.4% |
1 | Elect Giordano Albertazzi | FOR | 288.1m | 7.3m | n/a | 35.1m | 97.5% |
1 | Elect Joseph J. DeAngelo | FOR | 221.2m | 74.2m | n/a | 35.1m | 74.9% |
1 | Elect Joseph van Dokkum | FOR | 160.0m | 135.4m | n/a | 35.1m | 54.2% |
1 | Elect Roger Fradin | FOR | 207.6m | 87.8m | n/a | 35.1m | 70.3% |
1 | Elect Jakki L. Haussler | FOR | 283.6m | 11.8m | n/a | 35.1m | 96.0% |
1 | Elect Jacob Kotzubei | FOR | 256.8m | 38.6m | n/a | 35.1m | 86.9% |
1 | Elect Matthew Louie | FOR | 252.8m | 42.6m | n/a | 35.1m | 85.6% |
1 | Elect Krishna Mikkilineni | FOR | 292.4m | 3.1m | n/a | 35.1m | 99.0% |
1 | Elect Edward L. Monser | FOR | 244.9m | 50.6m | n/a | 35.1m | 82.9% |
1 | Elect Steven S. Reinemund | FOR | 226.1m | 69.3m | n/a | 35.1m | 76.6% |
2 | Advisory vote on 2025 executive pay | FOR | 260.7m | 34.3m | 0.4m | 35.1m | 88.4% |
3 | Ratify Ernst & Young LLP as auditor for 2026 | FOR | 320.6m | 9.6m | 0.3m | 0 | 97.1% |
Source: 8-K Item 5.07; board positions from the DEF 14A; SEC filings via SEC-API.io.

Vertiv CEO pay and pay ratio
Table 6.6 Executive compensation headline figures
| Measure | 2025 | 2024 | 2023 |
|---|---|---|---|
CEO total compensation, Giordano Albertazzi | $18.3m | $12.3m | $6.2m |
Of which option awards | $13.0m | $8.2m | $3.3m |
Median employee total compensation | $27,811 | n/a | n/a |
CEO pay ratio | 658 to 1 | n/a | n/a |
Say on pay support at the following annual meeting | 88.4% | 87.4% | n/a |
Source: DEF 14A; say on pay from 8-K Item 5.07 filings of 18 June 2026 and 20 June 2025; SEC filings via SEC-API.io.
7 Insider Activity
Vertiv insiders sold 510,549 shares for $128.17m in the open market in the twelve months to 10 October 2026 and bought 0; the latest sale was 15,287 shares for $3.88m on 1 September 2026 under a Rule 10b5-1 trading plan. Buy to sell ratio is 0.00 on open market transactions (Form 4 codes P and S). Filed in the period: 91 Forms 4, 4 Forms 3, 0 Forms 5, by 25 reporting persons.
Insider buying and selling by month

Five insiders sold 412,467 shares for $104.38m on 26 and 27 February 2026, 81% of twelve month sale value. Sales with the Rule 10b5-1 flag total 92,581 shares, 18% of sale value.
Table 7.1 Insider transactions by month, shares
| Month | Sold (S) | Bought (P) | Sale value | Sellers | Options exercised (M) | Awards (A) | Withheld for tax (F) | Gifted (G) |
|---|---|---|---|---|---|---|---|---|
Oct 2025 | 0 | 0 | 0 | 0 | 0 | 0 | 0 | 0 |
Nov 2025 | 5,501 | 0 | $0.94m | 1 | 0 | 5,593 | 0 | 27,500 |
Dec 2025 | 0 | 0 | 0 | 0 | 0 | 24 | 0 | 36,826 |
Jan 2026 | 0 | 0 | 0 | 0 | 0 | 11,388 | 6,253 | 0 |
Feb 2026 | 412,467 | 0 | $104.38m | 5 | 69,134 | 109,069 | 0 | 0 |
Mar 2026 | 77,294 | 0 | $18.97m | 1 | 77,294 | 312,218 | 930 | 0 |
Apr 2026 | 0 | 0 | 0 | 0 | 0 | 0 | 0 | 0 |
May 2026 | 0 | 0 | 0 | 0 | 0 | 3,941 | 1,390 | 0 |
Jun 2026 | 0 | 0 | 0 | 0 | 0 | 3,109 | 0 | 0 |
Jul 2026 | 0 | 0 | 0 | 0 | 0 | 0 | 0 | 0 |
Aug 2026 | 0 | 0 | 0 | 0 | 0 | 0 | 0 | 0 |
Sep 2026 | 15,287 | 0 | $3.88m | 1 | 15,287 | 43 | 2,352 | 118,523 |
Oct 2026 | 0 | 0 | 0 | 0 | 0 | 3,193 | 0 | 0 |
Total | 510,549 | 0 | $128.17m | 7 | 161,715 | 448,578 | 10,925 | 182,849 |
Source: Forms 3 and 4 filed 10 Oct 2025 to 10 Oct 2026, SEC filings via SEC-API.io. Awards include stock options, restricted stock units (RSUs) and dividend equivalent units.
Insider sales by person
Table 7.2 Open market sales (Form 4 code S) by Form 4 filing, largest first
| Sale date | Insider | Role on Form 4 | Shares sold | Average price | Value | Exercised same day | Held after sale | 10b5-1 flag | Form 4 |
|---|---|---|---|---|---|---|---|---|---|
26 to 27 Feb 2026 | Roger Fradin | Director | 203,333 | $252.78 | $51.40m | 0 | 65,000 (three trusts) | No | 0000950142-26-000578 |
26 Feb 2026 | Steven Reinemund | Director | 100,000 | $253.95 | $25.39m | 0 | 68,333 (direct and trust) | No | 0000950142-26-000580 |
6 Mar 2026 | Edward Monser | Director | 77,294 | $245.49 | $18.97m | 77,294 | 16,500 | Yes | 0000950142-26-000662 |
26 Feb 2026 | David Cote | Executive Chairman | 40,000 | $255.29 | $10.21m | 0 | 22,258 (spouse) | No | 0000950142-26-000576 |
26 Feb 2026 | Joseph van Dokkum | Director | 38,647 | $254.87 | $9.85m | 38,647 | 25,000 | No | 0000950142-26-000577 |
26 Feb 2026 | Anders Karlborg | EVP, Man., Logistics and Op Ex | 30,487 | $246.92 | $7.53m | 30,487 | 34,746 | No | 0000950142-26-000579 |
1 Sep 2026 | Edward Monser | Director | 15,287 | $253.82 | $3.88m | 15,287 | 16,500 | Yes | 0000950142-26-002483 |
24 Nov 2025 | Stephen Liang | Chief Technology Officer & EVP | 5,501 | $170.48 | $0.94m | 0 | 4,050 | No | 0000950142-25-003065 |
Total | n/a | n/a | 510,549 | $251.05 | $128.17m | 161,715 | n/a | n/a | n/a |
Source: Forms 4 linked in the table, SEC filings via SEC-API.io. Held after sale counts the holding lines sold from: Roger Fradin's 203,333 shares were sold by three grantor retained annuity trusts, Steven Reinemund's by him directly (35,000) and a community property trust (65,000), and David Cote's Form 4 reports a sale by his spouse.

Four of eight sale filings sold shares acquired the same day by option exercise: 161,715 shares at exercise prices of $11.25 to $72.09.
Stock awards, option exercises, tax withholding and gifts

Option grants on 6 March 2026 cover 311,559 options for 19 insiders at a $241.78 exercise price. CEO Giordano Albertazzi gifted 118,523 shares to a family trust on 8 September 2026 (Form 4).
Table 7.3 Insider transactions by type
| Type | Code | Transactions | Insiders | Shares or units | Value at reported price |
|---|---|---|---|---|---|
Open market purchase | P | 0 | 0 | 0 | 0 |
Open market sale | S | 73 | 7 | 510,549 | $128.17m |
Option exercise | M | 9 | 3 | 161,715 | $3.02m |
Stock option award | A | 21 | 21 | 318,576 | n/a |
RSU and earned performance award | A | 12 | 10 | 129,863 | n/a |
Dividend equivalent unit accrual | A | 40 | 12 | 139 | n/a |
Shares withheld for tax | F | 7 | 7 | 10,925 | $2.35m |
Gift, shares disposed | G | 5 | 4 | 182,849 | n/a |
Source: Forms 4 filed 10 Oct 2025 to 10 Oct 2026, SEC filings via SEC-API.io. Option exercise value is the exercise cost; gifts as acquisitions by family trusts (36,626 shares) are counted once, on the disposing side.
Form 144 notices of proposed sale and new insiders
Form 144 notices cover 2.08m shares with a stated market value of $543.20m. Former officer Philip O'Doherty accounts for 1.5m shares ($395.98m); his notice of 10 March 2026 reports 689,313 shares sold on 9 March 2026 for $181.97m.
Table 7.4 Form 144 notices filed 10 Oct 2025 to 10 Oct 2026, by person
| Person for whose account | Relationship stated | Notices | Filed | Shares to be sold | Stated market value | 10b5-1 plan adopted | Form 144 |
|---|---|---|---|---|---|---|---|
Philip O'Doherty (Powerbar 2 Limited) | Former officer | 2 | 9 Mar 2026 to 10 Mar 2026 | 1,500,000 | $395.98m | n/a | 1, 2 |
Roger Fradin (three trusts) | Director | 6 | 26 Feb 2026 to 27 Feb 2026 | 203,333 | $51.39m | n/a | 1, 2, 3, 4, 5, 6 |
Steven Reinemund | Director | 2 | 26 Feb 2026 | 100,000 | $25.39m | n/a | 1, 2 |
Edward Monser | Director | 2 | 6 Mar 2026 to 1 Sep 2026 | 92,581 | $23.26m | 5 Dec 2025, 22 May 2026 | 1, 2 |
Stephen Liang | Officer | 2 | 24 Nov 2025 to 26 Feb 2026 | 79,413 | $19.59m | n/a | 1, 2 |
Maureen Cote | Spouse of officer | 1 | 26 Feb 2026 | 40,000 | $10.21m | n/a | 1 |
Joseph van Dokkum | Director | 1 | 26 Feb 2026 | 38,647 | $9.85m | n/a | 1 |
Anders Karlborg | Officer | 1 | 26 Feb 2026 | 30,487 | $7.53m | n/a | 1 |
Total | n/a | 17 | n/a | 2,084,461 | $543.20m | n/a | n/a |
Source: Forms 144 linked in the table, SEC filings via SEC-API.io. Philip O'Doherty's notices state that Powerbar 2 Limited sells the shares, acquired on 1 November 2021 as merger consideration.
Table 7.5 Form 3 initial statements and first award
| Insider | Role | Event date | Shares owned on Form 3 | First award on Form 4 | Form 3 |
|---|---|---|---|---|---|
Michael Resha | EVP, Man., Logistics and Op Ex | 5 Oct 2026 | 0 | 3,193 RSUs, 5 Oct 2026 | 0001628280-26-064936 |
Krishna Mikkilineni | Director | 17 Jun 2026 | 278 | 3,076 options at $317.58, 17 Jun 2026 | 0001628280-26-044362 |
Ying Frieda He | Chief Procurement Officer | 5 May 2026 | 0 | 3,941 options at $341.02, 5 May 2026 | 0001628280-26-030593 |
Craig Chamberlin | Chief Financial Officer | 10 Nov 2025 | 0 | 5,593 RSUs, 10 Nov 2025 | 0002091386-25-000002 |
Source: Forms 3 linked in the table and the following Forms 4, SEC filings via SEC-API.io.
8 Risk Factors
Vertiv's Q2 2026 10-Q restates 1 of the 44 risk factors in the FY2025 10-K: the debt covenant risk now cites a maximum leverage ratio of 4.00:1.00 after the March 2026 refinancing. Against the FY2024 10-K, the FY2025 10-K added 0 risk factors, merged 3 into existing ones (47 to 44), reworded 19, lightly edited 11 and left 14 unchanged; length fell 4.9% from 13,231 to 12,587 words.
Vertiv risk factors by category
Table 8.1 Risk factor count and word count by category as filed
| Category | Count FY2024 | Count FY2025 | Words FY2024 | Words FY2025 | Change in words |
|---|---|---|---|---|---|
Customers and industry | 9 | 9 | 1,722 | 1,910 | 188 |
Business operations | 12 | 11 | 4,345 | 4,137 | (208) |
Legal and regulatory | 9 | 9 | 2,788 | 2,781 | (7) |
Financial position and indebtedness | 8 | 6 | 2,206 | 1,689 | (517) |
Securities | 4 | 4 | 1,072 | 1,035 | (37) |
General | 5 | 5 | 1,098 | 1,035 | (63) |
Total | 47 | 44 | 13,231 | 12,587 | (644) |
Source: 10-K FY2025, 10-K FY2024, SEC filings via SEC-API.io. Word counts cover risk headings and body text under Item 1A.


Vertiv risk factor changes FY2025 against FY2024
Customer and industry risks carry 7 of the 19 reworded factors; added text names AI spending shifts, local data center siting limits and contract terms on large AI projects.
Table 8.2 Item 1A risk factors reworded, merged or edited in the FY2025 10-K against the FY2024 10-K; the 14 unchanged risk factors are omitted
| Category | Risk factor | Words FY2025 | Change in words | Status | What changed |
|---|---|---|---|---|---|
Customers and industry | Data center demand growth | 144 | 21 | Reworded | Adds shifts in the level or focus of AI spending as a cause of lower demand; networks becomes critical infrastructure systems. |
Customers and industry | Sales cycle and order timing | 183 | 3 | Minor edits | Results now vary from period to period, previously from quarter to quarter. |
Customers and industry | Backlog conversion | 179 | 12 | Reworded | Backlog of approximately $15.0bn at 31 December 2025 against $7.2bn; delivery window moves from one year to 12 to 18 months; acquired contracts may carry different cancellation terms. |
Customers and industry | Customer market disruption | 278 | 117 | Reworded | Adds local zoning decisions, community opposition and moratoria on data center siting, and shifts in AI or cloud spending that cut demand while technology spending overall holds. |
Customers and industry | Larger customer contract terms | 207 | 19 | Reworded | Adds neocloud customers, multi year AI projects, stricter performance and delivery commitments and a greater share of project and schedule risk allocated to Vertiv. |
Customers and industry | Fixed price contracts | 195 | 5 | Minor edits | Heading adds failure to estimate costs accurately. |
Customers and industry | Competition | 353 | 16 | Reworded | Names Delta Electronics, Stulz, Johnson Controls and Socomec as offering specific competitors; Schneider Electric, Eaton, Legrand and Huawei stay as global competitors. |
Customers and industry | Performance guarantees | 171 | 28 | Reworded | Adds large data center and AI projects as opportunities that need guarantees, and limits on the capacity of financial institutions to issue them. |
Customers and industry | Government contracts | 200 | (33) | Reworded | Adds evolving cybersecurity, data protection and supply chain standards; text on less favorable pricing terms removed; moved from sixth to ninth position. |
Business operations | Production costs and supply chain | 789 | 88 | Reworded | New bullet on increasing demand covers penalty provisions and liquidated damages if production or materials fall short of large orders; customs duties and tariffs added to each cost list. |
Business operations | Technology shifts | 246 | 4 | Minor edits | Liquid cooling example removed; strategic partnerships in the digital infrastructure value chain added. |
Business operations | IT systems and cyber security | 506 | 22 | Reworded | Adds AI technology, supplier systems and engineering, manufacturing and operations functions to the systems exposed. |
Business operations | New IT system implementation | 217 | (3) | Minor edits | Adds AI to enhancements; statement that past problems affected planning removed. |
Business operations | Tax law changes | 392 | (34) | Minor edits | Passage on the global minimum tax rules (Pillar Two) shortened by 34 words. |
Business operations | Product failure and liability | 312 | 26 | Minor edits | Adds use of products outside the intended performance envelope and field service work for quality remediation. |
Business operations | Global operations | 697 | (342) | Reworded | Absorbs the FY2024 standalone war and conflict risk; headcount updated from approximately 31,000 to 34,000; emerging market list condensed. |
Business operations | War and geopolitical conflict | 0 | n/a | Merged | Standalone FY2024 risk factor of 306 words, now part of the global operations risk factor. |
Business operations | Acquisitions and investments | 509 | 36 | Reworded | Scope widened to investments in early stage companies, with downside protection and integration of technologies added to the listed risks. |
Legal and regulatory | Legislation affecting customers | 154 | (10) | Minor edits | Heading shortened; AI added to the areas where regulation could lower customer demand. |
Legal and regulatory | Data privacy | 204 | 0 | Minor edits | Wording edits; same 204 words. |
Legal and regulatory | Export controls and sanctions | 258 | 18 | Reworded | Adds potential Chinese control of rare earth elements as a trade restriction. |
Legal and regulatory | Tariffs and trade policy | 344 | 6 | Minor edits | Administration described as "current", previously "new"; policy shifts now described as ongoing or long term. |
Legal and regulatory | Legal claims and proceedings | 170 | 9 | Minor edits | Qualifiers added; 9 more words. |
Legal and regulatory | Environmental, health and safety | 481 | (6) | Minor edits | Heading reworded; regional list of remediation sites replaced with "global". |
Legal and regulatory | Environmental and sustainability goals | 395 | (24) | Reworded | Terms ESG and DEI replaced with environmental and sustainability related matters; references to state laws and an executive order replaced with governmental rules, orders and regulations. |
Financial position and indebtedness | Level of indebtedness | 422 | (463) | Reworded | Absorbs the FY2024 risk on capacity to incur more debt; itemized balances ($2.10bn term loan, $850m notes, $784.9m undrawn revolver) replaced with a cross reference. |
Financial position and indebtedness | Capacity to incur more debt | 0 | n/a | Merged | Standalone FY2024 risk factor of 435 words, now part of the level of indebtedness risk factor. |
Financial position and indebtedness | Restrictive covenants | 558 | (60) | Reworded | Combines two FY2024 covenant risks; minimum fixed charge coverage ratio of 1.00 to 1.00 under the asset based revolver retained. |
Financial position and indebtedness | Covenant compliance | 0 | n/a | Merged | Standalone FY2024 risk factor of 359 words, now part of the restrictive covenants risk factor. |
Financial position and indebtedness | Capital market access | 174 | 6 | Reworded | Business plan "may be" dependent on capital markets, previously "is"; funding purposes named as strategic acquisitions and refinancing of maturing debt. |
Securities | Resales of securities | 144 | (35) | Reworded | References to former owners of the predecessor business and restricted shares removed; resale registration statements remain. |
General | Macroeconomic conditions | 247 | 30 | Reworded | Adds tariff related cost pressure and reduced or delayed investment in data center, cloud and AI infrastructure. |
General | Public company costs | 150 | (95) | Reworded | Shortened by 95 words; text on restatements and the auditor report on internal control removed. |
Source: 10-K FY2025, 10-K FY2024, SEC filings via SEC-API.io. Change in words for a risk factor that absorbed a merged one is measured against both FY2024 texts combined.

Vertiv 10-Q risk factor update and legal proceedings
Q1 2026 and Q2 2026 10-Q filings carry the same restated covenant risk. Matters named in the Q2 2026 10-Q: 2, the 2022 securities class action and the related derivative action; the SEC closed its related investigation on 30 December 2025 with 0 enforcement recommendations.
Table 8.3 Debt covenant risk factor, FY2025 10-K against Q2 2026 10-Q; debt balances are in Table 2.4 and facility terms in Table 5.4
| Item | FY2025 10-K | Q2 2026 10-Q |
|---|---|---|
Debt named in the risk factor | Senior Secured Credit Facilities (term loan and asset based revolver) and the Notes | Senior Unsecured Revolving Credit Facility, Senior Secured Notes and Senior Notes |
Financial covenant | Minimum fixed charge coverage ratio of 1.00 to 1.00 if revolver availability falls below a threshold | Maximum consolidated leverage ratio of 4.00:1.00, tested quarterly |
Covenant step up | n/a | 4.50:1.00 for four quarters after an acquisition with cash consideration of at least $750m |
Source: 10-K FY2025, 8-K of 3 March 2026, 10-Q Q1 2026, 10-Q Q2 2026, SEC filings via SEC-API.io.
Table 8.4 Legal proceedings as disclosed
| Matter | FY2024 10-K | FY2025 10-K | Q2 2026 10-Q |
|---|---|---|---|
In re Vertiv Holdings Co Securities Litigation, class period 24 February 2021 to 22 February 2022 | Securities Act claims dismissed 31 January 2024; motion to dismiss Exchange Act claims pending | Same status | Same status |
Consolidated stockholder derivative action, Delaware Court of Chancery | Consolidated and stayed 13 February 2025 | Stayed | Stayed |
SEC subpoena and document request from the U.S. Attorney's Office, received November 2023 | Company responding | SEC investigation concluded 30 December 2025 with 0 enforcement actions recommended; U.S. Attorney requests since 2024: 0 | Omitted from the filing |
Mexican customs tax audit of a subsidiary, April 2016 to February 2018 | $10.1m paid in Q1 2024; reimbursement sought, receivable recorded: $0 | Same status | Omitted from the filing |
Source: 10-K FY2024, 10-K FY2025, 10-Q Q2 2026, SEC filings via SEC-API.io.
Vertiv market risk sensitivity and cybersecurity governance
A 100 basis point rise in rates would add $10.8m to annual net interest expense on balances at 31 December 2025 (10-K Item 7A); the floating rate term loan behind that figure was repaid on 3 March 2026. Vertiv's Q2 2026 10-Q reports market risk disclosures as materially unchanged since the 10-K.
Table 8.5 Item 7A market risk disclosures as filed
| Measure | 31 Dec 2025 | 31 Dec 2024 |
|---|---|---|
Term loan principal, floating rate | $2.08bn | $2.10bn |
Term loan borrowing rate | 5.61% | 6.19% |
Interest rate swap notional | $1.00bn | $1.00bn |
Cash and cash equivalents | $1.73bn | $1.23bn |
Rise in annual net interest expense, 100 basis points | $10.8m | $11.0m |
Rise in annual net interest expense, 200 basis points | $21.5m | $21.9m |
Gain on copper and aluminum hedges, prices up 10% | $15.8m | n/a |
Loss on copper and aluminum hedges, prices down 10% | $13.2m | n/a |
Currencies hedged with one month forwards | Euro, Chinese Yuan, British Pound, Mexican Peso | Euro, Chinese Yuan, British Pound |
Source: 10-K FY2025, 10-K FY2024, SEC filings via SEC-API.io.
Table 8.6 Item 1C cybersecurity disclosure, FY2025 against FY2024
| Topic | FY2025 10-K | FY2024 10-K |
|---|---|---|
Material cybersecurity incidents to date | 0 | 0 |
Framework | NIST Special Publication 800 53 security controls and ISO 27001 | NIST Special Publication 800 53 security controls and ISO 27001 |
Board oversight | Board with the Audit Committee and the Enterprise Risk Committee | Board with the Audit Committee and the Enterprise Risk Committee |
Escalation by the Cyber Risk Oversight Committee | Communicates "material risks" to the Enterprise Risk Committee | Communicated "any unresolved risks" |
Chief Information Security Officer experience | More than 20 years | More than 20 years |
Chief Information Officer | New officeholder with 30 years of experience | Prior officeholder with more than 30 years of experience |
Testing and training | Penetration tests twice a year; annual staff training | Penetration tests twice a year; annual staff training |
Source: 10-K FY2025, 10-K FY2024, SEC filings via SEC-API.io.
9 Stock Price, Scenarios & Sensitivity
Three scenarios to FY2029 return implied prices of $126, $308 and $532 on adjusted diluted EPS, against a close of $242.78 on 9 October 2026, which is (36.1)% from the 52 week high of $379.94. Scenario prices are built on adjusted (non GAAP) diluted EPS, while P / E of 54.9x is on GAAP diluted EPS of $4.42; FY2026 guidance midpoints are $5.87 GAAP and $6.70 adjusted. Exit multiples of 20x, 28x and 36x compare with 45.9x TTM adjusted EPS.
Vertiv stock price history

Table 9.1 Price range and further TTM multiples at 9 October 2026
| Metric | Value | Basis |
|---|---|---|
52 week high and low | $379.94 and $147.82 | Intraday, 14 May 2026 and 17 December 2025 |
Change since 31 December 2025 | 49.9% | Month end close $162.01 |
Price as a multiple of the 30 September 2021 close | 10.1x | Month end close $24.09 |
EV with agreed UtilityInnovation Group purchase | $94.7bn | Adds $1.45bn cash at closing, expected Q4 2026; up to $1.15bn further contingent |
EV to TTM FCF | 31.8x | TTM FCF $2.93bn; company adjusted FCF $2.92bn |
EV to TTM adjusted operating profit | 36.5x | TTM adjusted operating profit $2.55bn; company measure before amortization of intangibles, contingent consideration, restructuring and acquisition costs |
Price to TTM adjusted diluted EPS | 45.9x | TTM adjusted diluted EPS $5.29 |
Price to FY2026 guided adjusted diluted EPS | 36.2x | Guidance midpoint $6.70 |
TTM FCF yield | 3.1% | TTM FCF over market capitalization |
Source: 10-Q Q2 2026, 10-K FY2025, 8-K Exhibit 99.1 of 29 July 2026 and 8-K of 2 September 2026, SEC filings via SEC-API.io; market data, 9 October 2026.
Shares closed at $248.51 on the day of the Q4 2025 release (11 February 2026), 24.5% above the prior close of $199.62; the close before the Q2 2026 release (29 July 2026) was $269.56 (market data).
Vertiv scenario analysis FY2027 to FY2029
FY2026E takes the guidance midpoint of 29 July 2026: revenue $14.0bn, adjusted operating profit $3.33bn, adjusted diluted EPS $6.70 and company adjusted FCF $2.5bn. Each implied price is an arithmetic outcome of stated assumptions: FY2029 adjusted EPS times the exit multiple, undiscounted. Three filed figures test the base case: organic orders against sales, year end backlog against $15.0bn, and the direction of deferred revenue after the $1.82bn H1 2026 inflow. FY2026 guidance midpoints imply GAAP operating margin of 21.1% and diluted GAAP EPS of $5.87 on 392.8m diluted shares; base case diluted shares reach 396.3m in FY2029.
Table 9.2 Scenario assumptions
| Assumption | Reference point from filings | Worst case | Base case | Best case |
|---|---|---|---|---|
Revenue growth, FY2027 / FY2028 / FY2029 | FY2025 27.7%; H1 2026 26.7%; FY2026 guidance 36.9%, organic 31% | 10% / 4% / 0% | 20% / 15% / 12% | 30% / 24% / 18% |
Gross margin, FY2027 / FY2028 / FY2029 | FY2025 36.3%; H1 2026 37.7% | 36.5% / 35.5% / 35.0% | 38.5% / 38.5% / 38.5% | 39.0% / 39.5% / 40.0% |
Adjusted operating costs as % of revenue | FY2025 15.9%; H1 2026 15.9% | 14.0% / 14.5% / 15.0% | 14.0% / 13.5% / 13.0% | 13.5% / 13.0% / 12.5% |
Adjusted operating margin (gross margin less adjusted operating costs) | FY2025 20.4%; Q2 2026 22.6%; FY2026 guidance 23.3% to 24.3%; Q3 2026 guidance 24.0% to 25.0% | 22.5% / 21.0% / 20.0% | 24.5% / 25.0% / 25.5% | 25.5% / 26.5% / 27.5% |
FCF margin, FY2027 / FY2028 / FY2029 | FY2025 18.5%; H1 2026 26.7%; FY2026 company adjusted FCF guidance 17.9% | 13.0% / 12.0% / 12.0% | 17.0% / 17.0% / 17.5% | 19.0% / 20.0% / 21.0% |
Diluted share count change a year | H1 2026 0.6% year on year; FY2026 guidance 392.8m shares | 0.5% | 0.3% | 0.0% |
Exit multiple of FY2029 adjusted diluted EPS | 45.9x TTM adjusted EPS; 36.2x FY2026 guidance | 20x | 28x | 36x |
Adjusted tax rate, net interest expense a year | FY2026 guidance implies 19.1% and $72m | 20%, $72m | 20%, $72m | 20%, $72m |
Source: 8-K Exhibit 99.1 of 29 July 2026, 10-Q Q2 2026, 10-K FY2025, 8-K Exhibit 99.1 of 11 February 2026, SEC filings via SEC-API.io.
Table 9.3 Scenario outcomes by fiscal year
| Case | Fiscal year | Revenue | Adjusted operating profit | FCF | Adjusted diluted EPS | FCF per share | Implied share price | Price at exit multiple 4x lower to 4x higher |
|---|---|---|---|---|---|---|---|---|
Guidance based; FCF is company adjusted FCF guidance | FY2026E | $14.0bn | $3.33bn | $2.50bn | $6.70 | $6.36 | n/a | n/a |
Worst | FY2027 | $15.4bn | $3.47bn | $2.00bn | $6.88 | $5.07 | n/a | n/a |
Worst | FY2028 | $16.0bn | $3.36bn | $1.92bn | $6.64 | $4.84 | n/a | n/a |
Worst | FY2029 | $16.0bn | $3.20bn | $1.92bn | $6.28 | $4.82 | $126 | $101 to $151 |
Base | FY2027 | $16.8bn | $4.12bn | $2.86bn | $8.21 | $7.25 | n/a | n/a |
Base | FY2028 | $19.3bn | $4.83bn | $3.28bn | $9.63 | $8.31 | n/a | n/a |
Base | FY2029 | $21.6bn | $5.52bn | $3.79bn | $10.99 | $9.55 | $308 | $264 to $352 |
Best | FY2027 | $18.2bn | $4.64bn | $3.46bn | $9.30 | $8.80 | n/a | n/a |
Best | FY2028 | $22.6bn | $5.98bn | $4.51bn | $12.03 | $11.49 | n/a | n/a |
Best | FY2029 | $26.6bn | $7.32bn | $5.59bn | $14.77 | $14.24 | $532 | $473 to $591 |
Source: scenario arithmetic on the inputs in Table 9.2; FY2026E from 8-K Exhibit 99.1 of 29 July 2026, SEC filings via SEC-API.io.

Best case drivers and demand assumptions
Table 9.4 Critical factors behind the best case and the filed data point for each
| Factor | Filed data point | Best case assumption it bears on |
|---|---|---|
Backlog | $15.0bn at 31 December 2025, 1.07x FY2026 guided revenue (Table 1.6); the 10-K states that the majority is considered firm and is expected to ship within 12 to 18 months | FY2027 revenue of $18.2bn |
Organic orders | Q4 2025 book to bill about 2.9x, the latest figure filed (Table 3.4) | Growth of 30%, 24% and 18% assumes orders above sales in each year |
Customer advance payments | Current deferred revenue $3.63bn at 30 June 2026, up 100% in six months; H1 2026 adjusted FCF was 63% of the FY2026 guidance midpoint | FCF margins of 19% to 21% |
Guidance path | FY2026 revenue midpoint raised from $13.5bn to $13.75bn and $14.0bn (Table 3.2); implied H2 2026 growth 45.4% | Growth of 30% in FY2027 |
Operating margin | Adjusted operating margin 22.6% in Q2 2026; Americas segment 27.6%; implied H2 2026 margin 25.2% | Margin of 27.5% in FY2029, level with the Q2 2026 Americas segment margin before corporate costs |
Capacity | FY2026 capital expenditure guidance $550m to $570m, about 4.0% of revenue; release attributes Q2 2026 revenue timing to temporary supply chain congestion and project execution in several phases | Revenue growth above 20% in each year |
Regional mix | H1 2026 organic growth: Americas 31.0%, Asia Pacific 19.6%, EMEA (14.8)%; EMEA was 13.6% of H1 2026 revenue | Assumes EMEA returns to growth |
Acquisitions | UIG purchase price of about 13x expected 2027 EBITDA implies about $112m of 2027 EBITDA; net debt after the $1.45bn payment would be about $1.28bn on 30 June 2026 balances | Scenario revenue excludes UIG |
Share count | Repurchases in 2026: $0; Q2 2026 diluted shares 392.7m | Diluted count flat at 392.8m |
Source: 10-K FY2025, 10-Q Q2 2026, 8-K Exhibit 99.1 of 29 July 2026, 8-K Exhibit 99.1 of 11 February 2026, 8-K of 2 September 2026, SEC filings via SEC-API.io.
Sensitivity analysis of implied share price and EPS
Exit multiple moves the FY2029 base case most: 20x to 36x spans $220 to $396, against $227 to $380 for the worst and best growth paths. At base case EPS of $10.99 a 22.1x multiple returns $243, level with the 9 October 2026 close.


Sources and method
- Filings used: 10-K FY2025 and 10-K filings for FY2021 to FY2024; 10-Q Q2 2026 and 10-Q filings from Q1 2025; DEF 14A of 24 April 2026; 19 Forms 8-K from 14 October 2025 to 24 September 2026, including results of 29 July 2026, financing of 3 March 2026, the UtilityInnovation Group agreement of 2 September 2026 and voting results of 18 June 2026; Forms 3, 4 and 144, Schedule 13G and Form 13F filings; 10-K and 10-Q filings of seven peers and five data center operators.
- SEC filing data retrieved through SEC-API.io.
- Market data as of 9 October 2026.
- Earnings call material from public transcripts, in indirect speech with the call date.
- Sector estimates from named public research (Dell'Oro Group, IEA, Lawrence Berkeley National Laboratory) and company reports of Schneider Electric and Legrand, with dates in Tables 4.1 and 4.6.
- Scenario figures are arithmetic outcomes of stated assumptions.
Sources appendix
Every filing referenced in this analysis, sorted by form and then by date. Each accession number links to the filing on sec.gov. Count: 212 filings.
Table A.1 Vertiv Holdings Co filings, with ownership filings by holders and insiders
Table A.2 Filings of peers and other companies
| Company | Form | Period or filing date | Accession number |
|---|---|---|---|
| Alphabet | 10-K | 31 Dec 2025 | 0001652044-26-000018 |
| Alphabet | 10-Q | 30 Jun 2026 | 0001652044-26-000071 |
| Amazon | 10-K | 31 Dec 2025 | 0001018724-26-000004 |
| Amazon | 10-Q | 30 Jun 2026 | 0001018724-26-000026 |
| Carrier | 10-K | 31 Dec 2025 | 0001783180-26-000008 |
| Carrier | 10-Q | 30 Jun 2026 | 0001783180-26-000032 |
| Eaton | 10-K | 31 Dec 2025 | 0001551182-26-000007 |
| Eaton | 10-Q | 30 Jun 2026 | 0001551182-26-000030 |
| Hubbell | 10-K | 31 Dec 2025 | 0001628280-26-007500 |
| Hubbell | 10-Q | 30 Jun 2026 | 0001628280-26-050405 |
| Johnson Controls | 10-K | 30 Sep 2025 | 0000833444-25-000097 |
| Johnson Controls | 10-Q | 30 Jun 2026 | 0000833444-26-000087 |
| Meta | 10-K | 31 Dec 2025 | 0001628280-26-003942 |
| Meta | 10-Q | 30 Jun 2026 | 0001628280-26-050705 |
| Microsoft | 10-K | 30 Jun 2026 | 0001193125-26-323660 |
| Modine | 10-K | 31 Mar 2026 | 0001104659-26-066795 |
| Modine | 10-Q | 30 Jun 2026 | 0001104659-26-088569 |
| Oracle | 10-K | 31 May 2026 | 0001193125-26-277521 |
| Oracle | 10-Q | 31 Aug 2026 | 0001193125-26-389274 |
| Trane Technologies | 10-K | 31 Dec 2025 | 0001628280-26-005731 |
| Trane Technologies | 10-Q | 30 Jun 2026 | 0001628280-26-051117 |
| nVent | 10-K | 31 Dec 2025 | 0001628280-26-008608 |
| nVent | 10-Q | 30 Jun 2026 | 0001628280-26-051428 |
This report is for information only and is not financial advice.
Read next
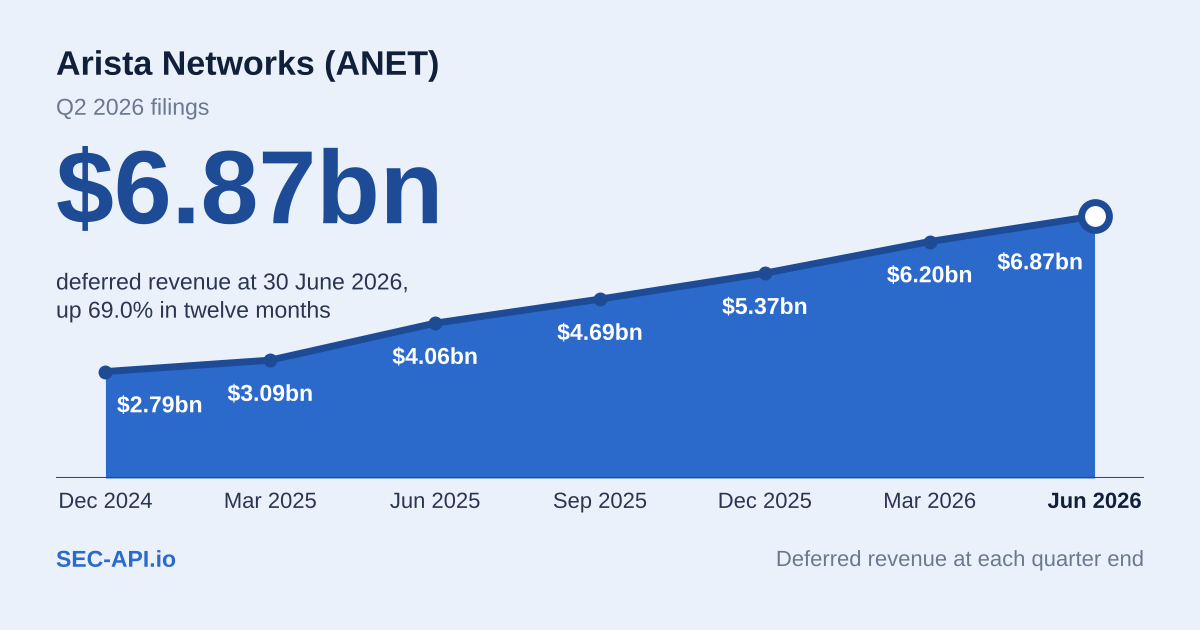
Arista Networks (ANET) stock analysis Q2 2026: AI networking revenue, deferred revenue, customer concentration, insider sales and scenarios to FY2029
October 12, 2026·71 min read
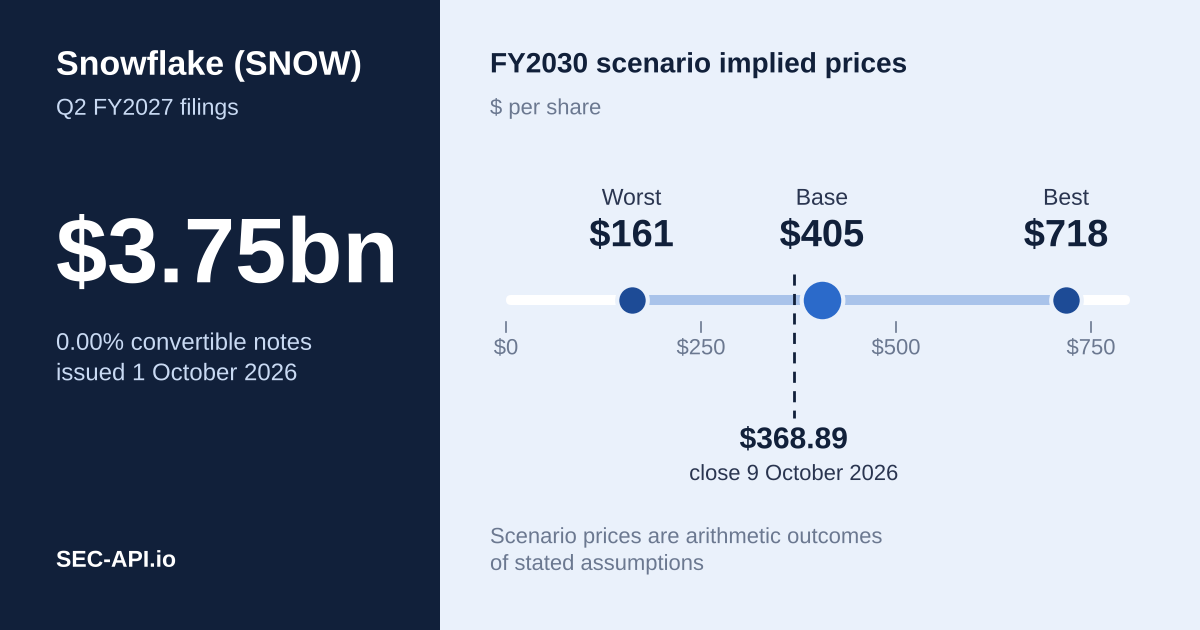
Snowflake (SNOW) stock after the $3.75bn convertible notes: Q2 FY2027 product revenue, RPO, insider sales and scenarios to FY2030
October 10, 2026·61 min read