Insights derived from analysing SEC filings. Independent analysis, not a publication of the SEC.
Figures are read from the Forms 10-K for FY2021 to FY2025, the Forms 10-Q for 2023 to 2026 including the Q2 2026 Form 10-Q/A, the Forms 8-K from Jul 2024 to Jul 2026 and their quarterly earnings exhibits 99.1, the 2026 proxy statement, Schedules 13D and 13G, Forms 13F and Forms 3, 4, 5 and 144 on the record for central index key 1664703, together with the comparable filings of eight peers. Accession numbers for every filing used appear in the Sources appendix. Market prices are the closing prices of 29 September 2026.
Revenue is doubling on AI data center demand. Q2 2026 revenue was $1.07bn, up 165.5%, the first
$1bn quarter. FY2026 guidance, first set at $3.1bn to 3.3bn in Feb, was raised in Apr and again in Jul to $3.9bn to 4.2bn, 100% above FY2025
at the midpoint. All major US hyperscalers and more than a dozen neoclouds have validated the technology (Q2 2026 release).
Margins turned positive in FY2024 and widened in 2026. Gross margin rose from 12.4% in FY2022 to
31.2% TTM; operating margin from (21.8%) to 11.2%.
Operating expenses fell from 34.1% of revenue to 20.0%. Service gross margin moved from (20.7%) in FY2023 to 15.2% TTM.
Customer concentration is high. Three customers made up 43%, 13% and 12% of FY2025 revenue; the 43% customer is a related party
through the Brookfield joint ventures. One customer accounted for about 73% of Q2 2026 revenue (10-Q/A).
The balance sheet was rebuilt with convertible debt. Cash was $2.67bn at 30 Jun 2026 against
$2.48bn of debt, almost all $2.5bn of 0% convertible notes due Nov 2030 (conversion price $194.97).
Shares outstanding rose 66% from end FY2021 to 30 Jun 2026, including about 42m shares issued in the Nov 2025 note exchange.
The valuation rests on forward earnings. At $291.25 the stock trades at
388x TTM GAAP EPS, 160x TTM non GAAP EPS and 108x the midpoint of 2026 non GAAP EPS guidance
($2.55 to 2.85). The share price is 3.4x its end 2025 close and 16%
below the 22 Jun 2026 high of $345.85.
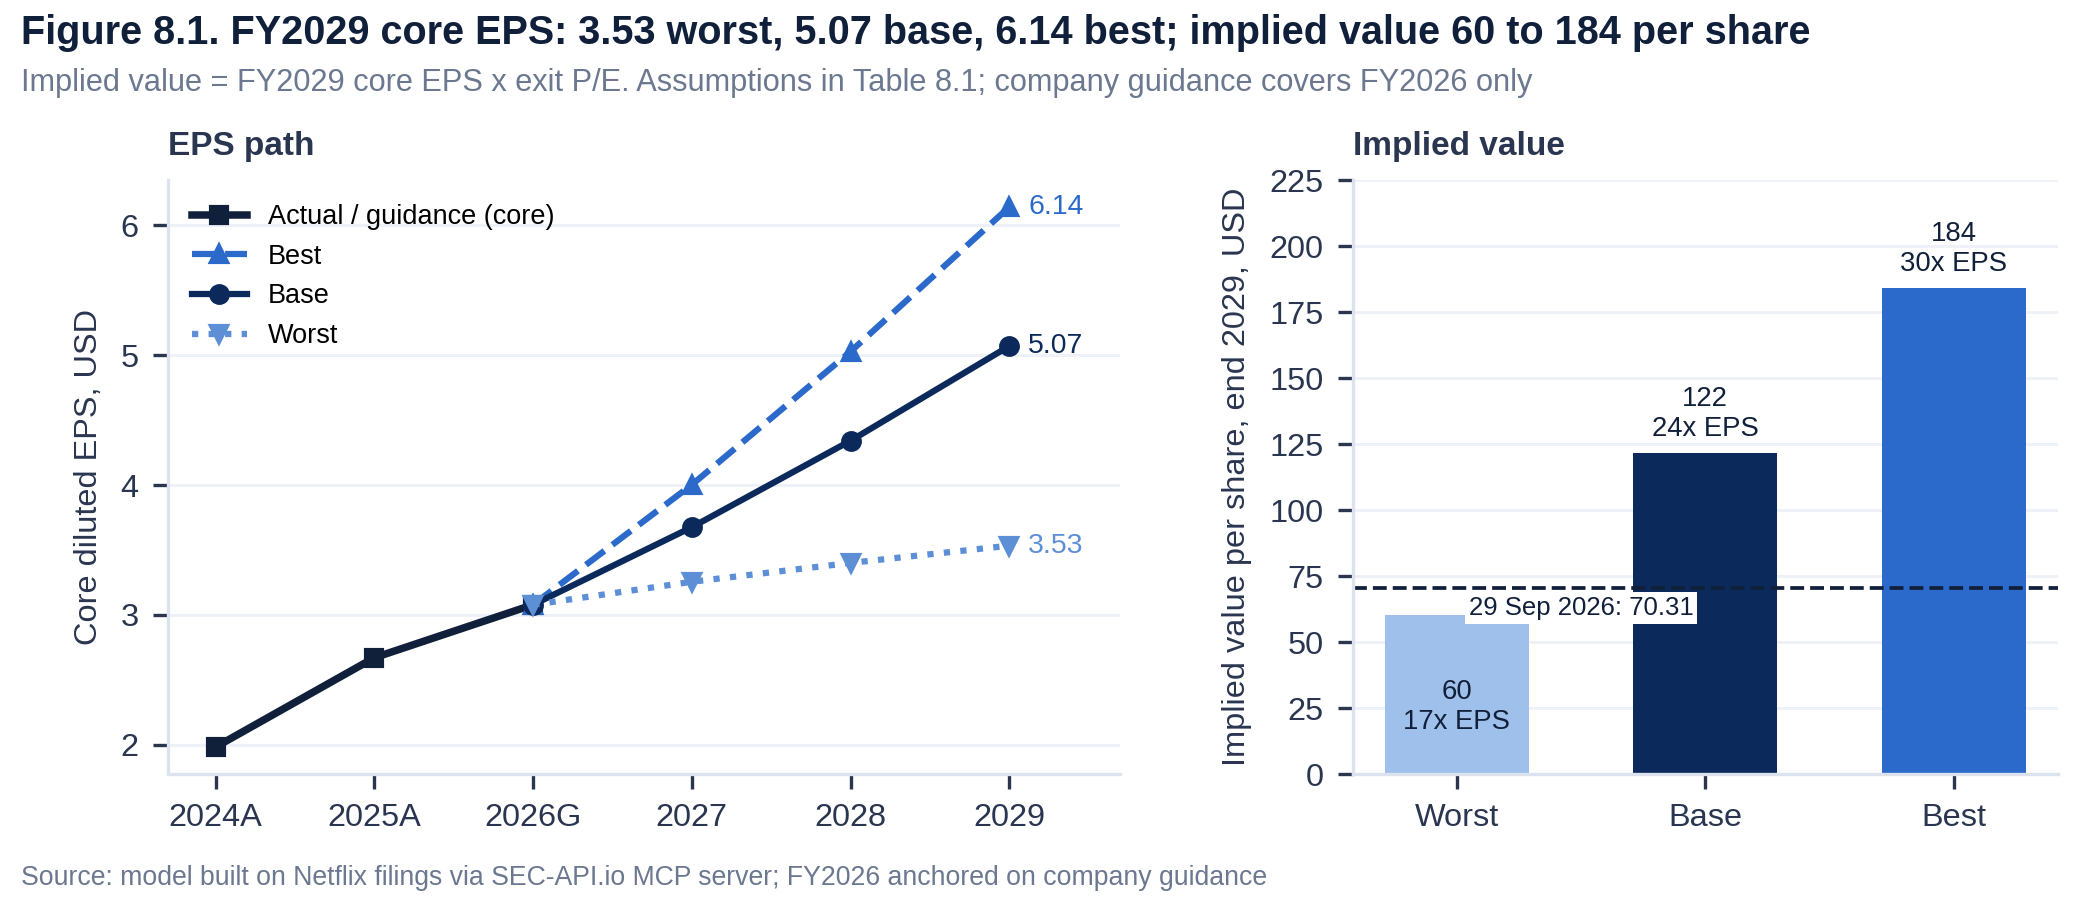
Scenario values for end 2029 are $23 (worst), 192 (base) and 527 (best) per share.
The current price equals 227x worst case, 53x base case and 28x best case FY2029 core EPS.
Exit multiple and revenue growth drive the widest range in the sensitivity analysis.
Views on these results differ. Arguments for a lower valuation cite customer concentration, related party revenue through the Brookfield
joint ventures, dilution from convertible notes and a short seller report of Jul 2026 that the company rebutted. Arguments for a higher valuation cite
time to power demand from AI data centers, grid interconnection queues of more than five years and a 30% federal tax credit for fuel cells through 2033.
This report presents filed data and model arithmetic; it is not financial advice.
Bloom Energy makes solid oxide fuel cell systems (Energy Servers) that generate electricity on site from natural gas, biogas or
hydrogen without combustion. Product sales were 84% of TTM revenue; installation, service contracts and electricity sales make up the rest.
Bloom reports one segment (FY2025 10-K, Item 1).
Markets. Data centers and AI infrastructure, semiconductor plants, utilities and commercial and industrial sites. About 1,100 sites in
9 countries; South Korea is the second largest market, with about 682 MW deployed through distribution partner SK ecoplant.
Key agreements. Brookfield: financing framework of up to $5bn over five years through its AI infrastructure fund (Aug 2025).
AEP: up to 1 GW, with an initial 100 MW order (Nov 2024). Oracle: supply agreements and a warrant for 3.5m shares at $113.28, exercised
without cash on 1 May 2026.
Capacity. Fremont manufacturing capacity is expanding from 1 GW to 2 GW by end 2026 (2026 proxy). About 2,214 full time employees at end 2025.
Backlog. The Q4 2025 release gave about $20bn of total backlog, about $6bn product and $14bn service. Q4 2025 is the latest backlog figure;
management said in Jul 2026 that backlog is growing faster than revenue. Remaining product and installation performance obligations in the 10-Q were
$442.4m at 30 Jun 2026.
Table 1.1. Revenue by type and gross margin
Type
FY2021
FY2022
FY2023
FY2024
FY2025
TTM
FY2025 y/y
TTM gross margin
Product
663.5m
880.7m
975.2m
1.09bn
1.53bn
2.61bn
41.1%
35.8%
Installation
96.1m
92.1m
92.8m
122.3m
204.1m
210.0m
66.8%
(5.9%)
Service
144.2m
151.0m
183.1m
213.5m
228.3m
251.2m
6.9%
15.2%
Electricity
68.4m
75.4m
82.4m
52.8m
60.4m
40.4m
14.2%
32.0%
Total revenue
972.2m
1.20bn
1.33bn
1.47bn
2.02bn
3.11bn
37.3%
31.2%
United States share of revenue
n/a
56%
70%
74%
81%
n/a
Bloom discloses the United States share of revenue in whole percentages only; the dollar split by country is undisclosed.
H1 2026 revenue rose 149.8% to $1.82bn and operating income reached $254.4m, against an operating loss of
$22.6m in H1 2025. TTM net income to common stockholders was $244.9m, the first positive trailing
year in the period covered. Free cash flow was $624.7m TTM.
Table 2.1. Income statement; TTM = Q3 2025 to Q2 2026
$
FY2021
FY2022
FY2023
FY2024
FY2025
TTM
Revenue
972.2m
1.20bn
1.33bn
1.47bn
2.02bn
3.11bn
Cost of revenue
(774.6)m
(1.05)bn
(1.14)bn
(1.07)bn
(1.44)bn
(2.14)bn
Gross profit
197.6m
148.3m
197.8m
404.6m
587.4m
972.7m
Research and development
(103.4)m
(150.6)m
(155.9)m
(148.6)m
(186.0)m
(220.3)m
Sales and marketing
(86.5)m
(90.9)m
(90.0)m
(68.0)m
(130.2)m
(165.4)m
General and administrative
(122.2)m
(167.7)m
(160.9)m
(165.1)m
(198.4)m
(237.2)m
Operating income
(114.5)m
(261.0)m
(208.9)m
22.9m
72.8m
349.8m
Interest income
0.3m
3.9m
19.9m
25.3m
34.1m
60.4m
Interest expense
(69.0)m
(53.5)m
(108.3)m
(62.6)m
(53.9)m
(42.5)m
Loss on debt exchange and conversion inducement
0.0m
(9.0)m
(4.3)m
(27.2)m
(98.6)m
(66.2)m
Equity in joint venture losses
0.0m
0.0m
0.0m
0.0m
(40.4)m
(53.1)m
Net income to common stockholders
(164.4)m
(301.7)m
(302.1)m
(29.2)m
(88.4)m
244.9m
Diluted EPS, $
(0.95)
(1.62)
(1.42)
(0.13)
(0.37)
0.75
Diluted shares, m
173.4
185.9
212.7
227.4
240.4
323.3
Values from $1bn are shown in bn. Net income is attributable to common stockholders, after noncontrolling interests. TTM diluted shares are Q2 2026. Q4 2025 EPS of $0.00 is from the Q4 2025 release; Q3 2025 EPS uses the filed statement value of (0.10), as the XBRL tag reads (100).
Table 2.2. What changed: FY2025 against FY2024 and H1 2026 against H1 2025
Full year
First half
$
FY2024
FY2025
Change
H1 2025
H1 2026
Change
Revenue
1.47bn
2.02bn
37.3%
727.3m
1.82bn
149.8%
Product revenue
1.09bn
1.53bn
41.1%
508.5m
1.59bn
212.5%
Gross profit
404.6m
587.4m
45.2%
195.8m
581.1m
196.7%
Research and development
148.6m
186.0m
25.1%
81.4m
115.7m
42.2%
Sales and marketing
68.0m
130.2m
91.5%
46.3m
81.5m
75.9%
General and administrative
165.1m
198.4m
20.2%
90.7m
129.5m
42.8%
Operating income
22.9m
72.8m
217.8%
(22.6)m
254.4m
n/a
Net income to common stockholders
(29.2)m
(88.4)m
n/a
(66.4)m
266.9m
n/a
Operating cash flow
92.0m
113.9m
23.9%
(323.8)m
300.0m
n/a
Free cash flow
33.1m
57.2m
72.5%
(345.3)m
222.2m
n/a
Stock based compensation
83.0m
145.0m
74.7%
62.4m
113.4m
81.8%
Gross margin
27.5%
29.0%
1.6 pts
26.9%
32.0%
5.1 pts
Operating margin
1.6%
3.6%
2.0 pts
(3.1%)
14.0%
17.1 pts
Change shows n/a where either value is negative.
Table 2.3. Core earnings reconciliation
$
FY2025
TTM
Operating income, GAAP
72.8m
349.8m
Less: tariff recovery in product cost (Q2 2026)
0.0m
(37.4)m
Operating income, core
72.8m
312.4m
Operating margin, core
3.6%
10.0%
Net income to common stockholders, GAAP
(88.4)m
244.9m
Add: conversion inducement expense (Q4 2025)
66.2m
66.2m
Add: loss on May 2025 debt exchange (Q2 2025)
32.3m
0.0m
Less: tariff recovery (Q2 2026)
0.0m
(37.4)m
Net income, core
10.1m
273.8m
Diluted EPS, GAAP / core, $
(0.37) / 0.04
0.75 / 0.84
Diluted EPS, company non GAAP, $
0.76
1.82
Core earnings keep stock based compensation as a cost. Company non GAAP EPS excludes stock based compensation and other items (Ex 99.1 of each quarter). Sources: FY2025 10-K; Q2 2026 10-Q MD&A.
Table 2.4. Ratio analysis, FY2021 to FY2025 and TTM
Ratio
FY2021
FY2022
FY2023
FY2024
FY2025
TTM
Growth
Revenue growth
n/a
23.3%
11.2%
10.5%
37.3%
91.0%
Share count change
n/a
16.6%
9.3%
2.0%
22.2%
25.5%
Profitability
Gross margin
20.3%
12.4%
14.8%
27.5%
29.0%
31.2%
Product gross margin
28.9%
30.0%
35.4%
36.8%
35.2%
35.8%
Service gross margin
(2.8%)
(11.6%)
(20.7%)
(0.7%)
10.0%
15.2%
Operating margin
(11.8%)
(21.8%)
(15.7%)
1.6%
3.6%
11.2%
Net margin
(16.9%)
(25.2%)
(22.7%)
(2.0%)
(4.4%)
7.9%
FCF margin
(11.4%)
(25.7%)
(34.2%)
2.2%
2.8%
20.1%
ROE
n/a
(88.5%)
(71.7%)
(5.5%)
(13.3%)
22.2%
ROA
(9.5%)
(16.4%)
(13.9%)
(1.2%)
(2.5%)
6.0%
ROIC (pre tax)
(23.7%)
(34.7%)
(15.5%)
1.4%
2.1%
8.6%
Cost structure
R&D / revenue
10.6%
12.6%
11.7%
10.1%
9.2%
7.1%
Sales and marketing / revenue
8.9%
7.6%
6.7%
4.6%
6.4%
5.3%
G&A / revenue
12.6%
14.0%
12.1%
11.2%
9.8%
7.6%
SBC / revenue
7.8%
9.5%
6.5%
5.6%
7.2%
6.3%
Working capital and liquidity
Days sales outstanding
33
76
93
83
67
54
Days inventory
68
93
162
186
163
129
Asset turnover
0.56x
0.65x
0.61x
0.58x
0.57x
0.76x
Current ratio
2.35x
1.95x
3.60x
3.21x
5.98x
4.09x
Leverage
Debt / equity
n/a
1.21x
1.69x
2.01x
3.41x
1.54x
Net debt / EBITDA
n/a
n/a
n/a
4.29x
1.33x
(0.47x)
Interest coverage
n/a
n/a
n/a
0.4x
1.4x
8.2x
Valuation
EV / sales at year end
4.1x
3.3x
2.6x
3.7x
12.1x
27.4x
P/E at year end
n/a
n/a
n/a
n/a
n/a
388x
Equity was negative at end FY2021, so ROE and debt to equity show n/a that year. Returns use average equity and assets. EBITDA = operating income plus depreciation. Leverage ratios shown only where EBITDA and operating income are positive. The TTM valuation column uses the 29 Sep 2026 close.
Table 2.5. Balance sheet, period end
$
FY2021
FY2022
FY2023
FY2024
FY2025
30 Jun 2026
Cash and equivalents
396.0m
348.5m
664.6m
802.9m
2.45bn
2.67bn
Accounts receivable
87.8m
251.0m
340.7m
335.8m
371.8m
458.1m
Inventories
143.4m
268.4m
502.5m
544.7m
643.3m
758.2m
Total assets
1.73bn
1.95bn
2.41bn
2.66bn
4.40bn
5.63bn
Total debt (recourse and non recourse)
526.7m
411.6m
846.6m
1.13bn
2.62bn
2.48bn
Financing obligations
476.6m
459.4m
444.8m
255.8m
243.8m
206.5m
Net debt (cash)
130.7m
63.1m
182.0m
325.9m
163.8m
(188.9)m
Stockholders' equity
(44.3)m
340.8m
502.1m
562.5m
768.6m
1.61bn
Shares outstanding, m
176.5
205.7
224.7
229.1
280.0
293.4
Financing obligations are sale and leaseback liabilities from past power purchase agreement structures; they are excluded from debt ratios.
Table 2.6. Convertible notes outstanding
Notes
Coupon
Maturity
Conversion price, $
31 Dec 2025
30 Jun 2026
0% notes due Nov 2030
0%
15 Nov 2030
194.97
2.50bn
2.50bn
Green notes due Jun 2029
3.0%
1 Jun 2029
20.84
75.1m
27.0m
Green notes due Jun 2028
3.0%
1 Jun 2028
18.85
99.7m
0.8m
A $600m secured revolving credit facility (Dec 2025) was undrawn at 30 Jun 2026. Green notes fell as holders converted: 6.7m shares were issued in H1 2026 and about 0.9m more were unsettled at 30 Jun 2026.
Bloom raised FY2026 revenue guidance in Apr and again in Jul; the midpoint moved from $3.2bn to $4.05bn. The Jul guidance implies
$2.23bn of H2 2026 revenue, 23% above H1 2026 revenue of $1.82bn. The non GAAP operating income guidance implies about $481m for H2, against $369m in H1.
Table 3.1. Company guidance and actuals
Item
FY2025 actual
FY2026 guide, Feb 2026
FY2026 guide, Apr 2026
FY2026 guide, Jul 2026
Revenue
$2.02bn (+37.3%)
$3.1bn to 3.3bn
$3.4bn to 3.8bn
$3.9bn to 4.2bn
Non GAAP gross margin
30.3%
about 32%
about 34%
about 34%
Non GAAP operating income
$221.0m
n/a
$600m to 750m
$800m to 900m
Non GAAP diluted EPS
$0.76
n/a
$1.85 to 2.25
$2.55 to 2.85
Sources: earnings releases, 8-K Ex 99.1 0001628280-26-005798, 0001628280-26-027913 and 0001628280-26-050150. The Feb 2026 non GAAP gross margin is as stated in the Q4 2025 release.
MD&A, FY2025 10-K. Product revenue rose $446.1m (+41.1%) on time to power demand. Product gross profit rose $139.1m, led by a
hyperscaler project run through the Brookfield joint venture, partly offset by $21.9m of electrolyzer inventory reserves. Operating cash flow was
$113.9m after a $119.2m inventory build.
MD&A, Q2 2026 10-Q. Revenue grew 166% while operating expenses grew about 48%. Product gross profit included a $37.4m recovery of
previously paid import tariffs. Revenue from the Brookfield joint ventures was $373.3m in Q1 2026 and $2.8m in Q2 2026.
Earnings call, 28 Jul 2026 (company investor materials, summarised from third party transcripts). CEO KR Sridhar said about 80% of orders
booked were repeat orders and that backlog grows faster than revenue. CFO Simon Edwards, appointed in Mar 2026, described
about $375m of operating cash flow as a baseline.
Short report. On 9 Jul 2026 Bloom filed an 8-K rebutting a Hunterbrook report on its accounting and scandium supply (8-K 0001628280-26-047734).
Tariffs. New import tariffs of 10% to 12.5% took effect in late Jul 2026. The FY2025 10-K lists tariffs as a risk to supply costs.
Bloom grew 150% in H1 2026, the fastest in the peer set; the next fastest were Vertiv at 26.7%
and Caterpillar at 23.2%. Its TTM gross margin of 31.2% is below Vertiv, Generac and Caterpillar and above GE Vernova and
Cummins. Fuel cell peers Plug Power and FuelCell Energy report negative gross margins.
Data center demand. Lawrence Berkeley National Laboratory estimated US data centers used 176 TWh in 2023, 4.4% of US electricity, and
projected 325 to 580 TWh by 2028, 6.7% to 12%. The EIA projects record US power consumption in 2026 and 2027.
Grid and turbine constraints. About 2,061 GW of projects waited in US interconnection queues at end 2025, with a median of more than five
years to commercial operation (LBNL). GE Vernova reports a 116 GW gas turbine backlog, with reservations for 2031 delivery.
Policy. Under the 2025 tax law, fuel cells qualify for a 30% Section 48E credit, including natural gas units for projects starting construction
after 2025. The credit steps down to 75% in 2034, 50% in 2035 and ends after that (Norton Rose Fulbright summary).
Valuation. Bloom's EV of $85.25bn equals 27.4x TTM revenue and 21.0x FY2026 guided revenue.
Trailing P/E: GE Vernova 26.9x, Vertiv 55.2x, Caterpillar 34.8x, Cummins 26.7x.
Table 4.1. Peer comparison, TTM to Jun 2026 (FuelCell Energy to Jul 2026); market data at 26 to 29 Sep 2026
Company
Revenue
Growth, H1 y/y
Gross margin
Operating margin
FCF margin
Market cap, $bn
P/E TTM
EV / EBITDA
Bloom Energy
3.11bn
149.8%
31.2%
11.2%
20.1%
85.4
388x
212.5x
Plug Power
744.1m
11.1%
(18.5%)
(172.8%)
(70.3%)
2.7
n/m
n/a
FuelCell Energy
154.1m
(3.9%)
(32.4%)
(116.3%)
(65.6%)
1.3
n/m
n/a
Ballard Power
106.2m
20.4%
16.4%
(67.5%)
(35.1%)
0.7
n/m
n/a
GE Vernova
41.37bn
19.2%
20.2%
4.4%
30.1%
256.3
27x
82.0x
Vertiv
11.48bn
26.7%
38.0%
18.9%
25.5%
95.6
55x
37.4x
Generac
4.44bn
11.5%
39.5%
9.5%
8.5%
12.5
48x
21.4x
Caterpillar
74.73bn
23.2%
34.3%
17.5%
14.3%
377.8
35x
26.9x
Cummins
34.71bn
6.2%
25.3%
11.2%
9.7%
72.5
27x
15.2x
Growth for FuelCell Energy is nine months. n/m: negative earnings. P/E and EV/EBITDA computed from filed TTM earnings, latest net debt and TTM operating income plus D&A; blank where EBITDA is negative.
Table 4.2. Power generation segments of diversified peers, FY2025
Company
Segment
Revenue
Profit
Margin
Measure
GE Vernova
Power segment
19.77bn
2.90bn
14.7%
Power Segment EBITDA
Caterpillar
Power and Energy segment
32.20bn
6.42bn
19.9%
Power & Energy segment profit
Cummins
Power Systems segment
7.46bn
1.69bn
22.7%
Power Systems segment EBITDA
Segment measures differ across companies. Caterpillar power generation sales were $10.3bn in FY2025 and $11.8bn TTM.
FY2025 results: revenue $2.02bn; backlog about $20bn
22 Dec 2025
1.01, 2.03
$600m secured revolving credit facility
4 Nov 2025
1.01, 2.03, 3.02, 8.01
$2.5bn 0% convertible notes due 2030; 2028 and 2029 notes exchanged
30 Oct 2025
8.01
Disclosure of revolving credit facility negotiations
29 Oct 2025
1.01, 3.02
Oracle warrant agreement
28 Oct 2025
2.02, 7.01
Q3 2025 results: revenue $519.0m (+57%)
6 Aug 2025
5.02, 7.01
Jim Hagemann Snabe joins the board
31 Jul 2025
2.02
Q2 2025 results (revenue $401.2m per later releases).
26 Form 8-K filings from Jul 2024 to Jul 2026; all are listed with accession numbers in the Sources appendix.
Table 5.2. FY2025 10-K items and Q2 2026 10-Q updates
Item
Content
Item 1, Business
One segment; about 1,100 sites in 9 countries; 2,214 employees. Three customers were 43% (related party), 13% and 12% of FY2025 revenue.
Item 1A, Risk factors
58 headings, up from 56. New: AI customer concentration and a possible AI slowdown, project execution, IT failure, data governance, geopolitics. Removed: reliance on a limited number of customers (concentration moved to Item 1 and the notes). Reworded: tariffs, supply agreements, dilution from convertible notes, sales by significant holders. The Q2 2026 10-Q adds a risk on short sellers.
Item 1C, Cybersecurity
Program guided by CIS 18, led by a CISO, overseen by the Audit Committee; incidents to date immaterial.
Item 3, Legal proceedings
Plansee patent arbitration over three patents; partial award issued 12 Feb 2026; related Texas suit stayed.
Item 5, Equity
387 holders of record; dividends and buybacks: zero. Five year total return of $302.98 per $100 against $169.62 for the NYSE Composite.
Item 7A, Market risk
All debt fixed rate or zero coupon. A 1 point fall in yields cuts interest income by $24.7m a year. FX exposure described as immaterial.
Item 9A, Controls
Controls effective at 31 Dec 2025; Deloitte & Touche audited internal control.
10-K 0001628280-26-006516; 10-Q 0001628280-26-050247 and 10-Q/A 0001628280-26-050325; risk factor comparison against 10-K 0001628280-25-008747.
Shareholders elected four directors and approved all four management proposals; all proposals on the ballot came from management. Say on pay support
rose from 62.1% in 2025 to 96.5% in 2026. About 81% of the
284.2m shares outstanding at the record date voted, against 83% in 2025.
Directors. Bloom elects directors on a for and withheld basis. Eddy Zervigon received the lowest support in 2026, at
76.8%.
Charter. The 2026 amendments limit officer liability and remove class B references; class B shares converted to class A in Jul 2023.
The 2025 version failed because it needed two thirds of all outstanding shares.
Pay. CEO KR Sridhar's total pay was $3.5m in 2025, $45.0m in 2024 and $1.7m in 2023. The 2024 figure includes $42.4m
of accounting value from cancelling and replacing 2021 performance shares; the last 300,000 replacement shares vested on 27 Feb 2026 after an AI data
center booking milestone. A new CEO performance award in Jun 2026 has a target of 319,082 shares, up to 300% (8-K/A 0001193125-26-277682).
CEO pay ratio 35.6 to 1 (DEF 14A 0001628280-26-024237).
Table 6.1. Proposals and support (for as % of for plus against)
Proposal
Board view
2026
2025
Outcome
Say on pay
For
96.5%
62.1%
Approved both years
Ratify Deloitte & Touche
For
99.9%
99.9%
Approved both years
Charter: officer exculpation
For
91.1%
90.1%
Approved 2026; failed 2025
Charter: remove class B references
For
99.9%
in item above
Approved 2026
Broker non votes: 42.2m in 2026 and 35.2m in 2025. Shares represented are derived from the auditor vote. Sources: 8-K 0001628280-26-038451 and 0001628280-25-026358.
Insiders sold $162.9m of stock and bought none in the twelve months to Sep 2026; $93.0m
ran under Rule 10b5-1 plans. SK ecoplant, a former 13D filer, sold below 5% in Aug 2025 and filed a Form 144 for $352.8m of shares in Oct 2025.
Vanguard and BlackRock are the largest 13F holders.
Table 6.3. Largest institutional holders from Form 13F, shares m
Holder
30 Jun 2026
% of shares
31 Mar 2026
31 Dec 2025
Change since Dec 2025
Vanguard
24.63
8.4%
24.63
20.85
18.1%
BlackRock, Inc.
18.44
6.3%
n/a
24.16
(23.7%)
Ameriprise Financial
18.13
6.2%
22.89
28.65
(36.7%)
Goldman Sachs Group
13.95
4.8%
9.12
2.03
588.5%
JPMorgan Chase & Co
8.09
2.8%
1.72
0.89
804.0%
Morgan Stanley
7.31
2.5%
7.64
9.35
(21.8%)
State Street Corp
6.32
2.2%
6.47
6.03
4.6%
Jane Street Group
4.17
1.4%
4.92
4.83
(13.7%)
D. E. Shaw & Co.
4.16
1.4%
4.21
8.80
(52.7%)
Geode Capital Management
3.79
1.3%
5.95
5.28
(28.1%)
Holders selected from about 30 large managers, a subset of the 1,331 filers holding BE; n/a: filing unretrieved. 13G: Ameriprise 6.4% and BlackRock 6.0% (Jun 2026); Jane Street 5.1% (Jul 2026).
Table 6.4. Insider sales, Oct 2025 to Sep 2026, $m (Form 4)
Insider
Role
Sales
Of which 10b5-1
Shawn Soderberg
Chief Legal Officer
48.4
38.7
KR Sridhar
Chairman & CEO
34.0
0.0
John Chambers
Director
23.2
23.2
Aman Joshi
Chief Commercial Officer
15.7
14.7
Mary Bush
Director
11.8
0.0
Satish Chitoori
Chief Operations Officer
10.2
9.2
Jeffrey Immelt
Director
7.2
7.2
Maciej Kurzymski
Chief Accounting Officer and Acting Principal Financial Officer
6.5
0.0
Jim Snabe
Director
2.9
0.0
Eddy Zervigon
Director
2.8
0.0
Gary Pinkus
Director
0.2
0.0
Total
162.9
93.0
71 filings: 70 Forms 4 and one Form 3; the 70 with transactions are listed in the Sources appendix. Open market purchases: zero. Sales include $26.1m sold to cover tax on vesting awards.
The EV to sales multiple rose from 3.7x at end 2024 to 27.4x on TTM revenue,
while revenue grew 111% over the same span. Market capitalization is $85.4bn.
On model assumptions anchored to FY2026 guidance, FY2029 core EPS reaches $1.28 (worst), $5.48 (base) and $10.55 (best), against $1.78 implied for FY2026 on a core basis.
Implied values per share at end 2029 are $23, 192 and 527.
FY2026 anchor: revenue $4.05bn (guidance midpoint); operating income $623m = non GAAP guide midpoint $850m less stock compensation of about $227m (15.4% margin). Net interest and other $20m a year; tax rate 10% on loss carryforwards; 325m diluted shares in 2026.
Demand. Base case growth of 45%, 30% and 22% assumes data center orders continue at a slowing rate after the 2026 doubling. The worst case
assumes 12% growth in 2027, 4% in 2028 and 0% in 2029 as AI capital spending slows or customers turn to turbines and the grid.
Margin. Core operating margin includes stock based compensation, which ran at 6.3% of TTM revenue. Base case margin
rises from 15.4% in 2026 to 22% in 2029; the worst case falls to 10% on price competition and tariff costs.
Per share. Diluted shares grow 1.0% to 2.0% a year from stock compensation; the 2030 notes convert above $194.97 and sit in the diluted count.
Excluded. New equity or convertible issuance, acquisitions, loss of the Section 48E credit and one off items.
In Figure 9.1, 4 of 25 combinations of exit P/E and FY2029 margin give a value at or above today's $291.25:
55x with 22%, 55x with 26%, 45x with 30%, 55x with 30%. In Table 9.1, 3 of 25 combinations of revenue CAGR and margin reach today's price at 35x.
Table 9.1. Value per share, end 2029, by revenue CAGR and FY2029 operating margin, 35x exit P/E
Margin \ CAGR
10%
20%
30%
40%
50%
14%
72
93
117
146
179
18%
92
119
150
187
230
22%
112
145
183
228
281
26%
132
171
216
270
331
30%
152
196
249
311
382
Shading: values at or above $291.25 in blue.
Customer concentration. With one customer at about 73% of Q2 2026 revenue, a delay in that customer's deliveries
would move about $0.78bn of quarterly revenue.
Rates and cash. All debt is fixed rate or zero coupon; a 1 point fall in yields reduces interest income by $24.7m a year (Item 7A).
Dilution. The 2030 notes are convertible into about 12.8m shares at $194.97; at today's price they sit in the money.
Data. Financial statements from XBRL in the 10-K for FY2021 to FY2025 and 10-Q filings for Q1 2023 to Q2 2026, retrieved through the SEC-API.io MCP
server. Q4 figures equal the full year less the nine month year to date; quarterly cash flows are derived from year to date statements.
Other sources. Earnings call of 28 Jul 2026 from third party transcript summaries. Peer data from peer 10-K, 10-Q, 40-F and 6-K filings.
Sector data: Lawrence Berkeley National Laboratory, EIA, Utility Dive, Norton Rose Fulbright. Market prices: 26 to 29 Sep 2026.
Definitions. FCF = operating cash flow less purchases of property, plant and equipment. Core earnings are GAAP excluding the items in Table 2.3.
EBITDA = operating income plus depreciation. Net debt = total debt less cash, with financing obligations excluded from debt.
Scenario model. EPS = (revenue x margin plus $20m) x (1 less 10%) over diluted shares. Implied value = FY2029 EPS x exit P/E,
undiscounted. Company guidance covers FY2026 only.
Table A.1. Annual, quarterly and proxy filings (central index key 1664703)
Form
Period or event
Accession number
10-K
FY2021
0001664703-22-000034
10-K
FY2022
0001628280-23-004301
10-K
FY2023
0001628280-24-005035
10-K
FY2024
0001628280-25-008747
10-K
FY2025
0001628280-26-006516
10-Q
Q1 2023
0001628280-23-016818
10-Q
Q2 2023
0001628280-23-027213
10-Q
Q3 2023
0001628280-23-037836
10-Q
Q1 2024
0001628280-24-022309
10-Q
Q2 2024
0001628280-24-036219
10-Q
Q3 2024
0001628280-24-046411
10-Q
Q1 2025
0001628280-25-021160
10-Q
Q2 2025
0001628280-25-037074
10-Q
Q3 2025
0001628280-25-046844
10-Q
Q1 2026
0001628280-26-028021
10-Q
Q2 2026
0001628280-26-050247
10-Q/A
Q2 2026
0001628280-26-050325
DEF 14A
2026 proxy statement
0001628280-26-024237
Table A.2. Forms 8-K
Form
Period or event
Accession number
8-K
28 Jul 2026, items 2.02, 7.01, 9.01
0001628280-26-050150
8-K
9 Jul 2026, items 7.01
0001628280-26-047734
8-K
22 Jun 2026, items 5.02
0001193125-26-277682
8-K
17 Jun 2026, items 5.02, 9.01
0001193125-26-274388
8-K
27 May 2026, items 5.03, 5.07, 9.01
0001628280-26-038451
8-K
28 Apr 2026, items 2.02, 7.01, 9.01
0001628280-26-027913
8-K
27 Apr 2026, items 8.01, 9.01
0001193125-26-179381
8-K
13 Apr 2026, items 1.01, 3.02, 9.01
0001628280-26-024896
8-K
26 Mar 2026, items 5.02, 7.01, 9.01
0001193125-26-126402
8-K
5 Feb 2026, items 2.02, 7.01, 9.01
0001628280-26-005798
8-K
22 Dec 2025, items 1.01, 2.03, 9.01
0001628280-25-058618
8-K
4 Nov 2025, items 1.01, 2.03, 3.02, 8.01, 9.01
0001628280-25-049016
8-K
30 Oct 2025, items 8.01
0001193125-25-257353
8-K
29 Oct 2025, items 1.01, 3.02
0001628280-25-047228
8-K
28 Oct 2025, items 2.02, 7.01, 9.01
0001628280-25-046745
8-K
6 Aug 2025, items 5.02, 7.01, 9.01
0001104659-25-074738
8-K
31 Jul 2025, items 2.02, 9.01
0001628280-25-036998
8-K
16 May 2025, items 5.07
0001628280-25-026358
8-K
13 May 2025, items 1.01, 2.03, 3.02, 8.01, 9.01
0001628280-25-025162
8-K
30 Apr 2025, items 2.02, 9.01
0001628280-25-021092
8-K
27 Feb 2025, items 2.02, 9.01
0001628280-25-008626
8-K
20 Dec 2024, items 5.02, 9.01
0001628280-24-052234
8-K
7 Nov 2024, items 2.02, 9.01
0001628280-24-046303
8-K
30 Aug 2024, items 5.02, 9.01
0001628280-24-038968
8-K
8 Aug 2024, items 2.02, 9.01
0001628280-24-036108
8-K
25 Jul 2024, items 5.02, 7.01, 9.01
0001628280-24-033001
Table A.3. Schedules 13D and 13G
Form
Period or event
Accession number
SC 13G/A
Ameriprise Financial, Inc., 2026-08-14
0001193125-26-350807
SC 13G
JANE STREET GROUP, LLC, 2026-08-04
0001595888-26-000077
SC 13G/A
BlackRock, Inc., 2026-07-27
0002012383-26-002272
SC 13G/A
Ameriprise Financial, Inc., 2026-05-15
0001193125-26-225701
SC 13G/A
Morgan Stanley, 2026-05-11
0000895421-26-000127
SC 13G/A
BlackRock, Inc., 2026-04-24
0002012383-26-001481
SC 13G/A
The Vanguard Group, 2026-03-26
0000102909-26-000882
SC 13G/A
D. E. Shaw & Co., L.P., 2026-02-17
0001104659-26-016377
SC 13G/A
Kuwait Investment Authority, acting for and on behalf of the Government of the State of Kuwait, 2026-01-21
0001104659-26-005317
SC 13G/A
BlackRock, Inc., 2026-01-21
0002012383-26-000742
SC 13G/A
D. E. Shaw & Co., L.P., 2025-11-14
0001104659-25-112483
SC 13G/A
Ameriprise Financial, Inc., 2025-10-07
0001193125-25-232760
SC 13G
D. E. Shaw & Co., L.P., 2025-10-01
0001104659-25-095622
SC 13D/A
SK ecoplant Co., Ltd., 2025-08-20
0001104659-25-081024
SC 13D/A
SK ecoplant Co., Ltd., 2025-08-18
0001104659-25-079928
SC 13G/A
Ameriprise Financial, Inc., 2025-08-14
0000950170-25-108559
SC 13G
Morgan Stanley, 2025-08-07
0000895421-25-000493
SC 13G/A
BlackRock, Inc., 2025-07-16
0002052113-25-002533
SC 13D/A
SK ecoplant Co., Ltd., 2025-07-14
0001829655-25-000013
SC 13G/A
Ameriprise Financial, Inc., 2024-11-14
0001193125-24-258255
SC 13G/A
BlackRock, Inc., 2024-11-08
0002012383-24-004020
SC 13G/A
BlackRock, Inc., 2024-10-22
0002012383-24-001653
Table A.4. Forms 13F
Form
Period or event
Accession number
13F-HR
Vanguard Capital Management Llc, period 2026-06-30
0002100119-26-001527
13F-HR
Vanguard Portfolio Management Llc, period 2026-06-30
0002100121-26-001018
13F-HR/A
Vanguard Capital Management Llc, period 2026-03-31
0002100119-26-001311
13F-HR
Vanguard Portfolio Management Llc, period 2026-03-31
0002100121-26-000861
13F-HR
Vanguard Group Inc, period 2025-12-31
0000102909-26-000031
13F-HR
Vanguard Group Inc, period 2025-09-30
0000102909-25-000353
13F-HR
Blackrock, Inc., period 2026-06-30
0002012383-26-003238
13F-HR
Blackrock, Inc., period 2025-12-31
0002012383-26-000920
13F-HR
Blackrock, Inc., period 2025-09-30
0002012383-25-002949
13F-HR
Ameriprise Financial Inc, period 2026-06-30
0001193125-26-351426
13F-HR/A
Ameriprise Financial Inc, period 2026-03-31
0001193125-26-307051
13F-HR
Ameriprise Financial Inc, period 2025-12-31
0001193125-26-053888
13F-HR
Ameriprise Financial Inc, period 2025-09-30
0001193125-25-282109
13F-HR
Goldman Sachs Group Inc, period 2026-06-30
0000886982-26-000519
13F-HR
Goldman Sachs Group Inc, period 2026-03-31
0000886982-26-000274
13F-HR/A
Goldman Sachs Group Inc, period 2025-12-31
0000886982-26-000093
13F-HR
Goldman Sachs Group Inc, period 2025-09-30
0000886982-25-001521
13F-HR
Jpmorgan Chase & Co, period 2026-06-30
0000019617-26-000325
13F-HR/A
Jpmorgan Chase & Co, period 2026-03-31
0000019617-26-000225
13F-HR
Jpmorgan Chase & Co, period 2025-12-31
0000019617-26-000083
13F-HR/A
Jpmorgan Chase & Co, period 2025-09-30
0000019617-25-001093
13F-HR
Morgan Stanley, period 2026-06-30
0000895421-26-000243
13F-HR
Morgan Stanley, period 2026-03-31
0000895421-26-000183
13F-HR/A
Morgan Stanley, period 2025-12-31
0000895421-26-000187
13F-HR/A
Morgan Stanley, period 2025-09-30
0000895421-26-000186
13F-HR/A
State Street Corp, period 2026-06-30
0000093751-26-000583
13F-HR
State Street Corp, period 2026-03-31
0000093751-26-000315
13F-HR
State Street Corp, period 2025-12-31
0000093751-26-000100
13F-HR
State Street Corp, period 2025-09-30
0000093751-25-000651
13F-HR
Jane Street Group, Llc, period 2026-06-30
0001595888-26-000108
13F-HR
Jane Street Group, Llc, period 2026-03-31
0001595888-26-000043
13F-HR
Jane Street Group, Llc, period 2025-12-31
0001595888-26-000023
13F-HR
Jane Street Group, Llc, period 2025-09-30
0001595888-25-000155
13F-HR
D. E. Shaw & Co., Inc., period 2026-06-30
0001104659-26-097217
13F-HR
D. E. Shaw & Co., Inc., period 2026-03-31
0001104659-26-062472
13F-HR
D. E. Shaw & Co., Inc., period 2025-12-31
0001104659-26-016332
13F-HR
D. E. Shaw & Co., Inc., period 2025-09-30
0001104659-25-112505
13F-HR
Geode Capital Management, Llc, period 2026-06-30
0001214717-26-000008
13F-HR
Geode Capital Management, Llc, period 2026-03-31
0001214717-26-000006
13F-HR
Geode Capital Management, Llc, period 2025-12-31
0001214717-26-000003
13F-HR
Geode Capital Management, Llc, period 2025-09-30
0001214717-25-000016
Forms 3 and 4, Oct 2025 to Sep 2026 (70 accession numbers with reported transactions):0001193125-25-267621, 0001193125-25-272814, 0001193125-25-272817, 0001193125-25-272821, 0001193125-25-272822, 0001193125-25-286432, 0001193125-25-286435, 0001193125-25-286442, 0001193125-25-303900, 0001193125-25-324944, 0001193125-25-324959, 0001193125-26-002753, 0001193125-26-002757, 0001193125-26-002762, 0001193125-26-059988, 0001193125-26-059994, 0001193125-26-059995, 0001193125-26-064646, 0001193125-26-078243, 0001193125-26-083638, 0001193125-26-083654, 0001193125-26-083660, 0001193125-26-083734, 0001193125-26-089345, 0001193125-26-111631, 0001193125-26-111635, 0001193125-26-111636, 0001193125-26-111640, 0001193125-26-118021, 0001193125-26-140918, 0001193125-26-159594, 0001193125-26-159598, 0001193125-26-201723, 0001193125-26-215142, 0001193125-26-224675, 0001193125-26-229256, 0001193125-26-229257, 0001193125-26-229262, 0001193125-26-229282, 0001193125-26-235229, 0001193125-26-237022, 0001193125-26-240059, 0001193125-26-240067, 0001193125-26-240069, 0001193125-26-240071, 0001193125-26-240073, 0001193125-26-240080, 0001193125-26-240081, 0001193125-26-240083, 0001193125-26-240086, 0001193125-26-256157, 0001193125-26-274656, 0001193125-26-274662, 0001193125-26-274669, 0001193125-26-274678, 0001193125-26-295065, 0001193125-26-295069, 0001193125-26-295081, 0001193125-26-333129, 0001193125-26-352899, 0001193125-26-355893, 0001193125-26-355894, 0001193125-26-355897, 0001193125-26-355898, 0001193125-26-377301, 0001193125-26-382495, 0001193125-26-395779, 0001193125-26-395790, 0001193125-26-395797, 0001193125-26-395806. All are on EDGAR under central index key 1664703.
Table A.5. Peer filings used
Company
Filing
Accession number
Plug Power
FY2025 10-K
0001104659-26-022286
Plug Power
FY2024 10-K
0001558370-25-002049
Plug Power
FY2024 10-K/A
0001104659-25-042552
Plug Power
FY2023 10-K
0001558370-24-002178
Plug Power
Q2 2026 10-Q
0001104659-26-093454
FuelCell Energy
FY2025 10-K
0001104659-25-122302
FuelCell Energy
FY2024 10-K
0001558370-24-016497
FuelCell Energy
FY2023 10-K
0001558370-23-019892
FuelCell Energy
Q3 FY2026 10-Q
0001104659-26-104501
Ballard Power
FY2025 40-F
0001628280-26-017045
Ballard Power
FY2024 40-F
0001453015-25-000003
Ballard Power
Q2 2026 6-K
0001628280-26-051245
Ballard Power
Q2 2025 6-K
0001453015-25-000020
GE Vernova
FY2025 10-K
0001996810-26-000015
GE Vernova
FY2024 10-K
0001996810-25-000011
GE Vernova
Q2 2026 10-Q
0001996810-26-000148
Vertiv
FY2025 10-K
0001674101-26-000008
Vertiv
FY2024 10-K
0001628280-25-005905
Vertiv
FY2023 10-K
0001628280-24-006498
Vertiv
Q2 2026 10-Q
0001628280-26-050609
Generac
FY2025 10-K
0001437749-26-004568
Generac
FY2024 10-K
0001437749-25-004353
Generac
FY2023 10-K
0001437749-24-005040
Generac
Q2 2026 10-Q
0001437749-26-025669
Caterpillar
FY2025 10-K
0000018230-26-000008
Caterpillar
FY2024 10-K
0000018230-25-000008
Caterpillar
FY2023 10-K
0000018230-24-000009
Caterpillar
Q2 2026 10-Q
0000018230-26-000046
Cummins
FY2025 10-K
0000026172-26-000009
Cummins
FY2024 10-K
0000026172-25-000007
Cummins
FY2023 10-K
0000026172-24-000012
Cummins
Q2 2026 10-Q
0000026172-26-000029
Disclaimer: for information only, not financial advice. This report is not a recommendation to buy, sell or hold any
security. Figures come from SEC filings retrieved through the SEC-API.io MCP server and from the sources named above. Scenario values are arithmetic
results of stated assumptions. Consult a licensed adviser before investing.