Meta Platforms, Inc. (META), Financial Analysis
Insights derived from analysing SEC filings. Independent analysis, not a publication of the SEC.
Figures are read from the Forms 10-K for FY2021 to FY2025, the Forms 10-Q for Q1 2025 to Q3 2026, the Forms 8-K with all their exhibits, incl. the earnings releases with CFO outlook commentary (Ex 99.1), the Founder Alignment Agreement (Ex 10.1), notes underwriting agreements and indentures (Ex 1.1, 4.1, 5.1) and the derivative settlement notices (Ex 99.1, 99.2), the proxy statement of 2026 and the Form 8-K Item 5.07 vote results, Schedules 13G and Forms 3, 4 and 144 on the record for central index key 1326801, together with the comparable filings of six peers. Accession numbers for every filing used appear in the Sources appendix. Market prices are closing prices of 23 October 2026.
- Q3 2026 revenue $64.6bn, +26%; ad impressions +10%, average price per ad +14%; Q4 2026 guidance $73bn to $76bn, +22% to +27%.
- Q3 2026 operating income $13.0bn, (37%), after a $9.9bn charge for the August 2026 agreement with 52 state attorneys general; before the charge $22.9bn, +11%, 35.4% margin.
- Capex reached $34.9bn in Q3 2026 and Q3 free cash flow ($2.1bn); FY2026 capex guidance $135bn to $145bn against $72.2bn in FY2025.
- Off balance sheet commitments rose to $454.5bn from $131.1bn at FY2025; leases not yet commenced $355.7bn. Debt $83.7bn against cash and securities $82.4bn.
- New non voting Class C stock distributed one for one from 19 Jan 2027; Meta expects to use Class C for equity offerings. Mark Zuckerberg holds 60.8% of voting power.
- Shares at $640.10 trade at 21.8x TTM EPS, 17.9% below the 52 week high. Base case (17% revenue CAGR, 36% margin, 22x P/E) implies $996 in three years; best case $1,734, worst case $382.
1 Revenue & Business Model
- Two segments. Family of Apps (Facebook, Instagram, Messenger, WhatsApp) earned 98.9% of FY2025 revenue and $102.5bn operating income; Reality Labs (VR and AR hardware, software, content) had $2.2bn revenue and a $19.2bn operating loss.
- Advertising is 97.6% of FY2025 revenue ($196.2bn). Family of Apps other revenue, mainly WhatsApp paid messaging and subscriptions, reached $1.1bn in Q3 2026, +59%.
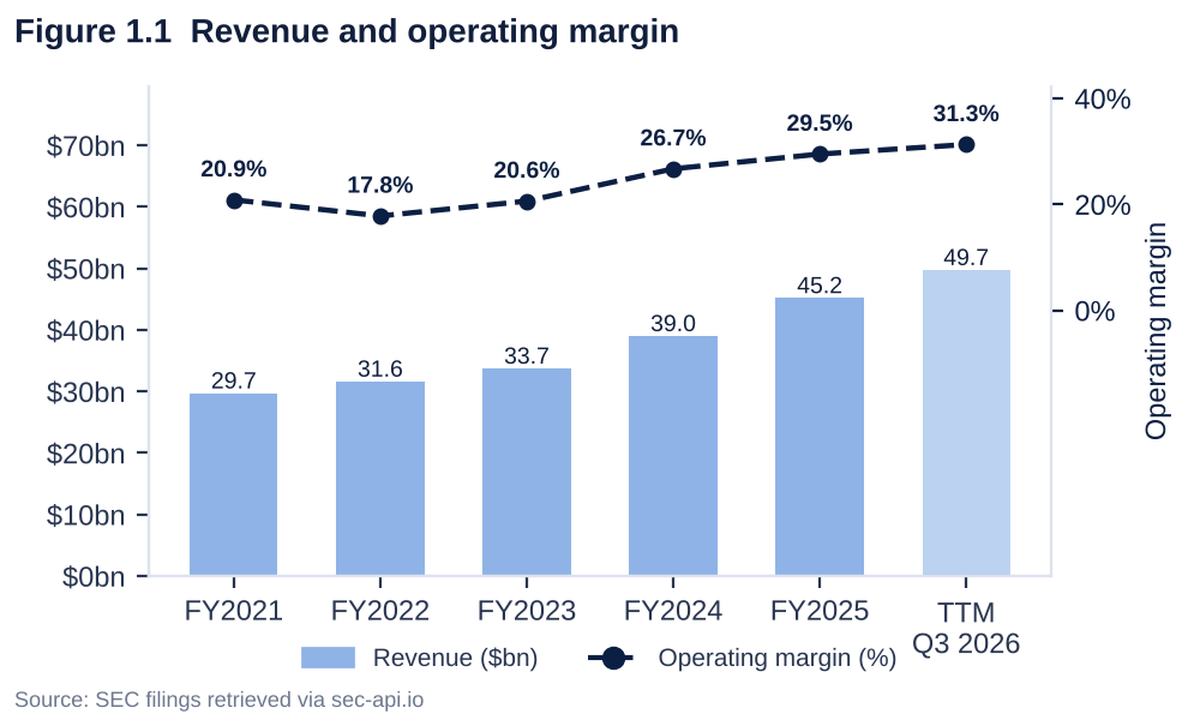
- Revenue FY2021 $117.9bn to FY2025 $201.0bn, a 14.3% CAGR; TTM Q3 2026 $241.6bn. FY2022 revenue fell 1.1%.
- Reality Labs losses total $76.9bn over FY2021 to FY2025; guidance $18bn to $19bn for FY2026 and about $15bn for FY2027.
- Users: 3.64bn family daily active people in September 2026, +3% year on year. Q3 2026 revenue per person $17.72, +23%.
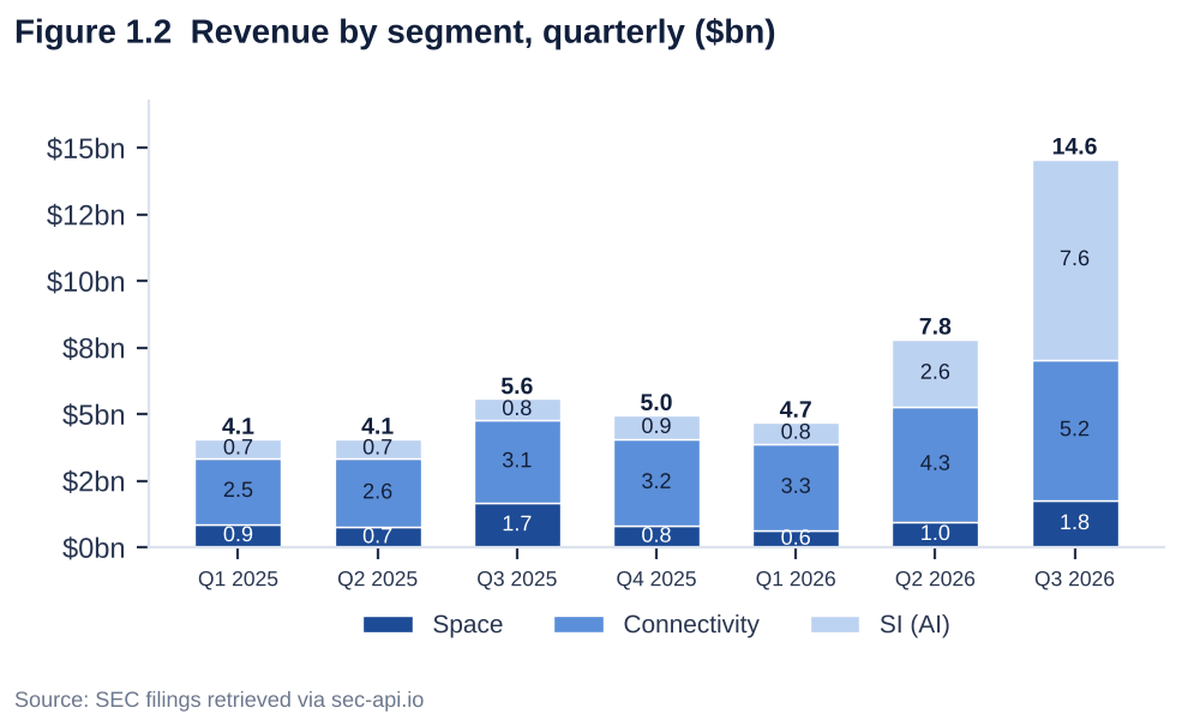
- Regions Q3 2026: US and Canada $26.2bn (40.6%), Asia Pacific $17.0bn (26.3%), Europe $14.0bn (21.7%), rest of world $7.4bn (11.4%).
- Headcount 66,775 at 30 Sep 2026, (15%) year on year, after a reduction of about 8,000 employees in May 2026.


| Segment | FY2021 | FY2022 | FY2023 | FY2024 | FY2025 |
|---|---|---|---|---|---|
| Family of Apps revenue ($bn) | 115.7 | 114.5 | 133.0 | 162.4 | 198.8 |
| Family of Apps operating income ($bn) | 56.9 | 42.7 | 62.9 | 87.1 | 102.5 |
| Reality Labs revenue ($bn) | 2.3 | 2.2 | 1.9 | 2.1 | 2.2 |
| Reality Labs operating income ($bn) | (10.2) | (13.7) | (16.1) | (17.7) | (19.2) |
| Segment | Q4 2025 | Q1 2026 | Q2 2026 | Q3 2026 |
|---|---|---|---|---|
| Family of Apps revenue ($bn) | 58.94 | 55.91 | 60.37 | 64.16 |
| Family of Apps operating income ($bn) | 30.77 | 26.90 | 23.39 | 17.12 |
| Reality Labs revenue ($bn) | 0.95 | 0.40 | 0.43 | 0.44 |
| Reality Labs operating income ($bn) | (6.02) | (4.03) | (4.62) | (4.13) |
| Metric | Q3 2025 | Q4 2025 | Q1 2026 | Q2 2026 | Q3 2026 |
|---|---|---|---|---|---|
| Family daily active people (bn) | 3.54 | 3.58 | 3.56 | 3.60 | 3.64 |
| Ad impressions growth (%) | 14 | 18 | 19 | 14 | 10 |
| Average price per ad growth (%) | 10 | 6 | 12 | 12 | 14 |
| Headcount (thousands) | 78.5 | 78.9 | 78.0 | 75.5 | 66.8 |
2 Financial Analysis & Ratios
- Operating margin 41.4% in FY2025, 32.9% TTM; TTM includes the $9.9bn legal charge (4.1 points) and higher depreciation: D&A $24.9bn TTM against $18.6bn in FY2025.
- Net income TTM $75.2bn includes an $8.0bn Q1 2026 tax benefit; Q3 2025 included a $15.9bn one time tax charge. Effective tax rate 30% in FY2025, 13% before that charge.
- Capex (incl. finance lease principal) $108.0bn TTM against $39.2bn in FY2024; capex reached 44.7% of TTM revenue. Free cash flow fell from $52.1bn in FY2024 to $25.1bn TTM.
- Balance sheet: debt rose from zero at FY2021 to $83.7bn at 30 Sep 2026 after $30bn notes in November 2025 and $25bn in May 2026; cash and securities $82.4bn; $10.8bn of money market funds moved to restricted cash as escrow for infrastructure agreements.
- Capital returns: no buybacks in 9M 2026 against $26.2bn in FY2025; dividends $4.1bn in 9M 2026; $25.0bn buyback authorization remains.
- Expenses Q3 2026 $51.6bn, +68%; R&D $20.1bn, +32%.
| Line item | FY2021 | FY2022 | FY2023 | FY2024 | FY2025 | TTM Q3 2026 |
|---|---|---|---|---|---|---|
| Revenue | 117.9 | 116.6 | 134.9 | 164.5 | 201.0 | 241.6 |
| Gross profit | 95.3 | 91.4 | 108.9 | 134.3 | 164.8 | 195.8 |
| Research and development | 24.7 | 35.3 | 38.5 | 43.9 | 57.4 | 76.5 |
| Selling, general and administrative | 23.9 | 27.1 | 23.7 | 21.1 | 24.1 | 39.9 |
| Operating income | 46.8 | 28.9 | 46.8 | 69.4 | 83.3 | 79.4 |
| Net income | 39.4 | 23.2 | 39.1 | 62.4 | 60.5 | 75.2 |
| Diluted EPS ($) | 13.77 | 8.59 | 14.87 | 23.86 | 23.49 | 29.33 |
| Operating cash flow | 57.7 | 50.5 | 71.1 | 91.3 | 115.8 | 133.1 |
| Capital expenditure | (19.4) | (32.3) | (28.1) | (39.2) | (72.2) | (108.0) |
| Free cash flow | 38.3 | 18.2 | 43.0 | 52.1 | 43.6 | 25.1 |
| Stock based compensation | 9.2 | 12.0 | 14.0 | 16.7 | 20.4 | 26.9 |
| Cash and investments | 48.0 | 40.7 | 65.4 | 77.8 | 81.6 | 82.4 |
| Total debt | 0.0 | 9.9 | 18.4 | 28.8 | 58.7 | 83.7 |
| Total equity | 124.9 | 125.7 | 153.2 | 182.6 | 217.2 | 272.4 |

| Metric | Q3 2025 | Q3 2026 | Change |
|---|---|---|---|
| Revenue ($bn) | 51.24 | 64.60 | 26.1% |
| Gross profit ($bn) | 42.04 | 51.23 | 21.9% |
| Operating income ($bn) | 20.54 | 12.99 | (36.8%) |
| Net income ($bn) | 2.71 | 9.86 | 264.0% |
| Diluted EPS ($) | 1.05 | 3.83 | 264.8% |
| Operating cash flow ($bn) | 30.00 | 32.78 | 9.3% |
| Free cash flow ($bn) | 10.62 | (2.12) | (120.0%) |
| Operating margin (%) | 40.1 | 20.1 | (20.0 pts) |
| Net margin (%) | 5.3 | 15.3 | 10.0 pts |
| Ratio | FY2021 | FY2022 | FY2023 | FY2024 | FY2025 | TTM Q3 2026 |
|---|---|---|---|---|---|---|
| Growth and margins | ||||||
| Revenue growth (%) | n/a | (1.1) | 15.7 | 21.9 | 22.2 | n/a |
| Gross margin (%) | 80.8 | 78.3 | 80.8 | 81.7 | 82.0 | 81.0 |
| Operating margin (%) | 39.6 | 24.8 | 34.7 | 42.2 | 41.4 | 32.9 |
| Net margin (%) | 33.4 | 19.9 | 29.0 | 37.9 | 30.1 | 31.1 |
| FCF margin (%) | 32.5 | 15.6 | 31.9 | 31.7 | 21.7 | 10.4 |
| Cost and investment intensity | ||||||
| R&D (%) revenue | 20.9 | 30.3 | 28.5 | 26.7 | 28.5 | 31.7 |
| SBC (%) revenue | 7.8 | 10.3 | 10.4 | 10.1 | 10.2 | 11.2 |
| Capex (%) revenue | 16.4 | 27.7 | 20.8 | 23.8 | 35.9 | 44.7 |
| Effective tax rate (%) | 16.7 | 19.5 | 17.6 | 11.8 | 29.6 | 4.6 |
| Returns | ||||||
| ROE (%) | 31.5 | 18.5 | 28.0 | 37.1 | 30.2 | 27.6 |
| ROA (%) | 23.7 | 13.2 | 18.8 | 24.7 | 18.8 | 15.7 |
| ROIC (%) | 50.6 | 24.6 | 36.3 | 45.8 | 30.1 | 27.7 |
| Asset turnover (x) | 0.71 | 0.63 | 0.59 | 0.60 | 0.55 | 0.50 |
| Liquidity and leverage | ||||||
| Current ratio (x) | 3.15 | 2.20 | 2.67 | 2.98 | 2.60 | 1.90 |
| Debt to equity (x) | 0.00 | 0.08 | 0.12 | 0.16 | 0.27 | 0.31 |
| Net cash ($bn) | 48.0 | 30.8 | 47.0 | 49.0 | 22.8 | (1.2) |
| Efficiency and cash quality | ||||||
| Days sales outstanding | 43 | 42 | 44 | 38 | 36 | 34 |
| FCF to net income (x) | 0.97 | 0.78 | 1.10 | 0.84 | 0.72 | 0.33 |
| Shareholder returns (%) FCF | 116 | 154 | 46 | 68 | 72 | 21 |


| Measure | Value |
|---|---|
| Market cap ($bn) | 1,636.3 |
| Enterprise value ($bn) | 1,637.5 |
| P/E (TTM) (x) | 21.8 |
| EV/Sales (TTM) (x) | 6.8 |
| EV/EBITDA (TTM) (x) | 15.7 |
| FCF yield (%) | 1.5 |
| Price/Book (x) | 6.0 |
3 MD&A & Management Commentary
Latest earnings call and results release
- Q3 2026 (21 Oct 2026): revenue $64.6bn, +26% reported and constant currency; diluted EPS $3.83, or $7.40 before the legal charge; tax rate 24% because the charge is not deductible.
- Advertising: Partnership Ads passed a $15bn annual run rate, +97%; the GEM ranking model lifted app ad conversions 9.6%.
- AI products: over 10m people in the US and Canada set up Muse personal agents in about six weeks, about 25% of them use it on a given day; Meta Business Agent served over 1m businesses in June 2026, with per token charging from 1 Aug 2026.
- Compute: management said Meta is supply constrained on compute and uses third party cloud capacity to add 2026 and 2027 capacity.
- 2027: no capex or expense figures; guidance comes with Q4 2026 results. Management expects revenue growth to continue through 2027 and Reality Labs losses to narrow to about $15bn.
- Financing: operating cash flow is the primary source, with investment grade debt and data center ventures (Hyperion with Blue Owl funds, El Paso with BlackRock funds); equity options are under review for 2027, and the Class C stock is the stated vehicle.
- Q2 2026 call (29 Jul 2026): revenue $60.8bn, +28%; operating income $18.8bn, (8%), after $2.4bn legal charges and $1.2bn severance; tax rate guidance for the rest of 2026 raised to 15% to 17%.
| Item | Outlook | Source |
|---|---|---|
| Q4 2026 revenue | $73bn to $76bn; F/X about 1% headwind | 8-K 21 Oct 2026, Ex 99.1 |
| FY2026 total expenses | $175bn to $179bn, from $165bn to $169bn, incl. the $9.9bn legal charge | 8-K 21 Oct 2026, Ex 99.1 |
| FY2026 capex incl. finance leases | $135bn to $145bn (January 2026: $115bn to $135bn) | 8-K 21 Oct 2026, Ex 99.1 |
| FY2026 operating income | above FY2025 ($83.3bn) before the Q3 legal charge | 8-K 21 Oct 2026, Ex 99.1 |
| Reality Labs operating loss | $18bn to $19bn in FY2026; about $15bn in FY2027 | 8-K 21 Oct 2026, Ex 99.1 |
| Q4 2026 tax rate | 15% to 17% | 8-K 21 Oct 2026, Ex 99.1 |
Management and CFO commentary
- CFO Susan Li, CFO Outlook Commentary in each Ex 99.1: FY2026 capex guidance moved from $115bn to $135bn (January) to $125bn to $145bn (April), $130bn to $145bn (July) and $135bn to $145bn (October); FY2026 expenses from $162bn to $169bn to $175bn to $179bn after legal charges.
- CFO, Q3 2025 outlook (29 Oct 2025): capex dollar growth notably larger in 2026 than 2025; expenses to grow significantly faster in 2026, led by cloud, depreciation and data center costs, then employee pay.
- CFO, Q3 2026 outlook (21 Oct 2026): no 2027 revenue outlook; strong revenue growth expected through 2027 with continued heavy investment; Meta Superintelligence Labs investments expected to take longer to return than core investments.
- CFO, Q2 2026 follow up call: compute supply constrained; third party cloud is the fastest way to add 2026 and 2027 capacity; operating cash flow is the main funding source, with investment grade debt and other options for 2027 under review.
- CEO Mark Zuckerberg, Q3 2026 call: over 10m US and Canada users set up Muse in about six weeks, with compute limiting a global launch; enterprise offerings planned: model API, Muse Code and business agents; Muse shopping used by over a quarter of users.
- CEO, Q2 2026 call: Meta receives offers for its compute at a premium to cost and is studying compute sales, secondary to internal AI work.
| Speaker | Date and source | Statement |
|---|---|---|
| Susan Li, CFO | 29 Oct 2025, 8-K Ex 99.1 | “capital expenditures dollar growth will be notably larger in 2026 than 2025” |
| Susan Li, CFO | 29 Jul 2026, 8-K Ex 99.1, on youth trials | “which may ultimately result in a material loss” |
| Susan Li, CFO | 21 Oct 2026, 8-K Ex 99.1, on Reality Labs | “expect losses to narrow next year to around $15 billion” |
| Mark Zuckerberg, Founder and CEO | 21 Oct 2026, 8-K Ex 99.1 | “Our investments are paying off, the core business is strong” |
| Item | Disclosure |
|---|---|
| 10-K FY2025, Item 7 | Revenue +22%, operating income +20%, ad impressions +12%, price per ad +9%; effective tax rate 30%, or 13% before the $15.93bn Q3 2025 valuation allowance charge. |
| 10-K FY2025, Hyperion venture | Louisiana data center with Blue Owl funds: Meta holds 20%, received a $2.55bn distribution; development cost about $27bn; leases from 2029, initial commitment $12.3bn; residual value guarantees; maximum exposure to loss $45.95bn; not consolidated. |
| 10-K FY2025, debt | Notes $59.0bn face at FY2025, coupons 3.50% to 5.75%, maturities 2027 to 2065, no financial covenants. |
| 10-K FY2025, Item 3 | FTC antitrust case: judgment for Meta on 18 Nov 2025, FTC appeal filed 20 Jan 2026. EU fines under appeal: DMA EUR 200m, Marketplace EUR 798m, GDPR EUR 1.2bn. |
| 10-Q Q3 2026, legal | Agreement with 52 attorneys general: up to $18.59bn, of which about $12.7bn over 10 years accrued and about $5.3bn contingent on peers adopting similar teen protections. New Mexico: $25bn civil penalty imposed on 21 Oct 2026 with 15% post judgment interest; Meta intends to appeal. |
| 10-Q Q3 2026, other litigation | Next personal injury bellwether trial 28 Oct 2026; over 200,000 mass arbitration claimants; District of Columbia seeks up to $1.7bn; FTC consent order hearing 12 Nov 2026. |
| 10-Q Q3 2026, commitments | Non cancelable commitments $454.52bn ($121.41bn due in 2027); leases not yet commenced $355.73bn with terms up to 30 years; contingent purchase of up to $14.72bn of cloud capacity. |
| 10-Q Q3 2026, El Paso venture | With BlackRock funds: about $14bn cost, 1 GW, Meta 20%; $1.04bn distribution received in Q3 2026. |
| 10-Q Q3 2026, new risk factors | Class C stock may trade below Class A, require more shares for a given raise, extend Mark Zuckerberg's voting control and affect the Class A price. |
4 Sector & Competitor Analysis
- Sector: digital advertising and social media. A 2026 industry forecast puts Meta ad revenue at $243.5bn, 26.8% of worldwide digital ad spend, ahead of Google at 26.4%; Google, Meta and Amazon together take 62.3%.
- Growth: META 26.1% in Q3 2026 against Alphabet 24.2%, Amazon 19.6%, Snap 18.9%, Pinterest 18.2%, Microsoft 17.8% and Reddit 61.1% (peers to June 2026).
- Margin: META TTM operating margin 32.9% against Microsoft 46.8%, Alphabet 33.1%, Reddit 28.2%, Amazon 12.1%, Pinterest 4.9% and Snap (5.1%).
- Capex across platforms: TTM purchases of property and equipment $173.0bn at Amazon and $132.4bn at Alphabet (to June 2026), $115.9bn at Microsoft in FY2026; Meta guides $135bn to $145bn for 2026.
- Valuation: META 6.8x EV/Sales and 21.7x P/E against Microsoft 11.6x and 29.1x, Alphabet 8.5x and 16.1x, Amazon 3.5x and 19.8x.
- Regulation: EU less personalized ads changes from Q1 2026; EU interim measure of June 2026 on WhatsApp Business API access for AI providers; YouTube and TikTok are named in the contingent payment trigger of the attorneys general agreement.
| Company | Revenue TTM ($bn) | Revenue growth (%) | Gross margin (%) | Operating margin (%) | Net margin (%) | FCF margin (%) | ROE (%) | Net cash ($bn) | Market value ($bn) | EV/Sales (x) | P/E TTM (x) |
|---|---|---|---|---|---|---|---|---|---|---|---|
| META | 241.6 | 26.1 | 81.0 | 32.9 | 31.1 | 10.4 | 32.3 | (1.2) | 1,636 | 6.8 | 21.7 |
| GOOGL | 445.9 | 24.2 | 60.9 | 33.1 | 54.8 | 11.9 | 50.6 | 142.3 | 3,928 | 8.5 | 16.1 |
| MSFT | 331.8 | 17.8 | 67.9 | 46.8 | 40.3 | 20.2 | 34.0 | 36.5 | 3,898 | 11.6 | 29.1 |
| AMZN | 775.7 | 19.6 | 50.8 | 12.1 | 17.4 | (1.5) | 32.3 | (9.2) | 2,683 | 3.5 | 19.8 |
| SNAP | 6.4 | 18.9 | 57.3 | (5.1) | (4.9) | 11.1 | (14.2) | (0.7) | 11 | 1.8 | n/a |
| PINS | 4.6 | 18.2 | 79.5 | 4.9 | 5.5 | 28.1 | 6.5 | 0.3 | 13 | 2.7 | 50.7 |
| RDDT | 2.8 | 61.1 | 91.4 | 28.2 | 31.3 | 36.7 | 32.2 | 2.8 | 28 | 9.0 | 32.0 |

5 Material Events & Contracts
- Twelve Forms 8-K in twelve months: five earnings releases, two note issues ($30bn and $25bn), four board, officer and litigation notices and the annual meeting; the Q3 2026 release also carries the Class C recapitalization.
- Q3 2026 Form 8-K (21 Oct 2026) carries Items 1.01, 2.02 and 8.01: non voting Class C stock effective 19 Jan 2027 with a one for one Class C dividend on Class A and B shares, and a Founder Alignment Agreement with Mark Zuckerberg (Ex 10.1).
- Founder Alignment Agreement: 80% of his Class C shares are tied to equal sales or conversion of Class A or B shares; 2.5% released per quarter while he stays in full time leadership; further one for one Class C dividends to all holders on each doubling of the Class C price against $580.60 if annual shareholder return since 10 Sep 2026 is at least 10%.
| Date | Items | Event |
|---|---|---|
| 29 Oct 2025 | 2.02, 9.01 | Q3 2025 results: revenue $51.2bn (+26%), operating income $20.5bn, net income $2.7bn after a $15.93bn one time tax charge; FY2025 capex outlook $70bn to $72bn. |
| 3 Nov 2025 | 8.01, 9.01 | $30.0bn senior notes in six series maturing 2030 to 2065 at 4.200% to 5.750%. |
| 12 Dec 2025 | 8.01, 9.01 | Notice of settlement in the Delaware derivative action (In re Facebook Inc. Derivative Litigation); hearing set for 7 Apr 2026. |
| 19 Dec 2025 | 5.02 | Director Dina Powell McCormick resigned from the board. |
| 16 Jan 2026 | 5.02 | Dina Powell McCormick appointed President and Vice Chairman from 12 Jan 2026: salary $1.0m, RSUs with initial value $60m over four years. |
| 28 Jan 2026 | 2.02, 9.01 | Q4 2025 results: revenue $59.9bn (+24%), EPS $8.88; FY2025 revenue $201.0bn (+22%); FY2026 expenses $162bn to $169bn, capex $115bn to $135bn. |
| 14 Apr 2026 | 5.02 | Directors Hock E. Tan and Tracey T. Travis not standing for reelection. |
| 29 Apr 2026 | 2.02, 9.01 | Q1 2026 results: revenue $56.3bn (+33%), operating income $22.9bn, net income $26.8bn incl. $8.03bn tax benefit; capex outlook $125bn to $145bn. |
| 4 May 2026 | 8.01, 9.01 | $25.0bn senior notes in six series maturing 2031 to 2066 at 4.550% to 6.450%. |
| 29 May 2026 | 5.07 | Annual meeting of 27 May 2026: 12 directors elected, auditor ratified, all 10 shareholder proposals rejected. |
| 29 Jul 2026 | 2.02, 9.01 | Q2 2026 results: revenue $60.8bn (+28%), operating income $18.8bn (8%) lower incl. $2.40bn legal charges and $1.18bn severance. |
| 21 Oct 2026 | 1.01, 2.02, 8.01, 9.01 | Q3 2026 results: revenue $64.6bn (+26%), operating income $13.0bn after $9.89bn legal charge; Class C stock and Founder Alignment Agreement. |
| Contract | Terms |
|---|---|
| Senior notes | $84.0bn face at 30 Sep 2026, maturities August 2027 to 2066; no financial covenants. |
| Hyperion venture (Blue Owl funds) | Meta 20%; leases from 2029, initial commitment $12.3bn, renewals up to 20 years; residual value guarantees; maximum exposure to loss $45.95bn at FY2025. |
| El Paso venture (BlackRock funds) | About $14bn cost, 1 GW, Meta 20%, about $12.5bn of venture level debt. |
| Attorneys general agreement | Up to $18.59bn: about $12.7bn over 10 years, about $5.3bn contingent, $75m costs. |
| Founder Alignment Agreement | Exhibit 10.1 to the 21 Oct 2026 Form 8-K; ties Mark Zuckerberg's Class C shares to his Class A and B sales and leadership service. |
6 Ownership, Voting Power & Annual Meeting
- Dual class: Class B ten votes per share. Mark Zuckerberg controls 60.8% of voting power; the Class C dividend leaves voting power unchanged. The charter amendment was approved by shareholder written consent on 20 Oct 2026.
- 2026 annual meeting (27 May 2026): 92.19% of voting power present; all 12 directors elected; all 10 shareholder proposals rejected, including one vote per share (1.31bn votes for, 3.65bn against).
- Insiders, 12 months: no open market purchases; sales about $260.7m, nearly all under 10b5-1 plans. CFO Susan Li about $105.7m, Christopher Cox about $55.0m, Javier Olivan about $41.9m, Mark Zuckerberg (via CZI) about $21.4m.
| Proposal | For (bn votes) | Against (bn votes) | Abstain (bn votes) | For as % of votes cast | Result |
|---|---|---|---|---|---|
| Elect Mark Zuckerberg (against = withheld) | 4.650 | 0.318 | n/a | 93.6 | Elected |
| Elect Peggy Alford, lowest director support (against = withheld) | 4.291 | 0.678 | n/a | 86.4 | Elected |
| Ratify Ernst & Young LLP | 5.148 | 0.030 | 0.004 | 99.4 | Approved |
| Shareholder: annual vote on executive pay | 1.347 | 3.616 | 0.006 | 27.1 | Rejected |
| Shareholder: one vote per share | 1.313 | 3.648 | 0.008 | 26.5 | Rejected |
| Shareholder: voting results by share class | 0.999 | 3.964 | 0.006 | 20.1 | Rejected |
| Shareholder: AI data usage oversight report | 0.504 | 4.447 | 0.018 | 10.2 | Rejected |
| Shareholder: climate commitments report | 0.343 | 4.613 | 0.013 | 6.9 | Rejected |
| Shareholder: generative AI chatbot data protection assessment | 0.328 | 4.629 | 0.012 | 6.6 | Rejected |
| Shareholder: online hate report | 0.325 | 4.618 | 0.025 | 6.6 | Rejected |
| Shareholder: human rights due diligence report | 0.206 | 4.728 | 0.035 | 4.2 | Rejected |
| Shareholder: child safety in executive pay report | 0.169 | 4.777 | 0.023 | 3.4 | Rejected |
Remarks at the 27 May 2026 annual meeting
- Users and AI revenue: Mark Zuckerberg cited over 3.5bn daily users of at least one Meta app and four AI revenue areas: ranking and ads, personal agents, business agents and AI hardware.
- Margins: Meta does not manage to a margin target and aims to grow consolidated operating profit over time.
- Products: business AI weekly conversations up tenfold since the start of 2026; daily AI glasses users tripled year on year; Reality Labs 2026 losses similar to 2025, then a gradual decline.
- Capital: Susan Li said no stock split was planned at the time; $25bn of buyback authorization remained at 31 Mar 2026; AI investment is the top capital priority.
- Q&A: a cloud business to compete with AWS and Azure is on the table, but compute is used internally for now.
| Holder | Class A (m) | Class B (m) | Voting power (%) |
|---|---|---|---|
| Mark Zuckerberg, incl. CZI entities | 0.6 | 341.8 | 60.8 |
| BlackRock | 157.8 | n/a | 2.8 |
| FMR | 134.6 | n/a | 2.4 |
7 Risk Factors
- The Q3 2026 Form 10-Q adds risk factors on the Class C recapitalization and discloses the attorneys general agreement (up to $18.59bn), the New Mexico $25bn penalty and pending youth trials.
| Risk | Disclosure and change |
|---|---|
| Youth safety litigation | Up to $18.59bn under the attorneys general agreement; New Mexico $25bn penalty under appeal; bellwether trials from 28 Oct 2026; over 200,000 arbitration claimants. Disclosed damages sought could reach hundreds of billions of dollars. |
| Infrastructure cost and commitments | Commitments $454.5bn and leases not yet commenced $355.7bn at 30 Sep 2026; residual value guarantees on data center ventures. |
| Class C recapitalization (new) | Class C may trade below Class A, require more shares for a raise and extend founder voting control. |
| Founder control | Mark Zuckerberg holds 60.8% of votes; 12.0m Class B shares pledged. |
| EU regulation | DMA, DSA and GDPR actions; less personalized ads changes in Europe; WhatsApp Business API interim measure for AI providers. |
| Antitrust | FTC appeal of the November 2025 judgment on Instagram and WhatsApp; FTC consent order hearing 12 Nov 2026. |
| AI investment return | Muse set up by over 10m people within six weeks of launch; per token charging for business agents began 1 Aug 2026; 2027 capex and expenses not yet guided. |
| Reality Labs | Operating losses of $19.2bn in FY2025; guidance about $15bn in FY2027. |
8 Stock Price, Scenarios & Sensitivity
- META closed at $640.10 on 23 Oct 2026, 17.9% below the 52 week high of $779.82 and 23.1% above the low of $519.79.
- Valuation: 21.8x TTM EPS of $29.33; 6.8x EV/Sales; FCF yield 1.5%. Prices are not adjusted for the Class C dividend due in January 2027.
- Consensus: revenue FY2027 $296.7bn and FY2028 $347.0bn; EPS FY2027 $34.56 and FY2028 $40.14.
- Scenario model: revenue grows from TTM Q3 2026 $241.6bn for three years; net interest ($1.5bn); 16% tax rate; price equals FY2029 EPS times exit P/E, per Class A share before the Class C dividend.

Critical factors and core assumptions
| Factor | Current value | Best case requires | Evidence in filings and calls |
|---|---|---|---|
| Ad revenue growth | Q3 2026 +26%: impressions +10%, price per ad +14% | ad revenue growth near 20% a year through FY2029 | 8-K 21 Oct 2026, Ex 99.1; Q3 2026 call |
| Capex and depreciation | FY2026 capex $135bn to $145bn; D&A $7.2bn in Q3 2026 | capex growth flattens after 2027; depreciation grows slower than revenue by 2029 | 10-Q Q3 2026 commitments and leases |
| AI product revenue | Muse set up by over 10m people; business agents with per token charging | messaging, agents and subscriptions add a material revenue line from 2027 | Q2 and Q3 2026 calls; Family of Apps other revenue +59% |
| Legal cost | $9.9bn accrued in Q3 2026; New Mexico $25bn penalty under appeal | payments stay within accrued amounts; contingent $5.3bn not triggered | 10-Q Q3 2026 legal note |
| Reality Labs loss | $19.2bn in FY2025 | loss below $15bn after FY2027 | 8-K 21 Oct 2026 outlook |
| Funding and dilution | debt $83.7bn; Class C created for equity offerings | capex funded by operating cash flow and ventures without large Class C issuance | Q2 2026 call; 10-Q risk factors |
- Revenue base TTM Q3 2026 $241.6bn; FY2026 implied $254.7bn to $257.7bn from 9M actuals and Q4 guidance.
- Best case: 22% revenue CAGR to $438.7bn, 42% operating margin (FY2025: 41.4%), 28x P/E, share count (3%).
- Base case: 17% revenue CAGR to $387.0bn, 36% margin, 22x P/E, share count unchanged.
- Worst case: 9% revenue CAGR to $312.9bn, 26% margin, 15x P/E, share count +3% from Class C equity issuance.
- Tax rate 16%; net interest ($1.5bn) a year; legal payments and Reality Labs losses sit inside the operating margin.
Scenarios, three years forward
| Measure | Worst case | Base case | Best case |
|---|---|---|---|
| Revenue CAGR, 3 years (%) | 9.0 | 17.0 | 22.0 |
| Revenue, FY2029 ($bn) | 312.9 | 387.0 | 438.7 |
| Operating margin, FY2029 (%) | 26.0 | 36.0 | 42.0 |
| Net income, FY2029 ($bn) | 67.1 | 115.8 | 153.5 |
| EPS, FY2029 ($) | 25.48 | 45.28 | 61.92 |
| Exit P/E (x) | 15.0 | 22.0 | 28.0 |
| Implied price ($) | 382 | 996 | 1,734 |
| Change against $640.10 (%) | (40) | 56 | 171 |
| Implied annual return (%) | (15.8) | 15.9 | 39.4 |

Sensitivity analysis
| Revenue CAGR \ Operating margin | 26% | 30% | 34% | 38% | 42% |
|---|---|---|---|---|---|
| 9% | $577 | $668 | $758 | $849 | $939 |
| 13% | $644 | $745 | $846 | $947 | $1,048 |
| 17% | $717 | $828 | $940 | $1,052 | $1,164 |
| 21% | $794 | $917 | $1,041 | $1,165 | $1,289 |
| 25% | $876 | $1,013 | $1,149 | $1,286 | $1,422 |
| Exit P/E \ Operating margin | 26% | 30% | 34% | 38% | 42% |
|---|---|---|---|---|---|
| 15x | $489 | $565 | $641 | $717 | $794 |
| 19x | $619 | $715 | $812 | $909 | $1,005 |
| 22x | $717 | $828 | $940 | $1,052 | $1,164 |
| 25x | $814 | $941 | $1,069 | $1,196 | $1,323 |
| 28x | $912 | $1,054 | $1,197 | $1,339 | $1,482 |
Disclaimer
This analysis is for information only and is not financial advice. It is derived from public SEC filings retrieved via sec-api.io and is not a publication of the U.S. Securities and Exchange Commission. Scenario values are model outputs under stated assumptions and are not forecasts. Data as of 23 October 2026.
Sources
All company figures are read from SEC filings retrieved through the sec-api.io MCP server. Call statements are taken from the Q3 2026 and Q2 2026 earnings calls held by the company.
| Form | Period | Filed | Accession number |
|---|---|---|---|
| 10-Q | Q3 2026 | 21 Oct 2026 | 0001628280-26-066773 |
| 8-K (2.02, 1.01, 8.01) Ex 99.1, Ex 10.1 | Q3 2026 | 21 Oct 2026 | 0001628280-26-066700 |
| 10-Q | Q2 2026 | 29 Jul 2026 | 0001628280-26-050705 |
| 8-K Ex 99.1 | Q2 2026 | 29 Jul 2026 | 0001628280-26-050596 |
| 10-Q | Q1 2026 | 29 Apr 2026 | 0001628280-26-028526 |
| 8-K Ex 99.1 | Q1 2026 | 29 Apr 2026 | 0001628280-26-028364 |
| 10-K | FY2025 | 28 Jan 2026 | 0001628280-26-003942 |
| 8-K Ex 99.1 | Q4 2025 | 28 Jan 2026 | 0001628280-26-003832 |
| 10-Q | Q3 2025 | 29 Oct 2025 | 0001628280-25-047240 |
| 10-Q | Q2 2025 | 30 Jul 2025 | 0001628280-25-036791 |
| 10-Q | Q1 2025 | 30 Apr 2025 | 0001326801-25-000054 |
| 10-K | FY2023 | 1 Feb 2024 | 0001326801-24-000012 |
| 10-K | FY2022 | 1 Feb 2023 | 0001326801-23-000013 |
| DEF 14A | 2026 annual meeting | 16 Apr 2026 | 0001628280-26-025532 |
| 8-K 5.07 | 2026 annual meeting | 29 May 2026 | 0001628280-26-039193 |
| 8-K 8.01 notes | May 2026 | 4 May 2026 | 0001193125-26-204128 |
| 8-K 8.01 notes | Nov 2025 | 3 Nov 2025 | 0001193125-25-262593 |
| Filed | Exhibit | Document | Content |
|---|---|---|---|
| 29 Oct 2025 | EX-99.1 | Q3 2025 earnings press release | Revenue $51.24bn, up 26% (25% constant currency); operating income $20.54bn, margin 40%.; One time non cash tax charge of $15.93bn (valuation allowance on US deferred tax assets after the One Big Beautiful Bill Act, linked to CAMT); effective tax rate 87%; net income $2.71bn, diluted EPS $1.05 ($7.25 excluding the charge). |
| 3 Nov 2025 | EX-1.1 | Underwriting agreement for $30.0bn senior notes (dated 30 Oct 2025) | Six series totalling $30.0bn: $4.0bn 4.200% 2030, $4.0bn 4.600% 2032, $6.5bn 4.875% 2035, $4.5bn 5.500% 2045, $6.5bn 5.625% 2055, $4.5bn 5.750% 2065.; Representatives Citigroup Global Markets and Morgan Stanley, each taking 45% of every series ($13.5bn each); Allen & Company 5%; Blaylock Van, CastleOak, R. Seelaus and Siebert Williams Shank 1.25% each. |
| 3 Nov 2025 | EX-4.1 | Fourth Supplemental Indenture with U.S. Bank Trust Company (includes forms of notes, Ex 4.2 to 4.7) | Supplements the 9 Aug 2022 base indenture with U.S. Bank Trust Company, National Association as trustee.; Establishes the six note series ($30.0bn) with coupons from 4.200% to 5.750% and maturities from 2030 to 2065. |
| 3 Nov 2025 | EX-5.1 | Legality opinion of Davis Polk & Wardwell (with consent, Ex 23.1) | Opines that the $30.0bn of notes will be valid and binding obligations of Meta once issued and paid for, subject to customary bankruptcy and equity exceptions. |
| 12 Dec 2025 | EX-99.1 | Stipulation and Agreement of Settlement, In re Facebook Inc. Derivative Litigation (Del. Ch., C.A. 2018-0307-KSJM), dated 20 Nov 2025 | All in cash settlement of $190m paid to Meta (net of court awarded fees, expenses and taxes), funded by defendants' directors and officers liability insurers, not by the individual defendants personally.; Insurers pay the net amount to Meta within two business days of court approval; payment refunded if the settlement is not approved. |
| 12 Dec 2025 | EX-99.2 | Notice of pendency, proposed settlement and settlement hearing (derivative action) | Claims concerned alleged failure to ensure compliance with the 2012 FTC consent order and approval of the $5bn FTC settlement in 2019, plus an insider trading (Brophy) claim against Zuckerberg.; Trial began 16 Jul 2025; agreement in principle reached 17 Jul 2025 after a mediator's proposal, following four unsuccessful mediations. |
| 16 Jan 2026 | Item 5.02 (8-K body; no exhibit filed) | Appointment of Dina Powell McCormick as President and Vice Chairman, effective 12 Jan 2026 | Base salary $1.0m, one time $2.0m sign on bonus, bonus target 200% of salary.; RSU grant with initial value $60m under the 2025 Equity Incentive Plan, vesting quarterly over four years from 15 May 2026. |
| 28 Jan 2026 | EX-99.1 | Q4 and FY2025 earnings press release | Q4 2025 revenue $59.89bn, up 24%; operating income $24.75bn (41% margin); net income $22.77bn; diluted EPS $8.88.; FY2025 revenue $200.97bn, up 22%; operating income $83.28bn; net income $60.46bn; diluted EPS $23.49; effective tax rate 30% (13% excluding the valuation allowance charge). |
| 29 Apr 2026 | EX-99.1 | Q1 2026 earnings press release | Revenue $56.31bn, up 33% (29% constant currency); operating income $22.87bn, margin 41%.; Net income $26.77bn and diluted EPS $10.44, including an $8.03bn tax benefit from US Treasury Notice 2026-7 (EPS $3.13 lower without it); effective tax rate negative 23%. |
| 4 May 2026 | EX-1.1 | Underwriting agreement for $25.0bn senior notes (dated 30 Apr 2026) | Six series totalling $25.0bn: $3.0bn 4.550% 2031, $2.0bn 4.875% 2033, $6.0bn 5.250% 2036, $4.0bn 6.200% 2046, $6.0bn 6.300% 2056, $4.0bn 6.450% 2066.; Representatives Citigroup Global Markets and Morgan Stanley at 35% each ($8.75bn each); Goldman Sachs and J.P. Morgan 10% each; Allen & Company 5%; four smaller firms 1.25% each. |
| 4 May 2026 | EX-4.1 | Fifth Supplemental Indenture with U.S. Bank Trust Company (includes forms of notes) | Supplements the 9 Aug 2022 base indenture; establishes the six series totalling $25.0bn with coupons from 4.550% to 6.450% and maturities 2031 to 2066.; Coupons are about 35 to 70 basis points above comparable tenors of the November 2025 issue (for example 6.300% 2056 against 5.625% 2055). |
| 4 May 2026 | EX-5.1 | Legality opinion of Davis Polk & Wardwell | Opines that the $25.0bn of notes will be valid and binding obligations of Meta, subject to customary exceptions. |
| 29 May 2026 | Item 5.07 (8-K body; no exhibit filed) | Results of 27 May 2026 annual meeting | Meeting held by live audio webcast; 92.19% of combined voting power present.; All 12 directors elected; lowest support John Elkann (4.11bn for, 859m withheld) and Peggy Alford (4.29bn for, 678m withheld). |
| 29 Jul 2026 | EX-99.1 | Q2 2026 earnings press release | Revenue $60.80bn, up 28% (27% constant currency); costs and expenses $42.03bn, up 55%, including $2.40bn legal charges and $1.18bn severance for the May 2026 headcount reduction.; Operating income $18.78bn, down 8% (margin 31%); net income $15.85bn; diluted EPS $6.18, down 13%. |
| 21 Oct 2026 | EX-10.1 | Founder Alignment Agreement between Meta and Mark Zuckerberg (dated 20 Oct 2026) | Board approved a restated charter creating non voting Class C common stock (par $0.000006), effective 19 Jan 2027; shareholders approved by written consent on 20 Oct 2026, recommended by a special committee of disinterested directors.; One time stock dividend of one Class C share per Class A and Class B share, payable no later than the fifth business day after the charter takes effect; payment is conditional on the agreement remaining in force. |
| 21 Oct 2026 | EX-99.1 | Q3 2026 earnings press release and Class C stock announcement | Revenue $64.60bn, up 26% reported and constant currency; advertising $63.06bn; FoA other revenue $1.10bn; Reality Labs revenue $443m.; Costs and expenses $51.61bn, up 68%, including a $9.89bn G&A charge for the August 2026 agreement with 52 state attorneys general (payments up to about $18.59bn). |
| 21 Oct 2026 | PRE 14C Annex A (restated charter; not an 8-K exhibit) | Class C charter documents in preliminary information statement | Restated charter authorizes 109.241bn shares: 5.0bn Class A, 4.141bn Class B, 100bn non voting Class C and 100m preferred; effective 19 Jan 2027.; Approved by written consent of Chan Zuckerberg entities holding 315,826,951 Class B shares, about 56.1% of voting power, on the 20 Oct 2026 record date. |