Microsoft Corporation (MSFT), Financial Analysis
Insights derived from analysing SEC filings. Independent analysis, not a publication of the SEC.
Ticker MSFT. CIK 789019. CUSIP 594918104. NASDAQ. SIC 7372. Fiscal year ends 30 June.
Base year is FY2026, audited, ended 2026-06-30, 10-K filed 2026-07-29, accession 0001193125-26-323660. Market data as at the close of 2026-09-01.
Executive summary
Microsoft has converted a software licence business into a contracted cloud utility, and in FY2026 began paying the utility's price. Revenue grew 17.8% to $331,839 million and operating margin reached 46.8%, the highest in five years and the best growth and margin pair in the peer set. No other member clears 15% growth and 40% margin at once.
Growth is bought with capital. Capital expenditure was $115,948 million, 34.9% of revenue and 63.4% of operating cash flow, against 22.9% and 47.4% before. Free cash flow fell a second year to $66,987 million, net cash of $5,242 million became net debt of $(30,045) million, and return on invested capital fell from 29.3% in FY2024 to 25.5%. Property and equipment turnover fell from 2.66x to 1.06x. Leases fund the build: finance lease liabilities more than quadrupled to $66,594 million while bond debt fell, and $329.1 billion of leases were signed but uncommenced at year end.
Reported earnings overstate what happened. Diluted EPS rose 31.6% to $17.95, but the swing came from outside operations. Microsoft's own filed adjustment removes $4,963 million of after tax gains on its OpenAI investment and reports 22% growth. Removing the equity marks and derivative gains as well leaves core EPS growth of 17.1%, below operating income growth of 20.8%. Three defensible FY2026 EPS growth rates exist and they span 15 points.
One counterparty sits across the picture. OpenAI supplied $24,100 million of FY2026 revenue, 7.3% of the total, is an equity method investee at about 25% as converted, is owed $11,900 million of funded commitments, and drives most of the backlog. Commercial remaining performance obligation reached $678 billion, up 84%, but management stated 25% excluding OpenAI. The FY2026 10-K names the exposures for the first time: capital availability, demand overestimation, impairment of underutilised infrastructure. Six of 26 risk factors are new, all in the capital cycle.
The market has marked this. The stock derated from 37.8 times adjusted earnings at the FY2025 close to 26.9 times at the FY2026 close while adjusted EPS grew 22.3%, and is 9.3% below its 52 week high. At 27 times exit earnings, spot of $499.38 requires revenue to compound at only 3.1% a year to FY2029, against 17.8% delivered. The exit multiple carries the largest spread of the three year cases, $325 a share against $229 for the revenue growth rate. Insiders bought once in twelve months and sold $50.42 million of vested stock, and the index managers who own a quarter of the company vote barely half of it, so neither settles it.
The question is arithmetic. Hold FY2026 depreciation at 14.9% of average net property and equipment and grow the asset base 25% a year, and depreciation reaches 16.7% of FY2029 revenue against 11.6% in FY2026, a five point margin drag. Intelligent Cloud has already lost 1.9 points of segment operating margin in two years while growing 29.7%. Whether the signed backlog converts faster than the datacentre depreciates is testable each quarter.
1 Revenue & Business Model
Microsoft sells access to its software as a service, and the transition is close to finished. Service and other revenue was 80.5% of the $331,839 million reported for FY2026 against 63.3% in FY2022, while product revenue of $64,696 million sat $8,036 million below its FY2022 level. Microsoft Cloud reached $214,400 million, 64.6% of revenue against 46.1% four years earlier. For the stock the consequence is contracted visibility: commercial remaining performance obligation was $678 billion at 30 June 2026, up 84% year on year and 2.0 times FY2026 revenue, with a weighted average duration of 2 years 3 months and 30% due inside twelve months. Chapter 5 shows how one contract produced most of it.
Growth is concentrated in one segment. Intelligent Cloud revenue grew 29.7% in FY2026 to $137,791 million and has compounded at 21.6% a year since FY2022, lifting its share of revenue from 31.8% to 41.5%. More Personal Computing fell 1.1% to $54,052 million, a 1.7% four year compound rate, and its share dropped from 25.5% to 16.3%. Consolidated revenue grew 17.8% in FY2026, which included a 2 point favourable currency effect, and 13.7% a year since FY2022.
How the money is made
Item 1 of the FY2026 10-K names four streams: cloud based solutions, content and other services; licensing and supporting software; online advertising; and designing and selling devices. Two of the ten disclosed offerings, Azure and server products together with Microsoft 365 Commercial, produced 69.7% of FY2026 revenue.
| Offering | Segment | Revenue mechanic | FY2026 revenue ($m) | Share of revenue (%) |
|---|---|---|---|---|
| Server products and cloud services | Intelligent Cloud | Azure is consumption based infrastructure as a service and platform as a service. Server products sell through volume licensing, OEM licences and retail, with client access licences reported alongside the server product. | 129,425 | 39.0 |
| Microsoft 365 Commercial products and cloud services | Productivity and Business Processes | Per user subscription. Revenue moves with installed base growth, average revenue per user expansion and the shift from Office licensed on premises to Microsoft 365. | 101,997 | 30.7 |
| XBOX | More Personal Computing | First and third party content, XBOX Game Pass and other subscriptions, cloud gaming, advertising and console hardware. | 21,790 | 6.6 |
| Productivity and Business Processes | Subscriptions to Talent Solutions, Sales Solutions and Premium, plus sponsored content sold to marketers. Revenue follows enterprise demand and member engagement. | 19,817 | 6.0 | |
| Windows and Devices | More Personal Computing | Windows OEM licences preinstalled by device makers, priced per licence and driven by PC volume, form factor mix, attach rate and channel inventory, plus first party Surface and accessory sales. | 17,084 | 5.1 |
| Search advertising | More Personal Computing | Search, native and display advertising through Bing, Copilot, Microsoft Edge, Microsoft News and third party affiliates. Revenue follows search volume and revenue per search. | 15,176 | 4.6 |
| Microsoft 365 Consumer products and cloud services | Productivity and Business Processes | Consumer subscriptions and Office licensed on premises. Revenue follows attach to new devices, the shift to subscription, and Outlook.com and OneDrive demand. | 9,175 | 2.8 |
| Dynamics products and cloud services | Productivity and Business Processes | Priced on users licensed and applications consumed, with the mix shifting to Dynamics 365 and the low code platforms. | 9,006 | 2.7 |
| Enterprise and partner services | Intelligent Cloud | Enterprise Support Services, Industry Solutions, the Microsoft Partner Network and training, sold as services. | 8,260 | 2.5 |
| Other products and services | More Personal Computing | Residual offerings not allocated to a named line. | 109 | 0.0 |
Billing is front loaded and recognition is not. Volume licensing agreements are invoiced annually at the start of each contract period and recognised ratably over it, which is why unearned revenue and remaining performance obligation carry the growth signal ahead of the income statement. Payment terms are 30 to 60 days. Item 1 states the cost logic behind the cloud gross margin: datacentres deploy computing at a lower unit cost than smaller sites, aggregate demand across customers, geographies and applications to raise utilisation, and use multitenancy to lower maintenance labour.
Revenue by segment


| Segment | Measure | FY2022 | FY2023 | FY2024 | FY2025 | FY2026 | CAGR FY2022 to FY2026 (%) |
|---|---|---|---|---|---|---|---|
| Productivity and Business Processes | Revenue ($m) | 84,635 | 94,151 | 106,820 | 120,810 | 139,996 | 13.4 |
| Intelligent Cloud | Revenue ($m) | 63,029 | 72,944 | 87,464 | 106,265 | 137,791 | 21.6 |
| More Personal Computing | Revenue ($m) | 50,606 | 44,820 | 50,838 | 54,649 | 54,052 | 1.7 |
| Total | Revenue ($m) | 198,270 | 211,915 | 245,122 | 281,724 | 331,839 | 13.7 |
| Productivity and Business Processes | Operating income ($m) | 43,163 | 50,074 | 59,661 | 69,773 | 83,879 | 18.1 |
| Intelligent Cloud | Operating income ($m) | 25,810 | 28,411 | 37,813 | 44,589 | 56,972 | 21.9 |
| More Personal Computing | Operating income ($m) | 14,410 | 10,038 | 11,959 | 14,166 | 14,386 | (0.0) |
| Total | Operating income ($m) | 83,383 | 88,523 | 109,433 | 128,528 | 155,237 | 16.8 |
| Productivity and Business Processes | Operating margin (%) | 51.0 | 53.2 | 55.9 | 57.8 | 59.9 | n/a |
| Intelligent Cloud | Operating margin (%) | 40.9 | 38.9 | 43.2 | 42.0 | 41.3 | n/a |
| More Personal Computing | Operating margin (%) | 28.5 | 22.4 | 23.5 | 25.9 | 26.6 | n/a |
| Total | Operating margin (%) | 42.1 | 41.8 | 44.6 | 45.6 | 46.8 | n/a |
Productivity and Business Processes remains the profit engine at a 59.9% margin, 18.6 points above Intelligent Cloud. The growth segment is the lower margin one, and thinning: Intelligent Cloud cost of revenue rose 44.1% to $57,876 million, 42.0% of segment revenue against 33.9% in FY2024, which management attributes to AI infrastructure and product usage. Company operating margin still rose to 46.8% because operating expenses grew 7.4%. A reader expecting the Intelligent Cloud mix shift to lift group margin should note the segment evidence points the other way. The group margin gain came from operating leverage and Productivity and Business Processes.
More Personal Computing is the only segment falling in FY2026, and the composition explains it. XBOX fell 7.1% to $21,790 million, Windows and Devices 1.3% to $17,084 million, and Search advertising grew 9.4% to $15,176 million.
Revenue by region

| Region | FY2022 | FY2023 | FY2024 | FY2025 | FY2026 | CAGR FY2022 to FY2026 (%) |
|---|---|---|---|---|---|---|
| United States ($m) | 100,218 | 106,744 | 124,704 | 144,546 | 170,794 | 14.3 |
| Other countries ($m) | 98,052 | 105,171 | 120,418 | 137,178 | 161,045 | 13.2 |
| Total ($m) | 198,270 | 211,915 | 245,122 | 281,724 | 331,839 | 13.7 |
| United States share (%) | 50.5 | 50.4 | 50.9 | 51.3 | 51.5 | n/a |
The geographic mix barely moves. United States revenue grew 18.2% in FY2026 and other countries 17.4%, and the United States share widened by only 1.0 point over four years. Microsoft discloses no split below these two lines, and states that no individual customer, and no country other than the United States, accounted for more than 10% of revenue in FY2026, FY2025 or FY2024. The United States line includes billings to OEMs and certain multinational organisations where the geographic source of revenue cannot be determined, so it overstates domestic end demand by an amount the filing does not quantify. A single country shock therefore moves roughly half the revenue base.
Revenue by offering
| Offering | FY2022 | FY2023 | FY2024 | FY2025 | FY2026 | CAGR FY2022 to FY2026 (%) | Share of FY2026 revenue (%) |
|---|---|---|---|---|---|---|---|
| Server products and cloud services | 55,414 | 65,007 | 79,828 | 98,435 | 129,425 | 23.6 | 39.0 |
| Microsoft 365 Commercial products and cloud services | 59,926 | 66,949 | 76,969 | 87,767 | 101,997 | 14.2 | 30.7 |
| XBOX | 16,230 | 15,466 | 21,503 | 23,455 | 21,790 | 7.6 | 6.6 |
| 13,631 | 14,989 | 16,372 | 17,812 | 19,817 | 9.8 | 6.0 | |
| Windows and Devices | 22,628 | 17,147 | 17,026 | 17,314 | 17,084 | (6.8) | 5.1 |
| Search advertising | 11,526 | 12,125 | 12,306 | 13,878 | 15,176 | 7.1 | 4.6 |
| Microsoft 365 Consumer products and cloud services | 6,277 | 6,417 | 6,648 | 7,404 | 9,175 | 10.0 | 2.8 |
| Dynamics products and cloud services | 4,800 | 5,796 | 6,831 | 7,827 | 9,006 | 17.0 | 2.7 |
| Enterprise and partner services | 7,605 | 7,900 | 7,594 | 7,760 | 8,260 | 2.1 | 2.5 |
| Other products and services | 233 | 119 | 45 | 72 | 109 | (17.3) | 0.0 |
| Total | 198,270 | 211,915 | 245,122 | 281,724 | 331,839 | 13.7 | 100.0 |

Windows and Devices is the clearest structural decline: $17,084 million in FY2026 against $22,628 million in FY2022, a 6.8% annual contraction, held inside a $288 million range over three years. Its revenue share fell from 11.4% to 5.1%.
The segment basis changed, so read the series carefully
Microsoft realigned its segments in FY2025 and recast prior periods. Every segment series above is on that basis: FY2022 and FY2023 are recast in the 8-K filed 2024-12-03, accession 0000950170-24-132722, and FY2024 to FY2026 as reported in the FY2026 10-K. The realignment moved commercial components of Microsoft 365, including Enterprise Mobility and Security, the per user portion of Power BI and Windows Commercial, into Productivity and Business Processes, Nuance Enterprise into Dynamics, Copilot Pro into Search advertising, and combined Windows and Devices.
| Segment | FY2024 as first reported ($m) | FY2024 recast ($m) | Change ($m) |
|---|---|---|---|
| Productivity and Business Processes | 77,728 | 106,820 | 29,092 |
| Intelligent Cloud | 105,362 | 87,464 | (17,898) |
| More Personal Computing | 62,032 | 50,838 | (11,194) |
| Total | 245,122 | 245,122 | 0 |
Consolidated revenue is unchanged. Segment histories published before the FY2025 10-K are not comparable with the series in this chapter, and the two bases must never be mixed in one line.
The mix shift to services

Microsoft Cloud compounded at 23.8% a year, from $91,400 million to $214,400 million, and grew 26.9% in FY2026, which the 10-K rounds to 27%. Azure and other cloud services grew 41%, the fastest line management discloses. Azure passed $100 billion of annual revenue for the first time in FY2026, and Microsoft 365 Copilot 30 million paid seats.

Product revenue is flat in dollars across five years while service and other revenue compounds at 20.8% a year, so the product share of revenue falls from 36.7% to 19.5%. Unearned revenue of $75,712 million and $678 billion of commercial backlog mean the near term revenue line is largely contracted in advance.
Related party revenue
The FY2026 10-K discloses, under ASC 850, $24,100 million of revenue from commercial arrangements with OpenAI Global LLC inclusive of revenue sharing payments, 7.3% of consolidated revenue, and $6,000 million of accounts receivable from OpenAI at 30 June 2026. Microsoft holds an equity method interest of approximately 25% on an as converted basis and has committed $13,000 million of funding, of which $11,900 million was funded at 30 June 2026. The counterparty is customer, investee and funding recipient at once. This exposure did not exist at this scale in FY2022 and is the single largest new concentration in the revenue base. It sits inside the totals above and is not additive to them. Chapter 5 sets out the contract, Chapter 2 the accounting for the stake, and Chapter 9 what a step down would cost.
2 Financial Analysis & Ratios
The operating engine improved in FY2026 and the balance sheet got heavier. Operating income rose 20.8% to $155,237 million on 17.8% revenue growth, and operating margin reached 46.8%, the highest in the five year window. Reported diluted EPS rose 31.6% to $17.95, but 14 of those 32 points sit outside operations: nonoperating income swung $15,598 million, from $(4,901) million to $10,697 million, on a $6,530 million net gain on the OpenAI investment and $4,391 million of unrealised marks on equity still held. On core earnings, which strip those marks out, EPS grew 17.1%. At the same time capital expenditure reached $115,948 million, 34.9% of revenue and 63.4% of operating cash flow, so free cash flow fell 6.5% to $66,987 million and net cash turned into net debt of $(30,045) million. The stock is buying a business compounding operating profit in the high teens and converting more of it into datacentre assets.
What changed
| Line | FY2026 | FY2025 | Change | Change % |
|---|---|---|---|---|
| Revenue | 331,839 | 281,724 | 50,115 | 17.8 |
| Cost of revenue | 106,374 | 87,831 | 18,543 | 21.1 |
| Gross profit | 225,465 | 193,893 | 31,572 | 16.3 |
| Research and development | 35,562 | 32,488 | 3,074 | 9.5 |
| Sales and marketing | 26,710 | 25,654 | 1,056 | 4.1 |
| General and administrative | 7,956 | 7,223 | 733 | 10.1 |
| Operating income | 155,237 | 128,528 | 26,709 | 20.8 |
| Other income (expense), net | 10,697 | (4,901) | 15,598 | n/a |
| Income before income taxes | 165,934 | 123,627 | 42,307 | 34.2 |
| Provision for income taxes | 32,185 | 21,795 | 10,390 | 47.7 |
| Net income | 133,749 | 101,832 | 31,917 | 31.3 |
| Diluted EPS ($) | 17.95 | 13.64 | 4.31 | 31.6 |
| Operating cash flow | 182,935 | 136,162 | 46,773 | 34.4 |
| Capital expenditure | 115,948 | 64,551 | 51,397 | 79.6 |
| Free cash flow | 66,987 | 71,611 | (4,624) | (6.5) |
| Gross margin (%) | 67.9 | 68.8 | (0.9) pts | n/a |
| Operating margin (%) | 46.8 | 45.6 | 1.2 pts | n/a |
| Net margin (%) | 40.3 | 36.1 | 4.2 pts | n/a |
Gross margin fell 0.9 points because cost of revenue grew 21.1% against revenue at 17.8%. Microsoft attributes this to AI infrastructure and growing AI product usage, partly offset by efficiency gains across the Microsoft Cloud, whose gross margin fell to 66%. Operating margin still rose 1.2 points because operating expenses grew only 7.4%, to 21.2% of revenue from 23.2%. Tax expense grew faster than pretax income because the effective rate rose to 19.4% from 17.6% on an earnings mix shift to the United States, where pretax income was $103,600 million against $62,300 million abroad.
| Quarter | Revenue FY2026 | Revenue FY2025 | Growth % | Operating income FY2026 | Operating income FY2025 | Growth % | Other income (expense), net FY2026 | Net income FY2026 | Diluted EPS FY2026 ($) |
|---|---|---|---|---|---|---|---|---|---|
| Q1 (Sep) | 77,673 | 65,585 | 18.4 | 37,961 | 30,552 | 24.3 | (3,660) | 27,747 | 3.72 |
| Q2 (Dec) | 81,273 | 69,632 | 16.7 | 38,275 | 31,653 | 20.9 | 9,971 | 38,458 | 5.16 |
| Q3 (Mar) | 82,886 | 70,066 | 18.3 | 38,398 | 32,000 | 20.0 | 942 | 31,778 | 4.27 |
| Q4 (Jun) | 90,007 | 76,441 | 17.7 | 40,603 | 34,323 | 18.3 | 3,444 | 35,766 | 4.81 |
| Full year | 331,839 | 281,724 | 17.8 | 155,237 | 128,528 | 20.8 | 10,697 | 133,749 | 17.95 |
Revenue growth held in a 16.7% to 18.4% band across the four quarters while operating income growth decelerated from 24.3% to 18.3%. Net income does not track that pattern. The December quarter alone carried $9,971 million of other income and a 47.3% net margin, against 35.7% in September. That single quarter is the OpenAI Recapitalization.
Microsoft files no fourth quarter 10-Q, so the Q4 figures here come from the income statement in Exhibit 99.1 of the 8-K filed 2026-07-29 rather than from a quarterly report, and the FY2025 comparatives for the first three quarters are the prior year columns inside the FY2026 10-Q filings. Quarterly diluted EPS is not additive: the four FY2026 quarters sum to $17.96 against the $17.95 reported for the year, because the diluted share count is computed independently each quarter and for the year. The reported figures stand unadjusted.

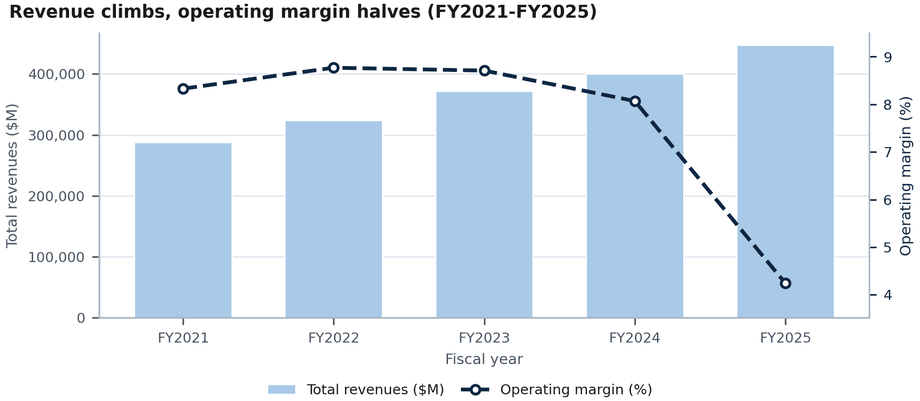
Combination chart, revenue bars in $ millions on the left axis and operating margin line in percent on the right axis.

Stacked area of the three operating expense lines in percent of revenue.
GAAP against core earnings
Nonoperating income swung from $(4,901) million to $10,697 million for three reasons, all in Note 3 of the FY2026 10-K. First, Microsoft recorded $6,530 million of net gains from investments in OpenAI against $4,763 million of net losses a year earlier, mainly net recognised gains on its equity method investment. In October 2025 OpenAI formed a public benefit corporation and completed a recapitalization; Microsoft's ownership fell through that transaction and other funding activity, and it recorded dilution gains. Microsoft holds an equity method interest of about 25% as converted and measures its share of income or loss by the hypothetical liquidation at book value method. Second, net unrealised gains on equity still held rose to $4,391 million from $536 million; the Q4 FY2026 earnings release identifies a $3,200 million Anthropic gain in that quarter. Third, net gains on derivatives were $1,867 million against $(260) million.
None is cash, recurring or operational. Table 2.3 removes all three, and the same items in earlier years, at each year's tax rate. It is the report's reference for GAAP against core earnings, used rather than restated in Chapters 3 and 9.
| Line | FY2022 | FY2023 | FY2024 | FY2025 | FY2026 |
|---|---|---|---|---|---|
| Operating income (GAAP) | 83,383 | 88,523 | 109,433 | 128,528 | 155,237 |
| Other income (expense), net | 333 | 788 | (1,646) | (4,901) | 10,697 |
| Income before income taxes (GAAP) | 83,716 | 89,311 | 107,787 | 123,627 | 165,934 |
| Remove net (gains) losses on investments in OpenAI | n/a | n/a | 1,482 | 4,763 | (6,530) |
| Remove unrealised gains on equity investments still held | (509) | (303) | (146) | (536) | (4,391) |
| Remove net gains (losses) on derivatives | 52 | 456 | 187 | 260 | (1,867) |
| Core pretax income | 83,259 | 89,464 | 109,310 | 128,114 | 153,146 |
| Effective tax rate applied (%) | 13.1 | 19.0 | 18.2 | 17.6 | 19.4 |
| Core net income | 72,341 | 72,485 | 89,416 | 105,566 | 123,436 |
| Net income (GAAP) | 72,738 | 72,361 | 88,136 | 101,832 | 133,749 |
| Core diluted EPS ($) | 9.59 | 9.70 | 11.97 | 14.14 | 16.56 |
| Diluted EPS (GAAP) ($) | 9.65 | 9.68 | 11.80 | 13.64 | 17.95 |
| Core diluted EPS growth (%) | n/a | 1.1 | 23.4 | 18.1 | 17.1 |
| Diluted EPS growth (GAAP) (%) | n/a | 0.3 | 21.9 | 15.6 | 31.6 |
The OpenAI removal line uses the figures in the Item 7 Non-GAAP Financial Measures table of the FY2026 10-K, accession 0001193125-26-323660: $6,530 million in FY2026, $4,763 million in FY2025 and $1,482 million in FY2024. Note 3 of the same filing states the FY2026 and FY2025 amounts in rounded form as $6.5 billion and $4.8 billion. The filed Item 7 figures are used because the tax effect Microsoft discloses, $1,567 million in FY2026, reconciles against them exactly: $6,530 million less $1,567 million is the $4,963 million after tax adjustment in Chapter 3, Table 3.3.
Three EPS growth rates for FY2026 are defensible and they differ by 15 points. GAAP is 31.6%. Microsoft's own adjusted measure, which removes only the OpenAI result and reports $128,786 million of net income and $17.28 of diluted EPS, is 22%. Core earnings as defined above, which also remove the equity marks and derivative gains, give 17.1%. The core figure sits below operating income growth of 20.8%, so on a clean read FY2026 earnings grew slightly slower than operating profit. The FY2025 cross check supports the method: core EPS of $14.14 is within one cent of Microsoft's adjusted $14.13 for that year, because the equity marks and derivative results were small in FY2025.
OpenAI is not separately disclosed in other income for FY2022 or FY2023. Other, net was $(32) million and $(223) million in those years, so the omission is immaterial to the series. The line reads n/a rather than zero.
| Component | FY2022 | FY2023 | FY2024 | FY2025 | FY2026 |
|---|---|---|---|---|---|
| Interest and dividends income | 2,094 | 2,994 | 3,157 | 2,647 | 3,301 |
| Interest expense | (2,063) | (1,968) | (2,935) | (2,385) | (3,051) |
| Net recognised gains (losses) on investments | 461 | 260 | (118) | (349) | 4,385 |
| Net gains (losses) on derivatives | (52) | (456) | (187) | (260) | 1,867 |
| Net gains (losses) on foreign currency remeasurements | (75) | 181 | (244) | 171 | (527) |
| Other, net | (32) | (223) | (1,319) | (4,725) | 4,722 |
| Total | 333 | 788 | (1,646) | (4,901) | 10,697 |
| Memo: net (gains) losses on investments in OpenAI | n/a | n/a | (1,482) | (4,763) | 6,530 |
| Memo: unrealised gains on equity still held | 509 | 303 | 146 | 536 | 4,391 |
| Memo: impairments of equity investments | (20) | (20) | (229) | (951) | (152) |
Interest expense rose 27.9% to $3,051 million, primarily on higher finance lease interest, partly offset by higher capitalisation of debt interest. That line is the income statement trace of the leasing set out below.

Grouped column chart in dollars per share, with the gap labelled in each year.
Ratio analysis
| Ratio | FY2022 | FY2023 | FY2024 | FY2025 | FY2026 |
|---|---|---|---|---|---|
| Growth | |||||
| Revenue growth (%) | n/a | 6.9 | 15.7 | 14.9 | 17.8 |
| Operating income growth (%) | n/a | 6.2 | 23.6 | 17.4 | 20.8 |
| Net income growth (%) | n/a | (0.5) | 21.8 | 15.5 | 31.3 |
| Core net income growth (%) | n/a | 0.2 | 23.4 | 18.1 | 16.9 |
| Margin | |||||
| Gross margin (%) | 68.4 | 68.9 | 69.8 | 68.8 | 67.9 |
| Operating margin (%) | 42.1 | 41.8 | 44.6 | 45.6 | 46.8 |
| Net margin (%) | 36.7 | 34.1 | 36.0 | 36.1 | 40.3 |
| Core net margin (%) | 36.5 | 34.2 | 36.5 | 37.5 | 37.2 |
| Research and development (% revenue) | 12.4 | 12.8 | 12.0 | 11.5 | 10.7 |
| Sales and marketing (% revenue) | 11.0 | 10.7 | 10.0 | 9.1 | 8.0 |
| Share based compensation (% revenue) | 3.8 | 4.5 | 4.4 | 4.3 | 3.7 |
| Effective tax rate (%) | 13.1 | 19.0 | 18.2 | 17.6 | 19.4 |
| Return | |||||
| Return on equity, average (%) | 47.2 | 38.8 | 37.1 | 33.3 | 34.0 |
| Core return on equity, average (%) | n/a | 38.9 | 37.7 | 34.5 | 31.4 |
| Return on assets, average (%) | n/a | 18.6 | 19.1 | 18.0 | 19.4 |
| Return on invested capital, average (%) | n/a | 28.6 | 29.3 | 27.4 | 25.5 |
| Leverage | |||||
| Total debt including finance leases ($m) | 64,683 | 64,304 | 72,082 | 89,323 | 106,888 |
| Net cash (net debt) ($m) | 40,074 | 46,958 | 3,461 | 5,242 | (30,045) |
| Debt to equity (x) | 0.39 | 0.31 | 0.27 | 0.26 | 0.24 |
| Debt to EBITDA (x) | 0.66 | 0.63 | 0.55 | 0.57 | 0.55 |
| Interest cover (x) | 40.4 | 45.0 | 37.3 | 53.9 | 50.9 |
| Liabilities to assets (%) | 54.4 | 49.9 | 47.6 | 44.5 | 41.7 |
| Liquidity | |||||
| Current ratio (x) | 1.78 | 1.77 | 1.27 | 1.35 | 1.23 |
| Quick ratio (x) | 1.57 | 1.54 | 1.06 | 1.16 | 0.93 |
| Cash and short term investments ($m) | 104,757 | 111,262 | 75,543 | 94,565 | 76,843 |
| Efficiency | |||||
| Asset turnover, average (x) | n/a | 0.55 | 0.53 | 0.50 | 0.48 |
| Property and equipment turnover (x) | 2.66 | 2.22 | 1.81 | 1.37 | 1.06 |
| Days sales outstanding | 81.5 | 83.9 | 84.8 | 90.6 | 89.0 |
| Unearned revenue days | 83.8 | 87.7 | 85.7 | 83.6 | 80.3 |
| Cash | |||||
| Operating cash flow margin (%) | 44.9 | 41.3 | 48.4 | 48.3 | 55.1 |
| Free cash flow margin (%) | 32.9 | 28.1 | 30.2 | 25.4 | 20.2 |
| Capital expenditure (% revenue) | 12.0 | 13.3 | 18.1 | 22.9 | 34.9 |
| Capital expenditure (% operating cash flow) | 26.8 | 32.1 | 37.5 | 47.4 | 63.4 |
| Depreciation and amortisation (% revenue) | 7.3 | 6.5 | 8.6 | 10.4 | 11.6 |
| Buybacks and dividends (% free cash flow) | 78.0 | 70.7 | 52.7 | 59.4 | 72.7 |
Return on equity of 34.0% is 13 points below FY2022 and the decline is structural: equity grew at a 27.6% compound rate over four years as retained earnings accumulated faster than distributions, while buybacks and dividends absorbed 72.7% of free cash flow in FY2026 against 78.0% in FY2022. Return on invested capital, which is insensitive to the equity build in the way return on equity is not, fell to 25.5% from 29.3% in FY2024, because invested capital grew 61.3% over two years to $549,275 million while net operating profit after tax grew 39.8%. Property and equipment turnover fell from 2.66x to 1.06x over four years. Liquidity tightened: the quick ratio fell below 1.00x for the first time, to 0.93x.

Dual line chart of capital expenditure as a percent of revenue and as a percent of operating cash flow.

Grouped column chart in $ millions.

Line chart in percent, all on average balances.
Leverage and the capital cycle
| Line | FY2022 | FY2023 | FY2024 | FY2025 | FY2026 |
|---|---|---|---|---|---|
| Property and equipment, net | 74,398 | 95,641 | 135,591 | 204,966 | 313,076 |
| Total assets | 364,840 | 411,976 | 512,163 | 619,003 | 758,376 |
| Long term debt including current portion | 49,781 | 47,237 | 44,937 | 43,151 | 40,294 |
| Finance lease liabilities | 14,902 | 17,067 | 27,145 | 46,172 | 66,594 |
| Operating lease liabilities | 13,717 | 15,137 | 19,077 | 22,861 | 21,925 |
| Total debt including finance leases | 64,683 | 64,304 | 72,082 | 89,323 | 106,888 |
| Cash and short term investments | 104,757 | 111,262 | 75,543 | 94,565 | 76,843 |
| Net cash (net debt) | 40,074 | 46,958 | 3,461 | 5,242 | (30,045) |
| Stockholders' equity | 166,542 | 206,223 | 268,477 | 343,479 | 442,387 |
| Capital expenditure | 23,886 | 28,107 | 44,477 | 64,551 | 115,948 |
Bond debt fell every year, from $49,781 million to $40,294 million. Total debt still rose 65.3% because finance lease liabilities more than quadrupled, from $14,902 million to $66,594 million, now 62.3% of total debt. Net cash of $40,074 million in FY2022 is net debt of $(30,045) million in FY2026. Coverage remains undemanding at 0.55x debt to EBITDA and 50.9x interest cover, so the constraint is reinvestment. Chapter 3 shows how much of the commitment never reaches the cash flow statement, Chapter 4 places the intensity against peers, and Chapter 8 records Item 1A now naming capital availability as a risk.
Capital returned to shareholders in FY2026 was $48,716 million, $22,271 million of stock repurchased and $26,445 million of dividends paid, 72.7% of free cash flow and 42.0% of capital expenditure. Repurchases under the programme approved 2024-09-16 were $16,719 million on 36 million shares, the narrower measure in the equity note.

Grouped column chart in $ millions with the net cash or net debt position labelled per year.
Segments
| Segment | Line | FY2024 | FY2025 | FY2026 |
|---|---|---|---|---|
| Productivity and Business Processes | Revenue | 106,820 | 120,810 | 139,996 |
| Operating income | 59,661 | 69,773 | 83,879 | |
| Operating margin (%) | 55.9 | 57.8 | 59.9 | |
| Intelligent Cloud | Revenue | 87,464 | 106,265 | 137,791 |
| Cost of revenue | 29,611 | 40,171 | 57,876 | |
| Operating income | 37,813 | 44,589 | 56,972 | |
| Gross margin (%) | 66.1 | 62.2 | 58.0 | |
| Operating margin (%) | 43.2 | 42.0 | 41.3 | |
| More Personal Computing | Revenue | 50,838 | 54,649 | 54,052 |
| Operating income | 11,959 | 14,166 | 14,386 | |
| Operating margin (%) | 23.5 | 25.9 | 26.6 | |
| Total | Revenue | 245,122 | 281,724 | 331,839 |
| Operating income | 109,433 | 128,528 | 155,237 |
Intelligent Cloud grew revenue 29.7% and cost of revenue 44.1%, which is where the consolidated gross margin decline originates: segment gross margin fell 8.1 points over two years, to 58.0%. Productivity and Business Processes carried the group margin instead, adding 4.0 points of operating margin over two years to 59.9% on 15.9% revenue growth. More Personal Computing revenue fell 1.1% while its operating margin rose 0.7 points, on cost of revenue down 7.0%. The table starts at FY2024 because segment cost of revenue is disclosed only from that year on the realigned basis; segment revenue and operating income are available back to FY2022 on the current basis and appear in Chapter 1, Table 1.2.
3 MD&A & Management Commentary
Management tells one story in FY2026, in two halves. Revenue grew 18% and operating income 21%, both attributed to Microsoft Cloud, inside which Azure grew 41%. Against that, the FY2026 10-K states the AI build will continue to increase operating costs and may decrease operating margins, and on the 2026-07-29 earnings call the chief financial officer said demand still exceeds available capacity. The stock question is whether revenue keeps compounding faster than the capital base. Additions to property and equipment reached $115,948 million, 34.9% of revenue against 22.9% a year earlier, while reported net income growth of 31% falls to 22% under the company's own OpenAI adjustment.
All 10-K, 10-Q and 8-K content here comes through the SEC-API.io MCP server. Earnings call quotations are Microsoft investor material from Microsoft Investor Relations, outside EDGAR, and labelled as such wherever used.
The trends management names
| Trend as management states it | Figure management attaches | Source | Date |
|---|---|---|---|
| Microsoft Cloud is the engine of company growth | Microsoft Cloud revenue increased 27% to $214.4 billion | 10-K Item 7, Overview | 2026-07-29 |
| Commercial backlog is building far faster than revenue | Commercial remaining performance obligation increased 84% to $678 billion | 10-K Item 7, Overview | 2026-07-29 |
| Azure demand is broad and still running ahead of supply | Azure and other cloud services revenue grew 41% | 10-K Item 7, Segment Results | 2026-07-29 |
| Copilot lifts revenue per user in the Microsoft 365 base | Microsoft 365 Commercial cloud revenue grew 17%, seats grew 6% | 10-K Item 7, Segment Results | 2026-07-29 |
| AI infrastructure investment compresses cloud gross margin | Microsoft Cloud gross margin percentage decreased to 66% | 10-K Item 7, Fiscal Year 2026 Compared with 2025 | 2026-07-29 |
| Consumer hardware is in retreat | XBOX hardware revenue decreased 29%, XBOX content and services decreased 5% | 10-K Item 7, More Personal Computing | 2026-07-29 |
| Headcount is falling while compute spend rises | Total company headcount declined year on year | 10-Q Part I Item 2, Q3 FY2026 | 2026-04-29 |
| The AI revenue base is now material on its own | "Our AI business surpassed an annual revenue run rate of $37 billion" (Satya Nadella), up 123% year on year | 8-K Exhibit 99.1 | 2026-04-29 |
| Azure crossed a franchise threshold | "This year, Azure revenue surpassed $100 billion for the first time, and Microsoft 365 Copilot reached over 30 million paid seats" (Satya Nadella) | 8-K Exhibit 99.1 | 2026-07-29 |
| Available capacity is the binding constraint | "Customer demand continues to exceed available capacity" (Amy Hood) | Q4 FY2026 earnings call, company investor material | 2026-07-29 |
| Physical capacity is set to roughly double | "We added another gigawatt of capacity this quarter and remain on track to roughly double our overall capacity in just two years" (Satya Nadella) | Q4 FY2026 earnings call, company investor material | 2026-07-29 |
| Currency helped the reported line | Revenue and operating income both included a favourable foreign currency impact of 2% | 10-K Item 7, Fiscal Year 2026 Compared with 2025 | 2026-07-29 |
What the reported numbers show
| Line | FY2026 | FY2025 | Change stated by management |
|---|---|---|---|
| Revenue | 331,839 | 281,724 | 18% |
| Gross margin | 225,465 | 193,893 | 16% |
| Operating income | 155,237 | 128,528 | 21% |
| Net income | 133,749 | 101,832 | 31% |
| Diluted earnings per share | 17.95 | 13.64 | 32% |
| Adjusted net income, a non GAAP measure | 128,786 | 105,452 | 22% |
| Adjusted diluted EPS, a non GAAP measure | 17.28 | 14.13 | 22% |
Source: FY2026 Form 10-K, Item 7, accession 0001193125-26-323660.
Gross margin fell from 68.8% to 67.9%, a decline of 0.9 points, which the MD&A calls a slight decrease. Operating margin rose from 45.6% to 46.8% because operating expenses grew 7% against revenue growth of 18%, taking them from 23.2% to 21.2% of revenue.
| Line | FY2026 | FY2025 | FY2024 |
|---|---|---|---|
| Other income (expense), net | 10,697 | (4,901) | (1,646) |
| Net (gains) losses from investments in OpenAI | (6,530) | 4,763 | 1,482 |
| Adjusted other income (expense), net, non GAAP | 4,167 | (138) | (164) |
| Net income | 133,749 | 101,832 | 88,136 |
| Net (gains) losses from investments in OpenAI, net of tax | (4,963) | 3,620 | 1,126 |
| Adjusted net income, non GAAP | 128,786 | 105,452 | 89,262 |
| Diluted EPS | 17.95 | 13.64 | 11.80 |
| Adjusted diluted EPS, non GAAP | 17.28 | 14.13 | 11.95 |
Source: FY2026 Form 10-K, Item 7, Non-GAAP Financial Measures, accession 0001193125-26-323660. The tax effect on the OpenAI adjustment was $1,567 million in FY2026 and $(1,143) million in FY2025.
This is management's own bridge, removing one item. Chapter 2, Table 2.3 carries the wider reconciliation that also removes the equity marks and derivative gains, leaving core EPS growth of 17.1%. The MD&A states the FY2026 gain primarily relates to the dilution gain from the OpenAI Recapitalization, a noncash consequence of dilution at a higher implied valuation. A reader anchoring on the 32% diluted EPS headline is reading an equity method mark of $4,963 million after tax.
Segment results and the drivers management assigns
| Segment | FY2026 revenue | FY2025 revenue | Change | FY2026 operating income | FY2025 operating income | Change |
|---|---|---|---|---|---|---|
| Productivity and Business Processes | 139,996 | 120,810 | 16% | 83,879 | 69,773 | 20% |
| Intelligent Cloud | 137,791 | 106,265 | 30% | 56,972 | 44,589 | 28% |
| More Personal Computing | 54,052 | 54,649 | (1)% | 14,386 | 14,166 | 2% |
| Total | 331,839 | 281,724 | 18% | 155,237 | 128,528 | 21% |
Source: FY2026 Form 10-K, Item 7, Segment Results of Operations, accession 0001193125-26-323660.
| Segment | Growth driver stated | Margin comment stated |
|---|---|---|
| Productivity and Business Processes | Microsoft 365 Commercial products and cloud services revenue increased $14.2 billion or 16%; Copilot and E5 lifted revenue per user; LinkedIn up $2.0 billion or 11%; Dynamics 365 up 18% | Gross margin percentage increased slightly on efficiency gains in Microsoft 365 Commercial cloud, offset in part by AI infrastructure investment |
| Intelligent Cloud | Server products and cloud services revenue increased $31.0 billion or 31%, driven by Azure; server products revenue up only 1% as customers shift to cloud | Cost of revenue rose 44%; gross margin percentage decreased on AI infrastructure investment and mix shift to Azure |
| More Personal Computing | Search advertising revenue up $1.3 billion or 9%; Windows OEM grew 5% with elevated channel inventory; XBOX revenue down $1.7 billion or 7% | Gross margin percentage increased on sales mix shift to higher margin businesses; operating expenses up 6% on XBOX impairment and other related expenses |
Intelligent Cloud added $31,526 million of revenue and $12,383 million of operating income, so 39% of the increment converted. Productivity and Business Processes added $19,186 million of revenue and $14,106 million of operating income, a 74% conversion. Management's growth narrative is Azure; the margin narrative is Microsoft 365.
The quarterly path management reported through the year
| Metric | Q1 | Q2 | Q3 | Q4 | Full year |
|---|---|---|---|---|---|
| Revenue, $ millions | 77,673 | 81,273 | 82,886 | 90,007 | 331,839 |
| Operating income, $ millions | 37,961 | 38,275 | 38,398 | 40,603 | 155,237 |
| Microsoft Cloud revenue, $ billions | 49.1 | 51.5 | 54.5 | 59.3 | 214.4 |
| Commercial RPO, $ billions | 392 | 625 | 627 | 678 | 678 |
| Commercial RPO growth | 51% | 110% | 99% | 84% | 84% |
| Azure and other cloud services growth | 40% | 39% | 40% | 43% | 41% |
| Microsoft 365 Commercial cloud growth | 17% | 17% | 19% | 14% | 17% |
| Microsoft Cloud gross margin percentage | 68% | 67% | 66% | n/a | 66% |
| Windows OEM and Devices growth | 6% | 1% | (2)% | (7)% | slight decline |
| XBOX content and services growth | 1% | (5)% | (5)% | (10)% | (5)% |
| Additions to property and equipment, $ millions | 19,394 | 29,876 | 30,876 | 35,802 | 115,948 |
Sources: Form 10-Q accessions 0001193125-25-256321, 0001193125-26-027207 and 0001193125-26-191507, Part I Item 2; Form 8-K Exhibit 99.1 accessions 0001193125-25-256310, 0001193125-26-027198, 0001193125-26-191457 and 0001193125-26-323632. Q4 Microsoft Cloud gross margin percentage is not disclosed separately in the fourth quarter release; the full year figure is 66%. Q4 Microsoft 365 Commercial cloud growth of 14% is the reported basis; the Q4 release states 16% adjusted for a prior year comparable that benefited from two points of in period revenue recognition.
Backlog growth peaked at 110% in the December quarter and slowed to 84% by June while the absolute number rose, from $392 billion to $678 billion. Azure was the steadiest line in the table, in a 39% to 43% band all four quarters.
Capital intensity and where management's framing and the filings diverge
| Quarter | Cash flow statement, additions to property and equipment, $ millions | Capital expenditures as stated on the earnings call, $ billions |
|---|---|---|
| Q1 | 19,394 | 34.9 |
| Q2 | 29,876 | 37.5 |
| Q3 | 30,876 | 31.9 |
| Q4 | 35,802 | 41.0 |
| Full year | 115,948 | 145.3 |
Cash flow figures come from Form 8-K Exhibit 99.1 for each quarter and the FY2026 Form 10-K. Call figures are investor material from the Microsoft Investor Relations webcasts of 2025-10-29, 2026-01-28, 2026-04-29 and 2026-07-29; the full year of $145.3 billion sums the four quarterly figures management stated; management published no full year total.
The two measures reconcile. The capital expenditure number management cites on the call includes finance leases, which the cash flow statement does not. The gap of $29.4 billion for FY2026 is the portion that never appears in the investing section of the cash flow statement. A reader tracking only the cash flow line understates the commitment by roughly a fifth. The FY2026 contractual obligations table makes the same point: operating and finance leases including imputed interest total $443,506 million, purchase commitments $194,060 million and construction commitments $34,566 million, against long term debt principal of only $46,136 million. Microsoft is financing the AI build through leases and purchase commitments, which Chapter 2, Table 2.6 traces onto the balance sheet.
| Line | FY2026 | FY2025 |
|---|---|---|
| Cash from operations | 182,935 | 136,162 |
| Additions to property and equipment | 115,948 | 64,551 |
| Operating cash flow less capital additions, derived | 66,987 | 71,611 |
| Share repurchases under the programme | 16,719 | 13,000 |
| Common stock repurchased, cash flow statement | 22,271 | 18,420 |
| Dividends declared | 27,000 | 24,700 |
| Dividends paid, cash flow statement | 26,445 | 24,082 |
Item 7 states cash from operations as $182.9 billion in FY2026, the rounded form of the $182,935 million in the cash flow statement, up $46.8 billion. Dividends declared are the rounded amounts in Item 7; dividends paid and common stock repurchased are cash flow statement lines. Operating cash flow less capital additions is derived for this report.
Cash from operations rose 34% and the residual after capital additions still fell $4.6 billion. Management does not present this comparison, only the operating cash flow increase.
In three places management's framing and the reported numbers point in different directions. In each case the company discloses the reconciling item itself.
On backlog, the Overview leads with commercial remaining performance obligation up 84% to $678 billion. On the fourth quarter call the chief financial officer stated RPO rose 25% excluding OpenAI. Both are true. The headline rate is dominated by one counterparty, the second describes the rest of the base. Chapter 5 shows the quarter of that step.
On related party revenue, Note 1 of the FY2026 10-K discloses $24.1 billion of revenue from commercial arrangements with OpenAI, set out in Chapter 1. The MD&A discussion of Azure growth does not separate this revenue, so the disclosed 41% Azure growth rate is not decomposed between the related party and the rest of the customer base anywhere in Item 7.
On gross margin language, the MD&A calls the company gross margin decline slight, which the 0.9 point move supports. Management's own Microsoft Cloud gross margin moved from 68% in the first quarter to 66% for the year, a two point decline inside twelve months, and the fourth quarter call put company gross margin at 67% and attributed the decline to the sales mix shift to Azure. The mix that drives revenue growth is the mix that drives margin down.
Risks management flags itself
| Risk as management states it | Exposure evidenced elsewhere in the filings |
|---|---|
| Cloud and AI infrastructure investment will continue to increase operating costs and may decrease operating margins | Cost of revenue rose 21% against revenue growth of 18%; Intelligent Cloud cost of revenue rose 44% |
| Datacenters depend on permitted and buildable land, predictable energy, networking supplies, and servers, including graphics processing units | Construction commitments of $34,566 million and purchase commitments of $194,060 million at 30 June 2026 |
| Some products contain certain components for which there are very few qualified suppliers | Q4 discrete items include the impact of higher component pricing, per the 2026-07-29 earnings call |
| Success is highly dependent on the ability to attract and retain qualified employees | Total company headcount declined year on year for both the third quarter and the nine months to 2026-03-31, per the Q3 10-Q |
| Changes in foreign exchange rates may significantly affect revenue and expenses | Revenue and operating income each carried a favourable 2% currency impact in FY2026 |
| Trade policy, tariffs and export controls could result in increased supply chain challenges, cost volatility, and consumer and economic uncertainty | No amount quantified in Item 7 |
| Transfer pricing dispute with the IRS for tax years 2004 to 2013 | The IRS is seeking an additional tax payment of $28.9 billion plus penalties and interest; Microsoft states it will vigorously contest the notices of proposed adjustment |
The IRS matter is the only risk in Item 7 with a quantified downside attached, and at $28.9 billion before penalties and interest it is 21.6% of FY2026 net income. Management states that allowances for income tax contingencies are adequate as of 30 June 2026. Chapter 8 covers what changed in Item 1A, which is a wider and more recently rewritten set.
What management guided to next
Guidance comes on the earnings call. The 8-K releases point only to the call and webcast.
| Item | Statement |
|---|---|
| Azure growth, next quarter | "we expect revenue growth of approximately 45% in constant currency" |
| Capital expenditure, next quarter | "We expect CapEx spend will be over $50 billion including the lease reclassification impact from the useful life update" |
| Full year revenue and operating income | Another fiscal year of double digit revenue and operating income growth |
| Full year operating margin | "full fiscal year operating margins should be down less than 1 point" |
| Capacity | "Customer demand continues to exceed available capacity" |
September 2026 guidance is Azure accelerating to about 45% in constant currency while capital expenditure rises above $50 billion, against $115,948 million for all FY2026. On the company's framing, growth is supply limited and the answer is capital. FY2027 operating margin is guided down less than a point, against 1.2 points of expansion in FY2026.
4 Sector & Competitor Analysis
Microsoft leads this peer set on revenue growth and operating margin. It grew revenue 17.8% in FY2026, the fastest of the seven, and held a 46.8% operating margin, the highest of the seven. No other company in the set clears 15% growth and 40% margin at once, and Alphabet comes closest at 15.1% and 32.0%. The cost of holding that position is on the balance sheet. Microsoft spent 34.9% of revenue on property and equipment, $115,948 million, 63.4% of its operating cash flow, and asset turnover has fallen to 0.48x. Return on equity of 34.0% trails Oracle at 54.3% and IBM at 35.3%, but both are levered outcomes: Oracle carries $6.16 of assets per dollar of parent equity and IBM $4.65, against $1.71 at Microsoft. On return on assets, which strips the leverage out, Microsoft ranks second at 19.4% behind Alphabet at 25.3%. Research intensity is 10.7% of revenue, the lowest of the six companies reporting a research line.
The sector
Demand is set by two spending pools that behave differently. Enterprise software grows in the mid teens at software gross margins. Data centre systems grows above 50% and consumes capital. Microsoft sells into the first and funds the second.
| Segment | 2025 spending ($bn) | 2025 growth (%) | 2026 forecast ($bn) | 2026 forecast growth (%) |
|---|---|---|---|---|
| Software | 1,271 | 13.9 | 1,468 | 15.5 |
| Data centre systems | 506 | 51.6 | 822 | 62.5 |
| Total worldwide IT | 5,577 | n/a | 6,369 | 14.2 |
Source: Gartner press release, 2026-07-27.
Cloud infrastructure is the contested part. Global cloud infrastructure spending reached $110.9 billion in Q4 2025, up 29% year on year, the sixth straight quarter above 20% growth, and forecast to grow 27% in 2026 (Omdia, March 2026). It is a three firm oligopoly with a long tail. Microsoft holds the number two share and grows faster than the leader.

| Vendor | Share of global spending (%) | Revenue growth year on year (%) |
|---|---|---|
| Amazon Web Services | 32 | 24 |
| Microsoft Azure | 22 | 39 |
| Google Cloud | 12 | 50 |
| All others | 34 | n/a |
Source: Omdia, March 2026.
Three forces set margins in this sector. Scale in capacity matters, because a data centre serves a fixed cost base that amortises over utilisation. Switching cost in the software estate matters, because seats and licences renew. Supply of accelerator silicon and power sets the floor under unit cost and the ceiling under how fast capacity converts to revenue. Microsoft is exposed to all three. Its 67.9% gross margin sits between the pure software peers, Salesforce at 77.7% and SAP at 72.9%, and the infrastructure heavy peers, Alphabet at 59.7% and Amazon at 50.3%.
Peer set and selection rule
The peer set competes with Microsoft for the same enterprise IT budget and files with the SEC: the three hyperscale cloud vendors, Microsoft, Alphabet and Amazon, and the four largest enterprise application and platform vendors filing a 10-K or 20-F, Oracle, SAP, IBM and Salesforce. Four of the seven, including Microsoft, share SIC code 7372, prepackaged software. Alphabet files under 7370, Amazon under 5961 and IBM under 3570, so SIC alone does not define the set.
| Ticker | Company | Form | Fiscal year end | Period used | Currency | Accession number |
|---|---|---|---|---|---|---|
| MSFT | Microsoft Corporation | 10-K | 30 June | FY2026 ended 2026-06-30 | USD | 0001193125-26-323660 |
| GOOGL | Alphabet Inc. | 10-K | 31 December | FY2025 ended 2025-12-31 | USD | 0001652044-26-000018 |
| AMZN | Amazon.com, Inc. | 10-K | 31 December | FY2025 ended 2025-12-31 | USD | 0001018724-26-000004 |
| ORCL | Oracle Corporation | 10-K | 31 May | FY2026 ended 2026-05-31 | USD | 0001193125-26-277521 |
| CRM | Salesforce, Inc. | 10-K | 31 January | FY2026 ended 2026-01-31 | USD | 0001108524-26-000060 |
| SAP | SAP SE | 20-F | 31 December | FY2025 ended 2025-12-31 | EUR | 0001104659-26-020058 |
| IBM | International Business Machines Corporation | 10-K | 31 December | FY2025 ended 2025-12-31 | USD | 0000051143-26-000010 |
Microsoft's FY2026 closes six months after the December reporters and one month after Oracle's. In a market growing 29% year on year, Microsoft's window captures two quarters the others do not. Growth rates in Table 4.3 are therefore not on one calendar window. Margins, returns and intensity ratios are computed inside one fiscal year each and do compare. SAP reports in euro under IFRS, so its revenue compares only in ratio.
The comparison
| Ticker | Period | Ccy | Revenue (m) | Growth (%) | 2yr CAGR (%) | Gross margin (%) | Operating margin (%) | Net margin (%) | Return on equity (%) | Return on assets (%) | Leverage (x) | Capex / revenue (%) | R&D / revenue (%) |
|---|---|---|---|---|---|---|---|---|---|---|---|---|---|
| MSFT | FY2026 to 2026-06-30 | USD | 331,839 | 17.8 | 16.4 | 67.9 | 46.8 | 40.3 | 34.0 | 19.4 | 1.71 | 34.9 | 10.7 |
| GOOGL | FY2025 to 2025-12-31 | USD | 402,836 | 15.1 | 14.5 | 59.7 | 32.0 | 32.8 | 35.7 | 25.3 | 1.43 | 22.7 | 15.2 |
| AMZN | FY2025 to 2025-12-31 | USD | 716,924 | 12.4 | 11.7 | 50.3 | 11.2 | 10.8 | 22.3 | 10.8 | 1.99 | 18.4 | n/a |
| ORCL | FY2026 to 2026-05-31 | USD | 67,357 | 17.3 | 12.8 | 65.8 | 30.6 | 25.4 | 54.3 | 7.9 | 6.16 | 82.6 | 15.3 |
| CRM | FY2026 to 2026-01-31 | USD | 41,525 | 9.6 | 9.1 | 77.7 | 20.1 | 18.0 | 12.4 | 6.9 | 1.90 | 1.4 | 14.4 |
| SAP | FY2025 to 2025-12-31 | EUR | 36,800 | 7.7 | 8.6 | 72.9 | 26.1 | 19.5 | 15.9 | 9.9 | 1.58 | 2.0 | 18.0 |
| IBM | FY2025 to 2025-12-31 | USD | 67,535 | 7.6 | 4.5 | 58.2 | 17.5 | 15.7 | 35.3 | 7.3 | 4.65 | 1.6 | 12.3 |
Definitions apply identically across the set. Growth is against the same company's prior fiscal year. Return on equity is net income over the average of opening and closing equity attributable to the parent. Return on assets is net income over average total assets. Leverage is closing total assets over closing parent equity. Capital intensity is cash paid for property and equipment over revenue. Research intensity is the reported research and development expense over revenue.
Six definitional differences apply to the table. Each is stated so the cell is read correctly, and none is adjusted:
- Alphabet gross margin is revenues less cost of revenues, including traffic acquisition cost. No subtotal is reported.
- Amazon cost of sales excludes fulfilment and technology and infrastructure, so its 50.3% gross margin is overstated.
- Oracle gross margin is derived as revenue less cloud and licence, hardware and services expenses, which excludes amortisation of intangibles of $1,671 million. No gross profit subtotal is reported.
- IBM operating margin is derived as gross profit less selling, general and administrative expense less research and development plus intellectual property and custom development income. IBM reports no operating income subtotal.
- Amazon reports no research and development line. Its technology and infrastructure line mixes research with running the platform, so the cell reads n/a.
- IBM capital intensity of 1.6% covers the property and equipment line only. IBM also spent $647 million on software purchased and internally developed, which lifts it to 2.6%. Every other company in the set reports one such line.

Each ticker at revenue growth against operating margin, bubble sized by revenue.
| Ticker | Growth (%) | Operating margin (%) | Revenue (m) | Ccy |
|---|---|---|---|---|
| MSFT | 17.8 | 46.8 | 331,839 | USD |
| GOOGL | 15.1 | 32.0 | 402,836 | USD |
| AMZN | 12.4 | 11.2 | 716,924 | USD |
| ORCL | 17.3 | 30.6 | 67,357 | USD |
| CRM | 9.6 | 20.1 | 41,525 | USD |
| SAP | 7.7 | 26.1 | 36,800 | EUR |
| IBM | 7.6 | 17.5 | 67,535 | USD |
Microsoft occupies the top right corner alone. The peer median is 12.4% growth and 26.1% operating margin. Microsoft clears the median by 5.4 points on growth and 20.7 points on margin.

| Ticker | Capex / revenue (%) | Capex (m) | Capex / operating cash flow (%) | Ccy |
|---|---|---|---|---|
| ORCL | 82.6 | 55,663 | 174.1 | USD |
| MSFT | 34.9 | 115,948 | 63.4 | USD |
| GOOGL | 22.7 | 91,447 | 55.5 | USD |
| AMZN | 18.4 | 131,819 | 94.5 | USD |
| SAP | 2.0 | 739 | 8.1 | EUR |
| IBM | 1.6 | 1,091 | 8.3 | USD |
| CRM | 1.4 | 594 | 4.0 | USD |
The set splits in two. Four companies build capacity, three rent it. Oracle spends $1.74 of capital for every dollar of operating cash flow and funds the gap with debt, which is why its leverage reads 6.16x. Microsoft funds its build inside operating cash flow with 36.6% of that cash flow left over. Amazon is close to the limit at 94.5%. The three renters convert almost all operating cash flow to free cash flow and post the weakest growth in the set, between 7.6% and 9.6%.

| Ticker | Net margin (%) | Asset turnover (x) | Leverage (x) | Return on equity (%) | Return on assets (%) |
|---|---|---|---|---|---|
| ORCL | 25.4 | 0.31 | 6.16 | 54.3 | 7.9 |
| GOOGL | 32.8 | 0.77 | 1.43 | 35.7 | 25.3 |
| IBM | 15.7 | 0.47 | 4.65 | 35.3 | 7.3 |
| MSFT | 40.3 | 0.48 | 1.71 | 34.0 | 19.4 |
| AMZN | 10.8 | 0.99 | 1.99 | 22.3 | 10.8 |
| SAP | 19.5 | 0.51 | 1.58 | 15.9 | 9.9 |
| CRM | 18.0 | 0.39 | 1.90 | 12.4 | 6.9 |
The three factors approximate return on equity rather than equal it, because return on equity and asset turnover use average balances while leverage uses the closing balance sheet. Oracle's 54.3% return on equity is built from the lowest asset turnover in the set, 0.31x, multiplied by the highest leverage, 6.16x. IBM's 35.3% is the same mechanism. Microsoft's 34.0% comes from the highest net margin in the set, 40.3%, on the second lowest leverage. An investor paying for durable returns rather than balance sheet structure should weight return on assets, where Microsoft ranks second at 19.4%.
The counterargument is that asset turnover of 0.48x is Microsoft's weakest ratio and is falling as the build lands on the balance sheet. Total assets rose from $619,003 million to $758,376 million in FY2026, up 22.5%, against revenue growth of 17.8%. If capacity revenue lags the asset base for another year, return on assets compresses even with margins intact.
Where the growth is
| Line | Company | Period | Revenue (m) | Prior year (m) | Growth (%) | Segment operating income (m) | Segment margin (%) | Ccy |
|---|---|---|---|---|---|---|---|---|
| Intelligent Cloud segment | Microsoft | FY2026 to 2026-06-30 | 137,791 | 106,265 | 29.7 | 56,972 | 41.3 | USD |
| Microsoft Cloud aggregate | Microsoft | FY2026 to 2026-06-30 | 214,400 | 168,900 | 26.9 | n/a | n/a | USD |
| Amazon Web Services | Amazon | FY2025 to 2025-12-31 | 128,725 | 107,556 | 19.7 | 45,606 | 35.4 | USD |
| Google Cloud | Alphabet | FY2025 to 2025-12-31 | 58,705 | 43,229 | 35.8 | 13,910 | 23.7 | USD |
| Cloud revenues | Oracle | FY2026 to 2026-05-31 | 33,989 | 24,506 | 38.7 | n/a | n/a | USD |
| Cloud subscriptions and support | SAP | FY2025 to 2025-12-31 | 21,023 | 17,141 | 22.6 | n/a | n/a | EUR |
Segment scope differs and the margins are not interchangeable. Microsoft Intelligent Cloud carries server products, on premises licensing, GitHub and consulting alongside Azure, so its 41.3% blends higher margin licence revenue with lower margin capacity. Amazon Web Services is infrastructure only. Google Cloud includes Workspace. The growth column is the comparable one: Google Cloud and Oracle grow fastest off the smallest bases, Microsoft Intelligent Cloud grows 29.7% off a larger base, and Amazon Web Services grows slowest at 19.7% from the largest infrastructure base. Microsoft Intelligent Cloud segment margin fell from 42.0% in FY2025 to 41.3% in FY2026 as capacity cost landed. Amazon Web Services fell further, from 37.0% to 35.4%. Google Cloud moved the other way, from 14.1% to 23.7%.
Valuation anchor
| Ticker | Public float ($m) | Measurement date | Net income (m) | Ccy | Float / net income (x) |
|---|---|---|---|---|---|
| MSFT | 3,600,000 | 2025-12-31 | 133,749 | USD | 26.9 |
| GOOGL | 1,900,000 | 2025-06-30 | 132,170 | USD | 14.4 |
| AMZN | 2,118,061 | 2025-06-30 | 77,670 | USD | 27.3 |
| ORCL | 346,760 | 2026-05-31 | 17,087 | USD | 20.3 |
| CRM | 191,800 | 2025-07-31 | 7,457 | USD | 25.7 |
| SAP | n/a | n/a | 7,161 | EUR | n/a |
| IBM | 274,500 | 2025-06-30 | 10,593 | USD | 25.9 |
Public float is the only market value inside an SEC filing that traces to an accession number. It excludes affiliate holdings and the measurement dates span eleven months, from 2025-06-30 to 2026-05-31, so it anchors valuation at those dates. SAP files Form 20-F and does not tag a public float. On this basis Microsoft is priced mid set at 26.9x, above Oracle at 20.3x and Alphabet at 14.4x, below Amazon at 27.3x. Alphabet's 14.4x is measured six months earlier than Microsoft's, which accounts for part of the gap. Chapter 9 carries the live multiple and the scenarios built on it.
Reading
Microsoft leads the peer set on growth, operating margin and net margin, and is second on return on assets. It lags on research intensity, asset turnover and unlevered simplicity: 34.9% of revenue goes into property and equipment, second only to Oracle, and the asset base grows faster than revenue. The bull case is the 46.8% margin holding while Azure compounds at Microsoft Cloud's 26.9%, in a market Omdia sees growing 27% in 2026. The bear case is Oracle's arithmetic arriving at Microsoft: capital ahead of revenue, turnover falling, and return on assets eroding while the income statement still looks strong. The FY2026 numbers show the first two already happening at Microsoft, and the margin holding.
5 Material Events & Contracts
One contract dominates the twelve months to 2026-09-01. On 2025-10-28 Microsoft signed a new definitive agreement with OpenAI, furnished the same week as Exhibit 99.2 to the 8-K accession 0001193125-25-256310. Commercial remaining performance obligation went from $392 billion at 2025-09-30 to $625 billion at 2025-12-31, a single quarter step of $233 billion against an incremental $250 billion of Azure services OpenAI contracted to buy.
Everything else in the event log is routine. Microsoft filed eight 8-K reports in the window and no 6-K, reporting as a domestic filer. Four were quarterly results under Item 2.02, three board changes under Item 5.02, one the annual meeting vote under Item 5.07. Not one 8-K was filed under Item 1.01, Entry into a Material Definitive Agreement. The OpenAI agreement was furnished under Item 7.01 as a corporate blog post, not filed as an Exhibit 10 material contract, and the FY2026 10-K exhibit index at accession 0001193125-26-323660 lists no Exhibit 10 beyond compensatory plans, an indemnification arrangement and the chief executive's 2014 offer letter. The $250 billion Azure purchase figure appears nowhere in the 10-K. An investor reading only the exhibit index will not find the year's most consequential terms.
The event log
| Filed | Period | Form and item | Event | Accession |
|---|---|---|---|---|
| 2026-07-29 | 2026-07-29 | 8-K, Items 2.02, 9.01 | Q4 FY2026 revenue $90,007 million, up 18%, and FY2026 revenue $331,839 million, up 18%; FY diluted EPS $17.95 GAAP and $17.28 adjusted for OpenAI; commercial backlog $678 billion, up 84%; a $3.2 billion gain on the Anthropic investment and XBOX severance and impairment charges inside a net $0.27 benefit to quarterly EPS against April guidance. | 0001193125-26-323632 |
| 2026-06-05 | 2026-06-02 | 8-K, Item 5.02 | Reid Hoffman, a director since 2017, will not stand for reelection at the 2026 annual meeting. The filing states no disagreement with management. | 0001193125-26-258667 |
| 2026-05-14 | 2026-05-13 | 8-K, Items 5.02, 9.01 | Board appointed Carmine Di Sibio a director effective 2026-05-13, to serve on the Audit Committee and the Compensation Committee, on standard nonemployee director pay and the standard indemnification agreement. | 0001193125-26-224155 |
| 2026-04-29 | 2026-03-31 | 8-K, Items 2.02, 9.01 | Q3 FY2026 revenue $82,886 million, up 18%; operating income $38,398 million, up 20%; diluted EPS $4.27 with an OpenAI adjustment of $14 million; commercial backlog $627 billion, up 99%; AI revenue run rate $37 billion, up 123%. | 0001193125-26-191457 |
| 2026-01-28 | 2025-12-31 | 8-K, Items 2.02, 9.01 | Q2 FY2026 revenue $81,273 million, up 17%; GAAP diluted EPS $5.16, up 60%, against $4.14 adjusted, the $1.02 gap being the OpenAI recapitalization dilution gain of $7,583 million after tax; commercial backlog $625 billion, up 110%. | 0001193125-26-027198 |
| 2025-12-08 | 2025-12-05 | 8-K, Items 5.02, 5.07 | 2025 annual meeting elected all 12 director nominees, approved say on pay with 91.94% for, ratified Deloitte & Touche LLP, and approved the 2026 Stock Plan with 97.07% for. All six shareholder proposals failed; the strongest, on data operations in human rights hotspots, drew 27.48%. | 0001193125-25-311196 |
| 2025-10-29 | 2025-10-28 | 8-K, Items 2.02, 7.01, 9.01 | Q1 FY2026 revenue $77,673 million, up 18%, and a blog furnished as Exhibit 99.2 setting out the new definitive OpenAI agreement: a roughly 27% as converted stake in OpenAI Group PBC valued near $135 billion, IP rights extended to 2032, Azure API exclusivity until AGI, an incremental $250 billion Azure purchase commitment from OpenAI, and the end of Microsoft's right of first refusal on OpenAI compute. | 0001193125-25-256310 |
| 2025-09-30 | 2025-09-24 | 8-K, Item 5.02 | Carlos A. Rodriguez, chair of the Compensation Committee and an Audit Committee member, will not stand for reelection at the 2025 annual meeting. Personal reasons, no disagreement with management. | 0001193125-25-225125 |
What the OpenAI agreement changed
The blog is the only place the terms are disclosed. The 10-K confirms the accounting consequences.
| Term | What Microsoft kept or gained | What Microsoft gave up or extended |
|---|---|---|
| Equity | Roughly 27% of OpenAI Group PBC on an as converted diluted basis after the recapitalization, valued near $135 billion | Down from a 32.5% as converted stake in the OpenAI for profit before the recent funding rounds |
| Model IP | Frontier model partnership retained; IP rights to models and products extended through 2032, now including post AGI models with safety guardrails | Research IP rights end at expert panel verification of AGI or in 2030, whichever comes first; consumer hardware excluded |
| Cloud exclusivity | Azure API exclusivity until AGI; API products OpenAI builds with third parties stay exclusive to Azure | Non API products may run on any cloud; OpenAI may serve US government national security customers on any cloud |
| Compute | OpenAI contracted to purchase an incremental $250 billion of Azure services | Microsoft's right of first refusal to be OpenAI's compute provider removed |
| AGI declaration | Verified by an independent expert panel rather than declared by OpenAI alone | Microsoft may pursue AGI alone or with third parties, subject to compute thresholds if it uses OpenAI IP |
| Revenue share | Continues until the expert panel verifies AGI | Payments spread over a longer period |
| Open weights | n/a | OpenAI may release open weight models meeting capability criteria |
The $250 billion of incremental Azure services has no counterpart in the FY2026 10-K, which does not use the phrases 250 billion, Azure services or right of first refusal. It can be traced only through its effect on commercial remaining performance obligation, which rose $233 billion between 2025-09-30 and 2025-12-31. That $233 billion is a net figure across the whole commercial book, so the two cannot be tied exactly. The $250 billion is furnished under Item 7.01 and is unaudited.
The financial signature of one contract
Backlog and committed capacity moved together through FY2026. The lease commitments are the supply side of the same buildout that the backlog funds. Chapter 1 sets out what commercial remaining performance obligation is and how much of it converts inside twelve months; this table shows when it arrived.
| Balance date | Total remaining performance obligation | Commercial remaining performance obligation | Growth in commercial backlog (%) | Leases signed but not yet commenced |
|---|---|---|---|---|
| 2025-09-30 | 398 | 392 | 51 | 106.2 |
| 2025-12-31 | 631 | 625 | 110 | 155.1 |
| 2026-03-31 | 633 | 627 | 99 | 196.6 |
| 2026-06-30 | 684 | 678 | 84 | 329.1 |
The $329.1 billion of leases signed but not commenced at 2026-06-30, primarily for datacenters, will commence between FY2027 and FY2033 on terms of 1 to 20 years. That is more than double the FY2026 capital expenditure of $115,948 million and it sits off balance sheet until each lease starts.
The equity position tells a different story from the headline valuation. Microsoft carries its equity method investments at $12.0 billion at 2026-06-30, up from $6.0 billion a year earlier, against the roughly $135 billion the October blog put on the OpenAI stake. The gap is between hypothetical liquidation at book value accounting and a funding round mark. Ownership as converted was about 25% at 2026-06-30 in the 10-K, against roughly 27% at the October recapitalization, so further dilution ran through the year. That dilution produced the gain Chapter 2 removes from core earnings.
Material contracts
| Counterparty | Subject | Term | Filing it came from |
|---|---|---|---|
| OpenAI Group PBC | Definitive partnership agreement: model IP licence, Azure API exclusivity, revenue share, and an incremental $250 billion Azure purchase commitment from OpenAI | IP rights to 2032; research IP to AGI verification or 2030; revenue share to AGI verification | 8-K 2025-10-29, Exhibit 99.2, 0001193125-25-256310. Not filed as an Exhibit 10. |
| OpenAI Global LLC | Equity method investment, approximately 25% as converted at 2026-06-30, with $13.0 billion of funding commitments and $11.9 billion funded | Open ended | 10-K FY2026 Note 1, 0001193125-26-323660 |
| Datacenter lessors, unnamed in the filing | Operating and finance leases signed but not yet commenced, $329.1 billion, some subject to contractual conditions | Commence FY2027 to FY2033, terms 1 to 20 years | 10-K FY2026 Note 13, 0001193125-26-323660 |
| Plan participants | Microsoft Corporation 2026 Stock Plan, replacing the 2017 Stock Plan in its entirety | Approved by shareholders 2025-12-05 | Exhibit 10.8, 10-Q for period 2026-03-31 filed 2026-04-29, 0001193125-26-191507 |
| Plan participants | Form of Stock Award Agreement under the 2026 Stock Plan | Follows the plan | Exhibit 10.9, 10-Q 0001193125-26-191507 |
| Executive officers | Microsoft Corporation Executive Incentive Plan, restated | Annual cycles | Exhibit 10.10, 10-Q 0001193125-26-191507 |
| Nonemployee directors | Microsoft Corporation Deferred Compensation Plan for Non-Employee Directors, restated | Open ended | Exhibit 10.13, 10-Q 0001193125-26-191507 |
| The Bank of New York Mellon Trust Company, N.A. | Amended and restated officers' and directors' indemnification trust agreements | Open ended | Exhibits 10.15 and 10.16, incorporated from 10-K FY2025, 0000950170-25-100235 |
| Satya Nadella | Chief executive offer letter dated 2014-02-03 | Open ended | Exhibit 10.17, incorporated from 8-K filed 2014-02-04 |
| Carmine Di Sibio | Standard Microsoft director indemnification agreement on appointment to the board | Open ended | 8-K 2026-05-14, 0001193125-26-224155 |
| The Bank of New York Mellon Trust Company, N.A. and U.S. Bank, N.A., as trustees | Base indenture of 2009 and fifteen supplemental indentures, plus four Activision Blizzard indentures assumed in 2023 | Notes maturing 2026 to 2062 | Exhibits 4.1 to 4.23, all incorporated by reference; no new supplemental indenture in the window |
Two observations follow. Microsoft filed no new debt exhibit in the twelve months, so the fifteenth supplemental indenture of 2023-11-06 remains the latest public bond documentation while finance leases carried the capacity growth. The only Exhibit 10 items refreshed in the year are the four compensatory plans filed with the Q3 FY2026 10-Q on 2026-04-29, after approval of the 2026 Stock Plan on 2025-12-05 and the four S-8 registrations filed 2025-12-30.
Capital return and legal exposure
No 8-K reported the capital return. The board declared $0.91 a share each quarter of FY2026, first on 2025-09-15, for $3.64 for the year against $3.32 in FY2025, a 9.6% increase. Repurchases under the $60.0 billion programme approved on 2024-09-16 were $16,719 million on 36 million shares, against $13,000 million on 31 million shares in FY2025, leaving $40.6 billion of authorisation. Chapter 2 carries the wider cash flow measures of capital return.
Legal exposure is immaterial next to the contract figures. Accrued aggregate legal liabilities were $553 million at 2026-06-30, with reasonably possible adverse outcomes of about $400 million beyond recorded amounts. The one named matter is the Irish Data Protection Commission proceeding against LinkedIn on GDPR targeted advertising, where a preliminary hearing in December 2025 settled the standard of appeal. The IRS transfer pricing dispute, at $28.9 billion before penalties and interest, is disclosed in Item 7 rather than as a legal contingency and appears in Chapter 3.
6 Ownership, Voting Power & Annual Meeting
Six index and pension managers own a quarter of Microsoft and vote barely half of it. At 30 June 2026 the top six 13F holders reported 1,886,613,438 shares, 25.41% of the 7,425,545,491 outstanding, but sole voting authority over only 1,040,857,344 shares, 14.02% of the company. Microsoft has one class of common stock and one vote per share, so the split between ownership and voting power sits inside the holders: 842,712,047 of their shares carry no voting authority at the manager. Management and the board own almost nothing, 2,279,620 shares for 18 directors and officers, under 1%. Control rests with dispersed institutional votes, and the December 2025 meeting showed them backing the board on every management item and rejecting all six proposals.
Capital structure and the voting base
| Item | Value | As of | Source |
|---|---|---|---|
| Classes of common stock | 1 | 2025-09-30 | DEF 14A 0001193125-25-245150 |
| Votes per share | 1 | 2025-09-30 | DEF 14A 0001193125-25-245150 |
| Shares outstanding, record date | 7,433,087,554 | 2025-09-30 | DEF 14A 0001193125-25-245150 |
| Holders of record | 76,483 | 2025-09-30 | DEF 14A 0001193125-25-245150 |
| Shares entitled to vote | 7,433,087,554 | 2025-12-05 | 8-K 0001193125-25-311196 |
| Shares voted in person or by proxy | 6,321,402,487 | 2025-12-05 | 8-K 0001193125-25-311196 |
| Turnout (%) | 85.04 | 2025-12-05 | Derived |
| Shares outstanding, latest | 7,425,545,491 | 2026-07-23 | 10-K 0001193125-26-323660 |
| Public float ($) | 3,600,000,000,000 | 2025-12-31 | 10-K 0001193125-26-323660 |
The shares entitled to vote in the 8-K, 7,433,087,554, equal the shares outstanding on the proxy record date. With a single class and one vote per share, economic ownership equals voting power at the share level, so the separation in Table 6.3 is a holder level effect, reported in separate columns there.
Major shareholders
The proxy names only two owners above 5%, both from Schedule 13G/A filings of February 2024. Neither amended in the twenty months to the record date, so the 5% table is 21 months stale against the 13F positions in Table 6.3.
| Holder | Shares beneficially owned | Percent of class to be voted | Sole voting power | Shared voting power | Sole dispositive power | Shared dispositive power | Ownership data as of |
|---|---|---|---|---|---|---|---|
| The Vanguard Group, Inc. | 664,882,153 | 8.95 | 0 | 9,755,991 | 633,135,715 | 31,746,438 | 2023-12-29 |
| BlackRock, Inc. | 540,020,228 | 7.30 | 487,219,696 | 0 | 540,020,228 | 0 | 2023-12-31 |
Source: DEF 14A 0001193125-25-245150, table stated as of 2025-09-30, with the underlying voting and dispositive detail taken from Schedule 13G/A filings 0001104659-24-021466 and 0001086364-24-006985, both filed 2024-02-13.
Vanguard shows the chapter's pattern: 664,882,153 shares owned, 9,755,991 of voting power, 1.5% of its position.
| Holder | Shares held | Percent of shares outstanding | Sole voting authority | Shared voting authority | No voting authority | Voting authority as percent of shares outstanding | Voted share of own position (%) |
|---|---|---|---|---|---|---|---|
| BlackRock, Inc. | 607,443,113 | 8.18 | 549,566,272 | 0 | 57,876,841 | 7.40 | 90.5 |
| Vanguard Capital Management LLC | 485,192,007 | 6.53 | 0 | 0 | 485,192,007 | 0.00 | 0.0 |
| State Street Corp | 315,653,206 | 4.25 | 38,135,141 | 3,044,047 | 274,474,018 | 0.51 | 12.1 |
| Geode Capital Management, LLC | 189,632,090 | 2.55 | 189,461,992 | 0 | 170,098 | 2.55 | 99.9 |
| FMR LLC | 185,960,066 | 2.50 | 160,960,983 | 0 | 24,999,083 | 2.17 | 86.6 |
| Norges Bank | 102,732,956 | 1.38 | 102,732,956 | 0 | 0 | 1.38 | 100.0 |
| Total top six | 1,886,613,438 | 25.41 | 1,040,857,344 | 3,044,047 | 842,712,047 | 14.02 | 55.2 |
Denominator is 7,425,545,491 shares outstanding at 2026-07-23 from the FY2026 10-K cover page. Shares and voting authority come from each manager's Form 13F for the quarter ended 2026-06-30.
Vanguard Capital Management reports zero voting authority over its entire 485,192,007 share position. State Street votes 12.1% of its own holding. BlackRock, Geode and Norges vote almost all of theirs. A shareholder proposal that needs a majority of votes cast depends far more on BlackRock, Geode and Fidelity than the raw ownership ranking suggests.
| Holder | Common stock | Percent of common stock | Additional underlying shares or stock units |
|---|---|---|---|
| Satya Nadella, Chief Executive Officer | 900,572 | under 1% | 0 |
| Amy E. Hood, Chief Financial Officer | 465,746 | under 1% | 65,398 |
| Bradford L. Smith, Vice Chair and President | 402,131 | under 1% | 26,151 |
| Judson B. Althoff | 82,187 | under 1% | 63,374 |
| John W. Stanton | 82,252 | under 1% | 0 |
| Charles W. Scharf | 45,142 | under 1% | 0 |
| Takeshi Numoto | 32,582 | under 1% | 26,049 |
| Sandra E. Peterson | 30,682 | under 1% | 0 |
| Teri L. List | 25,600 | under 1% | 0 |
| Penny S. Pritzker | 25,552 | under 1% | 0 |
| Reid G. Hoffman | 15,905 | under 1% | 16,217 |
| Emma N. Walmsley | 9,913 | under 1% | 830 |
| Hugh F. Johnston | 8,032 | under 1% | 1,130 |
| John David Rainey | 6,498 | under 1% | 0 |
| Carlos A. Rodriguez | 4,381 | under 1% | 0 |
| Mark A. L. Mason | 1,400 | under 1% | 0 |
| Catherine MacGregor | 0 | under 1% | 1,487 |
| Directors and executive officers as a group, 18 people | 2,279,620 | under 1% | n/a |
Source: DEF 14A 0001193125-25-245150. Beneficial ownership represents sole voting and investment power and includes shares acquirable within 60 days of 2025-09-30. The group total includes 66,422 shares credited under the Deferred Compensation Plan for Non-Employee Directors and excludes Mr Rainey's 6,498 shares. These are proxy figures at a single date and are not comparable with the direct holdings on Forms 4 in Chapter 7, which run to 2026-08-31.
The 13F holder trend across four quarters

| Metric | 2025-09-30 | 2025-12-31 | 2026-03-31 | 2026-06-30 |
|---|---|---|---|---|
| Form 13F filings reporting CUSIP 594918104 | 6,008 | 6,459 | 6,340 | 6,340 |
| Vanguard, shares | 701,986,682 | 717,942,580 | 482,558,086 | 485,192,007 |
| BlackRock, Inc., shares | 591,980,958 | 602,187,495 | n/a | 607,443,113 |
| State Street Corp, shares | 299,761,678 | 306,150,608 | 306,708,289 | 315,653,206 |
| Geode Capital Management, shares | 180,707,258 | 182,618,400 | 188,501,918 | 189,632,090 |
| FMR LLC, shares | 210,487,489 | 200,948,745 | 190,211,367 | 185,960,066 |
| Norges Bank, shares | n/a | 104,761,241 | n/a | 102,732,956 |
The filer count is a count of Form 13F filings that report the CUSIP, including amendments, so one manager can appear more than once. It rose 7.5% from 6,008 to 6,459 in the December 2025 quarter, then settled at 6,340 in each of the two following quarters. The base of institutional holders widened over the year and did not narrow after.
Three nulls are reported as nulls. BlackRock's Form 13F for 2026-03-31, accession 0002012383-26-001841, carries a 23.3 MB information table the holdings endpoint could not return, so that cell reads n/a rather than an interpolated number. Norges Bank filed no Form 13F reporting the CUSIP for the September 2025 and March 2026 quarters.
Direction over the four quarters, on the comparable rows: State Street added 15,891,528 shares, up 5.3%. Geode added 8,924,832 shares, up 4.9%. Fidelity's FMR cut 24,527,423 shares, down 11.7%, the only sustained seller among the six and a fall in every quarter. Norges was roughly flat between its two filings, down 2,028,285 shares. BlackRock added 15,462,155 shares across the three quarters it can be measured, up 2.6%.
The Vanguard row breaks at 2025-12-31 and is not comparable. The filing entity changed from The Vanguard Group, Inc., CIK 102909, to Vanguard Capital Management LLC, CIK 2100119. The reported position falls 235,384,494 shares across that break. Schedule 13G evidence in Table 6.5 shows an entity restructuring inside Vanguard.
Schedule 13D and 13G history
Two filings were made in the two years to 2026-09-01, both by Vanguard entities and both passive. No Schedule 13D was filed and no activist stake was reported.
| Filed | Form | Amendment | Event date | Filer | Shares | Percent of class | Sole voting power | Sole dispositive power | Rule |
|---|---|---|---|---|---|---|---|---|---|
| 2026-04-30 | SC 13G | Initial | 2026-03-31 | Vanguard Capital Management LLC | 555,988,240 | 7.48 | 73,430,154 | 555,988,240 | 13d-1(b) |
| 2026-03-27 | SC 13G/A | 10 | 2026-03-13 | The Vanguard Group, Inc. | 0 | 0.00 | 0 | 0 | 13d-1(b) |
Accession numbers 0002100119-26-000820 and 0000102909-26-001884.
The two are one event. Vanguard Group reported down through 5% on 2026-03-13 and Vanguard Capital Management an initial 7.48% stake at the same quarter end. Both certify holding in the ordinary course of business.
Vanguard Capital Management's Schedule 13G reports 555,988,240 shares at 2026-03-31 while its Form 13F for the same date reports 482,558,086. The gap is 73,430,154 shares, which equals the sole voting power line in the Schedule 13G to the share. The reconciling item is that block. The two figures are not adjusted.
BlackRock has not filed a Schedule 13G amendment on Microsoft since 2024-02-13, although its Form 13F position of 607,443,113 shares at 2026-06-30 is 8.18% of the class, above the 7.30% its last amendment reported.
The 2025 annual meeting
The meeting was held virtually on 2025-12-05. All twelve directors were elected, all four management proposals passed, and all six shareholder proposals failed. The board recommended for every management item and against every shareholder proposal, and shareholders followed the board on all twenty one items.
| # | Item | Proponent | Board recommendation | Outcome | For | Against | Abstain | Broker nonvotes | Percent for |
|---|---|---|---|---|---|---|---|---|---|
| 1 | Election of 12 directors | Board | For | All elected | See Table 6.7 | See Table 6.7 | See Table 6.7 | 1,137,975,835 | 91.53 to 99.72 |
| 2 | Advisory vote on named executive officer compensation | Board | For | Approved | 4,744,731,533 | 415,831,135 | 22,891,989 | 1,137,975,835 | 91.94 |
| 3 | Ratify Deloitte & Touche LLP as auditor for fiscal year 2026 | Board | For | Approved | 5,897,883,259 | 408,304,657 | 15,242,576 | 0 | 93.53 |
| 4 | Approve the Microsoft Corporation 2026 Stock Plan | Board | For | Approved | 5,016,063,751 | 151,618,873 | 15,772,033 | 1,137,975,835 | 97.07 |
| 5 | Report on European Security Program censorship risk audit | National Center for Public Policy Research | Against | Not approved | 40,404,047 | 5,102,931,493 | 40,119,117 | 1,137,975,835 | 0.79 |
| 6 | Report on risks of censorship in generative artificial intelligence | Ridgeline Research LLC, for American Conservative Values ETF | Against | Not approved | 35,508,084 | 5,104,188,603 | 43,757,970 | 1,137,975,835 | 0.69 |
| 7 | Report on artificial intelligence data usage oversight | National Legal and Policy Center | Against | Not approved | 683,895,858 | 4,435,809,588 | 63,749,211 | 1,137,975,835 | 13.36 |
| 8 | Report on data operations in human rights hotspots | Mari Mennel-Bell, for shareholder Olga Bell Greenbaum D'Angelo | Against | Not approved | 1,406,735,187 | 3,712,753,371 | 63,966,099 | 1,137,975,835 | 27.48 |
| 9 | Report on human rights due diligence | Religious of the Sacred Heart of Mary and co filers | Against | Not approved | 1,336,945,255 | 3,738,252,211 | 108,257,191 | 1,137,975,835 | 26.34 |
| 10 | Report on artificial intelligence and machine learning tools for oil and gas development and production | As You Sow and co filers | Against | Not approved | 448,005,682 | 4,671,182,894 | 64,266,081 | 1,137,975,835 | 8.75 |
Percent for is votes for over votes for plus against, the standard of the certified tabulation. Vote results from 8-K 0001193125-25-311196 Item 5.07. Proponents and board recommendations from DEF 14A 0001193125-25-245150.
| Director | Result | For | Against | Abstain | Broker nonvotes | Percent for |
|---|---|---|---|---|---|---|
| John David Rainey | Elected | 5,159,803,411 | 14,709,088 | 8,942,158 | 1,137,975,835 | 99.72 |
| Catherine MacGregor | Reelected | 5,148,368,340 | 26,590,734 | 8,495,583 | 1,137,975,835 | 99.49 |
| Penny S. Pritzker | Reelected | 5,147,754,253 | 27,334,798 | 8,365,606 | 1,137,975,835 | 99.47 |
| Emma N. Walmsley | Reelected | 5,147,102,809 | 27,909,382 | 8,442,466 | 1,137,975,835 | 99.46 |
| Reid G. Hoffman | Reelected | 5,120,225,979 | 48,294,508 | 14,934,170 | 1,137,975,835 | 99.07 |
| Mark A. L. Mason | Reelected | 5,122,450,020 | 52,291,857 | 8,712,780 | 1,137,975,835 | 98.99 |
| John W. Stanton | Reelected | 5,056,509,391 | 118,267,836 | 8,677,430 | 1,137,975,835 | 97.71 |
| Sandra E. Peterson | Reelected | 5,004,804,899 | 166,778,650 | 11,871,108 | 1,137,975,835 | 96.78 |
| Teri L. List | Reelected | 4,999,681,887 | 175,326,264 | 8,446,506 | 1,137,975,835 | 96.61 |
| Charles W. Scharf | Reelected | 4,947,789,084 | 227,012,006 | 8,653,567 | 1,137,975,835 | 95.61 |
| Satya Nadella | Reelected | 4,815,433,908 | 337,016,790 | 31,003,959 | 1,137,975,835 | 93.46 |
| Hugh F. Johnston | Reelected | 4,733,430,707 | 437,820,499 | 12,203,451 | 1,137,975,835 | 91.53 |
Source: 8-K 0001193125-25-311196 Item 5.07.
Each of the twenty one tabulations sums to 6,321,430,492 votes for, against, abstained and nonvoted. The 8-K states 6,321,402,487 shares were voted in person or by proxy. The reconciling item is 28,005 shares, 0.0004% of shares voted, between the narrative count and the tabulations. Both are reported as filed and neither is adjusted.
Broker nonvotes were 1,137,975,835 on every item except the auditor ratification, 18.0% of shares voted. That block is street name stock whose brokers could not vote without instruction on the nonroutine items. On the auditor ratification, the one routine item, broker nonvotes were zero and 6,321,430,492 votes were cast.
What the votes reveal about voting power
The say on pay result, 91.94% for, is the softest management item, and the chief executive's own election at 93.46% is the softest director result after audit committee chair Hugh F. Johnston at 91.53%. Against votes on Johnston, 437,820,499, and on Nadella, 337,016,790, are the largest of any director. Both sit well above the majority standard.
Among the shareholder proposals, the two governance and human rights reports drew the strongest support: data operations in human rights hotspots at 27.48% and human rights due diligence at 26.34%. The two censorship proposals from conservative proponents drew 0.79% and 0.69%. A quarter of votes cast on the human rights items is 1.3 to 1.4 billion shares, more than the combined sole voting authority of BlackRock and Geode. No proposal came within reach of a majority, and none needs a board response under the majority of votes cast standard the proxy sets.
7 Insider Activity
Strip out plan and award driven activity and Microsoft insiders did almost nothing over the twelve months to 2026-08-31. One open market purchase, 5,000 shares for $1.99 million by director John W. Stanton on 2026-02-18. Eleven open market sales, 104,994 shares for $50.42 million by five officers. Net position (99,994) shares, or $(48.43) million. The buy to sell ratio is 0.05x by shares and 0.04x by value, computed on open market transactions only. Including the Rule 10b5-1 plan sale would move it to 0.02x by shares, and tax withholding as well to 0.01x. The chapter uses the open market basis throughout.
That net sale is 0.0014% of the 7,425,545,491 shares outstanding.
The gross numbers say something different and are to be discarded. 131 Section 16 filings covered 85 nonderivative lines and 1,125,680 shares. 605,624 shares came in as award vestings and grants, 239,646 out as tax withholding, 149,205 under a Rule 10b5-1 plan adopted 2025-03-07, 17,590 as gifts and 3,621 as a trust distribution. None is a trading decision. Reading that plan sale as bearish misdates it by six months, since the plan predates it.
Open market activity
Five officers sold on the open market. No officer bought. The one buyer was a director.
| Date | Insider | Role | Code | Type | Shares | Price ($) | Value ($) | Held after |
|---|---|---|---|---|---|---|---|---|
| 2025-11-03 | Bradford L. Smith | Vice Chair and President | S | Open market sale | 30,411 | 518.4907 | 15,767,821 | 469,685.7633 |
| 2025-11-03 | Bradford L. Smith | Vice Chair and President | S | Open market sale | 8,089 | 519.2096 | 4,199,886 | 461,596.7633 |
| 2025-12-02 | Judson Althoff | CEO, Microsoft Commercial | S | Open market sale | 12,750 | 491.5160 | 6,266,829 | 129,348.6810 |
| 2025-12-04 | Takeshi Numoto | EVP, Chief Marketing Officer | S | Open market sale | 2,850 | 478.7200 | 1,364,352 | 55,781.7205 |
| 2026-02-18 | John W. Stanton | Director | P | Open market purchase | 5,000 | 397.3500 | 1,986,750 | 83,905.0000 |
| 2026-03-06 | Kathleen T. Hogan | EVP, Strategy | S | Open market sale | 12,320.87 | 409.5200 | 5,045,643 | 137,933.0970 |
| 2026-05-14 | Amy Coleman | EVP, Chief Human Resources Officer | S | Open market sale | 1,262.312 | 411.3420 | 519,242 | 46,003.3801 |
| 2026-06-01 | Judson Althoff | CEO, Microsoft Commercial | S | Open market sale | 15,500 | 460.9880 | 7,145,314 | 110,477.4340 |
| 2026-06-08 | Takeshi Numoto | EVP, Chief Marketing Officer | S | Open market sale | 2,500 | 412.4500 | 1,031,125 | 51,967.7595 |
| 2026-06-10 | Takeshi Numoto | EVP, Chief Marketing Officer | S | Open market sale | 4,500 | 402.8400 | 1,812,780 | 47,467.7595 |
| 2026-08-04 | Takeshi Numoto | EVP, Chief Marketing Officer | S | Open market sale | 4,810.353 | 496.4800 | 2,388,244 | 42,677.4483 |
| 2026-08-05 | Judson Althoff | CEO, Microsoft Commercial | S | Open market sale | 10,000 | 487.8930 | 4,878,930 | 100,447.4340 |
| Purchases, 1 transaction | 5,000 | 397.3500 | 1,986,750 | n/a | ||||
| Sales, 11 transactions | 104,993.535 | 480.2216 | 50,420,166 | n/a | ||||
| Net | (99,993.535) | n/a | (48,433,416) | n/a |
Source: Forms 4 retrieved through the SEC-API.io MCP server. Weighted average price on the total rows.
The prices on the two sides differ sharply. The eleven sales cleared at a weighted average $480.22. The purchase went off at $397.35, the lowest open market Form 4 price, 17% below the selling average. The buyer took the February trough, the sellers sold strength. The sales were compensation driven and the purchase discretionary.
Four of the five sellers are operating executives selling shares that had just vested. Every Form 144 in the window names restricted stock vesting or a stock award as the source of the shares. The five sellers ended the period still holding 774,389 shares directly, so the 104,994 shares sold are 11.9% of what they sold plus what they kept. Nobody exited.
The chief executive made no discretionary open market transaction. His only sale was the 149,205 share Rule 10b5-1 plan disposal on 2025-09-03, and he ended the year holding 786,875 shares directly. The chief financial officer made no sale of any kind and ended holding 562,777 shares directly, up 47,425 on the year. These are direct holdings on the last Form 4 of the window, on a different basis and date from the proxy beneficial ownership in Chapter 6, Table 6.4.
Plan and award driven activity
| Code | Category | Filings | Insiders | Shares | Value ($) | What it is |
|---|---|---|---|---|---|---|
| A | Award vesting and stock award grant | 30 | 13 | 605,624 | n/a | Shares delivered on vesting of RSU and performance stock awards, and quarterly director stock awards. No cash paid. |
| F | Tax withholding on vesting | 32 | 8 | 239,646.433 | 119,424,327 | Shares withheld by the issuer to settle payroll tax on vested awards. Not a market sale. |
| S | Rule 10b5-1 plan sale | 6 | 1 | 149,205 | 75,315,121 | Sale under a trading plan adopted 2025-03-07, before the trade dates. |
| G | Gift | 4 | 4 | 17,590 | n/a | Shares transferred without consideration. No market transaction. |
| J | Trust distribution | 1 | 1 | 3,621 | n/a | Family trust distribution to a beneficiary. No market transaction. |
| A | RSU dividend equivalent accrual | 64 | 11 | 6,731.789 | n/a | Dividend equivalent units accrued on director restricted stock units. No cash paid. |
Source: Forms 4 through the SEC-API.io MCP server. No category here records a discretionary trading decision.
The 2025-09-02 annual vest is the year in one day. 493,629 shares were delivered to seven executives and 219,844 withheld for tax at $506.69, a 44.54% withholding rate. A screen that counts code F as selling would record $111.4 million of insider distribution on a day no insider sold anything. The tax withholding line at $119.42 million is 2.4 times the entire open market sale total and reaches the market only through the issuer.
Two new directors filed initial statements. John D. Rainey on 2025-12-08 for a 2025-12-05 event, 5,464 shares held. Carmine Di Sibio on 2026-05-18 for a 2026-05-13 event, amended on 2026-05-26 from nil to 345 shares held.
Monthly history

| Month | Buy shares | Sell shares | Net shares | Net value ($) |
|---|---|---|---|---|
| Sep 2025 | 0 | 0 | 0 | 0 |
| Oct 2025 | 0 | 0 | 0 | 0 |
| Nov 2025 | 0 | 38,500 | (38,500) | (19,967,707) |
| Dec 2025 | 0 | 15,600 | (15,600) | (7,631,181) |
| Jan 2026 | 0 | 0 | 0 | 0 |
| Feb 2026 | 5,000 | 0 | 5,000 | 1,986,750 |
| Mar 2026 | 0 | 12,320.87 | (12,320.87) | (5,045,643) |
| Apr 2026 | 0 | 0 | 0 | 0 |
| May 2026 | 0 | 1,262.312 | (1,262.312) | (519,242) |
| Jun 2026 | 0 | 22,500 | (22,500) | (9,989,219) |
| Jul 2026 | 0 | 0 | 0 | 0 |
| Aug 2026 | 0 | 14,810.353 | (14,810.353) | (7,267,174) |
Source: Forms 4 through the SEC-API.io MCP server. Rule 10b5-1 plan sales, vestings and withholdings excluded.
Five of twelve months are blank. Selling clusters in November, December and June, after the September annual vest and the quarterly vest dates. The only buying month is February 2026, the lowest priced in the window.
Form 144 notices and closing holdings
| Insider | Form 144 filed | Shares proposed | Shares executed | Form 4 transaction date | Unsold |
|---|---|---|---|---|---|
| Satya Nadella | 2025-09-03 | 149,205 | 149,205 | 2025-09-03 | 0 |
| Bradford L. Smith | 2025-11-03 | 38,500 | 38,500 | 2025-11-03 | 0 |
| Judson Althoff | 2025-12-02 | 12,750 | 12,750 | 2025-12-02 | 0 |
| Takeshi Numoto | 2025-12-03 | 6,000 | 2,850 | 2025-12-04 | 3,150 |
| Kathleen T. Hogan | 2026-03-06 | 12,321 | 12,320.87 | 2026-03-06 | 0.13 |
| Amy Coleman | 2026-05-14 | 1,263 | 1,262.312 | 2026-05-14 | 0.688 |
| Judson Althoff | 2026-06-01 | 15,500 | 15,500 | 2026-06-01 | 0 |
| Takeshi Numoto | 2026-06-04 | 7,000 | 7,000 | 2026-06-08 and 2026-06-10 | 0 |
| Takeshi Numoto | 2026-08-04 | 6,444 | 4,810.353 | 2026-08-04 | 1,633.647 |
| Judson Althoff | 2026-08-05 | 10,000 | 10,000 | 2026-08-05 | 0 |
| Total | n/a | 258,983 | 254,198.535 | n/a | 4,784.465 |
Source: Forms 144 and Forms 4 retrieved through the SEC-API.io MCP server.
Proposed 258,983 shares against 254,198.535 executed. The 4,784.465 share gap is two partly used notices, 3,150 shares of Takeshi Numoto's December 2025 notice and 1,633.647 of his August 2026 notice, plus 0.818 shares of rounding on the Hogan and Coleman notices. A Form 144 states a ceiling on the shares that may be sold.
Three insiders' closing direct holdings do not follow from their transaction lines, each for a disclosed reason, and none was adjusted. Takeshi Numoto is 57.421 shares short, matching 0.171, 37.208 and 20.0418 shares acquired under the Employee Stock Purchase Plan on 2025-09-30, 2026-03-31 and 2026-06-30, disclosed in footnotes rather than transaction lines. Amy Coleman is 52.861 shares short, matching 52.8608 plan shares acquired 2026-03-31. Teri List's direct holding resets each quarter because the director award moves to indirect holding between reports. On a combined basis she runs 2,547 shares to 3,096, a rise of 549, equal to her four quarterly awards of 125, 130, 145 and 149 shares.
Items excluded from the window
Bradford L. Smith's Form 4 filed 2025-12-12 reports a 3,842 share acquisition on 2025-04-23 and disposals of 30 shares on 2025-04-30 and 3,812 on 2025-05-05. The footnotes state each leg was broker initiated without the reporting person's direction, approval or knowledge, and the residual was rescinded through the broker's error account on 2025-05-05. The transaction dates fall outside the twelve month window and the trades were reversed, so they are excluded throughout. Counting the 3,842 share leg as an open market purchase would raise the buy to sell ratio to 0.08x by shares on trades that were undone. Alice L. Jolla's 3,813 share award on 2025-08-31 predates the window by a day and is excluded.
Reading
The signal is thin in both directions. One director bought $1.99 million at the year's low. Five officers sold $50.42 million of freshly vested stock and kept 774,389 shares. Neither group moved enough to change a position.
The bear case reads the 21 to 1 sale to purchase ratio as officers monetising stock they think fully valued. It must explain why the same officers retained 88% of it and the chief financial officer sold nothing. The base case reads compensation mechanics. Microsoft pays executives in stock, it vests every September, tax takes 44.54%, and the rest is diversified on a schedule tracking vest dates. The clustering in November, December and June supports it.
Across twelve months, thirteen insiders and 131 filings, one person bought Microsoft stock. That is normal for a mega cap whose officers are already overweight through unvested awards, so insider activity should not weigh on MSFT.
8 Risk Factors
Microsoft rewrote the part of Item 1A that governs the capital cycle. Of 26 named risk factors in the FY2026 10-K, 6 are new and 13 were materially reworded. Every new one sits in the two places where the money is going, the cloud and AI investment programme and the physical build of datacenters. The FY2025 10-K carried 23 named risk factors, 3 of which lost their heading. Item 1A grew from 10,054 words to 11,687, and mentions of AI rose from 51 to 82.
The change tracks the balance sheet in Chapter 2. Microsoft has moved the disclosure from one execution risk about cloud services to risks about funding, powering, permitting, staffing and filling the build with demand not yet contracted.
The company now states in Item 1A that these investments are made ahead of fully developed revenue streams, that overestimating demand may lead to underutilised infrastructure and impairment of assets on the balance sheet, and that its cost of capital is exposed to interest rates, credit markets, investor sentiment and its own credit ratings. None of those three statements appears in the FY2025 filing.
What changed, by category
| Step | Count |
|---|---|
| FY2025 named risk factors | 23 |
| Dropped as a named heading | (3) |
| Newly added headings | 6 |
| FY2026 named risk factors | 26 |
Headings come from the bold runs in each 10-K, less category labels.
Status is new, reworded, unchanged or dropped. Reworded means the substance changed. Headings as filed.
| Risk factor | Status | What changed |
|---|---|---|
| Strategic and competitive | ||
| We face intense competition across all markets for our products and services | Reworded | Names hyperscalers, open source offerings and frontier model providers as AI competitors, some of them current or potential partners, and states that expanding Microsoft's own vertically integrated hardware, infrastructure and AI models could raise its cost structure and cut margins. |
| Our focus on cloud based and AI services presents execution and competitive risks | Dropped | Withdrawn as a heading and split into the two risks below, with the substance expanded rather than removed. |
| Our cloud and AI strategy requires substantial investments and depends on evolving customer demand, technological developments, competitive dynamics, and regulatory conditions | New | Investments are made at scale, on an accelerated timeline, and in advance of fully developed revenue streams. Funding depends on cash flow and financing, and the cost of capital is exposed to interest rates, credit markets, investor sentiment and Microsoft's credit ratings. Customers may reduce, delay or shift AI workloads to competing platforms or on premises deployments. |
| Our success depends on our ability to develop, deliver, and maintain competitive cloud based and AI products and services | New | Carries the FY2025 execution list forward and adds monetisation through pricing that reflects value, the accelerating importance of agentic computing, demand forecasting error leading to underutilised infrastructure and asset impairment, uncertainty in model training and inference cost, and dependence on strategic partners that are also significant Azure customers. |
| Evolution of the business | ||
| We make significant investments in products and services that may not achieve expected returns | Unchanged | Text identical to FY2025. |
| Acquisitions, joint ventures, and strategic alliances could have an adverse effect on our business | Reworded | The third phase of the OpenAI partnership becomes a long term strategic partnership, and completed deal challenge broadens to transactions and arrangements that have been and may be subject to legal and regulatory challenge. |
| Cybersecurity, data privacy and platform abuse | ||
| Cyberattacks and security vulnerabilities could lead to reduced revenue, increased costs, liability claims, or harm to our reputation or competitive position | Reworded | Adds AI assisted attack techniques that raise the speed and scale of attacks and cut mitigation time, supplier and partner systems as compromised targets, supply chain incidents through open source code and third party vendors, AI generated code as a source of product vulnerabilities, and AI based defences. |
| Disclosure and misuse of personal data could result in liability and harm our reputation | Unchanged | Hedging phrases such as despite our efforts were removed. The disclosed substance is the same. |
| We may not be able to protect information in our products and services from use by others | Reworded | Adds the increasing use of agentic AI as a reason Microsoft may be unable to stop third parties scraping content from LinkedIn and other products. |
| Abuse of our platforms may harm our reputation or user engagement | Reworded | Regulatory focus shifts to product design and safety by design. Adds age assurance, age appropriate design and parental controls across app stores and operating systems, and distinct risks to children and adolescents from conversational or emotionally engaging AI. |
| Our products and services, how they are used by customers, and how third party products and services interact with them, may present security, privacy, and execution risks | Unchanged | Text identical to FY2025. |
| Issues in the development, deployment, and use of AI may result in reputational or competitive harm or liability | Reworded | Adds product liability claims, over reliance on companion or highly personalised AI systems, and uneven impacts on vulnerable groups. States Microsoft has already experienced AI solutions producing unintended consequences, where FY2025 framed it as a future possibility. |
| Operational | ||
| We may have excessive outages, data losses, and disruptions of our online services if we fail to maintain an adequate operations infrastructure | Dropped | Withdrawn as a heading and split into a build risk and an operate risk. |
| We may experience supply or quality problems | Dropped | Withdrawn as a heading and split into a supply risk and a quality risk. |
| We may be unable to develop and expand adequate infrastructure | New | Electrical power availability, grid capacity constraints, connection delays and energy cost now limit datacenter expansion, alongside land availability, zoning, environmental review, permitting, community opposition, state and local moratoriums, and shortages of skilled construction and engineering labour. |
| We may experience supply problems | New | Names shortages in semiconductors, networking equipment, power systems and cooling equipment, multiyear lead times to expand component supply, tariffs and supplier financial distress, and the prospect of long term purchase or price commitments above prevailing market rates. |
| We may experience outages, disruptions, or capacity constraints if we fail to maintain and operate adequate infrastructure | New | Adds reliance on third party colocation facilities, leased datacenters and cloud infrastructure providers, whose interruptions or capacity constraints could degrade Microsoft's own service delivery. |
| We may experience other quality problems | New | Carries the FY2025 software quality text forward and names AI products and services as subject to the same quality and reliability failure modes. |
| Legal, regulatory and litigation | ||
| We are subject to a variety of new, existing, and evolving legal and regulatory requirements | Reworded | Adds cybersecurity to the listed requirement areas. Adds government restrictions on the development, deployment, availability or cross border access to advanced AI models on safety, cybersecurity or national security grounds, plus digital replicas and AI companions as regulated areas. Adds expanded export licence conditions and the Middle East conflict to trade. Adds permitting, reporting, procurement, operational and infrastructure siting requirements to ESG, with a statement that AI raises energy use and emissions. |
| We have claims and lawsuits against us that may result in adverse outcomes | Unchanged | AI services becomes AI products and services. No change in substance. |
| Our business with government customers may present additional uncertainties | Unchanged | Text identical to FY2025. |
| We may have additional tax liabilities | Unchanged | Wording trimmed on the OECD global minimum tax sentence. No change in substance. |
| Intellectual property | ||
| We face risks related to the protection and utilization of our intellectual property | Reworded | Adds trade secrets to the protected categories and broadens the source code exposure from a leak to unauthorised access or disclosure. The FY2025 passage on changes in law weakening the ability to prevent use of patented technology, and on open source engagement forcing broad licensing of Microsoft intellectual property, has no successor text. |
| Third parties may claim that we infringe their intellectual property | Reworded | Extends copyright claims arising from AI training and output to include inference. |
| General | ||
| If our reputation or our brands are damaged, our business and results of operations may be harmed | Reworded | Adds product accessibility to the list of issues that can damage the brand. |
| Adverse economic or market conditions could harm our business | Reworded | Adds periods of economic uncertainty, evolution of customer demand, technology investment cycles, interest rates, foreign exchange rates, and the timing and mix of customer spending. Lower IT spending becomes lower or delayed IT spending. |
| Catastrophic events or geopolitical conditions could disrupt our business | Reworded | Extends armed conflict exposure from Ukraine alone to the conflicts in Ukraine and the Middle East, and stops naming COVID-19 in the pandemic risk. |
| Our global business exposes us to operational and economic risks | Reworded | Removes the reference to geopolitical tension between the United States and Europe and adds disagreements among governments on export controls and sanctions toward third countries. |
| Our business depends on our ability to attract and retain talented employees | Unchanged | Text identical to FY2025. |
The 3 dropped rows are FY2025 headings with no FY2026 successor heading. Their substance survives inside the new operational and strategic risks, so the drops restructure the disclosure. One disclosure was withdrawn outright: the FY2025 statement on patent law and open source licensing of Microsoft intellectual property.
The four changes that matter to the stock
Capital is now a named risk. The word capital does not appear in FY2025 Item 1A and appears 6 times in FY2026. Microsoft states that funding the build depends on sufficient cash flow and financing on acceptable terms, and that adverse changes in interest rates, credit markets, investor sentiment, credit ratings or other factors affecting capital availability could raise its cost of capital or limit execution of the strategy. At 34.9% of revenue, capital expenditure is no longer self evidently self funded, and the filer says so. Chapter 2 shows net cash becoming net debt that year.
Demand risk is now two sided. FY2025 asked whether the strategy would attract users. FY2026 adds the opposite failure: overestimation of demand or misalignment of capacity investments may lead to underutilisation of infrastructure and impairment of assets on the balance sheet. That is an explicit impairment channel attached to a $115,948 million annual spend and a $313,076 million net property and equipment balance. The same risk factor states that customers may reduce, delay or shift AI workloads to competing platforms, on premises deployments or other alternatives.
Partner concentration is disclosed without being quantified. Microsoft states that its AI strategy depends in part on strategic relationships with third parties, that many of those partners compete with it, that in some cases they are significant customers of Azure and other cloud services, and that the expected economic benefits including Azure consumption may not be realised or sustained. The filing also says Microsoft may modify capacity allocations, deployment priorities, pricing or commercial arrangements as it manages constraints. No counterparty is named in this risk factor and no share of revenue given, so the exposure is disclosed as a qualitative dependency only. The number a reader wants is in Note 1 rather than Item 1A, and in Chapter 1: $24,100 million of FY2026 revenue, 7.3% of the total.
The build has physical and political constraints. Mentions of power and energy each rose from 4 to 10, permit from 1 to 4. Microsoft now discloses grid capacity constraints, delays in power connections, utility imposed requirements, land and zoning limits, environmental review, community opposition, state and local moratoriums, cross jurisdictional opposition involving elected officials and advocacy groups, and shortages of skilled construction labour. It also discloses that expanding component supply can require multiyear lead times, and that it may have to enter long term purchase or price commitments above market. These are schedule and unit cost risks against a plan priced as near certain.
An alternative reading deserves a hearing. Much of this is standard practice. A company that has roughly doubled capital spending will add disclosure to match, and a new risk factor is not evidence management expects the risk to occur. The FY2026 filing says statements in Item 1A reflect beliefs and opinions about what could adversely affect the company, and that references to past events are examples rather than a complete listing. That caution is itself new this year.
Disclosure intensity
Page furniture removed. Counts are case insensitive except AI, counted as the exact token.
| Metric | FY2025 | FY2026 |
|---|---|---|
| Words in Item 1A | 10,054 | 11,687 |
| Named risk factors | 23 | 26 |
| Mentions of AI | 51 | 82 |
| Mentions of datacenter | 10 | 14 |
| Mentions of power | 4 | 10 |
| Mentions of energy | 4 | 10 |
| Mentions of capital | 0 | 6 |
| Mentions of permit | 1 | 4 |
| Mentions of agentic | 1 | 3 |
| Mentions of tariff | 4 | 5 |
Interim updates
Part II Item 1A of each quarter compared with the FY2025 10-K risk set.
| Period | Accession number | New or dropped risk factors | Substantive edits later carried into the FY2026 10-K |
|---|---|---|---|
| Q1 FY2026 | 0001193125-25-256321 | None | None beyond typography. |
| Q2 FY2026 | 0001193125-26-027207 | None | AI regulation described as evolving rather than emerging. |
| Q3 FY2026 | 0001193125-26-191507 | None | Threat actors stated to use AI and machine learning rather than may use. Generative AI capabilities generalised to AI capabilities. Armed conflict exposure extended to the conflicts in Ukraine and the Middle East. |
All three restate the FY2025 headings. None of the six new FY2026 headings appears in a 10-Q, and the FY2025 patent law and open source passage survives. The Item 1A restructuring is a year end event, first disclosed 2026-07-29.
9 Stock Price, Scenarios & Sensitivity
The stock is roughly flat over a year while earnings compounded. MSFT closed at $499.38 on 2026-09-01, up 3.3% from the 2025 year end close of $483.62 and 9.3% below its 52 week high of $550.29. Across FY2026 the price fell 12.9%, from $533.50 to $464.72, while adjusted diluted earnings per share rose 22.3%, from $14.13 to $17.28. The multiple did the work: 37.8 times adjusted earnings at the FY2025 close, 26.9 times at the FY2026 close, 28.9 times at spot. That compression is what the three year cases have to resolve.
Three year outcomes to FY2029, off audited FY2026 revenue of $331,839 million and adjusted diluted EPS of $17.28, give a best case of $1,007 per share and a 104.5% total return, a base case of $675 and 37.8%, and a worst case of $336 and $(30.4)%. Table 9.2 carries every input. The base case is an estimate on the stated assumptions. It is broken by depreciation, by the OpenAI relationship, or by the multiple, in that order.
Adjusted diluted EPS here is Microsoft's own non GAAP measure from Item 7 of the FY2026 10-K, removing only gains and losses on the OpenAI investment. Chapter 2, Table 2.3 carries a stricter core measure removing the equity marks and derivative gains, giving $16.56 for FY2026. The scenarios build FY2029 earnings from revenue and margin, so the choice of base measure changes the historic growth rate and multiple while the FY2029 outputs stand.
Price history

Sixty one monthly closes, US dollars. Market data. No named provider. Not from SEC filings.
| Month | Close | Month | Close | Month | Close | Month | Close |
|---|---|---|---|---|---|---|---|
| 2021-09 | 281.92 | 2023-01 | 247.81 | 2024-05 | 415.13 | 2025-09 | 517.95 |
| 2021-10 | 331.62 | 2023-02 | 249.42 | 2024-06 | 446.95 | 2025-10 | 517.81 |
| 2021-11 | 330.59 | 2023-03 | 288.30 | 2024-07 | 418.35 | 2025-11 | 492.01 |
| 2021-12 | 336.32 | 2023-04 | 307.26 | 2024-08 | 417.14 | 2025-12 | 483.62 |
| 2022-01 | 310.98 | 2023-05 | 328.39 | 2024-09 | 430.30 | 2026-01 | 430.29 |
| 2022-02 | 298.79 | 2023-06 | 340.54 | 2024-10 | 406.35 | 2026-02 | 392.74 |
| 2022-03 | 308.31 | 2023-07 | 335.92 | 2024-11 | 423.46 | 2026-03 | 370.17 |
| 2022-04 | 277.52 | 2023-08 | 327.76 | 2024-12 | 421.50 | 2026-04 | 407.78 |
| 2022-05 | 271.87 | 2023-09 | 315.75 | 2025-01 | 415.06 | 2026-05 | 450.24 |
| 2022-06 | 256.83 | 2023-10 | 338.11 | 2025-02 | 396.99 | 2026-06 | 373.02 |
| 2022-07 | 280.74 | 2023-11 | 378.91 | 2025-03 | 375.39 | 2026-07 | 464.72 |
| 2022-08 | 261.47 | 2023-12 | 376.04 | 2025-04 | 395.26 | 2026-08 | 507.29 |
| 2022-09 | 232.90 | 2024-01 | 397.58 | 2025-05 | 460.36 | 2026-09 | 499.38 |
| 2022-10 | 232.13 | 2024-02 | 413.64 | 2025-06 | 497.41 | n/a | n/a |
| 2022-11 | 255.14 | 2024-03 | 420.72 | 2025-07 | 533.50 | n/a | n/a |
| 2022-12 | 239.82 | 2024-04 | 389.33 | 2025-08 | 506.69 | n/a | n/a |
Five years produced a 77.1% price gain, 12.1% a year. The monthly close peaked at $533.50 in July 2025, fell 30.6% to $370.17 by March 2026, and has recovered 34.9% since. The 52 week range is $349.20 to $550.29, a 57.6% spread on the low, and 30 day realised volatility is 43.7% annualised. Market capitalisation is $3,708 billion on the 7,425.5 million shares outstanding at 2026-07-23, disclosed on the FY2026 10-K cover page. The dividend yield is 0.72%, so the return in every scenario below is a price return with a small carry.
The drawdown tracked the capital build. Capital expenditure was $115,948 million in FY2026, 34.9% of revenue, against 22.9% and 18.1% before. Free cash flow fell two years, from $74,071 million in FY2024 to $66,987 million in FY2026, while net income rose 51.7%. The stock derated as cash conversion fell.
The audited base the scenarios start from
Dollars in millions except per share. Filing figures from the 10-K filed 2026-07-29, accession 0001193125-26-323660, through the SEC-API.io MCP server. Year end price and price to earnings are market derived, no named provider.
| Line | FY2024 | FY2025 | FY2026 | Unit |
|---|---|---|---|---|
| Revenue | 245,122 | 281,724 | 331,839 | $m |
| Revenue growth | 15.7 | 14.9 | 17.8 | % |
| Operating income | 109,433 | 128,528 | 155,237 | $m |
| Operating margin | 44.6 | 45.6 | 46.8 | % |
| Other income (expense), net, GAAP | (1,646) | (4,901) | 10,697 | $m |
| Net (gains) losses, OpenAI investment | 1,482 | 4,763 | (6,530) | $m |
| Adjusted other income (expense), net | (164) | (138) | 4,167 | $m |
| Net income, GAAP | 88,136 | 101,832 | 133,749 | $m |
| OpenAI marks, net of tax | 1,126 | 3,620 | (4,963) | $m |
| Adjusted net income | 89,262 | 105,452 | 128,786 | $m |
| Diluted EPS, GAAP | 11.80 | 13.64 | 17.95 | $ |
| Adjusted diluted EPS | 11.95 | 14.13 | 17.28 | $ |
| Diluted shares | 7,469 | 7,465 | 7,453 | m |
| Capital expenditure | 44,477 | 64,551 | 115,948 | $m |
| Capital expenditure to revenue | 18.1 | 22.9 | 34.9 | % |
| Depreciation, amortisation and other | 20,958 | 29,433 | 38,534 | $m |
| Free cash flow | 74,071 | 71,611 | 66,987 | $m |
| Dividends per share declared | 3.00 | 3.32 | 3.64 | $ |
| Fiscal year end price | 418.35 | 533.50 | 464.72 | $ |
| Price to adjusted earnings at year end | 35.0 | 37.8 | 26.9 | x |
GAAP earnings overstate FY2026 and understate FY2025. Other income (expense), net swung $15,598 million between the two years, and $6,530 million of that swing is net gains and losses on the OpenAI investment, mostly the dilution gain from the October 2025 OpenAI Recapitalization described in Chapter 5. The scenarios use the adjusted figure, because a dilution gain on an equity method stake does not repeat and does not scale with revenue.
Three year scenarios to FY2029
Every input is a number, so each case can be rebuilt here. Base year revenue of $331,839 million, diluted shares of 7,453 million and dividends of $3.64 are FY2026 as filed, 0001193125-26-323660. Adjusted other income is zero in all three cases, against expenses of $138 million in FY2025 and $164 million in FY2024, so the outcome is operational. Spot of $499.38 is a market input. Implied value per share is an output of the stated assumptions.
| Line | Best case | Base case | Worst case | Unit |
|---|---|---|---|---|
| Assumptions | ||||
| Revenue CAGR, FY2026 to FY2029 | 20.0 | 14.0 | 7.0 | % |
| FY2029 operating margin | 49.0 | 46.5 | 41.0 | % |
| Adjusted other income, net | 0 | 0 | 0 | $m |
| Effective tax rate | 18.0 | 19.0 | 21.0 | % |
| Annual change in diluted shares | (0.6) | (0.2) | 0.0 | % |
| Exit price to adjusted earnings | 32.0 | 27.0 | 19.0 | x |
| Annual dividend growth | 12.0 | 10.0 | 5.0 | % |
| Results | ||||
| FY2029 revenue | 573,418 | 491,634 | 406,517 | $m |
| FY2029 operating income | 280,975 | 228,610 | 166,672 | $m |
| FY2029 net income | 230,399 | 185,174 | 131,671 | $m |
| FY2029 net margin | 40.2 | 37.7 | 32.4 | % |
| FY2029 diluted shares | 7,320 | 7,408 | 7,453 | m |
| FY2029 adjusted diluted EPS | 31.48 | 25.00 | 17.67 | $ |
| Implied value per share | 1,007 | 675 | 336 | $ |
| Cumulative dividends, three years | 13.76 | 13.25 | 12.05 | $ |
| Price change versus 499.38 | 101.7 | 35.1 | (32.8) | % |
| Total return including dividends | 104.5 | 37.8 | (30.4) | % |
| Implied annual price change | 26.4 | 10.6 | (12.4) | % |
Each assumption is calibrated on filed history. Revenue grew 17.8% in FY2026 and compounded at 13.7% a year since FY2022, so the base case of 14.0% is the realised medium term rate and the best case of 20.0% is above anything delivered. Operating margin moved 44.6, 45.6, 46.8 over three years, so the base case of 46.5% holds it 0.3 points below FY2026. The effective tax rate was 19.4% in FY2026 and 17.6% in FY2025. Diluted shares fell 0.2% over two years, from 7,469 to 7,453 million, because $16,719 million of repurchase offset $12,405 million of stock compensation and little more. The exit multiple of 27 times sits between 26.9 times at the FY2026 close and 37.8 at the FY2025 close.
Critical factors behind the best case
Four things must go right together. Each is measurable today.
The first is backlog conversion. Commercial remaining performance obligation reached $678 billion at 2026-06-30, up 84%, and Microsoft expects to recognise roughly 30% of it within twelve months. That is about $203 billion of contracted revenue landing in FY2027, against total FY2026 revenue of $331,839 million. Reaching 20% growth in year one needs the signed book to convert on schedule. Backlog is a commitment to buy capacity, and capacity that arrives late or costs more converts at a lower margin than the contract implies.
The second is capacity that earns its depreciation. Net property and equipment rose 52.7% in FY2026, from $204,966 million to $313,076 million, on $115,948 million of capital expenditure. Depreciation, amortisation and other ran at 14.9% of average net property and equipment, an implied life of about 6.7 years. The 49.0% best case margin requires revenue per unit of capacity to rise faster than the depreciation charge on it. Intelligent Cloud shows the opposite: segment revenue grew 29.7% in FY2026 while segment operating margin fell from 42.0% to 41.3%, and from 43.2% in FY2024.
The third is software leverage in Productivity and Business Processes. Segment revenue grew 15.9% to $139,996 million while operating expense grew 8.7% to $31,100 million. Segment margin went from 57.8% to 59.9%, producing $83,879 million of the $155,237 million operating income on 42% of revenue. Best case margin expansion comes from the licence business, where Microsoft 365 Commercial revenue of $101,997 million grew 16.2% with no capital charge.
The fourth is a multiple holding at 32 times. The stock traded at 35.0 times at the FY2024 close and 37.8 at the FY2025 close, so 32 times is inside the recent range. It contributes $207 of the $1,007 best case value against the 27 times base, the least evidenced input. The market rerated from 37.8 to 26.9 times in one year without an earnings miss.
Assumptions and demand drivers
Six assumptions carry the model. Revenue compounds at the stated CAGR from $331,839 million. Operating margin lands at the stated rate in FY2029, no path assumed. Adjusted other income is zero, so investment marks, the OpenAI equity method line and derivative gains are excluded. Tax applies at the stated rate to operating income. Share count moves at the stated rate off 7,453 million. Value per share is the stated multiple on FY2029 adjusted EPS. No terminal value, discount rate or cost of capital enters, so the output is an earnings multiple valuation.
Demand sits in four places, with five year histories in Chapter 1: Microsoft Cloud at $214,400 million, 64.6% of revenue, growing 26.9%; server products and cloud services at $129,425 million, 39.0% of revenue, growing 31.5%; Microsoft 365 Commercial at $101,997 million, 30.7% of revenue, growing 16.2%; and $24,100 million from commercial arrangements with OpenAI, 7.3% of revenue. Azure and other cloud services grew 41%, the fastest line management discloses. Against it, Windows and Devices fell 1.3% and More Personal Computing to $54,052 million from $54,649 million.
The OpenAI line is the one driver that is a single counterparty. It supplies 7.3% of revenue, an undisclosed share of Azure growth, and most of the backlog, since management stated RPO rose 25% excluding it.
Sensitivity
One variable moves at a time. All others hold at the base case: revenue CAGR 14.0%, operating margin 46.5%, tax 19.0%, share count $(0.2)% a year, exit multiple 27 times. Base case implied value per share is $675.
| Variable | Input | Unit | FY2029 adjusted EPS ($) | Implied value per share ($) | Change versus base (%) |
|---|---|---|---|---|---|
| Revenue CAGR | 7.0 | % | 20.67 | 558.03 | (17.3) |
| Revenue CAGR | 10.0 | % | 22.46 | 606.30 | (10.2) |
| Revenue CAGR | 14.0 | % | 25.00 | 674.87 | 0.0 |
| Revenue CAGR | 17.0 | % | 27.02 | 729.57 | 8.1 |
| Revenue CAGR | 20.0 | % | 29.15 | 787.14 | 16.6 |
| Operating margin | 41.0 | % | 22.04 | 595.05 | (11.8) |
| Operating margin | 44.0 | % | 23.65 | 638.59 | (5.4) |
| Operating margin | 46.5 | % | 25.00 | 674.87 | 0.0 |
| Operating margin | 47.8 | % | 25.69 | 693.74 | 2.8 |
| Operating margin | 49.0 | % | 26.34 | 711.15 | 5.4 |
| Exit price to adjusted earnings | 19.0 | x | 25.00 | 474.91 | (29.6) |
| Exit price to adjusted earnings | 23.0 | x | 25.00 | 574.89 | (14.8) |
| Exit price to adjusted earnings | 27.0 | x | 25.00 | 674.87 | 0.0 |
| Exit price to adjusted earnings | 30.0 | x | 25.00 | 749.86 | 11.1 |
| Exit price to adjusted earnings | 32.0 | x | 25.00 | 799.85 | 18.5 |
| Effective tax rate | 21.0 | % | 24.38 | 658.21 | (2.5) |
| Effective tax rate | 20.0 | % | 24.69 | 666.54 | (1.2) |
| Effective tax rate | 19.0 | % | 25.00 | 674.87 | 0.0 |
| Effective tax rate | 18.0 | % | 25.30 | 683.20 | 1.2 |
| Effective tax rate | 17.0 | % | 25.61 | 691.53 | 2.5 |
| Annual change in diluted shares | 0.3 | % | 24.62 | 664.83 | (1.5) |
| Annual change in diluted shares | 0.0 | % | 24.85 | 670.83 | (0.6) |
| Annual change in diluted shares | (0.2) | % | 25.00 | 674.87 | 0.0 |
| Annual change in diluted shares | (0.4) | % | 25.15 | 678.94 | 0.6 |
| Annual change in diluted shares | (0.6) | % | 25.30 | 683.05 | 1.2 |
Ranked by the spread each range produces: exit multiple $325, revenue CAGR $229, operating margin $116, tax rate $33, share count $18. The multiple and growth rate account for 77% of the total spread. Tax and buybacks are rounding. Microsoft cannot buy back enough stock to matter at this size: 36 million shares were retired in FY2026 for $16,719 million, 0.5% of the 7,453 million diluted count, and $12,405 million of stock compensation took most of it back.

The two variables with the widest one way spread. Operating margin, tax rate and share count hold at 46.5%, 19.0% and $(0.2)% a year. Cells are implied value per share in dollars. Spot is $499.38. The 27 times and 14.0% cell is the base case.
| Exit multiple against revenue CAGR | 7.0% | 10.0% | 14.0% | 17.0% | 20.0% |
|---|---|---|---|---|---|
| 19x | 393 | 427 | 475 | 513 | 554 |
| 23x | 475 | 516 | 575 | 621 | 671 |
| 27x | 558 | 606 | 675 | 730 | 787 |
| 30x | 620 | 674 | 750 | 811 | 875 |
| 32x | 661 | 719 | 800 | 865 | 933 |
Two breakevens fall out of the grid. At base case margin, tax, share count and a 27 times exit, revenue must compound at 3.11% a year to justify $499.38, against 17.8% delivered. At base case growth of 14.0%, the exit multiple must hold above 20.0 times, against 26.9 times at the FY2026 close. The price embeds a low bar on growth, a moderate one on the multiple. Four of the twenty five cells sit below spot, all at an exit multiple of 23 times or below.
What breaks the base case
Depreciation comes first. Hold the FY2026 rate of 14.9% of average net property and equipment, grow the asset base 25% a year for three years, and it reaches $611,477 million at FY2029 with a depreciation charge of $81,871 million. On base case revenue of $491,634 million, that is 16.7% of revenue against 11.6% in FY2026, a drag of 5.0 margin points. The base case assumes a 46.5% operating margin, 0.3 points below FY2026. Absorbing 5.0 points of depreciation drag while holding margin flat requires gross margin or operating expense leverage of the same size. Intelligent Cloud has not delivered it: segment margin has fallen in each of the last two years while segment revenue grew 21.5% and 29.7%. This is the mechanism behind the 41.0% worst case margin.
The OpenAI relationship comes second. It contributes $24,100 million of revenue, 7.3% of the total, and $6,000 million of receivables. It also produced $6,530 million of pretax gains in FY2026 and $4,763 million of losses in FY2025, a line the scenarios exclude. A step down in that counterparty removes revenue, slows the 41% Azure growth rate, and puts the $11,900 million funded at risk of impairment. The base case assumes the relationship holds at scale. The 10-K discloses the concentration under ASC 850 without quantifying a downside, and Item 1A the dependency without naming it.
The multiple comes third. It carries $325 of spread, more than growth and margin combined. FY2026 evidence is that it can move 11 points in a year without an earnings miss. No assumption in Table 9.2 protects against that.
The disagreement worth stating: a reader treating the capital build as a growth investment rather than a cost will use a higher margin and multiple, and lands near the best case. A reader treating it as the cost of staying in the cloud will use the depreciation arithmetic above, and lands near the worst case. Both sit on the same audited figures. The base case takes neither side and holds FY2026 margin flat, so the depreciation bridge is the assumption worth testing first.
Market data note: the price history in Figure 9.1, the spot price $499.38, the 52 week range, realised volatility, dividend yield, market capitalisation, year end prices and every price to earnings multiple are market derived. They carry no named provider and are not from filings. Scenario outputs combine those with filing figures and are labelled estimates.
Source appendix
Every figure and table in this report traces to a numbered row below. The 191 rows with an accession number are EDGAR filings, retrieved through the SEC-API.io MCP server, the only filing source used in this report. The seven rows reading n/a in the accession column are not filings and do not sit under that credit: four are earnings call transcripts, Microsoft investor material published through Microsoft Investor Relations; two are third party sector research; and one covers the market derived price, multiple, volatility and market capitalisation figures, with no named provider.
| # | Form | Filed | Period | Accession number | Used for |
|---|---|---|---|---|---|
| 1 | 10-K | 2026-07-29 | FY2026, year ended 2026-06-30 | 0001193125-26-323660 | Item 1 business description and segment composition; Item 1A risk factor set, headings and full text; Item 7 MD&A overview, summary results, segment results and drivers, gross margin, operating expenses, effective tax rate, IRS notices of proposed adjustment, the Item 7 Non-GAAP Financial Measures reconciliation, liquidity, cash flows, unearned revenue, contractual obligations, share repurchases and dividends; audited FY2026 and FY2025 income statement, balance sheet and cash flow; FY2024 to FY2026 revenue by segment, by region and by product and service offering, with segment cost of revenue and operating income on the restated basis; Note 1 OpenAI related party revenue, receivable, funding commitment and as converted interest; Note 3 components of other income (expense), net and the OpenAI Recapitalization dilution gain; finance and operating lease liabilities and leases signed but not yet commenced; remaining performance obligation and duration; legal contingencies; Item 15 exhibit index; cover page shares outstanding and public float |
| 2 | 10-K | 2026-06-22 | FY2026 ended 2026-05-31 | 0001193125-26-277521 | Oracle revenue and revenue by line, cloud, software, hardware and services expenses, operating income, net income, R&D, capex, equity, assets, operating cash flow, public float |
| 3 | 10-K | 2026-03-02 | FY2026 ended 2026-01-31 | 0001108524-26-000060 | Salesforce revenue, gross profit, operating income, net income, R&D, capex, equity, assets, operating cash flow, public float |
| 4 | 10-K | 2026-02-24 | FY2025 ended 2025-12-31 | 0000051143-26-000010 | IBM revenue, cost of revenue, gross profit, SG&A, R&D, IP and custom development income, net income, capex, equity, assets, operating cash flow, public float |
| 5 | 10-K | 2026-02-05 | FY2025 ended 2025-12-31 | 0001018724-26-000004 | Amazon net sales, cost of sales, operating income, net income, capex, equity, assets, operating cash flow, AWS segment revenue and operating income, public float |
| 6 | 10-K | 2026-02-04 | FY2025 ended 2025-12-31 | 0001652044-26-000018 | Alphabet revenue, cost of revenues, operating income, net income, R&D, capex, equity, assets, operating cash flow, Google Cloud segment revenue and operating income, public float |
| 7 | 10-K | 2025-07-30 | FY2025 ended 2025-06-30 | 0000950170-25-100235 | Audited FY2025 income statement, balance sheet and cash flow; FY2023 revenue by segment, region and offering restated onto the current basis; FY2023 to FY2025 segment cost of revenue; FY2025 commercial and total remaining performance obligation; prior year comparatives for growth rates and average equity; Item 1A risk factor set used as the FY2025 baseline for the year on year change map; source filing for Exhibits 10.15 and 10.16 incorporated by reference into the FY2026 10-K |
| 8 | 10-K | 2024-07-30 | FY2024, year ended 2024-06-30 | 0000950170-24-087843 | Audited FY2024 and FY2023 income statement, balance sheet and cash flow; FY2022 to FY2024 segment revenue as first reported on the pre FY2025 basis; FY2022 to FY2024 consolidated revenue and the product against service and other split; FY2024 and FY2023 components of other income (expense), net and equity investment gains and losses; FY2024 and FY2023 finance and operating lease liabilities; leases not yet commenced at 2024-06-30; FY2022 and FY2023 comparatives used to calibrate the scenario growth rates; source filing for Exhibits 4.24 and 10.12 incorporated by reference |
| 9 | 10-K | 2023-07-27 | FY2023, year ended 2023-06-30 | 0000950170-23-035122 | Audited FY2022 income statement, balance sheet and cash flow comparatives; FY2022 and FY2023 components of other income (expense), net and equity investment gains and losses; FY2022 finance and operating lease liabilities; FY2021 stockholders' equity used for the FY2022 average equity return |
| 10 | 20-F | 2026-02-26 | FY2025 ended 2025-12-31 | 0001104659-26-020058 | SAP revenue, gross profit, operating profit, profit attributable to owners of parent, R&D, capex, equity, assets, operating cash flow, cloud subscriptions and support revenue |
| 11 | 10-Q | 2026-04-29 | Q3 FY2026, quarter ended 2026-03-31 | 0001193125-26-191507 | Q3 FY2026 and Q3 FY2025 income statement, revenue by segment, nine month figures and the nine month OpenAI result; Part I Item 2 interim MD&A, Microsoft Cloud revenue, gross margin percentage and remaining performance obligation, headcount and currency; leases not yet commenced at 2026-03-31; Part II Item 1A interim risk factor update test; shares outstanding at 2026-04-23; Exhibits 10.1 to 10.4, the 2026 Stock Plan, the form of stock award agreement, the Executive Incentive Plan and the Deferred Compensation Plan for Non-Employee Directors |
| 12 | 10-Q | 2026-01-28 | Q2 FY2026, quarter ended 2025-12-31 | 0001193125-26-027207 | Q2 FY2026 and Q2 FY2025 income statement and revenue by segment; the quarterly OpenAI Recapitalization gain; Part I Item 2 interim MD&A, remaining performance obligation growth, Microsoft Cloud gross margin percentage and Gaming impairment charges; leases not yet commenced at 2025-12-31; Part II Item 1A interim risk factor update test; shares outstanding at 2026-01-22 |
| 13 | 10-Q | 2025-10-29 | Q1 FY2026, quarter ended 2025-09-30 | 0001193125-25-256321 | Q1 FY2026 and Q1 FY2025 income statement and revenue by segment; Part I Item 2 interim MD&A, remaining performance obligation growth, Microsoft Cloud gross margin percentage, the OpenAI net loss in the quarter and segment drivers; leases not yet commenced at 2025-09-30; Part II Item 1A interim risk factor update test; shares outstanding at 2025-10-23 |
| 14 | 8-K | 2026-07-29 | Q4 FY2026 and FY2026, quarter and year ended 2026-06-30 | 0001193125-26-323632 | Exhibit 99.1 fourth quarter and full year FY2026 press release: Q4 and FY2026 revenue in total and by segment, operating income, net income and diluted EPS; the GAAP to adjusted OpenAI reconciliation by quarter and for the year; commercial remaining performance obligation and its growth; the Anthropic investment gain, Voluntary Retirement Program and XBOX severance and impairment; quarterly additions to property and equipment; Azure annual revenue milestone, Microsoft 365 Copilot paid seats and the constant currency reconciliation; chief executive and chief financial officer commentary |
| 15 | 8-K | 2026-06-05 | 2026-06-02 | 0001193125-26-258667 | Item 5.02 Reid Hoffman decision not to stand for reelection at the 2026 annual meeting |
| 16 | 8-K | 2026-05-14 | 2026-05-13 | 0001193125-26-224155 | Item 5.02 appointment of Carmine Di Sibio to the board, Audit and Compensation Committee assignments, standard director indemnification agreement |
| 17 | 8-K | 2026-04-29 | Q3 FY2026 | 0001193125-26-191457 | Item 2.02 Exhibit 99.1 Q3 FY2026 press release: revenue, operating income and diluted EPS, the OpenAI adjustment, commercial remaining performance obligation, the AI annual revenue run rate and its growth, chief executive and chief financial officer commentary, quarterly additions to property and equipment |
| 18 | 8-K | 2026-01-28 | Q2 FY2026 | 0001193125-26-027198 | Item 2.02 Exhibit 99.1 Q2 FY2026 press release: revenue, GAAP and adjusted diluted EPS, the OpenAI Recapitalization gain, the OpenAI adjustment table, commercial remaining performance obligation, chief financial officer commentary on Microsoft Cloud revenue, quarterly additions to property and equipment |
| 19 | 8-K | 2025-12-08 | 2025-12-05 | 0001193125-25-311196 | Items 5.02 and 5.07: 2025 annual meeting certified vote tabulations for all twenty one items, shares entitled to vote and shares voted, approval of the Microsoft Corporation 2026 Stock Plan and the defeat of six shareholder proposals |
| 20 | 8-K | 2025-10-29 | Q1 FY2026 | 0001193125-25-256310 | Items 2.02, 7.01 and 9.01: Exhibit 99.1 Q1 FY2026 press release and chief financial officer commentary; Exhibit 99.2 Microsoft corporate blog setting out the October 2025 OpenAI definitive agreement, the as converted stake and its stated value, IP rights to 2032, Azure API exclusivity, the incremental $250 billion Azure purchase commitment and the removal of the compute right of first refusal |
| 21 | 8-K | 2025-09-30 | 2025-09-24 | 0001193125-25-225125 | Item 5.02 Carlos A. Rodriguez decision not to stand for reelection at the 2025 annual meeting |
| 22 | 8-K | 2024-12-03 | FY2022 to FY2024 recast | 0000950170-24-132722 | FY2022 and FY2023 revenue by segment, region and product and service offering recast onto the current segment basis; FY2022 to FY2024 segment operating income |
| 23 | 8-K | 2024-08-21 | FY2025 segment realignment | 0001193125-24-204403 | Description of the FY2025 segment and metric realignment, including which revenue lines moved between segments |
| 24 | DEF 14A | 2025-10-21 | 2025-12-05 | 0001193125-25-245150 | Principal shareholders above 5 percent and the Schedule 13G/A basis for each; director and executive officer beneficial ownership; record date, shares outstanding and holders of record; single class and one vote per share; proposals, proponents and board recommendations; terms of the 2026 Stock Plan and nonemployee director compensation |
| 25 | SC 13G | 2026-04-30 | 2026-03-31 | 0002100119-26-000820 | Vanguard Capital Management LLC initial 5 percent stake 555988240 shares 7.48 percent |
| 26 | SC 13G/A | 2026-03-27 | 2026-03-13 | 0000102909-26-001884 | The Vanguard Group Inc reported down through 5 percent to zero |
| 27 | SC 13G/A | 2024-02-13 | 2023-12-31 | 0001086364-24-006985 | BlackRock Inc 540020228 shares 7.30 percent cited in the DEF 14A principal shareholders table |
| 28 | SC 13G/A | 2024-02-13 | 2023-12-29 | 0001104659-24-021466 | The Vanguard Group Inc 664882153 shares 8.95 percent cited in the DEF 14A principal shareholders table |
| 29 | 13F-HR | 2026-08-13 | 2026-06-30 | 0000315066-26-002260 | FMR LLC Microsoft position and voting authority |
| 30 | 13F-HR | 2026-08-13 | 2026-06-30 | 0002100119-26-001527 | Vanguard Capital Management LLC Microsoft position and voting authority |
| 31 | 13F-HR | 2026-08-12 | 2026-06-30 | 0001214717-26-000008 | Geode Capital Management LLC Microsoft position and voting authority |
| 32 | 13F-HR | 2026-08-12 | 2026-06-30 | 0001374170-26-000069 | Norges Bank Microsoft position and voting authority |
| 33 | 13F-HR | 2026-08-07 | 2026-06-30 | 0000093751-26-000507 | State Street Corp Microsoft position and voting authority |
| 34 | 13F-HR | 2026-08-07 | 2026-06-30 | 0002012383-26-003238 | BlackRock Inc Microsoft position and voting authority |
| 35 | 13F-HR | 2026-05-15 | 2026-03-31 | 0000093751-26-000315 | State Street Corp Microsoft position and voting authority |
| 36 | 13F-HR | 2026-05-15 | 2026-03-31 | 0000315066-26-001390 | FMR LLC Microsoft position and voting authority |
| 37 | 13F-HR | 2026-05-15 | 2026-03-31 | 0001214717-26-000006 | Geode Capital Management LLC Microsoft position and voting authority |
| 38 | 13F-HR | 2026-05-13 | 2026-03-31 | 0002012383-26-001841 | BlackRock Inc Microsoft position; information table not retrievable; reported as n/a |
| 39 | 13F-HR | 2026-05-08 | 2026-03-31 | 0002100119-26-001306 | Vanguard Capital Management LLC Microsoft position and voting authority |
| 40 | 13F-HR | 2026-02-17 | 2025-12-31 | 0000315066-26-000611 | FMR LLC Microsoft position and voting authority |
| 41 | 13F-HR | 2026-02-13 | 2025-12-31 | 0000093751-26-000100 | State Street Corp Microsoft position and voting authority |
| 42 | 13F-HR | 2026-02-12 | 2025-12-31 | 0002012383-26-000920 | BlackRock Inc Microsoft position and voting authority |
| 43 | 13F-HR | 2026-02-10 | 2025-12-31 | 0001374170-26-000012 | Norges Bank Microsoft position and voting authority |
| 44 | 13F-HR | 2026-02-09 | 2025-12-31 | 0001214717-26-000003 | Geode Capital Management LLC Microsoft position and voting authority |
| 45 | 13F-HR | 2026-01-29 | 2025-12-31 | 0000102909-26-000031 | The Vanguard Group Inc Microsoft position and voting authority |
| 46 | 13F-HR | 2025-11-14 | 2025-09-30 | 0000093751-25-000651 | State Street Corp Microsoft position and voting authority |
| 47 | 13F-HR | 2025-11-13 | 2025-09-30 | 0000315066-25-002929 | FMR LLC Microsoft position and voting authority |
| 48 | 13F-HR | 2025-11-12 | 2025-09-30 | 0001214717-25-000016 | Geode Capital Management LLC Microsoft position and voting authority |
| 49 | 13F-HR | 2025-11-12 | 2025-09-30 | 0002012383-25-002949 | BlackRock Inc Microsoft position and voting authority |
| 50 | 13F-HR | 2025-11-07 | 2025-09-30 | 0000102909-25-000353 | The Vanguard Group Inc Microsoft position and voting authority |
| 51 | 3 | 2026-05-18 | 2026-05-13 | 0000789019-26-000074 | Section 16 initial statement of beneficial ownership, new director (Di Sibio Carmine) |
| 52 | 3 | 2025-12-08 | 2025-12-05 | 0000789019-25-000110 | Section 16 initial statement of beneficial ownership, new director (Rainey John D) |
| 53 | 3/A | 2026-05-26 | 2026-05-13 | 0000789019-26-000077 | Section 16 initial statement of beneficial ownership, new director (Di Sibio Carmine) |
| 54 | 4 | 2026-08-17 | 2026-08-17 | 0000789019-26-000145 | Table 7.2 tax withholding on vesting (Coleman Amy) |
| 55 | 4 | 2026-08-06 | 2026-08-05 | 0000789019-26-000143 | Table 7.1 open market sale; Figure 7.3 (Althoff Judson) |
| 56 | 4 | 2026-08-05 | 2026-08-04 | 0000789019-26-000141 | Table 7.1 open market sale; Figure 7.3 (Numoto Takeshi) |
| 57 | 4 | 2026-07-15 | 2026-07-15 | 0000789019-26-000139 | Table 7.2 tax withholding on vesting (Coleman Amy) |
| 58 | 4 | 2026-07-01 | 2026-07-01 | 0000789019-26-000137 | Insider filing population, twelve months to 2026-08-31, no in window transaction (Hogan Kathleen T) |
| 59 | 4 | 2026-06-16 | 2026-06-15 | 0000789019-26-000135 | Table 7.2 award vesting and stock award grant (Jolla Alice L.) |
| 60 | 4 | 2026-06-15 | 2026-06-15 | 0000789019-26-000133 | Table 7.2 tax withholding on vesting (Coleman Amy) |
| 61 | 4 | 2026-06-12 | 2026-06-10 | 0000789019-26-000121 | Table 7.1 open market sale; Figure 7.3 (Numoto Takeshi) |
| 62 | 4 | 2026-06-12 | 2026-06-11 | 0000789019-26-000122 | Table 7.2 restricted stock unit dividend equivalent accrual (Hoffman Reid) |
| 63 | 4 | 2026-06-12 | 2026-06-11 | 0000789019-26-000123 | Table 7.2 restricted stock unit dividend equivalent accrual (Di Sibio Carmine) |
| 64 | 4 | 2026-06-12 | 2026-06-11 | 0000789019-26-000124 | Table 7.2 restricted stock unit dividend equivalent accrual (Johnston Hugh F) |
| 65 | 4 | 2026-06-12 | 2026-06-11 | 0000789019-26-000125 | Table 7.2 restricted stock unit dividend equivalent accrual (List Teri) |
| 66 | 4 | 2026-06-12 | 2026-06-11 | 0000789019-26-000126 | Table 7.2 restricted stock unit dividend equivalent accrual (MacGregor Catherine) |
| 67 | 4 | 2026-06-12 | 2026-06-11 | 0000789019-26-000127 | Table 7.2 restricted stock unit dividend equivalent accrual (PETERSON SANDRA E) |
| 68 | 4 | 2026-06-12 | 2026-06-11 | 0000789019-26-000128 | Table 7.2 restricted stock unit dividend equivalent accrual (Mason Mark) |
| 69 | 4 | 2026-06-12 | 2026-06-11 | 0000789019-26-000129 | Table 7.2 restricted stock unit dividend equivalent accrual (PRITZKER PENNY S) |
| 70 | 4 | 2026-06-12 | 2026-06-11 | 0000789019-26-000130 | Table 7.2 restricted stock unit dividend equivalent accrual (Rainey John D) |
| 71 | 4 | 2026-06-12 | 2026-06-11 | 0000789019-26-000131 | Table 7.2 restricted stock unit dividend equivalent accrual (Walmsley Emma N) |
| 72 | 4 | 2026-06-10 | 2026-06-08 | 0000789019-26-000109 | Table 7.1 open market sale; Figure 7.3 (Numoto Takeshi) |
| 73 | 4 | 2026-06-09 | 2026-06-05 | 0000789019-26-000096 | Table 7.2 award vesting and stock award grant; Table 7.2 restricted stock unit dividend equivalent accrual (Di Sibio Carmine) |
| 74 | 4 | 2026-06-09 | 2026-06-05 | 0000789019-26-000097 | Table 7.2 restricted stock unit dividend equivalent accrual (Walmsley Emma N) |
| 75 | 4 | 2026-06-09 | 2026-06-05 | 0000789019-26-000098 | Table 7.2 restricted stock unit dividend equivalent accrual (Hoffman Reid) |
| 76 | 4 | 2026-06-09 | 2026-06-05 | 0000789019-26-000099 | Table 7.2 restricted stock unit dividend equivalent accrual (PETERSON SANDRA E) |
| 77 | 4 | 2026-06-09 | 2026-06-05 | 0000789019-26-000100 | Table 7.2 award vesting and stock award grant (STANTON JOHN W) |
| 78 | 4 | 2026-06-09 | 2026-06-05 | 0000789019-26-000101 | Table 7.2 restricted stock unit dividend equivalent accrual (MacGregor Catherine) |
| 79 | 4 | 2026-06-09 | 2026-06-05 | 0000789019-26-000102 | Table 7.2 award vesting and stock award grant (List Teri) |
| 80 | 4 | 2026-06-09 | 2026-06-05 | 0000789019-26-000103 | Table 7.2 restricted stock unit dividend equivalent accrual (Mason Mark) |
| 81 | 4 | 2026-06-09 | 2026-06-05 | 0000789019-26-000104 | Table 7.2 award vesting and stock award grant (SCHARF CHARLES W) |
| 82 | 4 | 2026-06-09 | 2026-06-05 | 0000789019-26-000105 | Table 7.2 restricted stock unit dividend equivalent accrual (PRITZKER PENNY S) |
| 83 | 4 | 2026-06-09 | 2026-06-05 | 0000789019-26-000106 | Table 7.2 restricted stock unit dividend equivalent accrual (Johnston Hugh F) |
| 84 | 4 | 2026-06-09 | 2026-06-05 | 0000789019-26-000107 | Table 7.2 restricted stock unit dividend equivalent accrual (Rainey John D) |
| 85 | 4 | 2026-06-02 | 2026-06-01 | 0000789019-26-000083 | Table 7.1 open market sale; Figure 7.3 (Althoff Judson) |
| 86 | 4 | 2026-06-01 | 2026-06-01 | 0000789019-26-000080 | Table 7.2 tax withholding on vesting (Coleman Amy) |
| 87 | 4 | 2026-06-01 | 2026-06-01 | 0000789019-26-000081 | Table 7.2 tax withholding on vesting (Jolla Alice L.) |
| 88 | 4 | 2026-05-18 | 2026-05-14 | 0000789019-26-000075 | Table 7.1 open market sale; Figure 7.3; Table 7.2 tax withholding on vesting (Coleman Amy) |
| 89 | 4 | 2026-04-15 | 2026-04-15 | 0000789019-26-000070 | Table 7.2 tax withholding on vesting (Coleman Amy) |
| 90 | 4 | 2026-03-16 | 2026-03-16 | 0000789019-26-000066 | Table 7.2 tax withholding on vesting (Coleman Amy) |
| 91 | 4 | 2026-03-13 | 2026-03-12 | 0000789019-26-000057 | Table 7.2 restricted stock unit dividend equivalent accrual (Hoffman Reid) |
| 92 | 4 | 2026-03-13 | 2026-03-12 | 0000789019-26-000058 | Table 7.2 restricted stock unit dividend equivalent accrual (Johnston Hugh F) |
| 93 | 4 | 2026-03-13 | 2026-03-12 | 0000789019-26-000059 | Table 7.2 restricted stock unit dividend equivalent accrual (List Teri) |
| 94 | 4 | 2026-03-13 | 2026-03-12 | 0000789019-26-000060 | Table 7.2 restricted stock unit dividend equivalent accrual (MacGregor Catherine) |
| 95 | 4 | 2026-03-13 | 2026-03-12 | 0000789019-26-000061 | Table 7.2 restricted stock unit dividend equivalent accrual (PETERSON SANDRA E) |
| 96 | 4 | 2026-03-13 | 2026-03-12 | 0000789019-26-000062 | Table 7.2 restricted stock unit dividend equivalent accrual (PRITZKER PENNY S) |
| 97 | 4 | 2026-03-13 | 2026-03-12 | 0000789019-26-000063 | Table 7.2 restricted stock unit dividend equivalent accrual (Rainey John D) |
| 98 | 4 | 2026-03-13 | 2026-03-12 | 0000789019-26-000064 | Table 7.2 restricted stock unit dividend equivalent accrual (Walmsley Emma N) |
| 99 | 4 | 2026-03-09 | 2026-03-06 | 0000789019-26-000048 | Table 7.1 open market sale; Figure 7.3 (Hogan Kathleen T) |
| 100 | 4 | 2026-03-03 | 2026-03-02 | 0000789019-26-000040 | Table 7.2 tax withholding on vesting (Coleman Amy) |
| 101 | 4 | 2026-03-03 | 2026-03-02 | 0000789019-26-000041 | Table 7.2 tax withholding on vesting (Althoff Judson) |
| 102 | 4 | 2026-03-03 | 2026-03-02 | 0000789019-26-000042 | Table 7.2 tax withholding on vesting (Hogan Kathleen T) |
| 103 | 4 | 2026-03-03 | 2026-03-02 | 0000789019-26-000043 | Table 7.2 tax withholding on vesting (SMITH BRADFORD L) |
| 104 | 4 | 2026-03-03 | 2026-03-02 | 0000789019-26-000044 | Table 7.2 tax withholding on vesting (Jolla Alice L.) |
| 105 | 4 | 2026-03-03 | 2026-03-02 | 0000789019-26-000045 | Table 7.2 tax withholding on vesting (Hood Amy) |
| 106 | 4 | 2026-03-03 | 2026-03-02 | 0000789019-26-000046 | Table 7.2 tax withholding on vesting (Numoto Takeshi) |
| 107 | 4 | 2026-02-18 | 2026-02-18 | 0000789019-26-000028 | Table 7.1 open market purchase; Figure 7.3 (STANTON JOHN W) |
| 108 | 4 | 2026-02-17 | 2026-02-17 | 0000789019-26-000026 | Table 7.2 tax withholding on vesting (Coleman Amy) |
| 109 | 4 | 2026-02-03 | 2026-01-30 | 0000789019-26-000014 | Table 7.2 restricted stock unit dividend equivalent accrual (Walmsley Emma N) |
| 110 | 4 | 2026-02-03 | 2026-01-30 | 0000789019-26-000015 | Table 7.2 restricted stock unit dividend equivalent accrual (Hoffman Reid) |
| 111 | 4 | 2026-02-03 | 2026-01-30 | 0000789019-26-000016 | Table 7.2 restricted stock unit dividend equivalent accrual (PETERSON SANDRA E) |
| 112 | 4 | 2026-02-03 | 2026-01-30 | 0000789019-26-000017 | Table 7.2 award vesting and stock award grant (STANTON JOHN W) |
| 113 | 4 | 2026-02-03 | 2026-01-30 | 0000789019-26-000018 | Table 7.2 restricted stock unit dividend equivalent accrual (MacGregor Catherine) |
| 114 | 4 | 2026-02-03 | 2026-01-30 | 0000789019-26-000019 | Table 7.2 award vesting and stock award grant (List Teri) |
| 115 | 4 | 2026-02-03 | 2026-01-30 | 0000789019-26-000020 | Table 7.2 award vesting and stock award grant (Mason Mark) |
| 116 | 4 | 2026-02-03 | 2026-01-30 | 0000789019-26-000021 | Table 7.2 award vesting and stock award grant (SCHARF CHARLES W) |
| 117 | 4 | 2026-02-03 | 2026-01-30 | 0000789019-26-000022 | Table 7.2 restricted stock unit dividend equivalent accrual (PRITZKER PENNY S) |
| 118 | 4 | 2026-02-03 | 2026-01-30 | 0000789019-26-000023 | Table 7.2 restricted stock unit dividend equivalent accrual (Johnston Hugh F) |
| 119 | 4 | 2026-02-03 | 2026-01-30 | 0000789019-26-000024 | Table 7.2 restricted stock unit dividend equivalent accrual (Rainey John D) |
| 120 | 4 | 2026-01-15 | 2026-01-15 | 0000789019-26-000002 | Table 7.2 tax withholding on vesting (Coleman Amy) |
| 121 | 4 | 2025-12-16 | 2025-12-15 | 0000789019-25-000132 | Table 7.2 tax withholding on vesting (Coleman Amy) |
| 122 | 4 | 2025-12-16 | 2025-12-15 | 0000789019-25-000133 | Table 7.2 tax withholding on vesting (Jolla Alice L.) |
| 123 | 4 | 2025-12-12 | 2025-04-23 | 0000789019-25-000120 | Insider filing population, twelve months to 2026-08-31, no in window transaction (SMITH BRADFORD L) |
| 124 | 4 | 2025-12-12 | 2025-12-10 | 0000789019-25-000121 | Table 7.2 gift (Hogan Kathleen T) |
| 125 | 4 | 2025-12-12 | 2025-12-11 | 0000789019-25-000122 | Table 7.2 restricted stock unit dividend equivalent accrual (Hoffman Reid) |
| 126 | 4 | 2025-12-12 | 2025-12-11 | 0000789019-25-000123 | Table 7.2 restricted stock unit dividend equivalent accrual (Johnston Hugh F) |
| 127 | 4 | 2025-12-12 | 2025-12-11 | 0000789019-25-000124 | Table 7.2 restricted stock unit dividend equivalent accrual (List Teri) |
| 128 | 4 | 2025-12-12 | 2025-12-11 | 0000789019-25-000125 | Table 7.2 restricted stock unit dividend equivalent accrual (MacGregor Catherine) |
| 129 | 4 | 2025-12-12 | 2025-12-11 | 0000789019-25-000126 | Table 7.2 restricted stock unit dividend equivalent accrual (PETERSON SANDRA E) |
| 130 | 4 | 2025-12-12 | 2025-12-11 | 0000789019-25-000127 | Table 7.2 restricted stock unit dividend equivalent accrual (PRITZKER PENNY S) |
| 131 | 4 | 2025-12-12 | 2025-12-11 | 0000789019-25-000128 | Table 7.2 restricted stock unit dividend equivalent accrual (Rodriguez Carlos A) |
| 132 | 4 | 2025-12-12 | 2025-12-11 | 0000789019-25-000129 | Table 7.2 restricted stock unit dividend equivalent accrual (Walmsley Emma N) |
| 133 | 4 | 2025-12-05 | 2025-12-04 | 0000789019-25-000095 | Table 7.1 open market sale; Figure 7.3 (Numoto Takeshi) |
| 134 | 4 | 2025-12-05 | 2025-12-04 | 0000789019-25-000096 | Table 7.2 restricted stock unit dividend equivalent accrual (Rodriguez Carlos A) |
| 135 | 4 | 2025-12-05 | 2025-12-04 | 0000789019-25-000097 | Table 7.2 restricted stock unit dividend equivalent accrual (Johnston Hugh F) |
| 136 | 4 | 2025-12-05 | 2025-12-04 | 0000789019-25-000098 | Table 7.2 restricted stock unit dividend equivalent accrual (Walmsley Emma N) |
| 137 | 4 | 2025-12-05 | 2025-12-04 | 0000789019-25-000099 | Table 7.2 restricted stock unit dividend equivalent accrual (MacGregor Catherine) |
| 138 | 4 | 2025-12-05 | 2025-12-04 | 0000789019-25-000100 | Table 7.2 restricted stock unit dividend equivalent accrual (Hoffman Reid) |
| 139 | 4 | 2025-12-05 | 2025-12-04 | 0000789019-25-000101 | Table 7.2 award vesting and stock award grant (List Teri) |
| 140 | 4 | 2025-12-05 | 2025-12-04 | 0000789019-25-000102 | Table 7.2 award vesting and stock award grant (Mason Mark) |
| 141 | 4 | 2025-12-05 | 2025-12-04 | 0000789019-25-000103 | Table 7.2 restricted stock unit dividend equivalent accrual (PETERSON SANDRA E) |
| 142 | 4 | 2025-12-05 | 2025-12-04 | 0000789019-25-000104 | Table 7.2 restricted stock unit dividend equivalent accrual (PRITZKER PENNY S) |
| 143 | 4 | 2025-12-05 | 2025-12-04 | 0000789019-25-000105 | Table 7.2 award vesting and stock award grant (SCHARF CHARLES W) |
| 144 | 4 | 2025-12-05 | 2025-12-04 | 0000789019-25-000106 | Table 7.2 award vesting and stock award grant (STANTON JOHN W) |
| 145 | 4 | 2025-12-03 | 2025-12-02 | 0000789019-25-000077 | Table 7.1 open market sale; Figure 7.3 (Althoff Judson) |
| 146 | 4 | 2025-12-02 | 2025-12-01 | 0000789019-25-000074 | Table 7.2 tax withholding on vesting (Coleman Amy) |
| 147 | 4 | 2025-12-02 | 2025-12-01 | 0000789019-25-000075 | Table 7.2 tax withholding on vesting (Jolla Alice L.) |
| 148 | 4 | 2025-11-21 | 2025-11-20 | 0000789019-25-000071 | Table 7.2 gift (Althoff Judson) |
| 149 | 4 | 2025-11-17 | 2025-11-17 | 0000789019-25-000069 | Table 7.2 tax withholding on vesting (Coleman Amy) |
| 150 | 4 | 2025-11-12 | 2025-11-10 | 0000789019-25-000067 | Table 7.2 gift (Nadella Satya) |
| 151 | 4 | 2025-11-07 | 2025-11-06 | 0000789019-25-000065 | Table 7.2 gift (SMITH BRADFORD L) |
| 152 | 4 | 2025-11-04 | 2025-11-03 | 0000789019-25-000063 | Table 7.1 open market sale; Figure 7.3 (SMITH BRADFORD L) |
| 153 | 4 | 2025-10-15 | 2025-10-15 | 0000789019-25-000061 | Table 7.2 tax withholding on vesting (Coleman Amy) |
| 154 | 4 | 2025-10-03 | 2025-09-15 | 0000789019-25-000059 | Table 7.2 award vesting and stock award grant (Coleman Amy) |
| 155 | 4 | 2025-09-17 | 2025-09-15 | 0000789019-25-000052 | Table 7.2 award vesting and stock award grant (Althoff Judson) |
| 156 | 4 | 2025-09-17 | 2025-09-15 | 0000789019-25-000053 | Table 7.2 award vesting and stock award grant (Coleman Amy) |
| 157 | 4 | 2025-09-17 | 2025-09-15 | 0000789019-25-000054 | Table 7.2 award vesting and stock award grant (Hogan Kathleen T) |
| 158 | 4 | 2025-09-17 | 2025-09-15 | 0000789019-25-000055 | Table 7.2 award vesting and stock award grant (Hood Amy) |
| 159 | 4 | 2025-09-17 | 2025-09-15 | 0000789019-25-000056 | Table 7.2 award vesting and stock award grant (Numoto Takeshi) |
| 160 | 4 | 2025-09-17 | 2025-09-15 | 0000789019-25-000057 | Table 7.2 award vesting and stock award grant (SMITH BRADFORD L) |
| 161 | 4 | 2025-09-15 | 2025-09-15 | 0000789019-25-000045 | Table 7.2 tax withholding on vesting (Coleman Amy) |
| 162 | 4 | 2025-09-12 | 2025-09-10 | 0000789019-25-000033 | Table 7.2 restricted stock unit dividend equivalent accrual (Hoffman Reid) |
| 163 | 4 | 2025-09-12 | 2025-09-10 | 0000789019-25-000034 | Table 7.2 award vesting and stock award grant; Table 7.2 restricted stock unit dividend equivalent accrual (List Teri) |
| 164 | 4 | 2025-09-12 | 2025-09-10 | 0000789019-25-000035 | Table 7.2 restricted stock unit dividend equivalent accrual (Johnston Hugh F) |
| 165 | 4 | 2025-09-12 | 2025-09-10 | 0000789019-25-000036 | Table 7.2 restricted stock unit dividend equivalent accrual (MacGregor Catherine) |
| 166 | 4 | 2025-09-12 | 2025-09-10 | 0000789019-25-000037 | Table 7.2 award vesting and stock award grant (Mason Mark) |
| 167 | 4 | 2025-09-12 | 2025-09-10 | 0000789019-25-000038 | Table 7.2 restricted stock unit dividend equivalent accrual (PETERSON SANDRA E) |
| 168 | 4 | 2025-09-12 | 2025-09-10 | 0000789019-25-000039 | Table 7.2 restricted stock unit dividend equivalent accrual (PRITZKER PENNY S) |
| 169 | 4 | 2025-09-12 | 2025-09-10 | 0000789019-25-000040 | Table 7.2 restricted stock unit dividend equivalent accrual (Rodriguez Carlos A) |
| 170 | 4 | 2025-09-12 | 2025-09-10 | 0000789019-25-000041 | Table 7.2 award vesting and stock award grant (SCHARF CHARLES W) |
| 171 | 4 | 2025-09-12 | 2025-09-10 | 0000789019-25-000042 | Table 7.2 award vesting and stock award grant (STANTON JOHN W) |
| 172 | 4 | 2025-09-12 | 2025-09-10 | 0000789019-25-000043 | Table 7.2 restricted stock unit dividend equivalent accrual (Walmsley Emma N) |
| 173 | 4 | 2025-09-04 | 2025-09-02 | 0000789019-25-000020 | Table 7.2 Rule 10b5-1 plan sale; Table 7.2 award vesting and stock award grant; Table 7.2 tax withholding on vesting (Nadella Satya) |
| 174 | 4 | 2025-09-03 | 2025-09-02 | 0000789019-25-000011 | Table 7.2 award vesting and stock award grant; Table 7.2 tax withholding on vesting (Althoff Judson) |
| 175 | 4 | 2025-09-03 | 2025-09-02 | 0000789019-25-000012 | Table 7.2 tax withholding on vesting (Coleman Amy) |
| 176 | 4 | 2025-09-03 | 2025-09-02 | 0000789019-25-000013 | Table 7.2 award vesting and stock award grant; Table 7.2 tax withholding on vesting (Hogan Kathleen T) |
| 177 | 4 | 2025-09-03 | 2025-09-02 | 0000789019-25-000014 | Table 7.2 award vesting and stock award grant; Table 7.2 tax withholding on vesting (Hood Amy) |
| 178 | 4 | 2025-09-03 | 2025-09-02 | 0000789019-25-000015 | Table 7.2 tax withholding on vesting (Jolla Alice L.) |
| 179 | 4 | 2025-09-03 | 2025-09-02 | 0000789019-25-000016 | Table 7.2 award vesting and stock award grant; Table 7.2 tax withholding on vesting (Numoto Takeshi) |
| 180 | 4 | 2025-09-03 | 2025-09-02 | 0000789019-25-000017 | Table 7.2 award vesting and stock award grant; Table 7.2 tax withholding on vesting (SMITH BRADFORD L) |
| 181 | 4 | 2025-09-03 | 2025-09-02 | 0000789019-25-000018 | Table 7.2 trust distribution (STANTON JOHN W) |
| 182 | 144 | 2026-08-05 | 2026-08-05 | 0001959173-26-005674 | Table 7.3 Form 144 proposed sale against Form 4 execution (Judson Althoff) |
| 183 | 144 | 2026-08-04 | 2026-08-04 | 0001959173-26-005608 | Table 7.3 Form 144 proposed sale against Form 4 execution (Takeshi Numoto) |
| 184 | 144 | 2026-06-04 | 2026-06-04 | 0001959173-26-004364 | Table 7.3 Form 144 proposed sale against Form 4 execution (Takeshi Numoto) |
| 185 | 144 | 2026-06-01 | 2026-06-01 | 0001959173-26-004196 | Table 7.3 Form 144 proposed sale against Form 4 execution (Judson Althoff) |
| 186 | 144 | 2026-05-14 | 2026-05-14 | 0001959173-26-003593 | Table 7.3 Form 144 proposed sale against Form 4 execution (Amy Coleman) |
| 187 | 144 | 2026-03-06 | 2026-03-06 | 0001959173-26-002007 | Table 7.3 Form 144 proposed sale against Form 4 execution (Kathleen T. Hogan) |
| 188 | 144 | 2025-12-03 | 2025-12-03 | 0001959173-25-007489 | Table 7.3 Form 144 proposed sale against Form 4 execution (Takeshi Numoto) |
| 189 | 144 | 2025-12-02 | 2025-12-02 | 0001959173-25-007420 | Table 7.3 Form 144 proposed sale against Form 4 execution (Judson Althoff) |
| 190 | 144 | 2025-11-03 | 2025-11-03 | 0001950047-25-008379 | Table 7.3 Form 144 proposed sale against Form 4 execution (Bradford L. Smith) |
| 191 | 144 | 2025-09-03 | 2025-09-03 | 0001950047-25-006721 | Table 7.3 Form 144 proposed sale against Form 4 execution (Satya Nadella) |
| 192 | Earnings call transcript, company investor material | 2026-07-29 | Q4 FY2026 | n/a | Microsoft Investor Relations webcast: CFO statements on capital expenditures of $41 billion, guidance of over $50 billion next quarter, Azure growth of approximately 45% in constant currency, RPO up 25% excluding OpenAI, company gross margin of 67%, headcount down 2%, full year guidance of double digit revenue and operating income growth with operating margin down less than 1 point; CEO statement on adding a gigawatt of capacity and roughly doubling overall capacity in two years |
| 193 | Earnings call transcript, company investor material | 2026-04-29 | Q3 FY2026 | n/a | Microsoft Investor Relations webcast: CFO statements on capital expenditures of $31.9 billion, guidance of over $40 billion next quarter, Azure Q4 growth guidance of 39% to 40% in constant currency, demand exceeding supply and constraint expected to persist, Microsoft Cloud gross margin of 66% |
| 194 | Earnings call transcript, company investor material | 2026-01-28 | Q2 FY2026 | n/a | Microsoft Investor Relations webcast: CFO statements on capital expenditures of $37.5 billion with roughly two thirds on short lived assets, Azure Q3 growth guidance of 37% to 38% in constant currency, RPO of $625 billion with a weighted average duration of approximately two and a half years |
| 195 | Earnings call transcript, company investor material | 2025-10-29 | Q1 FY2026 | n/a | Microsoft Investor Relations webcast: CFO statements on capital expenditures of $34.9 billion with roughly half on short lived assets, FY2026 capex growth rate expected above FY2025, Azure Q2 growth guidance of approximately 37% in constant currency, capacity constrained through at least the end of the fiscal year |
| 196 | Sector research, third party market data | 2026-07-27 | 2025 actual and 2026 forecast | n/a | Gartner press release on worldwide IT spending: software, data centre systems and total worldwide IT spending and growth in Table 4.1. Not an EDGAR filing |
| 197 | Sector research, third party market data | 2026-03 | Q4 2025 and 2026 forecast | n/a | Omdia cloud infrastructure services data: global spending, growth and vendor share in Figure 4.1, and the 2026 growth forecast quoted in the sector section. Not an EDGAR filing |
| 198 | Market price data, no named provider | n/a | September 2021 to 2026-09-01 | n/a | Monthly closing prices in Figure 9.1, the spot price of $499.38 at the close of 2026-09-01, the 52 week range, 30 day realised volatility, dividend yield, market capitalisation, fiscal year end closing prices and every price to adjusted earnings multiple in Chapters 4 and 9, including the market inputs to Table 9.1, Table 9.2, Table 9.3 and Figure 9.2. Market derived, not from SEC filings and not from the SEC-API.io MCP server |
Disclaimer
This report is not financial advice. It is a factual analysis of public filings and market data, for information only. Nothing in it is a recommendation, an offer or a solicitation to buy or sell any security, and nothing is tailored to the objectives, financial situation or needs of any reader. The scenarios, sensitivities and implied values per share in Chapter 9 are estimates on the stated assumptions. They are not forecasts, guidance or price targets, and the assumptions may not hold. Figures are reproduced as filed and sourced above; this report does not audit them. Past performance does not indicate future results. Anyone acting on this material does so at their own risk and should take independent professional advice.