Tesla, Inc. (TSLA), Financial Analysis
Insights derived from analysing SEC filings. Independent analysis, not a publication of the SEC.
Figures are read from the Forms 10-K for FY2021 to FY2025, the Forms 10-Q for Q1 2025 to Q3 2026, the Forms 8-K with all their exhibits, incl. the quarterly update decks and delivery reports (Ex 99.1), the 2025 CEO Performance Award agreement and equity plan (Ex 10.1 to 10.3), the proxy statements of 2025 and 2026 and the Form 8-K Item 5.07 vote results of 2025, Schedules 13G and Forms 3, 4 and 144 on the record for central index key 1318605, together with the comparable filings of five peers. Accession numbers for every filing used appear in the Sources appendix. Market prices are closing prices of 23 October 2026.
- Q3 2026 revenue $28.0bn, (0.2%) year on year; operating income $0.7bn, (56%), margin 2.6% against 5.8%. 9M 2026 revenue $78.7bn, +12.5%.
- Q3 2026 R&D $2.8bn, +69%, on AI, Optimus, silicon, battery and vehicle programs; stock compensation for the 2025 CEO award $275m in Q3 2026.
- Automotive gross margin excluding credits 18.1% against 15.4% in Q3 2025; regulatory credit revenue fell to $113m from $417m.
- Energy: 13.7 GWh deployed in Q3 2026; segment gross margin 33.1% including $526m of tariff refunds; FY2025 energy gross profit $3.8bn against ($0.1bn) in FY2021.
- Capex $13.0bn in 9M 2026 against $6.1bn a year earlier; FY2026 guidance about $20bn; $30bn of new credit facilities undrawn.
- Shares at $372.45 trade at 409x TTM EPS of $0.91. Base case (14% revenue CAGR, 9% operating margin, 70x P/E) implies $213 in three years; best case $621, worst case $26.
1 Revenue & Business Model
- Two reportable segments. Automotive (vehicle sales, regulatory credits, leasing, services and other) and energy generation and storage. FY2025 automotive segment revenue $82.1bn, energy $12.8bn.
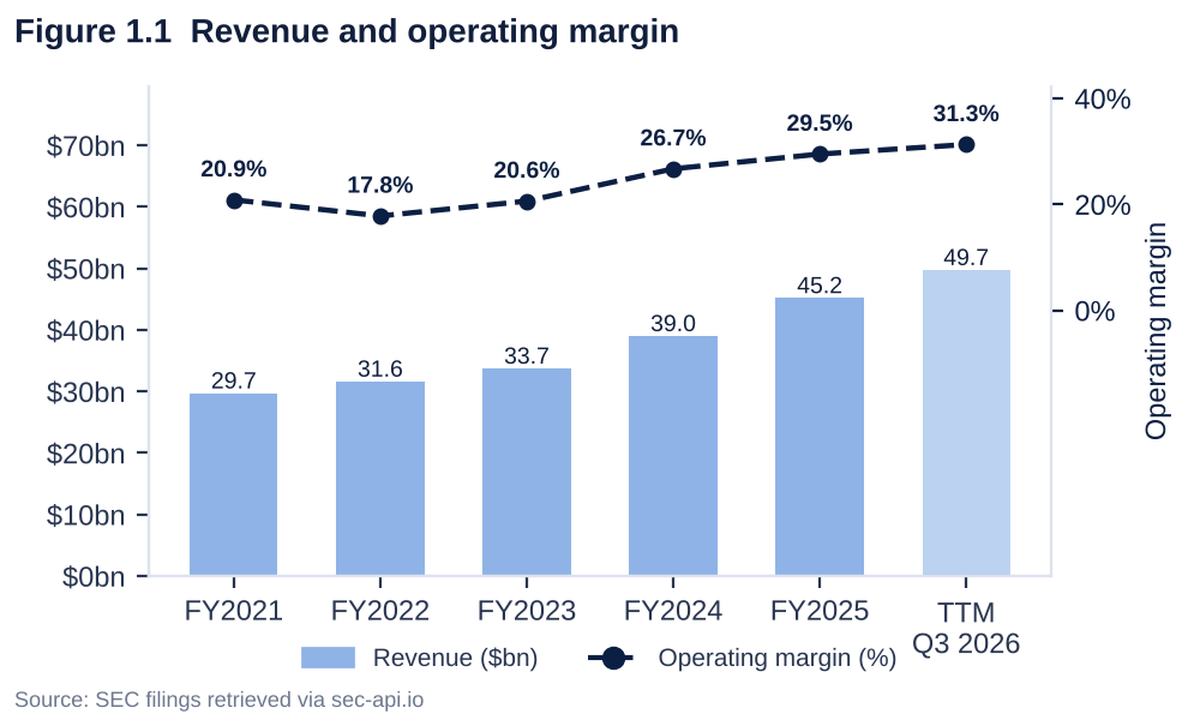
- Revenue FY2021 $53.8bn to FY2025 $94.8bn, a 15.2% CAGR; FY2024 +0.9% and FY2025 (2.9%). TTM Q3 2026 $103.6bn.
- Automotive sales fell from $78.5bn in FY2023 to $65.8bn in FY2025; deliveries 1,808,581 in FY2023, 1,636,129 in FY2025.
- Energy revenue grew from $2.8bn in FY2021 to $12.8bn in FY2025, a 46.3% CAGR; storage deployed 4.0 GWh to 46.7 GWh.
- Services and other revenue $12.5bn in FY2025, +19%; Q3 2026 +33%; segment gross margin 15.9% in Q3 2026.
- Regulatory credits fell from $2.8bn in FY2024 to $2.0bn in FY2025 and $113m in Q3 2026 after US law changes in July 2025.
- Regions FY2025: United States $47.6bn (50.2%), China $21.0bn (22.1%), other countries $26.2bn (27.7%).
- New products: Robotaxi unsupervised in six US cities with about 300 Cybercabs in Austin; Semi volume production in Nevada; Optimus production on former Model S and X lines in Fremont; 1.74m active FSD subscriptions.


| Measure | FY2021 | FY2022 | FY2023 | FY2024 | FY2025 |
|---|---|---|---|---|---|
| Energy revenue ($bn) | 2.8 | 3.9 | 6.0 | 10.1 | 12.8 |
| Automotive segment (incl. services and other) gross profit ($bn) | 13.7 | 20.6 | 16.5 | 14.8 | 13.3 |
| Energy generation and storage gross profit ($bn) | (0.1) | 0.3 | 1.1 | 2.6 | 3.8 |
| Energy gross margin (%) | (4.6) | 7.4 | 18.9 | 26.2 | 29.8 |
| Metric | Q3 2025 | Q4 2025 | Q1 2026 | Q2 2026 | Q3 2026 |
|---|---|---|---|---|---|
| Deliveries (thousands) | 497.1 | 418.2 | 358.0 | 480.1 | 486.5 |
| Production (thousands) | 447.4 | 434.4 | 408.4 | 451.8 | 464.4 |
| Energy storage deployed (GWh) | 12.5 | 14.2 | 8.8 | 13.5 | 13.7 |
| Regulatory credit revenue ($m) | 417 | 542 | 380 | 146 | 113 |
| Segment | Q3 2025 | Q4 2025 | Q1 2026 | Q2 2026 | Q3 2026 |
|---|---|---|---|---|---|
| Automotive segment (%) | 16.1 | 18.6 | 18.9 | 16.4 | 18.0 |
| Energy generation and storage (%) | 31.4 | 28.6 | 39.5 | 20.4 | 33.1 |
| Total automotive GAAP gross margin (%) | 17.0 | 20.4 | 21.1 | 16.9 | 18.5 |
| Total automotive gross margin ex regulatory credits (non GAAP) (%) | 15.4 | 17.9 | 19.2 | 16.3 | 18.1 |
2 Financial Analysis & Ratios
- Operating margin fell from 16.8% in FY2022 to 4.6% in FY2025 and 3.3% TTM; gross margin 19.3% TTM against 25.6% in FY2022.
- Operating expenses TTM $16.3bn against $8.8bn in FY2023: R&D $8.9bn and SG&A $7.5bn; stock compensation $4.3bn TTM against $1.8bn in FY2023.
- Net income TTM $3.2bn, incl. a $0.9bn gain on the SpaceX stake in 9M 2026; FY2023 net income $15.0bn included a $5.9bn tax valuation allowance release.
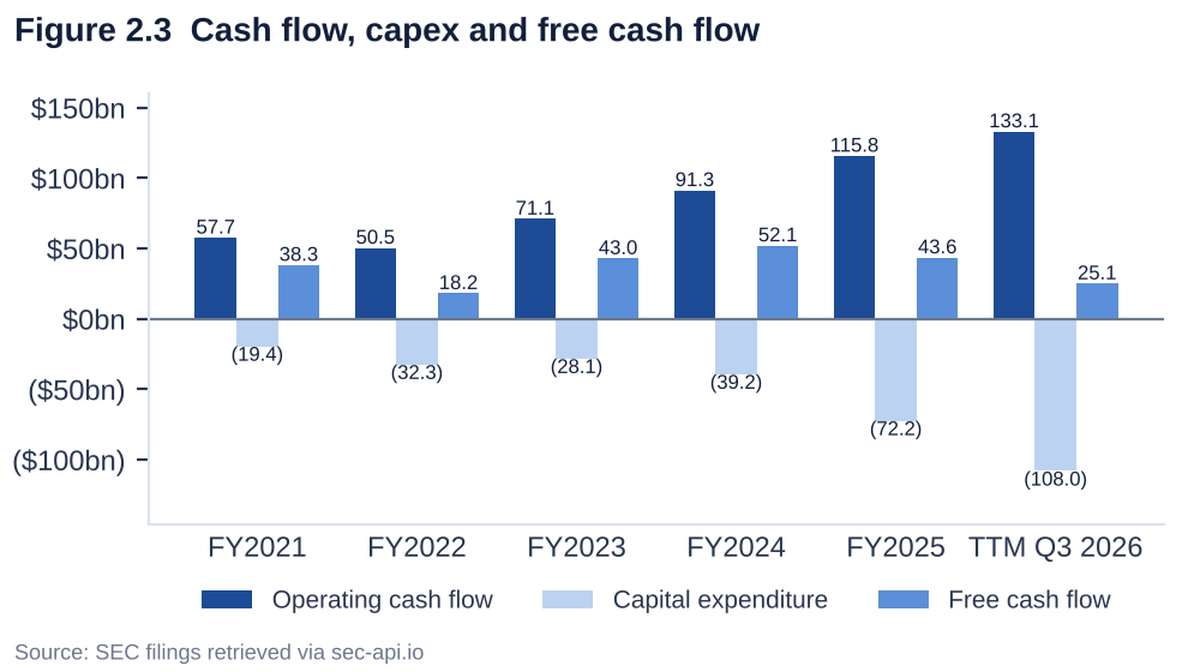
- Free cash flow TTM $3.3bn on capex $15.4bn; Q2 2026 FCF ($1.1bn) on $5.8bn capex.
- Balance sheet: cash and investments $45.4bn, debt and finance leases $9.5bn (mostly non recourse); SpaceX stake at fair value $2.9bn; no buybacks or dividends.
- Non GAAP: Q3 2026 EPS $0.48 against GAAP $0.22; the gap is mainly stock compensation.
| Line item | FY2021 | FY2022 | FY2023 | FY2024 | FY2025 | TTM Q3 2026 |
|---|---|---|---|---|---|---|
| Revenue | 53.8 | 81.5 | 96.8 | 97.7 | 94.8 | 103.6 |
| Gross profit | 13.6 | 20.9 | 17.7 | 17.4 | 17.1 | 20.0 |
| Research and development | 2.6 | 3.1 | 4.0 | 4.5 | 6.4 | 8.9 |
| Selling, general and administrative | 4.5 | 3.9 | 4.8 | 5.2 | 5.8 | 7.5 |
| Operating income | 6.5 | 13.7 | 8.9 | 7.1 | 4.4 | 3.5 |
| Net income | 5.5 | 12.6 | 15.0 | 7.1 | 3.8 | 3.2 |
| Diluted EPS ($) | 1.63 | 3.62 | 4.30 | 2.04 | 1.08 | 0.91 |
| Operating cash flow | 11.5 | 14.7 | 13.3 | 14.9 | 14.7 | 18.7 |
| Capital expenditure | (6.5) | (7.2) | (8.9) | (11.3) | (8.5) | (15.4) |
| Free cash flow | 5.0 | 7.6 | 4.4 | 3.6 | 6.2 | 3.3 |
| Stock based compensation | 2.1 | 1.6 | 1.8 | 2.0 | 2.8 | 4.3 |
| Cash and investments | 17.7 | 22.2 | 29.1 | 36.6 | 44.1 | 45.4 |
| Total debt | 6.8 | 3.1 | 5.2 | 8.2 | 8.4 | 9.5 |
| Total equity | 30.2 | 44.7 | 62.6 | 72.9 | 82.1 | 89.3 |

| Metric | Q3 2025 | Q3 2026 | Change |
|---|---|---|---|
| Revenue ($bn) | 28.09 | 28.05 | (0.2%) |
| Gross profit ($bn) | 5.05 | 5.49 | 8.7% |
| Operating income ($bn) | 1.62 | 0.72 | (55.8%) |
| Net income ($bn) | 1.37 | 0.79 | (42.7%) |
| Diluted EPS ($) | 0.39 | 0.22 | (43.6%) |
| Operating cash flow ($bn) | 6.24 | 6.26 | 0.4% |
| Free cash flow ($bn) | 3.99 | 1.53 | (61.6%) |
| Operating margin (%) | 5.8 | 2.6 | (3.2 pts) |
| Net margin (%) | 4.9 | 2.8 | (2.1 pts) |
| Ratio | FY2021 | FY2022 | FY2023 | FY2024 | FY2025 | TTM Q3 2026 |
|---|---|---|---|---|---|---|
| Growth and margins | ||||||
| Revenue growth (%) | n/a | 51.4 | 18.8 | 0.9 | (2.9) | n/a |
| Gross margin (%) | 25.3 | 25.6 | 18.2 | 17.9 | 18.0 | 19.3 |
| Operating margin (%) | 12.1 | 16.8 | 9.2 | 7.2 | 4.6 | 3.3 |
| Net margin (%) | 10.3 | 15.4 | 15.5 | 7.3 | 4.0 | 3.1 |
| FCF margin (%) | 9.3 | 9.3 | 4.5 | 3.7 | 6.6 | 3.2 |
| Cost and investment intensity | ||||||
| R&D (%) revenue | 4.8 | 3.8 | 4.1 | 4.6 | 6.8 | 8.6 |
| SBC (%) revenue | 3.9 | 1.9 | 1.9 | 2.0 | 3.0 | 4.2 |
| Capex (%) revenue | 12.1 | 8.8 | 9.2 | 11.6 | 9.0 | 14.9 |
| Effective tax rate (%) | 11.0 | 8.3 | (50.1) | 20.4 | 27.0 | 22.2 |
| Returns | ||||||
| ROE (%) | 18.3 | 33.5 | 27.9 | 10.5 | 4.9 | 3.6 |
| ROA (%) | 8.9 | 17.4 | 15.9 | 6.2 | 2.9 | 2.0 |
| ROIC (%) | 30.0 | 48.9 | 18.8 | 12.6 | 6.8 | 5.1 |
| Asset turnover (x) | 0.87 | 0.99 | 0.91 | 0.80 | 0.69 | 0.66 |
| Liquidity and leverage | ||||||
| Current ratio (x) | 1.38 | 1.53 | 1.73 | 2.02 | 2.16 | 1.74 |
| Debt to equity (x) | 0.23 | 0.07 | 0.08 | 0.11 | 0.10 | 0.11 |
| Net cash ($bn) | 10.9 | 19.1 | 23.9 | 28.4 | 35.7 | 35.9 |
| Efficiency and cash quality | ||||||
| Days sales outstanding | 13 | 13 | 13 | 17 | 18 | 16 |
| Inventory days | 52 | 77 | 63 | 55 | 58 | 62 |
| FCF to net income (x) | 0.90 | 0.60 | 0.29 | 0.51 | 1.64 | 1.03 |


| Measure | Value |
|---|---|
| Market cap ($bn) | 1,472.2 |
| Enterprise value ($bn) | 1,436.3 |
| P/E (TTM) (x) | 409.3 |
| EV/Sales (TTM) (x) | 13.9 |
| EV/EBITDA (TTM) (x) | 141.2 |
| FCF yield (%) | 0.2 |
| Price/Book (x) | 16.5 |
3 MD&A & Management Commentary
Latest earnings call and results release
- Q3 2026 (21 Oct 2026): revenue $28.05bn against about $28.06bn consensus; non GAAP EPS $0.48 against $0.45; FCF $1.5bn; cash and investments $45.4bn.
- Capex: CFO set 2026 capex at about $20bn, funded mainly from operating cash flow, after more than $25bn stated on the Q2 2026 call; no draws planned on the $30bn facilities in 2026.
- Margins: automotive gross margin excluding credits 18.1% against 16.3% in Q2 2026 on a higher Asia Pacific mix; energy gross margin 33.1% incl. $526m tariff refunds; services and other 15.9%.
- FSD: over 75% of North America Q3 deliveries included a paid FSD sign up; paid FSD customers above 1.7m; management confirmed FSD annual recurring revenue approaching $1bn.
- Volume: deliveries constrained by production, with battery availability named as the limit; Elon Musk targets about 5m vehicles per year by about 2030.
- Robotaxi: unsupervised in six cities; cumulative unsupervised miles rose eightfold in Q3 to nearly 2m; Cybercab rides in Dallas from November 2026; customer cars with unsupervised FSD around Q2 2027.
- Optimus and chips: Fremont line equipped for about 1m robots per year; external deliveries around end 2027; AI5 chip in Optimus around April 2027; Terafab first test chip around May or June 2027.
- SpaceX: Elon Musk declined questions on a combination; the 10-Q discloses a board special committee to explore a deeper relationship with SpaceX.
- Q2 2026 call (22 Jul 2026): capex guidance above $25bn; $1.0bn SpaceX stake gain; energy margin 20.4% after a $240m warranty adjustment, normalized in the low to mid 20% range.
| Item | Outlook | Source |
|---|---|---|
| 2026 capital expenditure | about $20bn (10-Q: in excess of $20bn); 9M 2026 $13.0bn | 10-Q Q3 2026; Q3 2026 call |
| Credit facilities | $30bn committed, undrawn; no draws planned in 2026 | 8-K 29 Sep 2026; Q3 2026 call |
| Vehicle volume | no numeric guidance; maximum capacity utilization; battery supply limits volume | 8-K 21 Oct 2026, Ex 99.1 |
| AI training compute | 400 MW by end 2026 (about 225 MW at Q3 2026) | 8-K 21 Oct 2026, Ex 99.1 |
| Optimus | external deliveries around end 2027 | Q3 2026 call |
| Robotaxi | customer cars unsupervised around Q2 2027; target cost $0.30 per mile | Q3 2026 call |
| Energy | Megafactory Texas 50 GWh planned; Megapack production almost sold out for 2027 | 8-K 21 Oct 2026, Ex 99.1; Q3 2026 call |
Management and CFO commentary
- CFO Vaibhav Taneja, 2026 capex path: above $20bn (January 2026), above $25bn (April and July 2026), about $20bn (October 2026), funded mainly from operating cash flow; no draws planned on the $30bn facilities in 2026.
- CFO, Q4 2025 call (28 Jan 2026): total gross margin 20.1%, highest in over two years; operating expenses up about $500m on the quarter, mainly stock compensation for the CEO award; paid FSD customers near 1.1m, about 70% upfront purchases.
- CFO, Q2 and Q3 2026 calls: energy margin normalized in the low to mid 20% range; Q3 2026 energy margin 33.1% included $526m of tariff refunds; services and other margin a record 15.9%.
- Company letters in the Update decks (Ex 99.1): January 2026 plan to ramp six new production lines in 2026 across vehicles, robots, storage and batteries; July 2026 described as the largest investment phase; October 2026 reports the largest vehicle backlog in four years and the highest energy storage order rate, linked to data center demand.
- CEO Elon Musk on the calls: Q4 2025: Cybercab production from April 2026; Q1 2026: unsupervised FSD and Robotaxi revenue not material in 2026; Q3 2026: about 5m vehicles a year by about 2030, Optimus external deliveries around end 2027.
| Speaker | Date and source | Statement |
|---|---|---|
| Vaibhav Taneja, CFO | 28 Jan 2026, Q4 2025 call | “we have over $44 billion of cash and investments on the books” |
| Elon Musk, CEO | 28 Jan 2026, Q4 2025 call, on Optimus | “I'm confident that we'll get to a million units a year” |
| Item | Disclosure |
|---|---|
| 10-K FY2025, Item 1 | Headcount 134,785 at FY2025. US consumer EV and residential energy tax credits repealed by the July 2025 law; regulatory credit programs restricted. Lithium refinery in Texas began operating in January 2026. |
| 10-K FY2025, Item 1A | New or reworded risks: demand tied to adoption of autonomous driving; development of Optimus in a nascent industry; CEO award product goals possibly misaligned with consumer demand; forced sales of pledged Musk shares. Removed: Gigafactory New York obligations and ESG scrutiny. |
| 10-K FY2025, Item 3 | Delaware derivative suits on Musk, X and xAI dismissed in April 2026 and appealed; Benavides verdict of $129m compensatory plus $200m punitive under appeal; securities class action on Autopilot, FSD and Robotaxi statements pending. |
| 10-K FY2025, tax | FY2023 net income included a $5.9bn valuation allowance release; stock compensation on the 2025 CEO award is not tax deductible. |
| 10-Q Q3 2026, MD&A | Regulatory credits (73%); services and other +33%; energy revenue (16%) on $339m of tariff refunds owed to Megapack customers, lower Megapack prices and fewer Powerwall deployments. |
| 10-Q Q3 2026, CEO award | Unrecognized expense for the probable 20m vehicle milestone $9.74bn over 8.9 years; non probable milestones carry $105.8bn to $120.4bn. |
| 10-Q Q3 2026, related party | $2.0bn invested in SpaceX stock (formerly xAI preferred), fair value $2.9bn; lockup ends December 2026. SpaceX bought Megapacks: $626m revenue in 9M 2026, receivable $729m. |
| 10-Q Q3 2026, Item 5 | Board formed a special committee of disinterested directors to explore a deeper relationship with SpaceX, which could include a business combination. |
| 10-Q Q3 2026, equity | Elon Musk exercised about 304.0m 2018 award options in Q2 2026 after the Delaware Supreme Court reinstated the award; net shares restricted to 19 Jan 2028. The 96m share interim award was forfeited. |
4 Sector & Competitor Analysis
- Sector: electric vehicles, autonomy and energy storage. Global electric car sales passed 20m in 2025, +20%, about a quarter of new cars; China made nearly three quarters of electric cars produced.
- Growth: TSLA +12.5% in 9M 2026 against GM +1.4%, Ford +0.8%, Rivian +19.5% (H1 2026), Toyota +10.4% (April to June 2026) and BYD (7.1%) (H1 2026).
- Margins: TSLA TTM operating margin 3.3% against Toyota 7.1%, GM 2.3%, Ford (3.7%) and Rivian (60.1%); TSLA gross margin 19.3% against BYD 18.9% and Ford 8.2%.
- Valuation: TSLA 13.9x EV/Sales and 409x P/E, against GM 16.6x P/E and Rivian 2.8x EV/Sales.
- BYD: H1 2026 vehicle sales (15.7%) to 1.81m while overseas sales rose 67.8% to about 792,000.
- Tariffs: a February 2026 US Supreme Court ruling invalidated IEEPA tariffs; Tesla recognized $786m of refunds in Q3 2026 cost of revenue.
| Company | Revenue TTM ($bn) | Revenue growth (%) | Gross margin (%) | Operating margin (%) | Net margin (%) | FCF margin (%) | ROE (%) | Net cash ($bn) | Market value ($bn) | EV/Sales (x) | P/E TTM (x) |
|---|---|---|---|---|---|---|---|---|---|---|---|
| TSLA | 103.6 | 12.5 | 19.3 | 3.3 | 3.1 | 3.2 | 3.6 | 35.9 | 1,472 | 13.9 | 409.3 |
| GM | 186.9 | 1.4 | n/a | 2.3 | 2.1 | 7.7 | 6.3 | n/a | 64 | n/a | 16.6 |
| F | 188.0 | 0.8 | 8.2 | (3.7) | (3.9) | 3.9 | (20.7) | n/a | 46 | n/a | n/a |
| RIVN | 5.9 | 19.5 | 7.5 | (60.1) | (55.0) | (59.3) | (63.1) | 0.9 | 17 | 2.8 | n/a |
| TM | n/a | 10.4 | n/a | 7.1 | 8.6 | n/a | n/a | n/a | n/a | n/a | n/a |
| BYD | n/a | (7.1) | 18.9 | n/a | 3.6 | n/a | n/a | n/a | n/a | n/a | n/a |

5 Material Events & Contracts
- Ten Forms 8-K in twelve months: four delivery reports, four results releases, the 2025 annual meeting and the September 2026 credit facilities.
- Credit facilities (29 Sep 2026): $20bn delayed draw term loan to September 2029, $8bn five year revolver and $2bn 364 day revolver; the $5bn facility due January 2028 was terminated.
- xAI and SpaceX: January 2026 agreement to invest about $2bn in xAI Series E preferred; the stake became SpaceX common stock, fair value $2.9bn at 30 Sep 2026.
- Next annual meeting 3 Dec 2026; proxy statement filed 19 Oct 2026.
| Date | Items | Event |
|---|---|---|
| 7 Nov 2025 | 5.02, 5.07, 9.01 | Annual meeting of 6 Nov 2025: 2025 CEO Performance Award (about 423.7m restricted shares) approved; amended 2019 Equity Incentive Plan approved; annual director elections proposal approved; xAI investment proposal not approved under the bylaw standard. |
| 2 Jan 2026 | 2.02, 9.01 | Q4 2025 production 434,358, deliveries 418,227; 14.2 GWh storage deployed; FY2025 deliveries 1,636,129. |
| 28 Jan 2026 | 2.02, 9.01 | FY2025 results: revenue $94.8bn (3%) lower, operating income $4.4bn, net income $3.8bn, FCF $6.2bn; about $2bn xAI Series E investment agreed on 16 Jan 2026. |
| 2 Apr 2026 | 2.02, 9.01 | Q1 2026 production 408,386, deliveries 358,023; 8.8 GWh deployed. |
| 22 Apr 2026 | 2.02, 9.01 | Q1 2026 results: revenue $22.4bn (+16%), operating income $0.9bn, net income $0.5bn, FCF $1.4bn; $2.0bn paid for the SpaceX equity stake. |
| 2 Jul 2026 | 2.02, 9.01 | Q2 2026 production 451,758, deliveries 480,126; 13.5 GWh deployed. |
| 22 Jul 2026 | 2.02, 9.01 | Q2 2026 results: revenue $28.2bn (+26%), operating income $0.4bn, net income $1.1bn incl. $1.0bn SpaceX gain, FCF ($1.1bn) on $5.8bn capex; Cybercab production began. |
| 29 Sep 2026 | 1.01, 1.02, 2.03, 9.01 | Three unsecured credit agreements with $30bn of commitments; $5bn facility due January 2028 terminated. |
| 2 Oct 2026 | 2.02, 9.01 | Q3 2026 production 464,391, deliveries 486,532; 13.7 GWh deployed. |
| 21 Oct 2026 | 2.02, 9.01 | Q3 2026 results: revenue $28.0bn, operating income $0.7bn (2.6%), net income $0.8bn, non GAAP EPS $0.48, FCF $1.5bn; Optimus production began in Fremont. |
| Contract | Terms |
|---|---|
| Credit facilities, September 2026 | $20bn delayed draw term loan to September 2029; $8bn revolver to September 2031; $2bn 364 day revolver; all undrawn at 30 Sep 2026. |
| Debt | $9.3bn principal at 30 Sep 2026, mostly non recourse: China working capital facility $6.0bn at 2.01% to 2.11%, automotive ABS $2.7bn, energy ABS $0.7bn. |
| 2025 CEO Performance Award | 423.7m restricted shares in tranches tied to market value of $2.0tn to $8.5tn and operating milestones (20m vehicles, 10m FSD subscriptions, 1m bots, 1m Robotaxis, adjusted EBITDA $50bn to $400bn). |
| SpaceX relationship | $2.0bn equity stake; Megapack sales to SpaceX $626m in 9M 2026; Terafab cost split with SpaceX under discussion. |
6 Ownership, Voting Power & Annual Meeting
- One class of common stock. Elon Musk owns 19.8% excluding the 423.7m unearned 2025 award shares, which vote in proportion to all other votes until earned; 207.5m of his shares are pledged.
- 2025 annual meeting (6 Nov 2025): CEO award approved with 77.0% of votes cast; Ira Ehrenpreis reelected with 65.0%; annual director elections approved; removal of supermajority voting not approved; xAI investment proposal had 53.6% of votes cast but failed because abstentions count as against.
- 2026 annual meeting on 3 Dec 2026; the proxy statement was filed on 19 Oct 2026.
- Insiders, 12 months: no open market purchases; sales about $87.7m. Kathleen Wilson-Thompson $30.0m, James Murdoch $26.7m, Kimbal Musk $25.6m, CFO Vaibhav Taneja $5.4m. Elon Musk made no open market trades; he exercised 304.0m 2018 award options at $23.34 on 16 Jun 2026.
| Proposal | For (bn votes) | Against (bn votes) | Abstain (bn votes) | For as % of votes cast | Result |
|---|---|---|---|---|---|
| Elect Ira Ehrenpreis | 1.595 | 0.859 | 0.016 | 65.0 | Elected |
| Elect Joe Gebbia | 2.141 | 0.311 | 0.018 | 87.3 | Elected |
| Elect Kathleen Wilson-Thompson | 1.924 | 0.529 | 0.016 | 78.4 | Elected |
| Advisory vote on executive compensation | 1.932 | 0.524 | 0.014 | 78.7 | Approved |
| Approve A&R 2019 Equity Incentive Plan | 1.943 | 0.515 | 0.012 | 79.1 | Approved |
| Approve 2025 CEO Performance Award | 1.892 | 0.565 | 0.012 | 77.0 | Approved |
| Ratify PricewaterhouseCoopers LLP as auditor for FY2025 | 2.689 | 0.067 | 0.016 | 97.6 | Approved |
| Eliminate supermajority voting requirements (management) | 1.310 | 0.956 | 0.182 | 57.8 | Not approved |
| Shareholder: Board authorization of investment in x.AI Corp | 1.059 | 0.916 | 0.473 | 53.6 | Not approved (bylaw standard) |
| Shareholder: sustainability metrics in executive pay | 0.216 | 2.224 | 0.029 | 8.9 | Not approved |
| Shareholder: child labor audit | 0.189 | 2.238 | 0.042 | 7.8 | Not approved |
| Shareholder: repeal 3% derivative suit ownership threshold | 0.611 | 1.821 | 0.037 | 25.1 | Not approved |
| Shareholder: amend Article X of bylaws | 0.379 | 2.049 | 0.041 | 15.6 | Not approved |
| Shareholder: elect each director annually | 1.328 | 1.119 | 0.022 | 54.3 | Approved |
| Shareholder: proposal that won 54% support at 2024 meeting | 0.787 | 1.649 | 0.033 | 32.3 | Not approved |
| Shareholder: shareholder approval before bylaw amendment under TBOC 21.373 | 1.205 | 1.234 | 0.030 | 49.4 | Not approved |
Remarks at the 6 Nov 2025 annual meeting
- Vehicle targets presented: production run rate of 2.6m by end 2026, 4m by end 2027 and 5m by end 2028, against about 1.8m in 2025.
- Robotaxi and Cybercab: service then in Austin and the San Francisco Bay Area with Nevada, Florida and Arizona next; target operating cost under $0.20 per mile; Cybercab line cycle time under 10 seconds.
- Optimus: Fremont line of 1m units a year and Giga Texas line of 10m a year; target cost $20,000 per robot at scale.
- Chips: AI5 described as up to 50x AI4 performance with volume production in 2027; Elon Musk said Tesla needs a fab of at least 100,000 wafer starts a month.
- Q&A: FSD transfers to a new car extended for at least another quarter; Elon Musk said he wants Tesla shareholders to be able to participate in SpaceX.
| Holder | Shares (m) | Stake (%) | Note |
|---|---|---|---|
| Elon Musk | 699.6 | 19.8 | 413.2m in trust plus 286.4m restricted shares from the 2018 award; 207.5m pledged |
| Vanguard Capital Management | 210.8 | 5.3 | Schedule 13G of 30 Apr 2026 |
| Directors and officers as a group | 706.5 | 20.0 | Excludes 423.7m unearned 2025 CEO award shares |
7 Risk Factors
- The Q3 2026 Form 10-Q adds no new risk factors. The FY2025 Form 10-K added risks on autonomy demand, Optimus and the CEO award goals.
| Risk | Disclosure and change |
|---|---|
| Autonomy and new products (new) | Demand tied to adoption of autonomous driving; Optimus in a nascent industry; regulatory approval of unsupervised FSD and Robotaxi. |
| CEO award alignment (new) | Product goals in the 2025 award may not match consumer demand; unrecognized expense $9.74bn for the probable milestone. |
| Key person and pledged shares | Dependence on Elon Musk; reworded risk on forced sales of 207.5m pledged shares; SpaceX special committee and related party dealings. |
| Policy and credits | US consumer EV credits repealed; regulatory credit revenue down to $113m in Q3 2026; tariff exposure and refunds. |
| Competition and pricing | Chinese makers expand abroad (BYD overseas sales +67.8% in H1 2026); FY2025 deliveries (8.6%). |
| Supply chain | Battery and electronic component availability limits vehicle production. |
| Litigation | Autopilot and FSD suits, Benavides verdict under appeal, securities class action, race discrimination trials. |
| Capital intensity | Capex about $20bn in 2026 plus Terafab equipment of tens of billions through early 2028. |
8 Stock Price, Scenarios & Sensitivity
- TSLA closed at $372.45 on 23 Oct 2026, 25.3% below the 52 week high of $498.83 and 25.2% above the low of $297.38.
- Valuation: 409x TTM GAAP EPS of $0.91; 13.9x EV/Sales; 95.8x TTM adjusted EBITDA of $15.0bn; market value includes 423.7m unearned award shares ($1.31tn without them).
- Consensus: revenue FY2027 $118.2bn and FY2028 $140.2bn; EPS FY2027 $2.48 and FY2028 $3.33, on an adjusted basis.
- Scenario model: revenue grows from TTM Q3 2026 $103.6bn for three years; interest and other income $1.5bn a year; 20% tax rate; price equals FY2029 GAAP EPS times exit P/E.

Critical factors and core assumptions
| Factor | Current value | Best case requires | Evidence in filings and calls |
|---|---|---|---|
| Robotaxi and Cybercab | six US cities unsupervised; about 300 Cybercabs; nearly 2m unsupervised miles | fleet in the tens of thousands across large US metros by 2028 at or below $0.30 per mile | 8-K 21 Oct 2026, Ex 99.1; Q3 2026 call |
| FSD adoption | 1.74m active subscriptions; ARR approaching $1bn; approved in nine EU countries | EU and China approval in 2027 and several million paid users | 8-K 21 Oct 2026, Ex 99.1; Q3 2026 call |
| Vehicle volume | 486,532 deliveries in Q3 2026; battery supply limits volume | above 3m deliveries in FY2029 | 10-Q MD&A; Q3 2026 call |
| Energy storage | 46.7 GWh in FY2025; segment margin 30.2% in 9M 2026 | above 100 GWh a year near 30% margin | 10-Q segment note; 8-K 21 Oct 2026 |
| Optimus | production started in Fremont | external revenue by FY2029 | Q3 2026 call |
| Margin recovery | TTM operating margin 3.3%; SBC $4.3bn; capex about $20bn | operating margin above 15% as capex intensity falls | 10-Q Q3 2026 |
- Revenue base TTM Q3 2026 $103.6bn; consensus FY2028 revenue $140.2bn.
- Best case: 22% revenue CAGR to $188.1bn, 16% operating margin (FY2022: 16.8%), 100x P/E, share count +3%.
- Base case: 14% revenue CAGR to $153.4bn, 9% margin, 70x P/E, share count +2%.
- Worst case: 2% revenue CAGR to $109.9bn, 2% margin, 35x P/E, share count +1%.
- Share base 3.95bn incl. 423.7m unearned award shares; tax rate 20%; interest and other income $1.5bn a year.
Scenarios, three years forward
| Measure | Worst case | Base case | Best case |
|---|---|---|---|
| Revenue CAGR, 3 years (%) | 2.0 | 14.0 | 22.0 |
| Revenue, FY2029 ($bn) | 109.9 | 153.4 | 188.1 |
| Operating margin, FY2029 (%) | 2.0 | 9.0 | 16.0 |
| Net income, FY2029 ($bn) | 3.0 | 12.2 | 25.3 |
| EPS, FY2029 ($) | 0.74 | 3.04 | 6.21 |
| Exit P/E (x) | 35.0 | 70.0 | 100.0 |
| Implied price ($) | 26 | 213 | 621 |
| Change against $372.45 (%) | (93) | (43) | 67 |
| Implied annual return (%) | (58.9) | (17.0) | 18.6 |

Sensitivity analysis
| Revenue CAGR \ Operating margin | 2% | 6% | 9% | 12% | 16% | 20% |
|---|---|---|---|---|---|---|
| 2% | $51 | $112 | $158 | $204 | $265 | $326 |
| 8% | $57 | $130 | $184 | $238 | $311 | $383 |
| 14% | $63 | $149 | $213 | $277 | $362 | $447 |
| 20% | $71 | $170 | $245 | $319 | $419 | $518 |
| 26% | $78 | $193 | $280 | $366 | $481 | $596 |
| Exit P/E \ Operating margin | 2% | 6% | 9% | 12% | 16% | 20% |
|---|---|---|---|---|---|---|
| 35x | $32 | $74 | $106 | $138 | $181 | $224 |
| 50x | $45 | $106 | $152 | $198 | $258 | $319 |
| 70x | $63 | $149 | $213 | $277 | $362 | $447 |
| 85x | $77 | $181 | $258 | $336 | $439 | $543 |
| 100x | $91 | $212 | $304 | $395 | $517 | $639 |
Disclaimer
This analysis is for information only and is not financial advice. It is derived from public SEC filings retrieved via sec-api.io and is not a publication of the U.S. Securities and Exchange Commission. Scenario values are model outputs under stated assumptions and are not forecasts. Data as of 23 October 2026.
Sources
All company figures are read from SEC filings retrieved through the sec-api.io MCP server. Call statements are taken from the Q3 2026 and Q2 2026 earnings calls held by the company.
| Form | Period | Filed | Accession number |
|---|---|---|---|
| 10-Q | Q3 2026 | 21 Oct 2026 | 0001628280-26-066775 |
| 8-K Ex 99.1 (Q3 2026 Update) | Q3 2026 | 21 Oct 2026 | 0001628280-26-066738 |
| 10-Q | Q2 2026 | 22 Jul 2026 | 0001628280-26-049270 |
| 8-K Ex 99.1 (Q2 2026 Update) | Q2 2026 | 22 Jul 2026 | 0001628280-26-049213 |
| 10-Q | Q1 2026 | 22 Apr 2026 | 0001628280-26-026673 |
| 10-K | FY2025 | 28 Jan 2026 | 0001628280-26-003952 |
| 8-K Ex 99.1 (Q4 and FY2025 Update) | Q4 2025 | 28 Jan 2026 | 0001628280-26-003837 |
| 10-K | FY2024 | 29 Jan 2025 | 0001628280-25-003063 |
| 10-K | FY2023 | 26 Jan 2024 | 0001628280-24-002390 |
| 10-K | FY2022 | 30 Jan 2023 | 0000950170-23-001409 |
| 8-K (Items 5.02, 5.07) | 2025 annual meeting | 7 Nov 2025 | 0001104659-25-108507 |
| DEF 14A | 2026 annual meeting (Dec 3, 2026) | 19 Oct 2026 | 0001104659-26-116700 |
| 8-K (Items 1.01, 1.02, 2.03) | Credit facilities | 29 Sep 2026 | 0001628280-26-063820 |
| Filed | Exhibit | Document | Content |
|---|---|---|---|
| 7 Nov 2025 | EX-10.1 | Amended and Restated 2019 Equity Incentive Plan | Approved by shareholders on Nov 6, 2025 (1.94bn for, 514.6m against); Adds up to 207,960,630 shares in a reserve for Elon Musk Awards and up to 60,000,000 shares to the general share reserve |
| 7 Nov 2025 | EX-10.2 | 2025 CEO Performance Award Agreement (Sept 3, 2025) | 423,743,904 restricted shares to Elon Musk in 12 tranches of 35,311,992 shares (1% of adjusted share count each); Market cap milestones from $2tn in $500bn steps to $6.5tn, then $7.5tn and $8.5tn, measured on six month and 30 day trailing averages |
| 7 Nov 2025 | EX-10.3 | Voting Agreement between Tesla and Elon Musk (Sept 3, 2025) | Unearned award shares are voted in proportion to all other shares voted at each meeting; Musk grants the Corporate Secretary (Brandon Ehrhart) an irrevocable proxy over unearned shares until no unearned shares remain |
| 7 Nov 2025 | EX-99.1 | Proxy excerpt: summary of A&R 2019 Equity Incentive Plan | About 131,112 employees, three executive officers and eight outside directors were eligible as of Aug 19, 2025; Share reserve: 2,200,293 remaining shares plus up to 207,960,630 (Special Share Reserve) and up to 60,000,000 (General Share Reserve) |
| 7 Nov 2025 | EX-99.2 | Proxy excerpt: summary of 2025 CEO Performance Award | 423,743,904 shares, 12% of adjusted share count, preliminary fair value estimate $87.75bn; Each tranche needs one market cap milestone ($2tn to $8.5tn) plus one operational milestone |
| 2 Jan 2026 | EX-99.1 | Q4 2025 production, deliveries and deployments | Q4 2025 production 434,358 and deliveries 418,227 (Model 3/Y 406,585; other models 11,642); 3% of deliveries subject to operating lease accounting; Record 14.2 GWh of energy storage deployed in Q4 2025 |
| 28 Jan 2026 | EX-99.1 | Q4 and FY2025 Update deck | FY2025 revenue $94.8bn (down 3%), operating income $4.4bn (4.6% margin), GAAP net income $3.8bn, non GAAP net income $5.9bn, FCF $6.2bn; cash and investments up $7.5bn to $44.1bn; Q4 2025 revenue $24.9bn (down 3% YoY), operating income $1.4bn (5.7% margin), GAAP net income $0.8bn, FCF $1.4bn; energy gross profit a record $1.1bn |
| 2 Apr 2026 | EX-99.1 | Q1 2026 production, deliveries and deployments | Q1 2026 production 408,386 and deliveries 358,023 (Model 3/Y 341,893; other models 16,130); Production exceeded deliveries by about 50,000 vehicles |
| 22 Apr 2026 | EX-99.1 | Q1 2026 Update deck | Revenue $22.4bn (up 16% YoY), gross margin 21.1%, operating income $0.9bn (4.2% margin), GAAP net income $0.5bn, non GAAP net income $1.5bn; Operating cash flow $3.9bn, capex $2.5bn, FCF $1.4bn; cash and investments $44.7bn after $2.0bn paid for the SpaceX equity investment |
| 2 Jul 2026 | EX-99.1 | Q2 2026 production, deliveries and deployments | Q2 2026 production 451,758 and deliveries 480,126 (Model 3/Y 467,762; other models 12,364); Deliveries exceeded production by about 28,000 vehicles |
| 22 Jul 2026 | EX-99.1 | Q2 2026 Update deck | Revenue $28.2bn (up 26% YoY); TTM revenue above $100bn for the first time; operating income $0.4bn (1.4% margin); GAAP net income $1.1bn including a $1.0bn SpaceX unrealized gain; non GAAP net income $1.2bn; Capex $5.8bn (up $3.3bn sequentially) drove FCF of negative $1.1bn; cash and investments fell $1.2bn to $43.5bn |
| 29 Sep 2026 | 8-K Items 1.01, 1.02, 2.03 (no exhibits attached) | Entry into $30bn of senior unsecured credit facilities | $20.0bn three year delayed draw term loan (Citibank agent), drawable up to ten times within 18 months, maturing Sept 29, 2029; undrawn commitments step down to $10.0bn after one year and $5.0bn after 15 months; $8.0bn five year revolver (Wells Fargo agent) maturing Sept 29, 2031, in US dollars, GBP or EUR, with up to $500m of letters of credit and two optional one year extensions |
| 2 Oct 2026 | EX-99.1 | Q3 2026 production, deliveries and deployments | Q3 2026 production 464,391 and deliveries 486,532 (Model 3/Y 478,237; other models 8,295); 1% subject to operating lease accounting; 13.7 GWh of energy storage deployed |
| 21 Oct 2026 | EX-10.1 (10-Q) | Five Year Revolving Credit Agreement, $8.0bn (Sept 29, 2026) | Wells Fargo administrative agent, Citibank syndication agent; joint lead arrangers include Wells Fargo, Citi, Goldman Sachs, Morgan Stanley, BMO, Credit Agricole, JPMorgan and TD; Ratings based pricing: Term SOFR or SONIA spread 0.875% at A- or better up to 1.375% below BB+; commitment fee 0.070% to 0.175% |
| 21 Oct 2026 | EX-10.2 (10-Q) | 364 Day Revolving Credit Agreement, $2.0bn (Sept 29, 2026) | Same agent and arranger group as the five year revolver; Term SOFR spread 0.875% to 1.375% by rating level; commitment fee 0.040% to 0.150% |
| 21 Oct 2026 | EX-10.3 (10-Q) | Delayed Draw Term Loan Credit Agreement, $20.0bn (Sept 29, 2026) | Citibank administrative agent, Wells Fargo syndication agent, same eight joint lead arrangers; Term SOFR spread 1.000% at A- or better up to 1.500% below BB+; ticking fee 0.070% to 0.175% on undrawn amounts |
| 21 Oct 2026 | EX-99.1 | Q3 2026 Update deck | Revenue $28.0bn (flat YoY), gross profit $5.5bn, operating income $0.7bn, GAAP net income $0.8bn, non GAAP net income $1.7bn (EPS $0.48); Operating cash flow $6.3bn, capex $4.7bn, FCF $1.5bn; cash and investments $45.4bn; TTM Adjusted EBITDA $15.0bn |