Hut 8 Corp. (HUT), Financial Analysis
Insights derived from analysing SEC filings. Independent analysis, not a publication of the SEC.
- Revenue $71.1m in Q3 2026, (14.9%) year on year; costs excl. digital asset gains $166.7m, +90.6%. GAAP operating income was $318.2m after a $413.8m gain on digital assets; excluding digital asset gains (the report's measure: operating income less the gain) the operating loss was $95.6m against $3.9m. General and administrative expenses rose to $99.6m from $25.9m, incl. stock based compensation of $64.7m ($6.3m). Net income attributable to Hut 8 $131.1m, diluted EPS $0.98; Adjusted EBITDA $33.0m against $30.5m.
- AI data center leases: 949 MW of IT capacity under three 15 year triple net leases with $26.6bn of base term value and more than $1.75bn of expected average annual NOI (8-K Ex 99.1, 20 Jul 2026). River Bend (245 MW, Fluidstack, Google backstop) is due from Q2 2027, Beacon Point Phase 1 (352 MW) from Q3 2027 and Phase 2 (352 MW) from Q2 2028. Note offering materials show illustrative 2028 lease revenue of $373m at River Bend and $489m at Beacon Point Phase 1, against TTM revenue of $305.5m.
- Financing: $7.5bn of fully amortizing project notes due 2042 at 6.192% and 6.129%, non recourse to Hut 8; debt principal $7.73bn at 30 Sep 2026 against $410.2m at 31 Dec 2025. Q3 interest expense $105.5m against $8.6m, offset by $61.8m of interest income on unused proceeds; cash, restricted cash and restricted investments $6.55bn; the $1.07bn revolver is undrawn. Beacon Point Phase 2 financing is not yet arranged.
- Power pipeline 7,859 MW at 30 Sep 2026: 1,330 MW under construction, 3,180 MW under exclusivity (+1,300 MW in Q3; 1,255 MW a year earlier) and 3,300 MW under diligence, plus 710 MW under management after the Feb 2026 sale of 310 MW of Ontario gas plants. Two West Texas sites of up to 230 MW are being bought for up to $180.0m, closing scheduled for Dec 2026 (10-Q).
- Bitcoin and American Bitcoin: 16,787 Bitcoin held at 30 Sep 2026, fair value $1.40bn ($697.4m attributable to Hut 8, $702.9m to American Bitcoin, 46.37% owned by minority holders). About 891 Bitcoin were mined in Q3 at $71,087 each, against 578 at $114,121. Bitcoin sales funded $250.0m of buybacks (3.34m shares) in Q3 and Oct 2026; the authorization is now $1.0bn.
- Shares closed at $57.57 on 13 Nov 2026, 56.7% below the 52 week closing high of $133.02 (2 Jun 2026). Market value $6.9bn; EV/Sales 26.2x TTM. Scenario prices for TTM Q3 2029 on exit EV/Sales: base $80, best $162, worst $12. Insiders sold about $15.2m of stock in 12 months with no open market purchases; say on pay received 54.8% of votes cast.
Figures are read from the Q3 2026 earnings release (8-K Ex 99.1 of 4 Nov 2026), the Q3 2026 10-Q filed the same day, the Forms 10-Q for Q1 2025 to Q2 2026, the FY2025 and FY2024 Forms 10-K, the Forms 8-K with all their exhibits, incl. the earnings releases for Q3 2025 to Q3 2026, the River Bend and Beacon Point lease releases, the note offering materials, indentures and credit agreements, the 2026 proxy statement, the Item 5.07 vote results, Forms 4 for central index key 1964789, and the Forms 10-K, 10-Q and 8-K of TeraWulf, IREN, Core Scientific and Riot Platforms. Hut 8 files no separate CFO commentary document; CFO points come from the revolver release (8-K Ex 99.1, 28 Sep 2026). Share price $57.57 is the regular session close of 13 Nov 2026. Accession numbers appear in the Sources appendix.
1 Revenue & Business Model
- Storyline: Hut 8 is moving from Bitcoin mining and hosting to leasing AI data centers on power it originates. TTM revenue is $305.5m, mostly Bitcoin mining at American Bitcoin, while $26.6bn of 15 year leases start to bill from Q2 2027, funded by $7.5bn of project notes. Chapters 2 to 4 cover the three revenue drivers: AI data center leases, power and origination, and compute with American Bitcoin.
- Business model (10-Q): four reportable segments. Power covers managed services (280 MW at the King Mountain JV) and, until Feb 2026, gas generation in Ontario. Digital Infrastructure covers ASIC, CPU and AI infrastructure, incl. River Bend and Beacon Point. Compute covers ASIC Compute (mostly American Bitcoin), AI Cloud (Highrise AI, GPU capacity near Chicago) and Traditional Cloud, sold in Aug 2026. Fees from Hut 8 to American Bitcoin under the managed services and colocation agreements are eliminated in consolidation.
- Revenue FY2024 $162.4m, FY2025 $235.1m (+44.8%); Q3 2026 $71.1m: Compute $68.4m, Digital Infrastructure $1.4m, Power $1.3m. Power fell from $8.4m after the Far North JV sale; Digital Infrastructure fell from $5.1m after the Vega colocation contract ended in Aug 2025.
- King Mountain JV (50%, equity method): 280 MW site in McCamey, Texas; JV colocation revenue incl. reimbursements $26.9m in Q3 2026; Hut 8's $13.5m share sits in equity in earnings of the JV ($5.4m in total) (8-K Ex 99.1, 4 Nov 2026).
- Operating income includes Bitcoin fair value changes. Gains and losses on digital assets run through operating income: +$413.8m in Q3 2026, ($295.7m) in Q1 2026 and ($138.6m) in Q2 2026. Margins below are shown with and without them.

| Metric | Values by period |
|---|---|
| Energy Capacity Under Construction (MW) | Sep 2025: 0.0; Dec 2025: 330.0; Jun 2026: 1,330.0; Sep 2026: 1,330.0 |
| Energy Capacity Under Development (MW) | Sep 2025: 1,529.0; Dec 2025: 1,230.0; Jun 2026: 50.0; Sep 2026: 49.0 |
| Energy Capacity Under Exclusivity (MW) | Sep 2025: 1,255.0; Dec 2025: 1,255.0; Jun 2026: 1,880.0; Sep 2026: 3,180.0 |
| Energy Capacity Under Diligence (MW) | Sep 2025: 1,300.0; Dec 2025: 5,685.0; Jun 2026: 5,400.0; Sep 2026: 3,300.0 |
| Contracted AI data center IT capacity (MW) | Dec 2025: 245.0; Mar 2026: 597.0; Sep 2026: 949.0 |
| Base term contract value, AI leases ($bn) | Dec 2025: 7.0; Mar 2026: 16.8; Sep 2026: 26.6 |
| Bitcoin mined (consolidated, approx.) (BTC) | Q3 2025: 578.0; Q3 2026: 891.0; 9M 2025: 1,021.0; 9M 2026: 2,643.0 |
| Average revenue per Bitcoin mined ($) | Q3 2025: 114,121.0; Q3 2026: 71,087.0; 9M 2025: 106,399.0; 9M 2026: 72,918.0 |
| Line | Q1 2025 | Q2 2025 | Q3 2025 | Q4 2025 | Q1 2026 | Q2 2026 | Q3 2026 |
|---|---|---|---|---|---|---|---|
| Revenue ($m) | 21.8 | 41.3 | 83.5 | 88.5 | 71.0 | 74.9 | 71.1 |
| Power ($m) | 4.4 | 5.5 | 8.4 | 5.0 | 3.7 | 1.2 | 1.3 |
| Digital Infrastructure ($m) | 1.3 | 1.5 | 5.1 | 1.6 | 1.3 | 1.3 | 1.4 |
| Compute ($m) | 16.1 | 34.3 | 70.0 | 81.9 | 66.0 | 72.5 | 68.4 |
| Gain (loss) on digital assets ($m) | (112.4) | 217.6 | 76.6 | (401.9) | (295.7) | (138.6) | 413.8 |
| GAAP operating income (loss) ($m) | (147.7) | 187.9 | 72.7 | (434.9) | (370.4) | (206.3) | 318.2 |
| Operating loss excl. digital asset gains and losses, report's measure ($m) | (35.3) | (29.8) | (3.9) | (33.0) | (74.7) | (67.7) | (95.6) |
| Adjusted EBITDA, revised definition ($m) | (5.3) | 4.2 | 30.5 | n/a | (2.7) | 10.4 | 33.0 |
| Net income attributable to Hut 8 ($m) | (133.9) | 137.3 | 50.1 | (279.7) | (219.8) | (150.2) | 131.1 |
2 AI Data Center Leases: 949 MW Contracted, $26.6bn Base Term Value, First Hall Due Q2 2027
- Three leases, two tenants, 949 MW: River Bend in West Feliciana Parish, Louisiana, 245 MW IT on 330 MW of utility capacity, leased to Fluidstack with Google backstopping the payments; Beacon Point in Nueces County, Texas, two leases of 352 MW each with one tenant rated AA minus or higher, on 1,000 MW of utility capacity (8-K exhibits).
- Economics as filed: base term value $7.0bn at River Bend and $19.6bn at Beacon Point; expected average annual NOI $454m and $1.31bn. Illustrative revenue in the note materials: River Bend $171m in 2027, $373m in 2028 and $384m in 2029; Beacon Point Phase 1 $63m, $489m and $545m.
- Today: Digital Infrastructure revenue was $1.4m in Q3 2026 (CPU colocation in Canada); none of the AI leases bills yet. Property and equipment rose to $1.86bn from $643.2m at 31 Dec 2025.
- Build: River Bend cost guide $9m to $11m per MW with Vertiv and Jacobs as partners (Dec 2025 presentation); Beacon Point Phase 1 was redesigned to the NVIDIA DSX reference architecture, giving 57% more IT capacity on the same footprint (Jul 2026 release).
How the AI data center lease market is changing
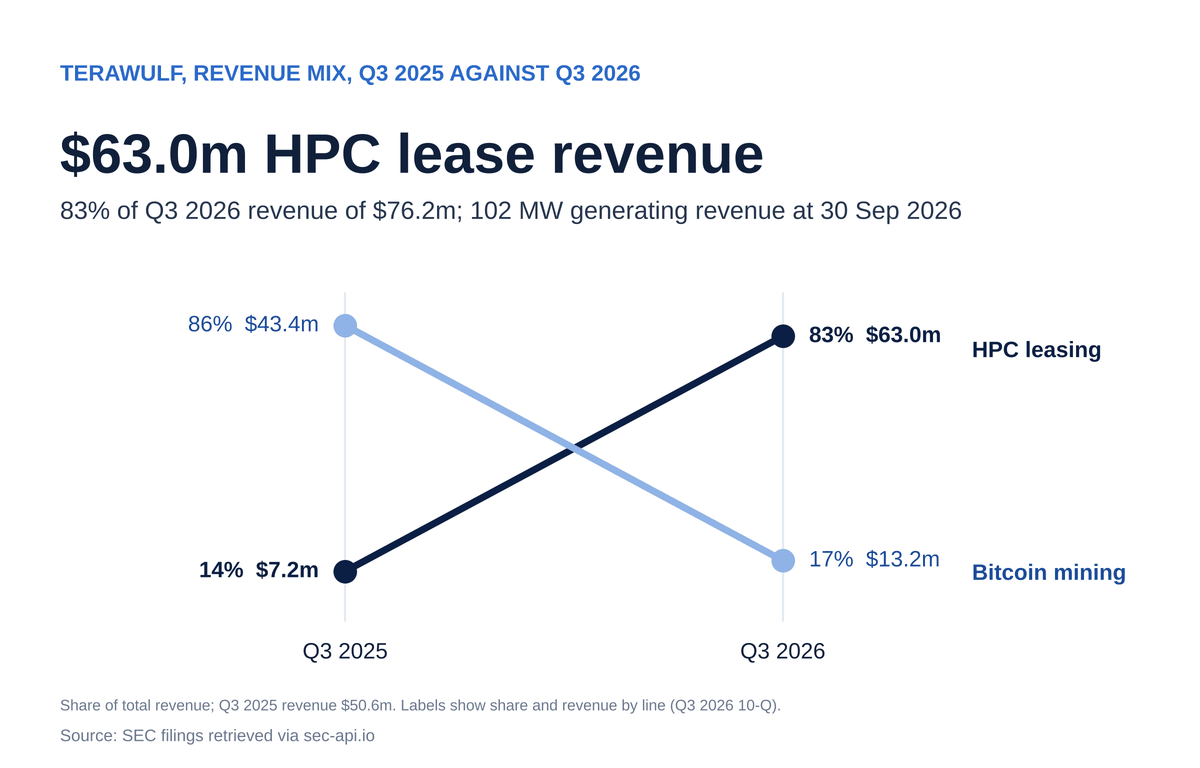
- TeraWulf signed a 20 year lease with Anthropic for about 401 MW, about $19bn over the initial term, with a Google credit backstop (8-K Ex 99.1, 6 Nov 2026).
- Core Scientific had 1,120 MW of leased customer power capacity at 30 Sep 2026, 485 MW billing; CoreWeave was 84% of its 9M 2026 revenue (10-Q).
- Riot signed a 191 MW lease at Rockdale (Aug 2026) and a 910 MW lease at Corsicana with a frontier AI lab (Nov 2026) (10-Q).
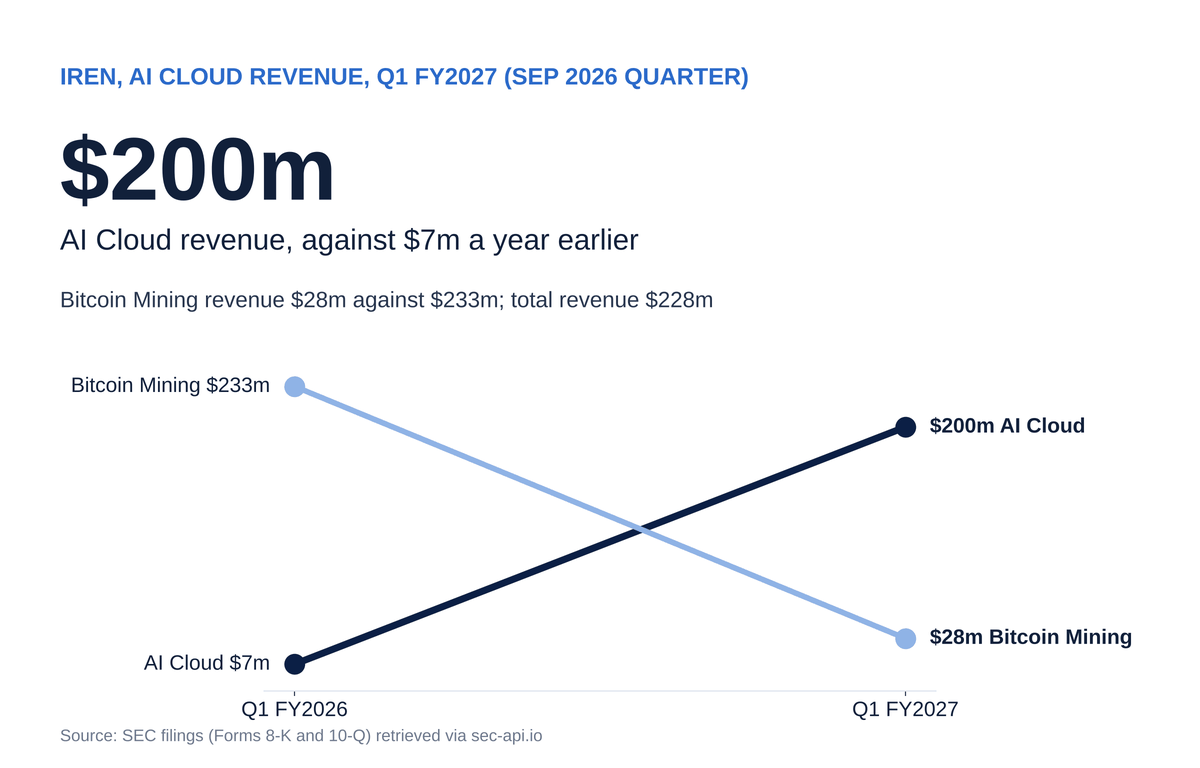
- IREN AI Cloud revenue was $200m in the Sep 2026 quarter, backlog $20.3bn (8-K, 5 Nov 2026).


| Company | Period | Measure | Detail |
|---|---|---|---|
| Hut 8 | Q3 2026 | 949 MW leased; $26.6bn base term | Digital Infrastructure revenue $1.4m; first lease billing from Q2 2027 |
| TeraWulf | Q3 2026 | HPC lease revenue: $63.0m | Anthropic lease about 401 MW, about $19bn over 20 years; 102 MW operating at Lake Mariner |
| Core Scientific | 30 Sep 2026 | Leased customer power capacity: 1,120 MW | 485 MW billing; colocation 84% of 9M 2026 revenue |
| Riot Platforms | Q3 2026 | Data Center revenue: $18.4m | leases of 50 MW (AMD), 191 MW (Rockdale) and 910 MW (Corsicana) |
| IREN | Sep 2026 quarter | AI Cloud revenue: $200.0m | backlog $20.3bn at 30 Sep 2026 |
| CoreWeave | Q3 2026 | Revenue: $3.66bn | revenue backlog $132.5bn at 30 Sep 2026; matches the CRWV post |
3 Power and Origination: 7,859 MW Pipeline, 3,180 MW Under Exclusivity, 710 MW Under Management
- Pipeline stages (10-Q definitions): diligence (greenfield sites assessed), exclusivity (site control and a power study), development (definitive land or power agreements), construction (definitive commercial agreements signed and works started).
- Change over 12 months: under construction 0 to 1,330 MW; under development 1,529 to 49 MW as sites advanced; under exclusivity 1,255 to 3,180 MW; under diligence 1,300 to 3,300 MW; under management 1,020 to 710 MW after the Ontario plant sale. Total pipeline 7,859 MW excl. the 1,000 MW River Bend ROFO.
- Power segment revenue $1.3m in Q3 2026 against $8.4m; Hut 8 manages 280 MW for the King Mountain JV and runs American Bitcoin sites under the managed services agreement, whose fees are eliminated in consolidation.
- Acquisitions: two energized West Texas sites from affiliates of Poolin Technology (Chapter 11 sale), up to 230 MW, for up to $180.0m; closing scheduled for Dec 2026.
How power supply for data centers is changing
- Core Scientific controlled about 2,550 MW of gross utility power and 1,675 MW of leasable capacity at 30 Sep 2026, against 1,426 MW and 920 MW at 31 Dec 2025 (10-Q).
- Riot: Rockdale about 700 MW developed, Corsicana about 400 MW built toward about 1 GW, Kentucky about 232 MW (10-Q).
- TeraWulf raised contracted power at Muskie to 1,000 MW from 500 MW, subject to Kentucky PSC approval (8-K Ex 99.1, 6 Nov 2026).
- IREN reports more than 5 GW of secured power (8-K, 5 Nov 2026).
- ERCOT large load standards cited by Riot: loads of 75 MW or more pay a $100,000 study fee and post $50,000 per MW of security (10-Q).


| Company | Period | Measure | Detail |
|---|---|---|---|
| Hut 8 | 30 Sep 2026 | 1,330 MW under construction; 3,180 MW under exclusivity | 7,859 MW pipeline plus 710 MW under management |
| Core Scientific | 30 Sep 2026 | Gross utility power capacity: 2,550 MW | 1,675 MW leasable |
| Riot Platforms | 30 Sep 2026 | Developed capacity, Rockdale + Corsicana + Kentucky: 1,332 MW | Corsicana planned to about 1 GW |
| TeraWulf | Oct 2026 | Contracted power, Muskie: 1,000 MW | subject to PSC approval; Lake Mariner 336 MW under construction |
| IREN | Nov 2026 | Secured power: 5,000 MW | stated as more than 5 GW |
4 Compute and American Bitcoin: $68.4m Q3 Revenue, 891 Bitcoin Mined, 16,787 Bitcoin Held
- Compute revenue $68.4m in Q3 2026 against $70.0m; 9M 2026 $206.9m against $120.4m as Bitcoin mined rose to about 2,643 from 1,021 while revenue per Bitcoin fell to about $72,918 from $106,399 (10-Q).
- American Bitcoin fleet: about 28.1 EH/s owned at about 16.0 J/TH after 11,298 miners were deployed at Drumheller in Apr 2026; miners bought from Bitmain with pledged Bitcoin, redeemable over about 24 months (10-Q).
- Bitcoin held: 16,787 at 30 Sep 2026 against 15,679 at 31 Dec 2025; 4,850 pledged for the FalconX loan and 3,090 pledged to Bitmain by American Bitcoin. Hut 8 sold about 954 Bitcoin in Q3 and 2,148 in Oct 2026 to fund buybacks.
- American Bitcoin capital: a $2.1bn ATM program; 12,121,321 Class A shares sold for $385.2m gross to 30 Sep 2026, none in Q3 2026; minority holders own 46.37% of the consolidated subsidiary.
How Bitcoin mining economics are changing
- Riot mined 1,637 Bitcoin in Q3 2026 against 1,406; production value per Bitcoin $70,855 against $114,361 (10-Q).
- Core Scientific self mining fell to 12% of 9M 2026 revenue from 78% as power moved to colocation (10-Q).
- IREN Bitcoin revenue was $28m in the Sep 2026 quarter against $233m; transition to be substantially complete by 31 Dec 2026 (10-Q).
- Bitcoin rose from about $59,847 to $83,415 in Q3 2026 and fell from about $87,498 to $83,415 over 9M 2026 (Hut 8 10-Q).


| Company | Period | Measure | Detail |
|---|---|---|---|
| Hut 8 | Q3 2026 | Compute revenue $68.4m | about 891 Bitcoin mined at $71,087; 16,787 Bitcoin held |
| Riot Platforms | Q3 2026 | Bitcoin Mining revenue: $116.0m | 1,637 BTC mined; $70,855 per BTC |
| IREN | Sep 2026 quarter | Bitcoin mining revenue: $28.0m | 402 BTC mined against 2,039 |
| Core Scientific | 9M 2026 | Self mining share of 9M revenue: 12% | 78% in 9M 2025 |
5 Financial Analysis & Ratios
- TTM revenue $305.5m; TTM GAAP operating loss $693.4m incl. $422.3m of net digital asset losses; excluding them the TTM operating loss was $271.0m against $102.0m in FY2025 and $48.8m in FY2024.
- Net loss attributable to Hut 8 TTM $518.7m; FY2024 net income $331.9m included $509.3m of digital asset gains. TTM interest expense $171.5m and interest income $88.9m.
- Free cash flow TTM ($1.22bn): operating cash flow ($62.4m) less purchases of property and equipment $1.16bn, mostly River Bend and Beacon Point. 9M 2026 operating cash flow was lifted by $138.8m of accrued, unpaid interest on the notes.
- Balance sheet at 30 Sep 2026: total assets $10.33bn; cash $156.9m, restricted cash $3.56bn and restricted short term investments $2.84bn; Bitcoin $1.40bn; property and equipment $1.86bn; debt $7.63bn; equity attributable to Hut 8 $1.56bn plus $369.8m of non controlling interests.
- Capital returns: no dividends; $74.7m of buybacks in Q3 and $175.3m in Oct 2026; 2025 ATM sales of 6,121,993 shares for $304.3m gross at $49.71 average, none in Q3 2026.
| Line item | FY2024 | FY2025 | TTM Q3 2026 |
|---|---|---|---|
| Revenue | 162.4 | 235.1 | 305.5 |
| Gross profit | 75.7 | 127.3 | 187.8 |
| Selling, general and administrative | 72.9 | 122.8 | 303.1 |
| Operating income | 460.5 | (322.0) | (693.4) |
| Net income | 331.9 | (226.1) | (518.7) |
| Diluted EPS ($) | 3.40 | (2.14) | n/a |
| Operating cash flow | (68.5) | (139.2) | (62.4) |
| Capital expenditure | (163.6) | (216.9) | (1,161.2) |
| Free cash flow | (232.1) | (356.2) | (1,223.6) |
| Stock based compensation | 20.8 | 57.8 | 206.9 |
| Cash and investments | 85.0 | 47.3 | 6,551.4 |
| Total debt | 300.6 | 410.2 | 7,631.5 |
| Total equity | 976.7 | 1,421.9 | 1,560.4 |

| Metric | Q3 2025 | Q3 2026 | Change |
|---|---|---|---|
| Revenue ($m) | 83.5 | 71.1 | (14.9%) |
| Gross profit ($m) | 51.2 | 40.8 | (20.2%) |
| Operating income ($m) | 72.7 | 318.2 | 338.0% |
| Net income ($m) | 50.1 | 131.1 | 161.6% |
| Diluted EPS ($) | 0.43 | 0.98 | 127.9% |
| Operating cash flow ($m) | 0.8 | 27.8 | n/a |
| Free cash flow ($m) | (38.4) | (448.2) | (1,066.3%) |
| Operating margin (%) | 87.0 | 447.7 | 360.7 pts |
| Net margin (%) | 60.0 | 184.4 | 124.4 pts |
| Ratio | FY2024 | FY2025 | TTM Q3 2026 |
|---|---|---|---|
| Growth and margins | |||
| Revenue growth (%) | n/a | 44.8 | n/a |
| Gross margin (%) | 46.6 | 54.2 | 61.5 |
| Operating margin (%) | 283.6 | (136.9) | (226.9) |
| Net margin (%) | 204.4 | (96.2) | (169.8) |
| FCF margin (%) | (143.0) | (151.5) | (400.5) |
| Cost and investment intensity | |||
| SBC (%) revenue | 12.8 | 24.6 | 67.7 |
| Capex (%) revenue | 100.7 | 92.3 | 380.1 |
| Returns | |||
| ROE (%) | 34.0 | (18.9) | (33.2) |
| ROA (%) | 21.9 | (10.6) | (5.0) |
| Asset turnover (x) | 0.11 | 0.09 | 0.03 |
| Liquidity and leverage | |||
| Current ratio (x) | 1.67 | 1.09 | 9.48 |
| Debt to equity (x) | 0.31 | 0.29 | 4.89 |
| Net cash ($bn) | (0.2) | (0.4) | (1.1) |
| Efficiency and cash quality | |||
| Days sales outstanding | 16 | 48 | 7 |


| Measure | Value |
|---|---|
| Market cap ($bn) | 6.9 |
| Enterprise value ($bn) | 8.0 |
| EV/Sales (TTM) (x) | 26.2 |
| FCF yield (%) | (17.7) |
| Price/Book (x) | 4.4 |
Cost structure and profitability
- Costs excl. digital asset gains $166.7m in Q3 2026, +90.6%, against revenue (14.9%); operating margin excl. digital asset gains, the report's measure, (134.5%) against (4.7%).
- Stock based compensation $64.7m in Q3 2026 against $6.3m; $206.9m TTM, 68% of revenue. The 10-Q attributes the rise mainly to one time awards granted in 2025 under the long term incentive plan.
- Cost of revenue 42.5% of revenue against 38.7% in Q3 2025, as electricity cost rose with Vega and Drumheller capacity. Depreciation $40.1m against $27.8m.


| Line | Q3 2025 | Q4 2025 | Q1 2026 | Q2 2026 | Q3 2026 |
|---|---|---|---|---|---|
| Cost of revenue ($m) | 32.3 | 35.0 | 25.5 | 26.9 | 30.2 |
| Depreciation and amortization ($m) | 27.8 | 39.7 | 38.4 | 39.7 | 40.1 |
| General and administrative ($m) | 25.9 | 45.7 | 81.7 | 76.1 | 99.6 |
| Stock based compensation (incl. above) ($m) | 6.3 | 40.1 | 50.9 | 51.2 | 64.7 |
| Interest expense ($m) | 8.6 | 5.6 | 9.2 | 51.2 | 105.5 |
| Costs excl. digital asset gains (% of revenue) | 104.7 | 137.3 | 205.2 | 190.4 | 234.5 |
Debt, project notes and liquidity
- Debt principal $7.73bn at 30 Sep 2026: Beacon Point notes $4.25bn, River Bend notes $3.25bn, FalconX $200.0m and the TZRC note $26.4m (repaid 5 Oct 2026). Carrying value $7.63bn incl. other financial liabilities. Accrued interest payable was $164.0m; first note coupons fall on 15 and 30 Nov 2026.
- Interest: expense by quarter from Q1 2025 $7.5m, $8.4m, $8.6m, $5.6m, $9.2m, $51.2m, $105.5m; interest income of $27.1m in Q2 and $61.8m in Q3 2026 on unused note proceeds; $22.2m of interest was capitalized into property and equipment in 9M 2026 (10-Q).
- Liquidity (release): about $6.6bn of unrestricted cash, restricted cash and restricted short term investments plus Bitcoin of $697.4m attributable to Hut 8 at 30 Sep 2026. The $1.07bn revolver is undrawn; the $200m Two Prime facility was terminated; the parent carries no recourse notes after the Coatue conversion.
- Miner purchase liability $371.7m at American Bitcoin, linked to Bitcoin pledged to Bitmain with redemption periods of about 24 months (10-Q).

| Facility | Size | Rate | Maturity | Security | Principal 30 Sep 2026 |
|---|---|---|---|---|---|
| Beacon Point notes (Beacon Point DC LLC) | $4.25bn | 6.129% fixed | 30 Nov 2042; amortizing from 30 May 2030 | non recourse; secured on project assets | $4.25bn |
| River Bend notes (Hut 8 DC LLC) | $3.25bn | 6.192% fixed | 15 Nov 2042; amortizing from 15 May 2028 | non recourse; secured on project assets | $3.25bn |
| FalconX term loan | $200.0m | 7.00% fixed | Apr 2027; company intends early repayment | Bitcoin collateral, 143% initial ratio | $200.0m |
| TZRC secured promissory note | n/a | paid in kind interest | repaid in full 5 Oct 2026 ($26.5m) | King Mountain JV distributions | $26.4m |
| Revolving credit facility | $1.07bn | SOFR + 1.50% to 2.00% | Sep 2030 | senior secured; parent level | undrawn |
| Two Prime credit facility | $200.0m | n/a | terminated Sep 2026 | undrawn | n/a |
6 MD&A & Management Commentary
Q3 2026 results: 8-K Ex 99.1 and 10-Q of 4 Nov 2026
- Revenue $71.1m against $83.5m (10-Q): Compute $68.4m (ASIC Compute down $2.6m as revenue per Bitcoin fell to about $71,087 from $114,121 while Bitcoin mined rose to about 891 from 578; AI Cloud +$1.7m; Traditional Cloud down $0.7m after its sale). Power down $7.1m after the Far North JV sale; Digital Infrastructure down $3.7m.
- Costs: cost of revenue $30.2m; depreciation and amortization $40.1m (+$12.4m, mostly American Bitcoin miners); general and administrative $99.6m, up $73.7m: stock based compensation +$58.4m, professional fees +$7.7m, salaries +$6.2m, other +$3.9m.
- Below operating income: interest expense $105.5m, interest income $61.8m, loss on derivatives and other financial liabilities $62.8m (Bitcoin redemption rights on American Bitcoin miner purchases), gain of $23.7m on the Ionic Digital stake after its Jul 2026 Nasdaq listing, tax provision $51.7m. Consolidated net income $189.5m, of which $58.4m to minority holders.
- Adjusted EBITDA $33.0m against $30.5m on the definition revised from Q2 2026, which excludes digital asset mark to market attributable to Hut 8; Adjusted EBITDA including it was $350.3m against $109.0m (8-K Ex 99.1).
- Cash (10-Q): 9M 2026 operating cash flow ($5.0m); purchases of property and equipment $1.09bn; purchases of restricted short term investments $2.83bn; financing inflow $7.54bn incl. $7.7bn of notes and the FalconX loan, less $227.6m of repayments (incl. the $200m Coinbase facility) and $99.1m of debt issuance costs.
- Construction progress (release): River Bend structural steel and foundations done across all four data halls and the substation initially energized; Beacon Point Phase 1 substation, foundation and underground work started; Phase 2 in civil design.
| Item | Outlook | Source |
|---|---|---|
| River Bend initial data hall delivery | Q2 2027; additional data halls over the balance of 2027 | 8-K Ex 99.1, 4 Nov 2026; 8-K Ex 99.1, 17 Dec 2025 |
| Beacon Point Phase 1 initial data hall delivery | Q3 2027; initial energization Q1 2027 | 8-K Ex 99.1, 4 Nov 2026 and 20 Jul 2026 |
| Beacon Point Phase 2 initial data hall delivery | Q2 2028 | 8-K Ex 99.1, 20 Jul 2026 |
| Expected average annual NOI, AI lease portfolio | more than $1.75bn across 949 MW; River Bend $454m, Beacon Point $1.31bn | 8-K Ex 99.1, 20 Jul 2026 |
| Funding of River Bend and Beacon Point | expected entirely at project level, without equity issuance or recourse debt at the parent | 8-K Ex 99.1, 4 Nov 2026 (CEO) |
| Poolin sites acquisition (up to 230 MW) | closing scheduled for Dec 2026; $100m at closing plus up to $80m contingent | Q3 2026 10-Q |
| Stock repurchase authorization | raised to $1.0bn on 2 Nov 2026; $250.0m used | 8-K Ex 99.1, 4 Nov 2026 |
| FalconX term loan ($200m, 7.00%) | company intends to repay before Apr 2027 maturity | Q3 2026 10-Q |
| Revenue or earnings guidance | none filed | 8-K Ex 99.1 releases Q3 2025 to Q3 2026 |
Management and CFO commentary
- Hut 8 files no CFO commentary document; the points below come from releases filed as 8-K exhibits.
- CFO Sean Glennan, revolver release (28 Sep 2026): the facility adds more than $1bn of committed bank liquidity at the parent to fund projects through development while long term non recourse financing is timed and structured; stated aim an investment grade corporate profile.
- CEO Asher Genoot, Q3 2026 release (4 Nov 2026): more than a gigawatt of capacity added under exclusivity with less concentration in one region; River Bend and Beacon Point expected to be funded entirely at project level, without equity issuance or recourse debt at the parent.
- CEO, Q2 2026 release (4 Aug 2026): 949 MW contracted with about $26.6bn of base term value; $7.5bn of investment grade construction financing closed in one quarter; delivery of the two campuses is the central priority.
- CEO, Beacon Point Phase 2 release (20 Jul 2026): the tenant doubled its contracted capacity at the campus to 704 MW within months of the first lease.
| Speaker | Date and source | Statement |
|---|---|---|
| Asher Genoot, CEO | 4 Nov 2026, 8-K Ex 99.1 | “remains on track to meet our delivery targets” |
| Asher Genoot, CEO | 20 Jul 2026, 8-K Ex 99.1 | “Our tenant at Beacon Point chose to double its footprint at the site” |
| Sean Glennan, CFO | 28 Sep 2026, 8-K Ex 99.1 | “giving us control over when, where, and how we deploy capital” |
| Item | Disclosure |
|---|---|
| 10-K FY2025, segments | Four reportable segments: Power, Digital Infrastructure, Compute and Other; FY2025 revenue Power $23.2m, Digital Infrastructure $9.6m, Compute $202.3m. |
| 10-K FY2025, American Bitcoin | American Bitcoin launched 31 Mar 2025 and listed after the Gryphon merger closed in Sep 2025; consolidated; managed services and colocation fees to it are eliminated in consolidation. |
| 10-K FY2025, River Bend | 15 year, 245 MW IT lease with Fluidstack, Google backstop of lease payments; Fluidstack ROFO for up to 1,000 MW more; lease gives the customer termination rights in specified cases. |
| 10-K FY2025, platform | 19 sites across Canada and the US at 31 Dec 2025; 310 MW Ontario gas plants sold to TransAlta in Feb 2026. |
| 10-K FY2025, risk factors | 59 factors against 66 in the FY2024 10-K; new factors on geographic concentration in Texas and Louisiana, technology change, WLFI tokens and reclassification of Bitcoin as a security. |
| 10-Q Q3 2026, KPIs | Energy Capacity Under Construction 1,330 MW (River Bend 330, Beacon Point 1,000); Under Exclusivity 3,180 MW against 1,255 MW; Under Diligence 3,300 MW; Under Management 710 MW against 1,020 MW. |
| 10-Q Q3 2026, results | Revenue $71.1m against $83.5m; G&A $99.6m against $25.9m, incl. $58.4m higher stock based compensation; gain on digital assets $413.8m as Bitcoin rose from about $59,847 to $83,415 in the quarter. |
| 10-Q Q3 2026, interest | Interest expense $105.5m against $8.6m on the River Bend and Beacon Point notes; interest income $61.8m on unused note proceeds held in restricted investments. |
| 10-Q Q3 2026, liquidity | Cash $156.9m, restricted cash $3.56bn and restricted short term investments $2.84bn; debt principal $7.73bn; $1.07bn revolver undrawn, first liquidity covenant test for Q1 2027. |
| 10-Q Q3 2026, cash flow | 9M 2026 operating cash flow ($5.0m); purchases of property and equipment $1.09bn; purchases of restricted investments $2.83bn; financing inflow $7.54bn incl. $7.7bn of notes and term loan. |
| 10-Q Q3 2026, buybacks | 953,802 shares bought at $78.32 average for $74.7m in Q3 and 2,384,677 shares at $73.49 for $175.3m in Oct 2026, funded by selling about 954 and 2,148 Bitcoin. |
| 10-Q Q3 2026, legal | US securities class action settlement preliminarily approved 8 Jul 2026, final hearing 6 Nov 2026; three Florida derivative suits closed after settlement notice; Ontario class action filed 1 Dec 2025. |
| 10-Q Q3 2026, Poolin | Two West Texas sites, up to 230 MW, for up to $180.0m ($100.0m at closing, $80.0m contingent on a qualifying AI or HPC lease); court approval 2 Oct 2026; closing scheduled Dec 2026. |
| 10-Q Q3 2026, risk factors | No material changes from the FY2025 10-K (Part II Item 1A); same statement in the Q1 and Q2 2026 Forms 10-Q. |
7 Peer Valuation & Sector Summary
- Sector: power and data center owners moving from Bitcoin mining to AI leases. TeraWulf, IREN, Core Scientific and Riot all report AI or HPC leases or cloud revenue alongside mining in their Sep 2026 filings; CoreWeave and Nebius are GPU cloud operators and lease customers of such sites.
- Growth, Q3 2026 year on year: CORZ 187.1%, WULF 50.7%, RIOT 0.7%, IREN (5.0%), HUT (14.9%); CRWV 168.3%.
- TTM revenue: IREN $0.7bn, RIOT $0.7bn, CORZ $0.6bn, HUT $0.31bn, WULF $0.19bn. All five report TTM operating losses; CORZ equity is negative.
- Valuation, EV/Sales TTM: WULF 52.2x, HUT 26.2x, IREN 17.0x, CORZ 13.8x, RIOT 9.7x; CRWV 7.1x. Net debt: IREN $4.1bn, WULF $3.6bn, CORZ $3.5bn, HUT $1.1bn.
| Company | Revenue TTM ($bn) | Revenue growth (%) | Gross margin (%) | Operating margin (%) | Net margin (%) | FCF margin (%) | ROE (%) | Net cash ($bn) | Market value ($bn) | EV/Sales (x) |
|---|---|---|---|---|---|---|---|---|---|---|
| HUT | 0.3 | (14.9) | 61.5 | (226.9) | (169.8) | (400.5) | (33.2) | (1.1) | 7 | 26.2 |
| WULF | 0.2 | 50.7 | 69.2 | (250.0) | (410.9) | (1,631.1) | (90.1) | (3.6) | 6 | 52.2 |
| IREN | 0.7 | (5.0) | 73.4 | (166.4) | (194.4) | (919.8) | (26.4) | (4.1) | 8 | 17.0 |
| CORZ | 0.6 | 187.1 | 41.2 | (73.3) | (18.3) | (223.0) | n/a | (3.5) | 5 | 13.8 |
| RIOT | 0.7 | 0.7 | n/a | (210.5) | (210.8) | (133.3) | (66.7) | 0.0 | 7 | 9.7 |
| CRWV | 9.9 | 168.3 | 66.7 | (0.8) | (25.6) | (206.6) | (62.8) | (42.7) | 27 | 7.1 |
| NBIS | 2.2 | 571.3 | 76.0 | (23.0) | 5.7 | (567.2) | n/a | (6.8) | 40 | 21.5 |

8 Material Events & Contracts
- 18 Forms 8-K from 4 Nov 2025 to 4 Nov 2026: five earnings releases, four lease and investor presentation filings, six financing filings (Coinbase amendment, two note pricings, two indentures, the revolver), the ATM amendment, a Regulation FD filing and the annual meeting results.
- Lease terms (8-K exhibits): all three AI leases are 15 year triple net leases with a 3.0% annual base rent escalator and three 5 year renewal options; renewals lift River Bend to $17.7bn and Beacon Point to $50.2bn of potential contract value. Fluidstack holds a ROFO for up to 1,000 MW more at River Bend.
- Partnership (FY2025 release): with Anthropic and Fluidstack, Hut 8 is to develop at least 245 MW and up to 2,295 MW of AI data center capacity.
- Project notes: River Bend notes are sculpted to a 1.31x DSCR with amortization from Q2 2028; Beacon Point notes to 1.34x from Q2 2030; illustrative levered free cash flow over the terms $1.67bn and $2.86bn (8-K Ex 99.1 of 27 Apr and 4 Jun 2026).
| Date | Items | Event |
|---|---|---|
| 4 Nov 2025 | 2.02, 9.01 | Q3 2025 results (Ex 99.1): revenue $83.5m, net income $50.6m incl. $76.6m digital asset gains |
| 17 Nov 2025 | 7.01, 9.01 | Regulation FD furnishing with Ex 99.1 |
| 17 Dec 2025 | 8.01, 9.01 | River Bend: 15 year, 245 MW IT lease with Fluidstack, $7.0bn base term value ($17.7bn with renewals), Google backstop; investor presentation (Ex 99.2) |
| 31 Dec 2025 | 1.01, 2.03, 9.01 | Coinbase credit agreement amended and restated: up to $200m, additional $70m drawn on 22 Dec 2025, secured by Bitcoin |
| 25 Feb 2026 | 2.02, 9.01 | Q4 and FY2025 results (Ex 99.1): FY2025 revenue $235.1m, net loss $248.0m; Q4 net loss $301.8m incl. $401.9m digital asset losses |
| 25 Feb 2026 | 8.01, 9.01 | Amendment No. 1 to the at the market sales agreement adding Virtu as sales agent (Ex 1.1) |
| 27 Apr 2026 | 7.01, 9.01 | River Bend investor presentation (Ex 99.1): illustrative revenue $171m in 2027, $373m in 2028, $384m in 2029; DSCR 1.31x |
| 28 Apr 2026 | 8.01, 9.01 | Pricing of $3.25bn 6.192% senior secured notes due 2042 for River Bend, non recourse to Hut 8 (Ex 99.1) |
| 30 Apr 2026 | 1.01, 2.03, 9.01 | River Bend notes indenture (Ex 4.1), closed 30 Apr 2026 |
| 6 May 2026 | 2.02, 9.01 | Q1 2026 results (Ex 99.1): revenue $71.0m, net loss $253.1m incl. $295.7m digital asset losses; Beacon Point Phase 1 lease 352 MW, $9.8bn |
| 4 Jun 2026 | 7.01, 9.01 | Beacon Point illustrative financial information (Ex 99.1): revenue $63m in 2027, $489m in 2028, $545m in 2029; DSCR 1.34x |
| 5 Jun 2026 | 8.01, 9.01 | Pricing of $4.25bn 6.129% senior secured notes due 2042 for Beacon Point Phase 1, non recourse (Ex 99.1) |
| 9 Jun 2026 | 1.01, 2.03, 9.01 | Beacon Point notes indenture (Ex 4.1), closed 9 Jun 2026 |
| 12 Jun 2026 | 5.07 | Annual meeting of 11 Jun 2026: eight directors elected, say on pay approved with 54.8% of votes cast, KPMG ratified, plan amendment approved |
| 20 Jul 2026 | 8.01, 9.01 | Beacon Point Phase 2: second 15 year, 352 MW lease, $9.8bn base term; portfolio 949 MW and $26.6bn |
| 4 Aug 2026 | 2.02, 9.01 | Q2 2026 results (Ex 99.1): revenue $74.9m, net loss $177.1m incl. $138.6m digital asset losses; $7.5bn project notes closed |
| 28 Sep 2026 | 1.01, 2.03, 7.01, 9.01 | $1.07bn four year senior secured revolving credit facility (Ex 10.1), SOFR + 1.75% at closing, undrawn; release (Ex 99.1) |
| 4 Nov 2026 | 2.02, 9.01 | Q3 2026 results (Ex 99.1): revenue $71.1m, net income $189.5m incl. $413.8m digital asset gains; buyback authorization $1.0bn |
| Contract | Terms |
|---|---|
| River Bend lease (Fluidstack) | 15 years, 245 MW IT on 330 MW utility capacity, $7.0bn base term, expected NOI $454m a year; Google backstops lease payments and pass through obligations; first hall Q2 2027. |
| Beacon Point Phase 1 and 2 leases | Two 15 year leases of 352 MW each with a tenant rated AA minus or higher, $9.8bn each; campus NOI $1.31bn a year; 1,000 MW utility capacity under an AEP Texas interconnection agreement. |
| River Bend notes | $3.25bn 6.192% senior secured notes due 15 Nov 2042, Hut 8 DC LLC; fully amortizing from 15 May 2028; non recourse. |
| Beacon Point notes | $4.25bn 6.129% senior secured notes due 30 Nov 2042, Beacon Point DC LLC; rated Baa2; amortizing from 30 May 2030; non recourse. |
| Revolving credit facility | $1.07bn, four years to Sep 2030, 12 lenders, SOFR + 1.50% to 2.00% by debt to market capitalization ratio; full letter of credit sublimit; undrawn; $3.9m letter of credit issued in Oct 2026. |
| FalconX term loan | $200.0m, 7.00%, maturing Apr 2027, Bitcoin collateral (4,850 Bitcoin pledged at 30 Sep 2026); replaced the 9.00% Coinbase facility. |
| Poolin asset purchase | Two West Texas sites, up to 230 MW, up to $180.0m ($100.0m at closing, $80.0m contingent on a qualifying AI or HPC lease); court approved 2 Oct 2026. |
| American Bitcoin agreements | Managed services fee of $1.250 per kW month and colocation fees targeting a 25% yield on facility cost; eliminated in consolidation. |
9 Ownership, Voting Power & Annual Meeting
- One class of common stock with one vote per share. Directors and executive officers held 10.4% at 13 Apr 2026: CSO Michael Ho 5.6% and CEO Asher Genoot 3.5%. Holders above 5%: Coatue 7.5%, BlackRock 6.0%, Lone Pine 5.5%, G1 Execution Services 5.0% (2026 proxy).
- Share count: 120.04m shares at 2 Nov 2026 after the Oct buyback, against 110.09m at 31 Dec 2025; the Coatue note converted into 9,715,476 shares in May 2026. Diluted weighted shares were 134.0m in Q3 2026.
- Annual meeting of 11 Jun 2026 (Item 5.07): 83.3m shares represented; all eight directors elected, with For shares of votes cast from 89.6% (Mayo A. Shattuck III) to 99.6%; say on pay approved with 54.8%; the 2023 Omnibus Incentive Plan amendment with 84.8%; KPMG ratified.
- Insiders, Forms 4 of 15 Nov 2025 to 15 Nov 2026: no open market purchases; sales of about $15.2m by directors Flinn, Rickertsen, Wilkinson and Shattuck, CLO Victor Semah and CFO Sean Glennan, part under Rule 10b5‑1 plans. Michael Ho received 1,517,367 shares on 11 Nov 2026 as PSUs granted on 2 Nov 2025 vested at 300% of target on market capitalization levels, and entered a prepaid variable forward on up to 1.5m shares for $58.3m (floor $40.00, cap $221.00, settlement May 2027).
| Proposal | For (m votes) | Against (m votes) | Abstain (m votes) | For as % of votes cast | Result |
|---|---|---|---|---|---|
| Director: Asher Genoot | 70.5 | 0.3 | 0.0 | 99.6 | Elected |
| Director: Michael Ho | 70.5 | 0.3 | 0.0 | 99.6 | Elected |
| Director: Joseph Flinn | 69.5 | 1.3 | 0.1 | 98.2 | Elected |
| Director: Carl J. (Rick) Rickertsen | 70.4 | 0.4 | 0.1 | 99.4 | Elected |
| Director: William Tai | 69.0 | 1.6 | 0.2 | 97.7 | Elected |
| Director: E. Stanley O'Neal | 65.9 | 4.9 | 0.1 | 93.1 | Elected |
| Director: Mayo A. Shattuck III | 63.4 | 7.4 | 0.1 | 89.6 | Elected |
| Director: Amy Wilkinson | 62.4 | 5.5 | 2.9 | 91.9 | Elected |
| Say on pay (advisory) | 38.7 | 32.0 | 0.2 | 54.8 | Approved |
| Ratify KPMG LLP | 81.8 | 1.5 | 0.1 | 98.2 | Approved |
| Amendment to 2023 Omnibus Incentive Plan | 59.9 | 10.7 | 0.2 | 84.8 | Approved |
Annual meeting remarks
- No management remarks, presentation or shareholder questions from the meeting of 11 Jun 2026 were filed; the Item 5.07 filing reports vote counts only.
| Holder | Shares (m) | Share of class (%) |
|---|---|---|
| Coatue Management | 9.15 | 7.5 |
| BlackRock | 6.74 | 6.0 |
| Michael Ho (CSO, director) | 6.33 | 5.6 |
| Lone Pine Capital | 6.19 | 5.5 |
| G1 Execution Services | 5.64 | 5.0 |
| Asher Genoot (CEO, director) | 4.01 | 3.5 |
| Directors and executive officers as a group | 11.90 | 10.4 |
| Insider | Date | Value ($m) | Type |
|---|---|---|---|
| Mayo A. Shattuck III, director | 24 Sep 2026 | 2.00 | Rule 10b5‑1 plan |
| Sean Glennan, CFO | 24 Aug 2026 | 0.51 | tax withholding, 10b5‑1 plan |
| Victor Semah, CLO | 17 Jun 2026 | 1.25 | open market |
| Joseph Flinn, director | 11 Jun 2026 and 12 | 4.45 | incl. option exercise sale of 23,000 shares |
| Amy Wilkinson, director | 21 May 2026 | 2.02 | open market |
| Rick Rickertsen, director | 11 May 2026 and 13 | 3.66 | open market |
| Victor Semah, CLO | 4 May 2026 | 0.81 | tax withholding, 10b5‑1 plan |
| Sean Glennan, CFO | 10 Mar 2026 | 0.23 | tax withholding, 10b5‑1 plan |
| Victor Semah, CLO | 10 Mar 2026 | 0.27 | tax withholding, 10b5‑1 plan |
10 Risk Factors
- Item 1A of the FY2025 10-K holds 59 risk factors against 66 in the FY2024 10-K (22,859 words against 22,707). 4 were added, 11 removed and 18 materially reworded. The Forms 10-Q for Q1 to Q3 2026 report no material changes.
| Risk | Disclosure and change |
|---|---|
| Construction and delivery | Three campuses due from Q2 2027 to Q2 2028; the FY2025 10-K adds penalties or liquidated damages payable to customers on delays; River Bend build cost $9m to $11m per MW (Dec 2025 presentation). |
| Customer concentration | 949 MW leased to two tenants: Fluidstack (Google backstop) and one tenant rated AA minus or higher; the River Bend lease gives the customer termination rights in specified cases (10-K). |
| Leverage and funding | Debt principal $7.73bn at 30 Sep 2026; Q3 interest expense $105.5m; Beacon Point Phase 2 financing not yet arranged; revolver liquidity covenant tested from Q1 2027. |
| Bitcoin price | 16,787 Bitcoin at $1.40bn; Q3 2026 digital asset gain $413.8m, Q1 2026 loss $295.7m; Bitcoin redemption rights on miner purchases caused a $64.3m derivative loss in Q3 2026 (10-Q). |
| American Bitcoin control | Minority holders own 46.37%; the 10-K adds limited control over American Bitcoin and exposure to its Class A share price. |
| Power and geography | New factor on concentration in Texas and Louisiana; ERCOT and MISO interconnection; 1,330 MW under construction in two states. |
| Litigation | US securities class action settlement preliminarily approved 8 Jul 2026 (final hearing 6 Nov 2026); Ontario class action filed 1 Dec 2025; five derivative actions pending (10-Q). |
How risk factors changed
- Comparison: 10-K FY2025 filed 25 Feb 2026 acc 0001104659-26-019392 against 10-K FY2024 filed 3 Mar 2025 acc 0001558370-25-001996.
- The FY2025 10-K holds 59 risk factors against 66 a year earlier, with word count about flat (22,859 against 22,707).
- The River Bend lease is cited in three factors: construction, liquidity and customers.
- American Bitcoin is named in the headings of 16 factors in the FY2025 10-K.
- The four added factors cover geographic concentration, technology change, WLFI tokens and Bitcoin as a security; eleven factors were removed, incl. material weaknesses in internal control.

| Measure | 10-K FY2024 | 10-K FY2025 |
|---|---|---|
| Risk factors (count) | 66 | 59 |
| Words in Item 1A | 22,707 | 22,859 |
| Change | Risk factor | What changed |
|---|---|---|
| Added | Geographic concentration in Texas and Louisiana | New factor: a large part of data center capacity, capital and development is concentrated in Texas and Louisiana. |
| Added | Pace of technological change, incl. AI and quantum computing | New factor replacing the FY2024 factor on price fluctuations and technology change; names AI, quantum computing, data analytics and storage. |
| Added | Holding World Liberty Financial tokens | New factor on 100 million WLFI tokens, subject to an indefinite lock up of at least twelve months. |
| Added | Bitcoin reclassified as a security | New factor: an SEC determination could make Hut 8 or American Bitcoin an investment company under the 1940 Act. |
| Removed | Pricing customer contracts correctly | Removed. |
| Removed | Price fluctuations and rapidly changing technology | Replaced by the new technology change factor. |
| Removed | Flaws in or misuse of AI | Removed. |
| Removed | Automated curtailment processes | Removed. |
| Removed | Currency risk from US and Canada operations | Removed; the operations factor on the US and Canada remains. |
| Removed | Banks cutting off services to digital asset businesses | Removed. |
| Removed | Stakeholder scrutiny of sustainability practices | Removed. |
| Removed | Physical risks of climate change | Removed. |
| Removed | Being deemed an investment company | Removed as a stand alone factor; covered by the new Bitcoin as a security factor. |
| Removed | Material weaknesses in internal control | Removed. |
| Removed | Large accelerated filer, scaled disclosure ends | Removed. |
| Reworded | Construction of new data centers | Adds the 15 year, 245 MW River Bend build to suit lease and penalties or liquidated damages payable to customers on construction delays. |
| Reworded | Liquidity constraints and need for capital | Body grows to 504 words from 315; adds River Bend capital needs and market perception of data center operators, hyperscalers and neoclouds. |
| Reworded | King Mountain JV and American Bitcoin | Body grows to 600 words from 371; adds limited control over American Bitcoin and exposure to the volatility of its Class A share price. |
| Reworded | Predicting facility requirements | Body grows to 245 words from 156. |
| Reworded | Electrical power needs | Body grows to 1,042 words from 732; adds generation capacity, transmission, commodity price and supply disruption factors. |
| Reworded | Customers across the platform | Adds the River Bend lease value ($7.0bn base, $17.7bn with renewals) and customer termination rights under that lease. |
| Reworded | Permits and approvals | Body grows to 193 words from 127. |
| Reworded | Growth stage company with evolving model | Heading reworded from the FY2024 version; body grows to 150 words from 106. |
| Reworded | Holding Bitcoin for Hut 8 and American Bitcoin | Rewritten for holdings at both companies; names custodians incl. NYDIG and BitGo; body falls to 689 words from 902. |
| Reworded | Hashrate growth at American Bitcoin | Heading now names American Bitcoin as the miner; body largely unchanged. |
| Reworded | Purchasing miners at scale | Heading now names American Bitcoin; body largely unchanged. |
| Reworded | Hedging transactions | Extends hedging and counterparty risk to American Bitcoin. |
| Reworded | Competition from other Bitcoin investment vehicles | Body grows to 514 words from 195; adds competition from spot Bitcoin exchange traded products approved on 10 Jan 2024. |
| Reworded | Majority control of processing power | Wording updated on decentralization of mining pools. |
| Reworded | Complex legal and regulatory regimes | Adds the 19 site platform at 31 Dec 2025, Highrise AI and American Bitcoin, and AI regulation. |
| Reworded | Environmental and energy regulation | Adds AI and ASIC compute energy demand as possible targets of regulation. |
| Reworded | Legal proceedings | Body shortened to 214 words from 245. |
| Reworded | Third party intellectual property claims | Wording updated; length unchanged. |
| Filing | Change disclosed |
|---|---|
| 10-Q Q1 2026 filed 6 May 2026 | No material changes from the FY2025 10-K. |
| 10-Q Q2 2026 filed 4 Aug 2026 | No material changes from the FY2025 10-K. |
| 10-Q Q3 2026 filed 4 Nov 2026 | No material changes from the FY2025 10-K. |
11 Stock Price, Scenarios & Sensitivity
- HUT closed at $57.57 on 13 Nov 2026. 52 week closing high $133.02 on 2 Jun 2026 and closing low $33.76 on 20 Nov 2025. The chart starts in Dec 2023, the first full month after Hut 8 Corp. listed on 30 Nov 2023; the highest month end close was $124.83 in May 2026.
- Valuation basis: EV/Sales. Market value $6.9bn on 120.04m shares; enterprise value $8.0bn adds net debt of $1.08bn (debt less cash, restricted cash and restricted investments; Bitcoin excluded). EV/Sales 26.2x TTM revenue of $305.5m; price to book 4.4x. P/E is n/a on the TTM net loss.
- Scenario method: implied price equals TTM Q3 2029 revenue times an exit EV/Sales multiple, less net debt of $11.79bn, divided by 134.0m diluted shares (Q3 2026). Net debt is debt principal of $7.70bn after the TZRC repayment plus $4.25bn of Beacon Point Phase 2 debt, which is the report's assumption (sized on the filed $4.25bn Phase 1 notes; no Phase 2 financing is filed), less $156.9m of unrestricted cash; restricted balances are assumed spent on construction.

Critical factors and core assumptions
| Factor | Current value | Best case requires | Evidence in filings |
|---|---|---|---|
| On time delivery | first halls due Q2 2027 (River Bend), Q3 2027 and Q2 2028 (Beacon Point) | all 949 MW billing by mid 2029 | 8-K Ex 99.1 of 4 Nov 2026; 10-K delay penalties factor |
| Further leases | 3,180 MW under exclusivity, 49 MW under development | at least one more lease of 245 MW or more billing by 2029 | Q3 2026 10-Q KPIs |
| Phase 2 financing | not arranged; Phase 1 notes $4.25bn at 6.129% | non recourse notes on similar terms | 8-K Ex 99.1 of 5 Jun and 4 Nov 2026 |
| Interest burden | Q3 interest expense $105.5m against Adjusted EBITDA $33.0m | lease NOI above debt service (DSCR 1.31x and 1.34x as sculpted) | 8-K Ex 99.1 of 27 Apr and 4 Jun 2026 |
| Bitcoin price | $83,415 at 30 Sep 2026; 16,787 Bitcoin held | stable or higher price to fund buybacks and American Bitcoin | Q3 2026 10-Q |
| Stock based compensation | $64.7m in Q3 2026 against $6.3m | falls as 2025 one time awards vest | 10-Q MD&A; Form 4 PSU vesting at 300% |
- Revenue base TTM Q3 2026 $305.5m. Filed illustrative lease revenue for 2029: River Bend $384m and Beacon Point Phase 1 $545m ($929m together); no Phase 2 schedule is filed.
- Base case: 74% revenue CAGR to $1.61bn, i.e. the two filed schedules, Phase 2 billing for most of the year and Compute near today; exit EV/Sales 14x on triple net leases.
- Best case: 90% CAGR to $2.10bn with one further lease of about 245 MW billing in 2029; exit EV/Sales 16x.
- Worst case: 50% CAGR to $1.03bn with deliveries about a year late and lower Bitcoin revenue; exit EV/Sales 13x.
- Capital structure held at $11.79bn net debt in all cases, incl. the report's assumed $4.25bn of Phase 2 debt; 134.0m diluted shares; buybacks, American Bitcoin minority interests and Bitcoin holdings are not modelled.
Scenarios, three years forward
| Measure | Worst case | Base case | Best case |
|---|---|---|---|
| Revenue CAGR, 3 years (%) | 50.0 | 74.0 | 90.0 |
| Revenue, TTM Q3 2029 ($bn) | 1.0 | 1.6 | 2.1 |
| Exit EV/Sales (x) | 13.0 | 14.0 | 16.0 |
| Implied price ($) | 12 | 80 | 162 |
| Change against $57.57 (%) | (79) | 39 | 182 |
| Implied annual return (%) | (40.6) | 11.7 | 41.2 |
| Description | One year delay, lower Bitcoin revenue | Filed lease schedules, Phase 2 from 2028 | All leases on time plus a new lease |

Sensitivity analysis
| Revenue CAGR \ EV/Sales | 12x | 13x | 14x | 16x | 18x |
|---|---|---|---|---|---|
| 50% | $4 | $12 | $20 | $35 | $51 |
| 60% | $24 | $33 | $43 | $61 | $80 |
| 74% | $56 | $68 | $80 | $104 | $128 |
| 82% | $77 | $91 | $104 | $132 | $159 |
| 90% | $100 | $115 | $131 | $162 | $194 |
Disclaimer
This analysis is for information only and is not financial advice. It is derived from public SEC filings retrieved via sec-api.io and is not a publication of the U.S. Securities and Exchange Commission. Scenario values are model outputs under stated assumptions and are not forecasts. Data as of 15 November 2026.
Sources
All company and peer figures are read from SEC filings retrieved through the sec-api.io MCP server. Share prices are regular session closes as dated in the text.
| Form | Period | Filed | Accession number |
|---|---|---|---|
| 10-Q | 30 Sep 2026 | 4 Nov 2026 | 0001193125-26-446146 |
| 8-K | 4 Nov 2026 | 4 Nov 2026 | 0001104659-26-122347 |
| 10-Q | 30 Jun 2026 | 4 Aug 2026 | 0001104659-26-090025 |
| 10-Q | 31 Mar 2026 | 6 May 2026 | 0001104659-26-055891 |
| 10-K | 31 Dec 2025 | 25 Feb 2026 | 0001104659-26-019392 |
| 10-Q | 30 Sep 2025 | 4 Nov 2025 | 0001104659-25-105874 |
| 10-Q | 30 Jun 2025 | 7 Aug 2025 | 0001558370-25-010631 |
| 10-Q | 31 Mar 2025 | 8 May 2025 | 0001558370-25-006845 |
| 10-K | 31 Dec 2024 | 3 Mar 2025 | 0001558370-25-001996 |
| DEF 14A | 11 Jun 2026 | 28 Apr 2026 | 0001104659-26-049711 |
| 8-K | 4 Nov 2025 | 4 Nov 2025 | 0001104659-25-105883 |
| 8-K | 17 Nov 2025 | 17 Nov 2025 | 0001104659-25-112928 |
| 8-K | 17 Dec 2025 | 17 Dec 2025 | 0001104659-25-122052 |
| 8-K | 31 Dec 2025 | 31 Dec 2025 | 0001104659-25-125613 |
| 8-K | 25 Feb 2026 | 25 Feb 2026 | 0001104659-26-019393 |
| 8-K | 25 Feb 2026 | 25 Feb 2026 | 0001104659-26-019443 |
| 8-K | 27 Apr 2026 | 27 Apr 2026 | 0001104659-26-049090 |
| 8-K | 28 Apr 2026 | 28 Apr 2026 | 0001104659-26-049810 |
| 8-K | 30 Apr 2026 | 30 Apr 2026 | 0001104659-26-053247 |
| 8-K | 6 May 2026 | 6 May 2026 | 0001104659-26-055894 |
| 8-K | 4 Jun 2026 | 4 Jun 2026 | 0001104659-26-070393 |
| 8-K | 5 Jun 2026 | 5 Jun 2026 | 0001104659-26-070744 |
| 8-K | 9 Jun 2026 | 9 Jun 2026 | 0001104659-26-071952 |
| 8-K | 12 Jun 2026 | 12 Jun 2026 | 0001104659-26-073505 |
| 8-K | 20 Jul 2026 | 20 Jul 2026 | 0001104659-26-084862 |
| 8-K | 4 Aug 2026 | 4 Aug 2026 | 0001104659-26-090041 |
| 8-K | 28 Sep 2026 | 28 Sep 2026 | 0001104659-26-111154 |
| Form 4 | 11 Nov 2026 | 13 Nov 2026 | 0001104659-26-127277 |
| Form 4 | 29 Sep 2026 | 30 Sep 2026 | 0001104659-26-112496 |
| Form 4 | 24 Sep 2026 | 28 Sep 2026 | 0001964789-26-000040 |
| Company | Form | Filed | Accession number |
|---|---|---|---|
| Core Scientific | 10-K | 2 Mar 2026 | 0001628280-26-013305 |
| Core Scientific | 10-Q | 5 Nov 2026 | 0001839341-26-000030 |
| CoreWeave | 10-Q | 12 Nov 2026 | 0001769628-26-000465 |
| IREN | 10-K | 27 Aug 2026 | 0001878848-26-000052 |
| IREN | 8-K Ex 99.1 | 5 Nov 2026 | 0001878848-26-000065 |
| IREN | 10-Q | 5 Nov 2026 | 0001878848-26-000066 |
| Riot Platforms | 10-K | 2 Mar 2026 | 0001104659-26-022322 |
| Riot Platforms | 10-Q | 4 Nov 2026 | 0001104659-26-122417 |
| TeraWulf | 10-K | 27 Feb 2026 | 0001083301-26-000031 |
| TeraWulf | 8-K Ex 99.1 | 6 Nov 2026 | 0001628280-26-071306 |
| TeraWulf | 10-Q | 6 Nov 2026 | 0001628280-26-071671 |
| Filed | Exhibit | Document | Content |
|---|---|---|---|
| 4 Nov 2025 | Ex 99.1 | Q3 2025 results release | Revenue $83.5m against $43.7m: Power $8.4m, Digital Infrastructure $5.1m, Compute $70.0m; Net income $50.6m incl. $76.6m gains on digital assets; Adjusted EBITDA $109.0m on the definition then in use |
| 17 Nov 2025 | Ex 99.1 | Regulation FD exhibit | Furnished under Item 7.01; exhibit content not reviewed for this post |
| 17 Dec 2025 | Ex 99.1 | River Bend lease release | 15 year, 245 MW IT lease with Fluidstack, $7.0bn base term value incl. a 3.0% annual escalator; up to $17.7bn with three 5 year renewals; Google provides a financial backstop of lease payments and pass through obligations; expected average annual NOI $454m |
| 17 Dec 2025 | Ex 99.2 | River Bend investor presentation | 330 MW utility capacity at 1.35 PUE; build cost $9m to $11m per MW; cost of debt SOFR + 225 basis points expected; ROFO for up to 1,000 MW more; development platform about 9,520 MW incl. 1,020 MW under management |
| 31 Dec 2025 | Ex 10.1 | Fourth amended and restated Coinbase credit agreement | Principal increased by up to $70m to $200m, drawn in full on 22 Dec 2025; Secured by Bitcoin held at Coinbase Custody; repaid in May 2026 from the FalconX term loan (10-Q) |
| 25 Feb 2026 | Ex 99.1 | Q4 and FY2025 results release | FY2025 revenue $235.1m against $162.4m; Q4 2025 revenue $88.5m; Q4 2025 net loss $301.8m incl. $401.9m losses on digital assets; FY2025 net loss $248.0m |
| 25 Feb 2026 | Ex 1.1 | Amendment No. 1 to the ATM sales agreement | Adds Virtu Americas and Virtu Canada as sales agents to the at the market program |
| 27 Apr 2026 | Ex 99.1 | River Bend notes investor presentation | Illustrative revenue $171m in 2027, $373m in 2028, $384m in 2029; total $6.98bn to 2042; Amortization sculpted to a 1.31x DSCR from Q2 2028; levered free cash flow $1.67bn over the term |
| 28 Apr 2026 | Ex 99.1 | River Bend notes pricing | $3.25bn 6.192% senior secured notes due 15 Nov 2042 issued by Hut 8 DC LLC, non recourse to Hut 8; Fully amortizing from 15 May 2028; interest from 15 Nov 2026 |
| 30 Apr 2026 | Ex 4.1 | River Bend notes indenture | Indenture for the $3.25bn notes; secured by first priority liens on the issuer's assets and a pledge of its equity |
| 6 May 2026 | Ex 99.1 | Q1 2026 results release | Revenue $71.0m against $21.8m; net loss $253.1m incl. $295.7m losses on digital assets; Beacon Point Phase 1: 15 year, 352 MW lease, $9.8bn base term with a high investment grade tenant |
| 4 Jun 2026 | Ex 99.1 | Beacon Point illustrative financial information | Illustrative revenue $63m in 2027, $489m in 2028, $545m in 2029; total $9.79bn to 2042; Amortization sculpted to a 1.34x DSCR from Q2 2030; levered free cash flow $2.86bn |
| 5 Jun 2026 | Ex 99.1 | Beacon Point notes pricing | $4.25bn 6.129% senior secured notes due 30 Nov 2042 issued by Beacon Point DC LLC, non recourse to Hut 8; Six data halls, 352 MW IT on about 521 acres in Nueces County, Texas; tenant rated AA minus or higher |
| 9 Jun 2026 | Ex 4.1 | Beacon Point notes indenture | Indenture for the $4.25bn notes; amortization from 30 May 2030 |
| 20 Jul 2026 | Ex 99.1 | Beacon Point Phase 2 lease release | Second 15 year, 352 MW lease with the Phase 1 tenant, $9.8bn base term, average annual NOI $655m; Campus base term value $19.6bn ($50.2bn with renewals); portfolio 949 MW and $26.6bn |
| 4 Aug 2026 | Ex 99.1 | Q2 2026 results release | Revenue $74.9m against $41.3m; net loss $177.1m incl. $138.6m losses on digital assets; Adjusted EBITDA $10.4m on the revised definition excluding digital asset mark to market |
| 28 Sep 2026 | Ex 10.1 | Revolving credit agreement | $1.07bn senior secured revolver with a syndicate of 12 lenders, J.P. Morgan as agent, maturing Sep 2030; Letter of credit sublimit equal to the full commitment; minimum liquidity covenant from Q1 2027 |
| 28 Sep 2026 | Ex 99.1 | Revolver release | Margin SOFR + 150 to 200 basis points by debt to market capitalization ratio, SOFR + 175 at closing; CFO: more than $1bn of committed, non dilutive bank liquidity at the parent |
| 4 Nov 2026 | Ex 99.1 | Q3 2026 results release | Revenue $71.1m against $83.5m; net income $189.5m incl. $413.8m gains on digital assets; Adjusted EBITDA $33.0m against $30.5m; Energy Capacity Under Exclusivity up 1,300 MW to 3,180 MW; under construction 1,330 MW |