Mastercard Incorporated (MA), Financial Analysis
Insights derived from analysing SEC filings. Independent analysis, not a publication of the SEC.
- Revenue +14.0%, margin up. Q3 2026 net revenue $9.81bn; operating income $5.86bn, 59.8% margin against 58.8%; diluted EPS $5.28, +21.7%, adjusted $5.31. 9M 2026 net revenue $27.48bn, +14.6%.
- Services carry growth. Value added services and solutions $4.06bn, +18.6%, 41.4% of net revenue against 39.8%; payment network $5.75bn, +11.0%. Chapters 2 to 5 follow the payment network, cross border, services and new flows.
- Volume slows, pricing adds. Gross dollar volume +7.5% in local currency, US debit +1.4% after the Capital One debit migration; domestic assessments +14.3% (+13% currency neutral against volume +7%, about 6 points from pricing and mix, per the CFO), and transaction processing assessments +14.1%.
- Cross border decelerates. Cross border volume +11% in local currency against +15% a year earlier; cross border assessments $3.84bn, +15.9%. Visa cross border volume excl. intra Europe +14% in constant dollars (Q4 FY2026, Sep 2026 quarter).
- Incentives rise faster than revenue. Payment network rebates and incentives $6.37bn, +18%; 9M 2026 +20.9% against payment network net revenue +10.9%. The CFO expects a higher Q4 ratio to gross assessments.
- Shares at $638.02 on 30 Oct 2026, 33.4x TTM diluted EPS of $19.11. TTM buybacks and dividends $18.45bn, 120% of free cash flow; debt $23.9bn. Base case $877 in three years; best $1,141; worst $497.
Figures are read from the Forms 10-K for FY2021 to FY2025 (FY2024 for the risk factor comparison), the Forms 10-Q for Q2 2025 to Q3 2026, the Forms 8-K with all their exhibits, incl. the quarterly earnings releases with their operating performance tables (Ex 99.1), the amended interchange settlement agreement (Ex 99.1), the leadership release (Ex 99.1), the notes underwriting agreement, officer's certificate and legal opinion (Ex 1.1, 4.1, 5.1) and the Item 1.01, 5.02 and 5.07 texts, the proxy statement of Apr 2026, Schedules 13G and Forms 4 for central index key 1141391, together with the filings of Visa, American Express, PayPal and eight further payments companies used in chapters 2 to 5 and 8. No CFO commentary document is filed with the SEC; CFO commentary comes from the Q4 2025 to Q3 2026 earnings calls. Accession numbers appear in the Sources appendix. Market prices are closing prices of 30 Oct 2026.
1 Revenue & Business Model
- Storyline: growth moves from card volume to pricing, services and new flows, while rebates and incentives take a larger share of gross revenue. Value added services rose from 36.8% of net revenue in FY2021 to 40.6% in FY2025 and 41.4% in Q3 2026. Chapters 2 to 5 cover the four revenue drivers: the payment network, cross border, value added services, and new flows (commercial, stablecoins and agentic commerce).
- Business model: Mastercard runs a card payments network and earns fees from issuers and acquirers; one reportable segment, Payment Solutions. Payment network revenue comes from switching fees and assessments on gross dollar volume, net of rebates and incentives; value added services and solutions cover security, consumer acquisition and engagement, business and market insights, digital and authentication, processing and gateway, and open banking.
- Net revenue FY2021 $18.88bn to FY2025 $32.79bn, a 14.8% CAGR; TTM Q3 2026 $36.29bn. Payment network rebates and incentives $20.52bn in FY2025, +16.4%.
- Regions: Asia Pacific, Europe, Middle East and Africa 57.2% of FY2025 net revenue; 9M 2026 Americas $11.75bn (+15.1%), Asia Pacific, Europe, Middle East and Africa $15.73bn (+14.2%).
- Scale: gross dollar volume $10.6tn in FY2025, +9% in local currency; 175.5bn switched transactions; about 3.8bn Mastercard and Maestro cards at 30 Sep 2026; about 39,800 employees at 31 Dec 2025.


| Line | FY2021 | FY2022 | FY2023 | FY2024 | FY2025 |
|---|---|---|---|---|---|
| Payment network ($bn) | 11.94 | 14.36 | 15.82 | 17.34 | 19.48 |
| Value added services and solutions ($bn) | 6.94 | 7.88 | 9.27 | 10.83 | 13.32 |
| Net revenue ($bn) | 18.88 | 22.24 | 25.10 | 28.17 | 32.79 |
| Value added services (% of net revenue) | 36.8 | 35.4 | 37.0 | 38.5 | 40.6 |
| Payment network rebates and incentives ($bn) | 10.48 | 12.45 | 15.18 | 17.63 | 20.52 |
| Region | FY2023 | FY2024 | FY2025 | 9M 2025 | 9M 2026 |
|---|---|---|---|---|---|
| Americas ($bn) | 11.14 | 12.38 | 14.04 | 10.21 | 11.75 |
| Asia Pacific, Europe, Middle East and Africa ($bn) | 13.96 | 15.79 | 18.75 | 13.78 | 15.73 |
| Asia Pacific, Europe, Middle East and Africa (% of net revenue) | 55.6 | 56.1 | 57.2 | 57.4 | 57.2 |
2 Payment Network: Volume, Pricing and Rising Incentives
- Payment network net revenue $5.75bn in Q3 2026, +11.0%; 9M 2026 $16.15bn, +10.9%; 58.6% of Q3 2026 net revenue against 63.2% in FY2021.
- Volumes: gross dollar volume $2.95tn in Q3 2026, +7.5% in local currency after +8.7% a year earlier; US +5.9%, with debit $400bn, +1.4%, against credit +10.1%; outside the US +8.1%; switched transactions +9%.
- Pricing and mix: domestic assessments +14.3% (+13% currency neutral) against volume +7%, about 6 points from pricing and mix (CFO); transaction processing assessments +14.1% (Q3 2026 call and 10-Q).
- Rebates and incentives $6.37bn in Q3 2026, +18%, 39.4% of net revenue plus rebates against 38.5% a year earlier; 9M 2026 $18.01bn, +20.9%. The CFO said net revenue yield is the measure that counts and that Mastercard does not win every deal.

| Line | Q3 2025 | Q4 2025 | Q1 2026 | Q2 2026 | Q3 2026 |
|---|---|---|---|---|---|
| Payment network ($bn) | 5.18 | 4.92 | 4.95 | 5.45 | 5.75 |
| Value added services and solutions ($bn) | 3.42 | 3.89 | 3.45 | 3.83 | 4.06 |
| Net revenue ($bn) | 8.60 | 8.81 | 8.40 | 9.28 | 9.81 |
| Payment network rebates and incentives ($bn) | 5.39 | 5.63 | 5.64 | 6.00 | 6.37 |
| Rebates and incentives (% of net revenue plus rebates) | 38.5 | 39.0 | 40.2 | 39.3 | 39.4 |
| Rebates and incentives growth, as reported (%) | 16 | 20 | 23 | 22 | 18 |
| Metric | Q3 2025 | Q4 2025 | Q1 2026 | Q2 2026 | Q3 2026 |
|---|---|---|---|---|---|
| Gross dollar volume ($bn) | 2,754 | 2,819 | 2,703 | 2,881 | 2,952 |
| Gross dollar volume growth, local currency (%) | 8.7 | 7.4 | 7.3 | 8.0 | 7.5 |
| Cross border volume growth, local currency (%) | 15 | 14 | 13 | 12 | 11 |
| Switched transactions growth (%) | 10 | 10 | 9 | 9 | 9 |
| Mastercard branded cards (m) | 3,303 | 3,391 | 3,408 | 3,463 | 3,539 |
How card payments are changing
- Network volume growth (latest quarter): Mastercard gross dollar volume +7.5% in local currency against Visa payments volume +9% in constant dollars (Q4 FY2026, Sep 2026 quarter), American Express billed business +8%, PayPal total payment volume +6.3% and Square gross payment volume +12.2% (Q2 2026).
- US debit routing: Capital One said in May 2025, after buying Discover, that it would move its debit cards, mostly on Mastercard, to the Discover network; Mastercard US debit volume grew 1.4% in Q3 2026 and the migration was largely complete in Q1 2026 (Q2 2026 call).
- Real time payment systems take share in some markets: in Brazil Pix carried 55.2% of 79.7bn payments in H1 2026 against cards 30.8% (Banco Central do Brasil data); India's UPI processed 24.07bn transactions in Sep 2026, +23% (NPCI data).
- Incentives rise across networks: Visa client incentives +20.6% in Q4 FY2026 (Sep 2026 quarter) and 28.5% of FY2026 gross revenue; Mastercard rebates and incentives +18% in Q3 2026.
- US settlement: the revised Visa and Mastercard merchant settlement received preliminary court approval on 9 Jun 2026; it cuts credit interchange 10 bps for five years and loosens honor all cards and surcharging rules.

| Company and measure | Period | Volume ($bn) | Growth (%) | Filed detail |
|---|---|---|---|---|
| Mastercard gross dollar volume | Q3 2026 | 2,952 | 7.5 (local currency) | US +5.9%, US debit +1.4%; switched transactions +9% |
| Visa payments volume | Q4 FY2026 (Sep 2026 quarter) | n/a | 9 (constant dollar) | processed transactions 74.2bn, +10% |
| American Express billed business | Q3 2026 | 454 | 8 | card issuer and network |
| PayPal total payment volume | Q3 2026 | 487 | 6.3 | 6.8bn payment transactions, +7% |
| Block (Square) gross payment volume | Q2 2026 | 74.7 | 12.2 | Square gross profit +13% |
3 Cross Border: Travel, Ecommerce and a Slowing Growth Rate
- Cross border assessments $3.84bn in Q3 2026, +15.9%, after +22.9% in Q1 and +21.5% in Q2 2026; FY2025 $12.02bn, +18.1%. Assessments are gross pricing measures before rebates.
- Cross border volume +11% in local currency in Q3 2026, down each quarter from +15% in Q3 2025; FY2025 +15%, FY2022 +45%. From 2026 key drivers include Venezuela cross border activity (10-Q).
- Mix: card not present cross border volume excluding travel slowed to +15% from +20% in Q2 2026; the CFO named intra Europe mix, a new EU customs fee, promotion timing and lower crypto purchases.
- Middle East: GCC countries plus Israel were about 6% of cross border volume; travel softened in Mar 2026 and the effect moderated in Q2 2026 (CFO).

How cross border payments are changing
- Travel slows: international tourist arrivals rose 0.4% to about 690m in H1 2026 and the 2026 forecast was cut to 1% to 2% from 3% to 4% (UN Tourism, 17 Sep 2026).
- Visa shows the same pattern: cross border volume excl. intra Europe +14% in constant dollars against international transaction revenue +8.3% in Q4 FY2026 (Sep 2026 quarter); in its Q3 FY2026 Form 10-Q Visa tied slower international transaction revenue growth to lower currency volatility.
- Remittances move to digital channels: Remitly send volume +27% and revenue +20% in Q2 2026; Western Union revenue (1.3%) with branded digital transactions +25%.
- Stablecoins target cross border flows: Circle Payments Network reached $14.7bn annualized volume with 175 institutions at the end of Q2 2026; Mastercard Move covers more than 60 sending and 155 receiving countries.
| Company and measure | Period | Growth (%) | Filed detail |
|---|---|---|---|
| Mastercard cross border volume | Q3 2026 | 11 (local currency) | cross border assessments $3.84bn, +15.9% |
| Visa cross border volume excl. intra Europe | Q4 FY2026 (Sep 2026 quarter) | 14 (constant dollar) | international transaction revenue $4.12bn, +8.3% |
| Remitly send volume | Q2 2026 | 27 | revenue $495m, +20%; 10.2m active customers |
| Western Union revenue | Q2 2026 | (1.3) | branded digital transactions +25%; operating margin 13% |
| American Express billed business | Q3 2026 | 8 | no cross border split in the release |
4 Value Added Services: Security, Data and Consulting at 41% of Revenue
- Value added services and solutions $4.06bn in Q3 2026, +18.6% (+19% currency neutral); 9M 2026 $11.33bn, +20.2%; FY2025 $13.32bn, +22.9%, incl. 3 points from 2024 acquisitions such as Recorded Future.
- Share of net revenue 41.4% in Q3 2026 against 39.8% a year earlier and 36.8% in FY2021; about 60% of services are linked to the network (CFO).
- Products named: security solutions, consumer acquisition and engagement, business and market insights, digital and authentication, processing and gateway, open banking and consulting; Digital Risk Protection has nearly 800 enterprise customers; Threat Intelligence flagged more than 7m card testing transactions in 192 countries.
- Backlog: remaining performance obligations for services $2.0bn at 31 Dec 2025, recognized through 2030 (10-K FY2025).

How payment services are changing
- Mastercard reports a larger services share than Visa: $4.06bn in Q3 2026, 41.4% of net revenue, against Visa value added services of $3.8bn, +33%, in Q3 FY2026 (Jun 2026 quarter) and about $14bn in FY2026 (Visa call).
- Fraud and identity: US consumers reported $15.9bn of fraud losses in 2025 (Federal Trade Commission); Visa agreed to buy BioCatch, a behavioral fraud intelligence provider, for $2.4bn on 3 Aug 2026.
- Cost of delivery: Mastercard data processing and telecommunications costs rose 19% in Q3 2026, with fulfillment costs for marketing services named in the 10-Q.
- Processors report revenue declines: Fiserv Financial Solutions revenue (7.7%) in Q2 2026 with segment margin 38.7% against 48.7%; PayPal other value added services (2.5%) in Q3 2026.

| Company and line | Period | Revenue | Growth (%) | Filed detail |
|---|---|---|---|---|
| Mastercard value added services and solutions | Q3 2026 | 4.06 | 18.6 | 41.4% of net revenue; 9M 2026 $11.33bn, +20.2% |
| Visa value added services | Q3 FY2026 (Jun 2026 quarter) | 3.80 | 33 | FY2025 $10.9bn; FY2026 about $14bn (call) |
| Fiserv Financial Solutions | Q2 2026 | 2.36 | (7.7) | segment operating margin 38.7% against 48.7% |
| PayPal other value added services | Q3 2026 | 0.87 | (2.5) | incl. interest on customer balances |
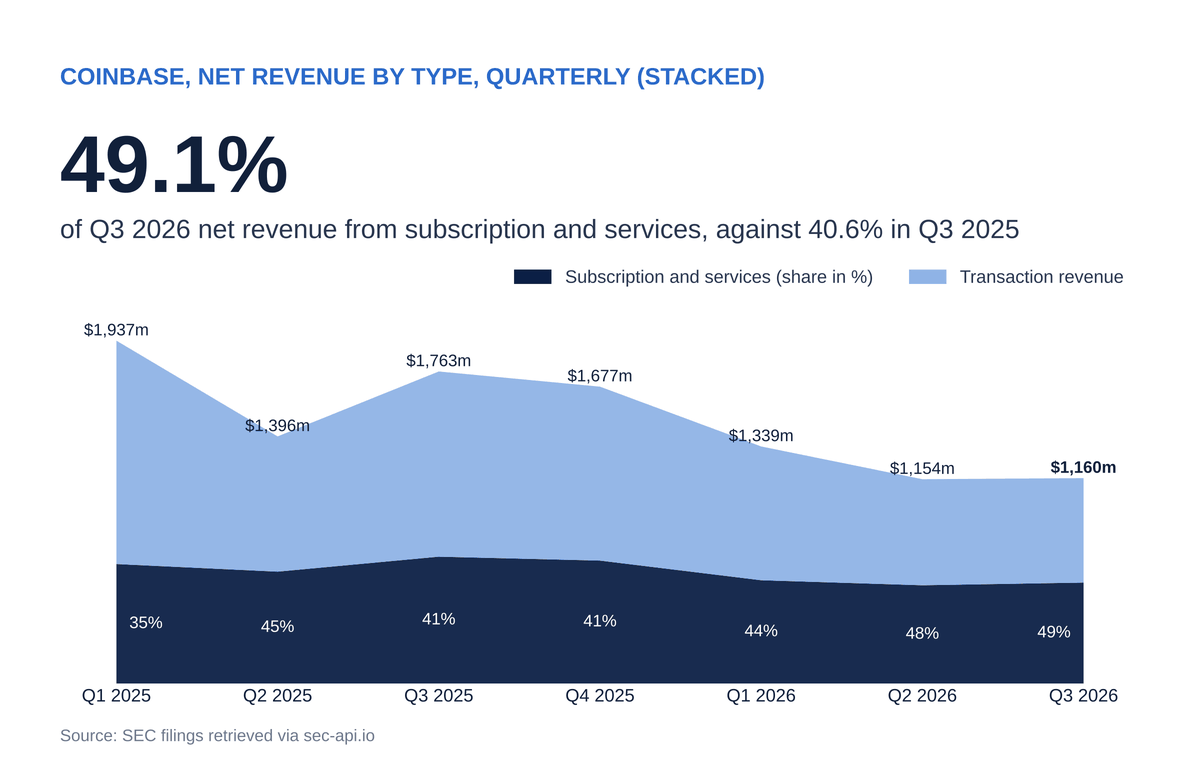
| Coinbase subscription and services | Q3 2026 | 0.57 | (20.4) | 49% of net revenue; stablecoin revenue $307m |
5 New Flows: Commercial, Stablecoins and Agentic Commerce
- Commercial credit and debit gross dollar volume $1.41tn in FY2025, +11%, 13% of gross dollar volume, on 174m cards; consumer credit $3.88tn (+8%) and consumer debit and prepaid $5.35tn (+9%) (10-K FY2025).
- Stablecoins: BVNK bought on 3 Aug 2026 for $1.4bn cash plus up to $300m contingent consideration; first joint product the Global Money Platform for fiat and stablecoin accounts, with Nuvei and Marqeta as early customers; about 130 crypto co brand card programs (10-K FY2025).
- Agentic commerce: Agent Pay launched in 2025 for US cardholders, enabled on nearly all Mastercards globally by Q1 2026 with Google, Microsoft and OpenAI; strategic partnership with OpenAI and Shopify Shop Pay on Agent Pay and network tokens (Q3 2026 call).
- Tokens and Move: about 40% of transactions tokenized in 2025; Mastercard Move reaches more than 17bn endpoints; Essential Debit runs 15 programs in seven markets.

How new payment flows are changing
- Stablecoin rules: the GENIUS Act was enacted on 18 Jul 2025; the OCC issued its final implementing rule on 21 Oct 2026, effective 18 Jan 2027 (OCC bulletin). Stablecoin market capitalization was $304bn at the end of Q3 2026 (Coinbase 8-K).
- Networks buy stablecoin infrastructure: Mastercard closed BVNK in Aug 2026; Visa stablecoin settlement ran above $25bn annualized in Oct 2026 (Visa call); Visa and Mastercard are named among the validators of Circle's Arc network.
- AI agents as buyers: Mastercard announced Agent Pay for Machines on 10 Jun 2026 with Adyen, Coinbase and Cloudflare; Visa and OpenAI announced an agent payment integration the same day; American Express released an agentic commerce framework in Q3 2026.
- Competing agent protocols: Coinbase x402, the Stripe and Tempo Machine Payments Protocol and Google's AI payments standard; Circle reports 99.3% of x402 agent payment volume settles in USDC (Circle 8-K, 5 Aug 2026).
| Company | Measure | Value | Filed detail |
|---|---|---|---|
| Mastercard | BVNK acquisition (3 Aug 2026) | $1.4bn cash plus up to $300m | goodwill $1.27bn; Global Money Platform for fiat and stablecoin accounts |
| Visa | Stablecoin settlement run rate | above $25bn annualized (Oct 2026) | BioCatch fraud intelligence for $2.4bn (agreed 3 Aug 2026) |
| Circle | USDC in circulation (Q2 2026) | $73.3bn, +19% | Circle Payments Network $14.7bn annualized, 175 institutions |
| Coinbase | Stablecoin revenue (Q3 2026) | $307m, (5.5%) | average USDC in Coinbase products $22bn |
| Block | Cash App stablecoin launch (Q2 2026) | no volume disclosed | USDC across blockchains |
| American Express | Agentic commerce (Q3 2026) | no volume disclosed | Intent Intelligence framework |
6 Financial Analysis & Ratios
- Operating margin 58.6% TTM against 57.6% in FY2025 and 53.4% in FY2021; 9M 2026 59.5% against 58.3%, after the $202m Q1 2026 restructuring charge. Adjusted operating margin 60.5% in Q3 2026 and 59.2% in FY2025.
- Operating expenses $3.95bn in Q3 2026, +11.4%, against net revenue +14.0%; general and administrative $3.29bn, +13%, with personnel +7% and data processing +19% (10-Q).
- Net income $4.63bn in Q3 2026, +17.9%; TTM $16.96bn, 46.7% of net revenue. Effective tax rate 19.4% in Q3 2026 against 21.5%; FY2025 19.4% against 15.6% in FY2024 after the 15% global minimum tax on Singapore operations.
- Operating cash flow 9M 2026 $11.86bn against $12.65bn, lower on incentive payments, litigation settlement payments and settlement timing (10-Q). TTM free cash flow $15.43bn, 42.5% of net revenue; capex incl. capitalized software $1.43bn.
- Capital returns: TTM buybacks $15.45bn and dividends $3.00bn, 120% of free cash flow; 9M 2026 buybacks 22.9m shares for $11.89bn at $520.64 on average; $4.9bn of authorization left at 26 Oct 2026; quarterly dividend $0.87.
- Balance sheet at 30 Sep 2026: cash and investments $10.46bn; debt $23.94bn against $19.00bn at FY2025 after $5.0bn of notes in Jun 2026; net debt $13.47bn; equity $6.75bn, which lifts ROE.
| Line item | FY2021 | FY2022 | FY2023 | FY2024 | FY2025 | TTM Q3 2026 |
|---|---|---|---|---|---|---|
| Revenue | 18.9 | 22.2 | 25.1 | 28.2 | 32.8 | 36.3 |
| Selling, general and administrative | 8.0 | 8.9 | 9.8 | 11.0 | 12.2 | 13.5 |
| Operating income | 10.1 | 12.3 | 14.0 | 15.6 | 18.9 | 21.3 |
| Net income | 8.7 | 9.9 | 11.2 | 12.9 | 15.0 | 17.0 |
| Diluted EPS ($) | 8.76 | 10.22 | 11.83 | 13.89 | 16.52 | 19.11 |
| Operating cash flow | 9.5 | 11.2 | 12.0 | 14.8 | 17.6 | 16.9 |
| Capital expenditure | (0.8) | (1.1) | (1.1) | (1.2) | (1.2) | (1.4) |
| Free cash flow | 8.6 | 10.1 | 10.9 | 13.6 | 16.4 | 15.4 |
| Stock based compensation | 0.3 | 0.3 | 0.5 | 0.5 | 0.6 | 0.6 |
| Cash and investments | 7.9 | 7.4 | 9.2 | 8.8 | 10.9 | 10.5 |
| Total debt | 13.9 | 14.0 | 15.7 | 18.2 | 19.0 | 23.9 |
| Total equity | 7.3 | 6.3 | 6.9 | 6.5 | 7.7 | 6.8 |

| Metric | Q3 2025 | Q3 2026 | Change |
|---|---|---|---|
| Revenue ($bn) | 8.60 | 9.81 | 14.0% |
| Operating income ($bn) | 5.06 | 5.86 | 15.8% |
| Net income ($bn) | 3.93 | 4.63 | 17.9% |
| Diluted EPS ($) | 4.34 | 5.28 | 21.7% |
| Operating cash flow ($bn) | 5.66 | 5.09 | (10.2%) |
| Free cash flow ($bn) | 5.30 | 4.76 | (10.3%) |
| Operating margin (%) | 58.8 | 59.8 | 0.9 pts |
| Net margin (%) | 45.7 | 47.2 | 1.5 pts |
| Ratio | FY2021 | FY2022 | FY2023 | FY2024 | FY2025 | TTM Q3 2026 |
|---|---|---|---|---|---|---|
| Growth and margins | ||||||
| Revenue growth (%) | n/a | 17.8 | 12.9 | 12.2 | 16.4 | n/a |
| Operating margin (%) | 53.4 | 55.2 | 55.8 | 55.3 | 57.6 | 58.6 |
| Net margin (%) | 46.0 | 44.7 | 44.6 | 45.7 | 45.6 | 46.7 |
| FCF margin (%) | 45.8 | 45.4 | 43.4 | 48.2 | 50.1 | 42.5 |
| Cost and investment intensity | ||||||
| SBC (%) revenue | 1.4 | 1.3 | 1.8 | 1.9 | 1.8 | 1.8 |
| Capex (%) revenue | 4.3 | 4.9 | 4.3 | 4.2 | 3.7 | 3.9 |
| Effective tax rate (%) | 15.7 | 15.4 | 17.9 | 15.6 | 19.4 | 18.9 |
| Returns | ||||||
| ROE (%) | 118.8 | 145.9 | 169.3 | 191.9 | 210.5 | 251.1 |
| ROA (%) | 23.1 | 26.0 | 27.6 | 28.4 | 29.3 | 29.2 |
| ROIC (%) | 63.8 | 80.4 | 85.6 | 82.5 | 96.1 | 85.2 |
| Asset turnover (x) | 0.50 | 0.57 | 0.59 | 0.59 | 0.61 | 0.62 |
| Liquidity and leverage | ||||||
| Current ratio (x) | 1.29 | 1.17 | 1.17 | 1.03 | 1.03 | 1.01 |
| Debt to equity (x) | 1.90 | 2.23 | 2.26 | 2.81 | 2.46 | 3.54 |
| Net cash ($bn) | (6.0) | (6.6) | (6.5) | (9.5) | (8.1) | (13.5) |
| Efficiency and cash quality | ||||||
| Days sales outstanding | 58 | 56 | 59 | 49 | 51 | 53 |
| FCF to net income (x) | 1.00 | 1.02 | 0.97 | 1.06 | 1.10 | 0.91 |
| Shareholder returns (%) FCF | 88 | 106 | 103 | 99 | 88 | 120 |


| Measure | Value |
|---|---|
| Market cap ($bn) | 555.8 |
| Enterprise value ($bn) | 569.3 |
| P/E (TTM) (x) | 33.4 |
| EV/Sales (TTM) (x) | 15.7 |
| EV/EBITDA (TTM) (x) | 25.3 |
| FCF yield (%) | 2.8 |
| Price/Book (x) | 82.3 |
| Line | FY2025 | Q4 2025 | Q1 2026 | Q2 2026 | Q3 2026 |
|---|---|---|---|---|---|
| Diluted EPS, GAAP ($) | 16.52 | 4.52 | 4.35 | 4.97 | 5.28 |
| Diluted EPS, adjusted ($) | 17.01 | 4.76 | 4.60 | 5.04 | 5.31 |
| Litigation provision ($m) | 504 | 174 | 0 | 82 | 74 |
| Restructuring charge ($m) | 0 | 0 | 202 | 0 | 0 |
Cost structure and profitability
- Operating expenses 40.2% of Q3 2026 net revenue against 41.2% a year earlier; the cost base is general and administrative (personnel, data processing, professional fees), advertising and marketing, depreciation and amortization and litigation provisions.
- General and administrative 34.5% of FY2025 net revenue against 37.5% in FY2021; new multi year government grants cut FY2025 G&A growth by 2 points and lifted other income in 2026 ($46m in Q3 2026 against $2m).
- Litigation provision $74m in Q3 2026 against $83m; $156m in 9M 2026 against $680m in FY2024 and $504m in FY2025.
- Depreciation and amortization $1.14bn in FY2025, +27.4%, 3.5% of net revenue; Q3 2026 $326m, +12% (10-Q). Capitalized software was $726m of FY2025 capex of $1.22bn.
- Amortization of customer and merchant incentives $2.10bn in FY2025, +14.6%, a non cash charge against revenue that sits inside rebates and incentives.
- Free cash flow converts 91% of TTM net income; FY2025 buybacks and dividends $14.48bn were 88% of free cash flow, TTM 120%.


| Line | Q3 2025 | Q4 2025 | Q1 2026 | Q2 2026 | Q3 2026 |
|---|---|---|---|---|---|
| Operating expenses (% of net revenue) | 41.2 | 44.2 | 41.6 | 39.8 | 40.2 |
| Litigation provision (incl. above) (% of net revenue) | 1.0 | 2.0 | 0.0 | 0.9 | 0.8 |
| Operating income (% of net revenue) | 58.8 | 55.8 | 58.4 | 60.2 | 59.8 |
| Capital expenditure (% of net revenue) | 4.2 | 3.3 | 4.0 | 5.2 | 3.3 |
| Free cash flow (% of net revenue) | 61.7 | 53.5 | 31.7 | 35.5 | 48.5 |
| Line | FY2021 | FY2022 | FY2023 | FY2024 | FY2025 |
|---|---|---|---|---|---|
| General and administrative (% of net revenue) | 37.5 | 36.3 | 35.6 | 36.2 | 34.5 |
| Advertising and marketing (% of net revenue) | 4.7 | 3.5 | 3.3 | 2.9 | 2.8 |
| Litigation provision (% of net revenue) | 0.5 | 1.6 | 2.1 | 2.4 | 1.5 |
| Depreciation and amortization (% of net revenue) | 3.8 | 3.4 | 3.2 | 3.2 | 3.5 |
| Operating income (% of net revenue) | 53.4 | 55.2 | 55.8 | 55.3 | 57.6 |
7 MD&A & Management Commentary
Q3 2026 earnings call and results release
- Q3 2026 (29 Oct 2026): net revenue $9.81bn, +14% reported and currency neutral; diluted EPS $5.28, +22%; adjusted EPS $5.31, +21%, of which about $0.16 from buybacks (CFO).
- Assessments Q3 2026: domestic $3.21bn (+14.3%), cross border $3.84bn (+15.9%), transaction processing $4.78bn (+14.1%); rebates and incentives $6.37bn (+18%) on key drivers and new and renewed deals.
- Volumes Q3 2026: US gross dollar volume +6% (credit +10%, debit +1%), outside the US +8%; switched transactions +9%; contactless 81% of in person switched purchases; cards +5% to about 3.8bn. October to the third week was broadly in line with Q3 (CFO).
- Services: value added services +19%; about 60% of services linked to the network; some services projects and deal signings moved from Q4 into Q3; BVNK contribution minimal (CFO).
- Q2 2026 call (30 Jul 2026): net revenue +12%, payment network +8% (+10% reported) and value added services +18%, all currency neutral; US debit volume +8% excluding the Capital One migration; $4.9bn bought back in Q2; FY2026 revenue growth placed higher within its range.
| Item | Outlook | Source |
|---|---|---|
| FY2026 net revenue growth (currency neutral, excl. acquisitions) | high end of low double digits, FX tailwind 1 to 1.5 points (29 Jan 2026); held with about 1.5 points (30 Apr); higher within the range, about 1 point (30 Jul); unchanged, about 1 point (29 Oct). 9M actual +13% currency neutral, +15% reported | Q4 2025 to Q3 2026 calls |
| FY2026 operating expense growth (currency neutral, excl. acquisitions and special items) | low end of low double digits (29 Jan 2026); low double digits (30 Jul and 29 Oct); FX headwind 0.5 to 1 point | Q4 2025, Q2 and Q3 2026 calls |
| FY2026 adjusted tax rate | 20% to 21% (unchanged all year) | Q4 2025 to Q3 2026 calls |
| Q1 2026 | net revenue growth low end of low double digits, FX tailwind 3.5 to 4 points; restructuring charge about $200m; actual +12% currency neutral and $202m | Q4 2025 call; 8-K Ex 99.1 30 Apr 2026 |
| Q3 2026 | net revenue growth high end of low double digits; other expense about $125m; actual +14% and adjusted $115m | Q2 2026 call; Q3 2026 10-Q |
| Q4 2026 net revenue growth | high end of low double digits, currency neutral excl. acquisitions; FX about 1 point headwind | Q3 2026 call, 29 Oct 2026 |
| Q4 2026 operating expense growth | high end of low double digits; acquisitions about 1 point; FX about 0.5 point tailwind | Q3 2026 call |
| Q4 2026 other expense | about $115m excl. equity investment results (as transcribed) | Q3 2026 call |
| Q4 2026 rebates and incentives | higher as a share of gross assessments than in Q3 2026 | Q3 2026 call |
| FY2027 | no figures; outlook with Q4 2026 results in Jan 2027 | Q3 2026 call |
| Capital return | $4.9bn of buyback authorization at 26 Oct 2026; quarterly dividend $0.87 | 8-K Ex 99.1 29 Oct 2026 |
Management and CFO commentary
- CFO Ling Hai, Q3 2026 call (first as CFO): Q4 net revenue growth near the high end of low double digits with about a 1 point FX headwind; Q4 rebates and incentives higher as a share of gross assessments; no 2027 figures until Jan 2027.
- CFO, Q3 2026 call: operating expenses +12%, about 1 point from acquisitions; adjusted EPS +21% incl. $0.16 from buybacks; $3.0bn bought back in Q3 and $648m to 26 Oct.
- CFO, Q3 2026 call: domestic assessments +13% against volume +7%; card not present cross border excluding travel slowed to +15% from +20%; US switched volume improved in October as the Capital One migration lapped.
- CFO Sachin Mehra, Q2 2026 call: Europe slowed on lapping 2024 wins and the exit from a Lloyds deal that missed economic thresholds; FY2026 revenue growth higher within the range.
- CFO, Q4 2025 call: government grants cut Q4 2025 operating expense growth by about 5.5 points and added about $135m to other income; Q1 2026 restructuring of about $200m, about 4% of full time staff.
- CEO Michael Miebach, 8-K Ex 99.1 of 29 Oct 2026: BVNK underpins the Global Money Platform; 100 new affluent programs won in 2026; Q3 travel wins expected to add more than $20bn of spend; HDFC Bank small business deal to add 3m cards in India.
| Speaker | Date and source | Statement |
|---|---|---|
| Michael Miebach, CEO | 29 Oct 2026, Q3 2026 earnings release, 8-K Ex 99.1 | “We’re not waiting for the future of commerce.” |
| Ling Hai, CFO | 29 Oct 2026, Q3 2026 earnings call | “Our full year remains in line with these expectations.” |
| Sachin Mehra, CFO | 30 Jul 2026, Q2 2026 earnings call | “Volume for the sake of volume is not what this company should be chasing.” |
| Item | Disclosure |
|---|---|
| 10-Q Q3 2026, MD&A | Net revenue $9.81bn (+14%, +14% currency neutral); payment network +11%, VAS +19%; adjusted operating margin 60.5% (59.8% GAAP); adjusted EPS $5.31 (+21%). Payment network rebates and incentives $6.37bn (+18%) due to key drivers and new and renewed deals. |
| 10-Q Q3 2026, assessments | Domestic assessments $3.21bn (+14%), cross border assessments $3.84bn (+16%), transaction processing $4.78bn (+14%), other network $285m (+10%). |
| 10-Q Q3 2026, operating expenses | Q3 2026 G&A $3.29bn (+13%): personnel $2.03bn (+7%), data processing $386m (+19%), other $675m (+22%); D&A $326m (+12%); 9M includes $202m Q1 2026 restructuring charge ($0.18 per share). |
| 10-Q Q3 2026, other income | Interest expense Q3 2026 $250m vs $186m; other income $46m vs $2m driven by government grants; equity investment loss $5m. |
| 10-Q Q3 2026, tax | Q3 2026 effective tax rate 19.4% (21.5% Q3 2025); adjusted 20.1%; 9M 19.6% vs 20.4% due to higher net discrete benefits. |
| 10-Q Q3 2026, liquidity and debt | Cash, cash equivalents and investments $10.5bn; total debt $23.9bn (Dec 2025 $19.0bn) after $5.0bn June 2026 notes; $1.7bn due within 12 months; $8bn undrawn revolver to Nov 2030; commercial paper $0.7bn at Jun 30, nil at Sep 30. |
| 10-Q Q3 2026, cash flow | CFO $11.86bn vs $12.65bn, lower due to higher customer incentive payments, litigation settlement payments and settlement timing; investing outflow $2.60bn incl. $1.37bn acquisition (BVNK). |
| 10-Q Q3 2026, capital return | 9M 2026 repurchased 22.9m shares for $11.89bn (average $520.64); dividends $2.31bn; quarterly dividend $0.87; remaining authorization $5.57bn at Sep 30 and $4.9bn at Oct 26 after $648m more buybacks. |
| 10-Q Q3 2026, acquisition | Aug 3 2026 acquired BVNK Holdings (stablecoin infrastructure) for $1.4bn cash plus up to $300m contingent consideration; goodwill $1.3bn. |
| 10-Q Q3 2026, legal | US MDL accrual $156m (Dec 2025 $637m); Block and Intuit opt out claims above $5bn single damages; new UK collective claims GBP 1.5bn and GBP 0.4bn filed Oct 2026; Rules Relief settlement final approval hearing Nov 2026. |
| 10-Q Q3 2026, other information | No officer or director adopted or terminated prearranged trading arrangements in Q3 2026. CFO certifications signed by Ling Hai (CFO since Aug 3 2026). |
| 10-K FY2025, product mix | Consumer credit GDV $3.88tn (+8% local, 37% of GDV, 1.08bn cards); consumer debit and prepaid $5.35tn (+9%, 50%, 2.13bn cards); commercial credit and debit $1.41tn (+11%, 13%, 174m cards). |
| 10-K FY2025, 2025 developments | Launched Mastercard Agent Pay for agentic commerce (all US cardholders enabled 2025, global launch early 2026); about 40% of Mastercard transactions tokenized; about 130 crypto co brand card programs; Threat Intelligence product combining Recorded Future; Commerce Media network launched. |
| 10-K FY2025, MD&A | Net revenue $32.79bn (+16%, +15% currency neutral, 1 ppt from 2024 acquisitions); payment network $19.48bn (+12%); VAS $13.32bn (+23%, +21% currency neutral, 3 ppt from acquisitions); rebates and incentives $20.52bn (+16%); adjusted operating margin 59.2%; adjusted EPS $17.01 (+17%). |
| 10-K FY2025, revenue note | Remaining performance obligations for VAS $2.0bn at Dec 31 2025, recognized through 2030; customer and merchant incentive assets $10.4bn (current $2.53bn, non current $7.87bn). |
8 Peer Valuation & Sector Summary
- Sector: card networks and digital payments. Mastercard TTM net revenue $36.3bn, +14.6% in 9M 2026, against Visa FY2026 $45.9bn (+14.8%), American Express $77.6bn (+10.1%) and PayPal $34.3bn (+4.6%).
- Latest quarter: Mastercard Q3 2026 net revenue +14.0% against Visa +13.2% in Q4 FY2026 (Sep 2026 quarter).
- Operating margin: V 61.2%, MA 58.6%, PYPL 17.0%; net margin V 51.2%, MA 46.7%, PYPL 13.5%.
- Valuation: MA 33.4x P/E and $555.8bn market value against V 33.6x and $773.3bn, PYPL 10.2x and $47.2bn; AXP market value $214.2bn. MA EV/Sales 15.7x against V 17.0x.
| Company | Revenue TTM ($bn) | Revenue growth (%) | Operating margin (%) | Net margin (%) | FCF margin (%) | ROE (%) | Net cash ($bn) | Market value ($bn) | EV/Sales (x) | P/E TTM (x) |
|---|---|---|---|---|---|---|---|---|---|---|
| MA | 36.3 | 14.6 | 58.6 | 46.7 | 42.5 | 231.0 | (13.5) | 556 | 15.7 | 33.4 |
| V | 45.9 | 14.8 | 61.2 | 51.2 | 48.1 | 63.5 | (7.9) | 773 | 17.0 | 33.6 |
| AXP | 77.6 | 10.1 | n/a | n/a | n/a | n/a | n/a | 214 | n/a | n/a |
| PYPL | 34.3 | 4.6 | 17.0 | 13.5 | n/a | 23.8 | n/a | 47 | n/a | 10.2 |

9 Material Events & Contracts
- 11 Forms 8-K from 31 Oct 2025 to 31 Oct 2026: three quarterly results releases (Q4 2025, Q1 and Q2 2026) plus the Q3 2026 release, the interchange settlement of 10 Nov 2025, the $8bn revolving credit facility, three officer and pay notices, the $5.0bn notes offering and the annual meeting results.
- US interchange settlement (Ex 99.1, 10 Nov 2025): with Visa; average US effective credit interchange at least 10 basis points lower for five years; standard consumer credit posted rates capped at 125 basis points; merchants may accept debit, commercial credit, standard and premium consumer credit separately; surcharges capped at the lesser of 3% or the cost of acceptance. Preliminary approval in Jun 2026; final approval hearing in Nov 2026.
- Leadership (Ex 99.1, 2 Jun 2026): from 3 Aug 2026 Ling Hai, previously President Asia Pacific, Europe, Middle East and Africa, became CFO; Sachin Mehra became Chief Business Officer; Linda Kirkpatrick Chief Services Officer; Chris Mullett Corporate Controller.
- BVNK (closed 3 Aug 2026): stablecoin infrastructure provider bought for $1.4bn cash plus up to $300m contingent consideration; goodwill $1.27bn; disclosed in the Q3 2026 Form 10-Q and release, without a separate Form 8-K.
| Date | Items | Event |
|---|---|---|
| 10 Nov 2025 | 8.01, 9.01 | Updated class settlement with US merchant Rules Relief Class (with Visa); merchants may accept consumer credit and commercial credit separately and choose standard vs premium credit; simplified surcharging rules; 10 basis point cut in average US systemwide effective credit interchange rate, designed as a cap for five years; subject to court approval, expected late 2026 or early 2027. |
| 12 Nov 2025 | 1.01 | Entered amended and restated $8bn five year unsecured revolving credit facility (Citibank, JPMorgan agents) expiring Nov 7 2030, replacing facility due Nov 2029. |
| 29 Jan 2026 | 2.02, 9.01 | Q4 2025 results: net revenue $8.81bn (+18%, +15% currency neutral), net income $4.06bn, diluted EPS $4.52 (adjusted $4.76); FY2025 net revenue $32.79bn (+16%), net income $14.97bn, diluted EPS $16.52 (adjusted $17.01); FY2025 GDV $10.6tn (+9% local), cross border +15%, switched transactions +10%. |
| 5 Feb 2026 | 5.02 | Compensation committee raised base salaries effective Mar 1 2026: CFO Sachin Mehra to $875,000 (target bonus 175% of salary), Chief Services Officer Craig Vosburg to $825,000 (150%). |
| 30 Apr 2026 | 2.02, 9.01 | Q1 2026 results: net revenue $8.40bn (+16%, +12% currency neutral), operating income $4.91bn, net income $3.88bn, diluted EPS $4.35 (adjusted $4.60); includes $202m restructuring charge; GDV +7% local, cross border +13%, switched transactions +9%. |
| 7 May 2026 | 5.02, 9.01 | Corporate Controller Sandra Arkell to become Chief Audit Executive; Chris Mullett (CFO Europe) named Corporate Controller and principal accounting officer, effective Aug 3 2026. |
| 2 Jun 2026 | 5.02, 9.01 | Leadership changes effective Aug 3 2026: CFO Sachin Mehra becomes Chief Business Officer; Ling Hai (President APEMEA) named CFO (salary $850,000); Craig Vosburg becomes Vice Chair; Linda Kirkpatrick becomes Chief Services Officer; Vice Chair Timothy Murphy to retire Oct 2026. |
| 8 Jun 2026 | 8.01, 9.01 | Completed $5.0bn notes offering: $500m floating rate 2028, $1.25bn 4.325% 2028, $1.15bn 4.425% 2029, $1.35bn 4.600% 2031, $750m 5.000% 2036. |
| 17 Jun 2026 | 5.07 | Annual meeting Jun 16 2026: all 11 directors elected (lowest support Julius Genachowski 660.1m for, 79.7m against); say on pay approved 701.0m for vs 38.0m against; PwC ratified; shareholder proposals on written consent (219.8m for) and cumulative voting (22.9m for) rejected. |
| 30 Jul 2026 | 2.02, 9.01 | Q2 2026 results: net revenue $9.28bn (+14%, +12% currency neutral), operating income $5.59bn (60.2% margin), net income $4.39bn, diluted EPS $4.97 (adjusted $5.04); GDV +8% local, cross border +12%, switched transactions +9%. |
| 29 Oct 2026 | 2.02, 9.01 | Q3 2026 results: net revenue $9.81bn (+14%), payment network $5.75bn (+11%), VAS $4.06bn (+19%); operating income $5.86bn (59.8% margin); net income $4.63bn; diluted EPS $5.28 (adjusted $5.31); GDV $2.95tn (+7% local), cross border +11%, switched transactions +9%; 3.8bn Mastercard and Maestro cards; Q3 buybacks 5.3m shares for $3.0bn, dividends $763m; $4.9bn authorization left at Oct 26. |
| Contract | Terms |
|---|---|
| Rules Relief Class settlement (Ex 99.1, 10 Nov 2025) | With Visa; credit interchange cut of at least 10 bps for five years; posted credit rates capped at 31 Mar 2025 levels; honor all cards rules split by category; surcharging allowed; subject to final court approval. |
| US merchant litigation (MDL 1720) | Accrued liability $156m at 30 Sep 2026 against $637m at 31 Dec 2025; Block and Intuit opt out claims seek more than $5bn of single damages; new putative classes filed Apr and Sep 2026. |
| Senior notes (Ex 1.1, 4.1, 5.1, Jun 2026) | $5.0bn: $500m floating rate 2028 (SOFR plus 0.39%), $1.25bn 4.325% 2028, $1.15bn 4.425% 2029, $1.35bn 4.600% 2031, $750m 5.000% 2036; make whole and par calls. |
| Revolving credit facility (Item 1.01, 12 Nov 2025) | $8bn unsecured, expiring 7 Nov 2030, replacing the facility due Nov 2029; undrawn at 30 Sep 2026; supports the commercial paper program. |
| BVNK acquisition (3 Aug 2026) | $1.4bn cash plus up to $300m contingent; goodwill $1.27bn, developed technologies $238m, customer relationships $125m. |
| Executive pay (Item 5.02, Feb and Jun 2026) | CFO Ling Hai salary $850,000, bonus target 150% of salary, $1.5m RSU award; former CFO Sachin Mehra salary raised to $875,000 from Mar 2026. |
10 Ownership, Voting Power & Annual Meeting
- Class A holds all votes, one per share: 864.7m class A shares and 6.5m non voting, convertible class B shares at 26 Oct 2026. No controlling holder.
- Largest filers: Mastercard Foundation 65.2m class A shares (7.4%) at 31 Mar 2026, down from 84.8m (9.3%) at Dec 2024 after its sale restriction ended on 1 Jan 2024; Vanguard Capital Management 60.4m (6.82%).
- 2026 annual meeting (16 Jun 2026): 785.4m class A shares represented; all 11 directors elected, with votes for from 660.1m (Julius Genachowski) to 738.7m (Youngme Moon); say on pay 701.0m for and 38.0m against; PwC ratified; written consent and cumulative voting proposals rejected.
- Insiders, 12 months to Oct 2026: no open market purchases; sales of at least $69.7m, under prearranged trading plans and mostly linked to option exercises. CEO Michael Miebach sold about 48,600 shares for about $27.9m from 31 Jul to 5 Aug 2026; CFO Ling Hai sold 4,317 shares at $620 on 16 Oct 2026.
| Proposal | For (bn votes) | Against (bn votes) | Abstain (bn votes) | For as % of votes cast | Result |
|---|---|---|---|---|---|
| Elect Merit E. Janow, Chair | 0.695 | 0.044 | 0.001 | 94.0 | Elected |
| Elect Michael Miebach, CEO | 0.736 | 0.004 | 0.001 | 99.4 | Elected |
| Advisory vote on executive compensation | 0.701 | 0.038 | 0.002 | 94.9 | Approved |
| Ratify PricewaterhouseCoopers LLP for 2026 | 0.726 | 0.059 | 0.001 | 92.5 | Approved |
| Shareholder: right to act by written consent | 0.220 | 0.510 | 0.012 | 30.1 | Rejected |
| Shareholder: cumulative voting | 0.023 | 0.715 | 0.003 | 3.1 | Rejected |
2026 annual meeting remarks
- CEO Michael Miebach on 2025: gross dollar volume +9% and cross border volume +15% in local currency, more than 175bn transactions; commercial credit and debit 13% of gross dollar volume, +11%.
- Strategy: three priorities unchanged: core payments, commercial and new payment flows, and value added services; the CEO described BVNK as an on and off ramp between crypto and fiat.
- Q&A: on agentic commerce and stablecoins the CEO said card credentials will remain the main way to pay merchants in person.
| Holder | Shares (m) | Class A (%) | As of |
|---|---|---|---|
| Mastercard Foundation | 65.2 | 7.40 | 31 Mar 2026 |
| Vanguard Capital Management | 60.4 | 6.82 | 31 Mar 2026 |
11 Risk Factors
- Item 1A of the FY2025 Form 10-K holds 32 risk factors, as in FY2024 (12,112 words against 11,892): 0 added, 0 removed, 1 materially reworded and 31 counted unchanged; 12 unchanged factors add facts.
- The three Forms 10-Q of 2026 add no risk factor text; the BVNK acquisition of Aug 2026 has no risk factor update.
| Risk | Disclosure and change |
|---|---|
| US merchant litigation | Block and Intuit opt out claims seek more than $5bn of single damages; MDL accrual $156m at 30 Sep 2026; litigation provisions $504m in FY2025 and $156m in 9M 2026. |
| Interchange settlement and regulation | Rules Relief settlement cuts US credit interchange at least 10 bps for five years; the FY2025 litigation factor adds settlements as a source of business limits; regulation factor adds caps on issuer interest rates. |
| UK and European claims | UK and pan European merchant claims above GBP 0.5bn; UK commercial card action above GBP 1bn; two new UK consumer claims of about GBP 1.5bn and GBP 0.4bn filed Oct 2026; Portugal and Netherlands actions about EUR 0.4bn and EUR 0.3bn. |
| Rebates and incentives | Rebates and incentives +20.9% in 9M 2026 against payment network net revenue +10.9%; critical audit matter on rebate estimates; customer and merchant incentive assets $10.4bn at 31 Dec 2025. |
| Local networks and real time payments | Jurisdictions favoring local payment networks named in the FY2025 factors; Australia ACCC debit case liability hearing concluded Jun 2026. |
| Settlement exposure (reworded) | Brazil now requires scheme operators incl. Mastercard to extend responsibility for settlement integrity to merchants; other jurisdictions may follow; risk extended to financial condition. |
| AI, data and digital assets | FY2025 factors add AI in agentic commerce as regulatory uncertainty, AI driven threat actors and digital assets in place of cryptocurrency; AI named 24 times against 20. |
| Trade policy and tax | New bullet on tariffs and trade policy; 15% global minimum tax lifted the FY2025 effective tax rate to 19.4% from 15.6%. |
How risk factors changed
- Comparison: 10-K FY2025 filed 11 Feb 2026 acc 0001141391-26-000013 against 10-K FY2024 filed 12 Feb 2025 acc 0001141391-25-000011.
- All 32 risk factor headings carry over word for word from the FY2024 10-K; none were added or removed, and total length rose 1.9% to about 12,100 words.
- AI is named 24 times in the FY2025 Item 1A against 20 a year earlier, across 3 factors in both years; agentic commerce and digital assets appear for the first time.
- New external events written into existing factors: Brazil's rule extending scheme responsibility for settlement to merchants, the Rules Relief Class settlement, tariffs and trade policy, and caps on issuer interest rates.
- Recorded Future, acquired in 2024, is named in 3 factors against 2, including a new reference to its listing as an 'undesirable' or 'unreliable' entity by certain jurisdictions.
- The three Forms 10-Q filed in 2026 (Q1 to Q3) report no changes to the risk factors; the BVNK stablecoin acquisition of Aug 2026 has no risk factor update.

| Measure | 10-K FY2024 | 10-K FY2025 |
|---|---|---|
| Risk factors (count) | 32 | 32 |
| Words in Item 1A | 11,892 | 12,112 |
| Change | Risk factor | What changed |
|---|---|---|
| Reworded | Role as guarantor and settlement exposure | Adds that Brazil enacted regulation requiring payment scheme operators in Brazil, Mastercard and Visa included, to extend their responsibility for the financial and settlement integrity of payments to merchants, and that other jurisdictions may follow; the risk now covers financial condition as well as results of operations. |
| Filing | Change disclosed |
|---|---|
| 10-Q Q1 2026 filed 30 Apr 2026 | No new or updated risk factors; Part II Item 1A refers to Item 1A of the 2025 Form 10-K. |
| 10-Q Q2 2026 filed 30 Jul 2026 | No new or updated risk factors; Part II Item 1A refers to Item 1A of the 10-K for the year ended 31 Dec 2025. |
| 10-Q Q3 2026 filed 29 Oct 2026 | No new or updated risk factors; Part II Item 1A refers to Item 1A of the 10-K for the year ended 31 Dec 2025. |
12 Stock Price, Scenarios & Sensitivity
- MA closed at $638.02 on 30 Oct 2026, 1.0% below the 52 week high of $644.20 and 37.6% above the low of $463.80.
- Valuation: 33.4x TTM diluted EPS of $19.11; market value $555.8bn on 871.2m class A and B shares; EV/Sales 15.7x; free cash flow yield 2.8%; dividend yield 0.55% on the $0.87 quarterly dividend. Visa trades at 33.6x TTM diluted EPS ($12.32, FY2026 to Sep 2026).
- Scenario model: net revenue grows from TTM Q3 2026 $36.29bn for three years; operating margin as stated (adjusted basis, no litigation provision); other expense $460m a year (Q4 2026 guidance of about $115m a quarter); 20.5% tax rate; price equals TTM Q3 2029 EPS times exit P/E.

Critical factors and core assumptions
| Factor | Current value | Best case requires | Evidence in filings and calls |
|---|---|---|---|
| Value added services growth | +19% Q3 2026; $13.32bn FY2025 (40.6% of revenue) | Sustain 18% to 20% growth through 2029 | FY2025 +23%, 9M 2026 +20%; about 60% network linked (Q3 2026 call) |
| Cross border volume growth | +11% local Q3 2026 | Stabilize at 12% to 15% | FY2025 +15%; cross border assessments +16% in Q3 2026 |
| Rebates and incentives growth vs gross assessments | +18% Q3 2026, +21% 9M 2026 | Grow in line with assessments (about 15%) after 2027 renewals | FY2025 $20.5bn (+16%); CFO expects higher Q4 ratio |
| Adjusted operating margin | 60.5% Q3 2026; 59.2% FY2025 | 62% by FY2029 | 9M 2026 adjusted margin 60.8% (+1.1 points) |
| Litigation and regulation | 9M 2026 provisions $156m; US MDL accrual $156m | Rules Relief settlement approved Nov 2026; Block and Intuit and UK claims resolved below $1bn | Open claims: Block and Intuit above $5bn single damages; UK claims about GBP 3.4bn combined |
| Share count reduction | Diluted shares 876m Q3 2026, 3% fewer than a year earlier | Continue 2% to 3% annual reduction | $11.9bn buybacks in 9M 2026; $14bn program approved Dec 2025 |
- Revenue base TTM Q3 2026 $36.29bn; GAAP operating margin 58.6%; adjusted 60.8% in 9M 2026.
- Best case: 14% revenue CAGR, 62% operating margin, 35x P/E, share count 8% lower; value added services near 20% growth and cross border at 12% to 15%.
- Base case: 12% revenue CAGR, 60% margin, 30x P/E, share count 6% lower; growth in line with the low double digit pattern of the 2026 outlook.
- Worst case: 7% revenue CAGR, 55% margin, 22x P/E, share count 3% lower; cross border in high single digits, faster incentive growth in the 2027 renewals and litigation charges.
- Core assumptions: gross dollar volume +7% to +9% and switched transactions +9% to +10% a year in local currency; tax rate 20.5% (adjusted guidance 20% to 21%); capex about 4% of revenue.
Scenarios, three years forward
| Measure | Worst case | Base case | Best case |
|---|---|---|---|
| Revenue CAGR, 3 years (%) | 7.0 | 12.0 | 14.0 |
| Revenue, TTM Q3 2029 ($bn) | 44.5 | 51.0 | 53.8 |
| Operating margin, TTM Q3 2029 (%) | 55.0 | 60.0 | 62.0 |
| Net income, TTM Q3 2029 ($bn) | 19.1 | 24.0 | 26.1 |
| EPS, TTM Q3 2029 ($) | 22.57 | 29.25 | 32.61 |
| Exit P/E (x) | 22.0 | 30.0 | 35.0 |
| Implied price ($) | 497 | 877 | 1,141 |
| Change against $638.02 (%) | (22) | 38 | 79 |
| Implied annual return (%) | (8.0) | 11.2 | 21.4 |

Sensitivity analysis
| Revenue CAGR \ Operating margin | 55% | 57% | 60% | 61% | 62% |
|---|---|---|---|---|---|
| 7% | $699 | $725 | $763 | $776 | $789 |
| 9% | $739 | $767 | $808 | $821 | $835 |
| 12% | $803 | $833 | $877 | $892 | $907 |
| 13% | $825 | $856 | $902 | $917 | $932 |
| 14% | $848 | $879 | $926 | $942 | $957 |
| Exit P/E \ Operating margin | 55% | 57% | 60% | 61% | 62% |
|---|---|---|---|---|---|
| 22x | $589 | $611 | $643 | $654 | $665 |
| 26x | $696 | $722 | $760 | $773 | $786 |
| 30x | $803 | $833 | $877 | $892 | $907 |
| 32x | $857 | $888 | $936 | $952 | $968 |
| 35x | $937 | $972 | $1,024 | $1,041 | $1,058 |
Disclaimer
This analysis is for information only and is not financial advice. It is derived from public SEC filings retrieved via sec-api.io and is not a publication of the U.S. Securities and Exchange Commission. Scenario values are model outputs under stated assumptions and are not forecasts. Data as of 30 October 2026.
Sources
All company figures are read from SEC filings retrieved through the sec-api.io MCP server. Call statements are taken from the Q4 2025 to Q3 2026 earnings calls held by the company; the annual meeting remarks from the company's meeting of 16 Jun 2026.
| Form | Period | Filed | Accession number |
|---|---|---|---|
| 10-Q | Q3 2026 | 29 Oct 2026 | 0001141391-26-000124 |
| 8-K Ex 99.1 | Q3 2026 | 29 Oct 2026 | 0001141391-26-000122 |
| 10-Q | Q2 2026 | 30 Jul 2026 | 0001141391-26-000083 |
| 8-K Ex 99.1 | Q2 2026 | 30 Jul 2026 | 0001141391-26-000081 |
| 10-Q | Q1 2026 | 30 Apr 2026 | 0001141391-26-000031 |
| 8-K Ex 99.1 | Q1 2026 | 30 Apr 2026 | 0001141391-26-000029 |
| 10-K | FY2025 | 11 Feb 2026 | 0001141391-26-000013 |
| 8-K Ex 99.1 | Q4 2025 | 29 Jan 2026 | 0001141391-26-000003 |
| 10-Q | Q3 2025 | 30 Oct 2025 | 0001141391-25-000193 |
| 10-Q | Q2 2025 | 31 Jul 2025 | 0001141391-25-000172 |
| 10-K | FY2024 | 12 Feb 2025 | 0001141391-25-000011 |
| 10-K | FY2023 | 13 Feb 2024 | 0001141391-24-000022 |
| 10-K | FY2022 | 14 Feb 2023 | 0001141391-23-000020 |
| DEF 14A | 2026 proxy | 27 Apr 2026 | 0001141391-26-000021 |
| Company | Form | Filed | Accession number |
|---|---|---|---|
| Mastercard | 8-K, items 8.01, 9.01 | 10 Nov 2025 | 0001141391-25-000197 |
| Mastercard | 8-K, items 1.01 | 12 Nov 2025 | 0001141391-25-000199 |
| Mastercard | 8-K, items 2.02, 9.01 | 29 Jan 2026 | 0001141391-26-000003 |
| Mastercard | 8-K, items 5.02 | 5 Feb 2026 | 0001141391-26-000006 |
| Mastercard | 8-K, items 2.02, 9.01 | 30 Apr 2026 | 0001141391-26-000029 |
| Mastercard | 8-K, items 5.02, 9.01 | 7 May 2026 | 0001141391-26-000034 |
| Mastercard | 8-K, items 5.02, 9.01 | 2 Jun 2026 | 0001141391-26-000037 |
| Mastercard | 8-K, items 8.01, 9.01 | 8 Jun 2026 | 0001193125-26-261669 |
| Mastercard | 8-K, items 5.07 | 17 Jun 2026 | 0001141391-26-000041 |
| Mastercard | 8-K, items 2.02, 9.01 | 30 Jul 2026 | 0001141391-26-000081 |
| Mastercard | 8-K, items 2.02, 9.01 | 29 Oct 2026 | 0001141391-26-000122 |
| Visa | 8-K Ex 99.1 Q4 FY2026 | 27 Oct 2026 | 0001403161-26-000126 |
| Visa | 10-Q Q3 FY2026 | 28 Jul 2026 | 0001403161-26-000104 |
| Visa | 10-K FY2025 | Nov 2025 | 0001403161-25-000089 |
| PayPal | 10-Q Q3 2026 | Oct 2026 | 0001633917-26-000088 |
| American Express | 10-Q Q3 2026 | Oct 2026 | 0000004962-26-000409 |
| American Express | 8-K Ex 99.1 Q3 2026 | 23 Oct 2026 | 0000004962-26-000405 |
| PayPal | 8-K Ex 99.1 Q3 2026 | 27 Oct 2026 | 0001633917-26-000086 |
| Block | 8-K Ex 99.1 Q2 2026 | 5 Aug 2026 | 0001193125-26-335117 |
| Fiserv | 8-K Ex 99.1 Q2 2026 | 6 Aug 2026 | 0000798354-26-000028 |
| Western Union | 8-K Ex 99.1 Q2 2026 | 30 Jul 2026 | 0001193125-26-326110 |
| Remitly | 8-K Ex 99.1 Q2 2026 | 5 Aug 2026 | 0001628280-26-053361 |
| Coinbase | 8-K Ex 99.1 Q3 2026 | 29 Oct 2026 | 0001679788-26-000121 |
| Circle | 8-K Ex 99.1 Q2 2026 | 5 Aug 2026 | 0001876042-26-000246 |
| Filed | Exhibit | Document | Content |
|---|---|---|---|
| 10 Nov 2025 | Ex 99.1 | Superseding and amended Rule 23(b)(2) class settlement agreement, US interchange MDL 1720 (with Visa) | Mastercard and Visa agree to cut the systemwide volume weighted average effective interchange rate on US consumer and commercial credit transactions by at least 10 basis points; the limit runs for five years after it starts; Posted credit interchange rates capped at March 31, 2025 levels (Appendix K) for the five year period; standard consumer credit posted rates reduced to and capped at 125 basis points |
| 12 Nov 2025 | Form 8-K, Item 1.01 text | Amended and restated $8bn five year revolving credit facility | $8bn committed unsecured revolver entered November 7, 2025, expiring November 7, 2030; replaces prior $8bn facility due November 7, 2029; Citibank managing administrative agent, JPMorgan administrative agent; borrowings in US dollars or euros at SOFR, euro short term rate or base rate plus rating linked margins |
| 29 Jan 2026 | Ex 99.1 | Q4 and full year 2025 earnings release with operating performance tables | Q4 2025 net revenue $8.8bn, up 18% (15% currency neutral); net income $4.1bn; diluted EPS $4.52; adjusted EPS $4.76, up 25%; Full year 2025 net revenue $32.8bn, up 16%; net income $15.0bn; diluted EPS $16.52; adjusted EPS $17.01, up 17% |
| 5 Feb 2026 | Form 8-K, Item 5.02 text | 2026 pay adjustments for named executive officers | CFO Sachin Mehra base salary raised to $875,000 from $825,000 effective March 1, 2026; target bonus raised to 175% of salary from 150%; Chief Services Officer Craig Vosburg salary raised to $825,000 from $800,000; target bonus raised to 150% from 135% |
| 30 Apr 2026 | Ex 99.1 | Q1 2026 earnings release with operating performance tables | Q1 2026 net revenue $8.4bn, up 16% (12% currency neutral); net income $3.9bn; diluted EPS $4.35; adjusted EPS $4.60, up 23%; GDV up 7% local currency to $2.7tn; cross border volume up 13%; switched transactions up 9%; payment network revenue up 12%; value added services and solutions up 22% (18% currency neutral) |
| 7 May 2026 | Form 8-K, Item 5.02 text | Corporate Controller succession | Corporate Controller and principal accounting officer Sandra Arkell to become Chief Audit Executive effective August 3, 2026; Chris Mullett, 52, CFO Europe since May 2023, appointed Corporate Controller and principal accounting officer from August 3, 2026 |
| 2 Jun 2026 | Ex 99.1 | Press release: leadership updates effective August 3, 2026 | Ling Hai, President Asia Pacific, Europe, Middle East and Africa, to succeed Sachin Mehra as CFO; base salary $850,000, bonus target 150% of salary, $1.5m RSU award (per 8-K); Sachin Mehra moves to newly created Chief Business Officer role covering country operations, sales enablement, global partnerships and digital commercialization |
| 8 Jun 2026 | Ex 1.1 | Underwriting agreement for $5.0bn senior notes offering (June 4, 2026) | Representatives: J.P. Morgan, Barclays, Crédit Agricole, Goldman Sachs, NatWest, Santander, U.S. Bancorp, Wells Fargo; Spreads to benchmark Treasury: 2028 fixed +28bp, 2029 +33bp, 2031 +43bp, 2036 +53bp; reoffer yields 4.329%, 4.432%, 4.618% and 5.005% |
| 8 Jun 2026 | Ex 4.1 | Officer's certificate setting terms of five note series (forms of notes 4.2 to 4.6 incorporated) | $500m floating rate notes due June 8, 2028 at compounded SOFR plus 0.39%; $1.25bn 4.325% notes due 2028; $1.15bn 4.425% notes due 2029; $1.35bn 4.600% notes due 2031; $750m 5.000% notes due 2036; total $5.0bn |
| 8 Jun 2026 | Ex 5.1 | Legal opinion of Davis Polk & Wardwell on validity of the notes | Opinion that the $5.0bn of notes, once executed, authenticated and paid for, are valid and binding obligations of Mastercard under New York and Delaware law |
| 17 Jun 2026 | Form 8-K, Item 5.07 text | 2026 annual meeting vote results (meeting held June 16, 2026) | 785.4m Class A shares present or represented; all 11 director nominees elected, with votes for ranging from 660.1m (Julius Genachowski) to 738.7m (Youngme Moon); Say on pay approved: 701.0m for, 38.0m against |
| 30 Jul 2026 | Ex 99.1 | Q2 2026 earnings release with operating performance tables | Q2 2026 net revenue $9.3bn, up 14% (12% currency neutral); net income $4.4bn; diluted EPS $4.97; adjusted EPS $5.04, up 21%; GDV up 8% local currency to $2.9tn; cross border volume up 12%; switched transactions up 9%; payment network revenue up 10%; value added services and solutions up 20% (18% currency neutral) |
| 29 Oct 2026 | Ex 99.1 | Q3 2026 earnings release with operating performance tables | Q3 2026 net revenue $9.8bn, up 14% as reported and currency neutral; net income $4.6bn; diluted EPS $5.28; adjusted EPS $5.31, up 21%; GDV up 7% local currency to $3.0tn; purchase volume up 9%; cross border volume up 11%; switched transactions up 9%; payment network revenue up 11%; value added services and solutions up 19% |