Merck & Co., Inc. (MRK), Financial Analysis
Insights derived from analysing SEC filings. Independent analysis, not a publication of the SEC.
- Q3 2026 sales $18.09bn, +4.7%: US +6.0%, international +2.8%. About $550m came from US purchase timing ($200m Keytruda, $50m Winrevair, $300m vaccines), most of which management expects to reverse in Q4 2026 and 2027.
- Keytruda shifts to subcutaneous dosing before its US patent expires in Dec 2028. Keytruda family $8.60bn (+5.6%, 47.6% of sales); intravenous Keytruda (4.6%); subcutaneous Keytruda Qlex $830m, 9.7% of the family against 5.5% in Q2 2026. Medicare price setting for Keytruda is expected from 1 Jan 2029.
- Growth products against exclusivity losses. Winrevair $694m (+92.8%), Gardasil $2.00bn (+14.1%) on US public purchasing, Animal Health $1.68bn (+3.8%); Januvia and Janumet $380m (39.2%) and Bridion $144m (67.2%) after US generic entry.
- Acquisitions reset 2026 earnings. Cidara ($9.0bn), Terns ($5.7bn) and SciBrunch ($0.4bn) were charged to R&D: TTM operating margin 8.1% against 30.5% excluding the charges; 9M 2026 GAAP EPS ($0.21) against $6.08.
- Debt funds the deals. Debt $53.9bn at 30 Jun 2026 against $37.1bn at end 2024 after $8.0bn (Dec 2025) and $6.0bn (May 2026) of notes; 9M 2026 interest expense $1.55bn, +63.8%. Free cash flow TTM Q2 2026 $16.1bn covered dividends of $8.3bn and buybacks of $4.2bn.
- Sales guidance rose at each of three 2026 revisions, from $65.5bn to $67.0bn (3 Feb) to $66.8bn to $67.3bn (29 Oct); non GAAP EPS guidance moved from $5.00 to $5.15 to $2.77 to $2.82 after the Terns and SciBrunch charges. Shares at $149.49 trade at 16.9x the EPS midpoint excluding charges; base case $108 in FY2029, range $50 to $163.
Figures are read from the Forms 10-K for FY2021 to FY2025, the Forms 10-Q for Q3 2025, Q1 2026 and Q2 2026, the Forms 8-K with all their exhibits, incl. the quarterly earnings releases and supplemental tables (Ex 99.1, 99.2), the officers' certificates and legal opinions for the Dec 2025 and May 2026 notes (Ex 4.1 to 4.8, 5.1) and the board release of Oct 2026, the CFO commentary on the earnings calls, the proxy statement of 2026 with the Form 8-K Item 5.07 vote results, and Forms 4 for central index key 310158, together with the filings of 13 peer companies used in chapters 2 to 5 and 8. The Q3 2026 Form 10-Q had not been filed by 31 Oct 2026, so Q3 2026 cash flow and the 30 Sep 2026 balance sheet are not available: the latest balance sheet is 30 Jun 2026 and trailing cash flow runs to Q2 2026. Accession numbers appear in the Sources appendix. Market prices are the last trades of 30 Oct 2026.
1 Revenue & Business Model
- Storyline: Merck funds its move away from one product with debt and acquisitions. Keytruda earned 48.7% of FY2025 sales and loses US compound patent protection in Dec 2028; Merck agreed $26.5bn of acquisitions (Verona, Cidara, Terns) between Oct 2025 and May 2026. Chapters 2 to 5 cover the four revenue drivers: Keytruda and oncology, vaccines, cardiopulmonary and Animal Health.
- Two segments: Pharmaceutical (human health incl. vaccines) $58.1bn in FY2025, 89.4% of sales, segment profit 78.7% of segment sales before R&D, which Merck books at corporate level; Animal Health $6.4bn (9.8%), segment profit margin 33.5% after its own R&D.
- Sales FY2021 $48.7bn to FY2025 $65.0bn, a 7.5% CAGR; TTM Q3 2026 $67.4bn, +4.9%.
- Regions: United States 56.2% of FY2025 sales against 47.4% in FY2023; China fell from $6.80bn (FY2023) to $1.94bn (FY2025) after Gardasil shipments to China stopped in Feb 2025. In Q3 2026 the US was 58.7% of sales.
- Pricing exposure: Medicare negotiated prices apply to Januvia from 2026, Janumet from 2027 and Lenvima from 2028; Merck expects Keytruda selection in 2027 with prices from 1 Jan 2029, and signed a three year most favoured nation pricing agreement with the US government in Dec 2025.


| Product | Q3 2025 | Q4 2025 | Q1 2026 | Q2 2026 | Q3 2026 |
|---|---|---|---|---|---|
| Keytruda (intravenous) | 8,142 | 8,337 | 7,906 | 7,904 | 7,771 |
| Keytruda Qlex (subcutaneous) | 5 | 35 | 128 | 463 | 830 |
| Gardasil/Gardasil 9 | 1,749 | 1,031 | 1,069 | 1,169 | 1,995 |
| ProQuad, MMR II, Varivax | 684 | 619 | 538 | 592 | 730 |
| Winrevair | 360 | 467 | 525 | 588 | 694 |
| Welireg | 196 | 220 | 199 | 271 | 307 |
| Capvaxive | 244 | 279 | 142 | 184 | 263 |
| Vaxneuvance | 226 | 140 | 202 | 148 | 195 |
| Prevymis | 266 | 275 | 272 | 295 | 347 |
| Ohtuvayre | 0 | 178 | 131 | 204 | 184 |
| Enflonsia | 79 | 21 | 1 | 2 | 187 |
| Lynparza (alliance revenue) | 379 | 389 | 341 | 365 | 352 |
| Lenvima (alliance revenue) | 258 | 272 | 256 | 283 | 287 |
| Reblozyl (alliance revenue) | 136 | 164 | 148 | 122 | 177 |
| Bridion | 439 | 499 | 472 | 497 | 144 |
| Januvia | 382 | 302 | 367 | 258 | 186 |
| Janumet | 243 | 199 | 207 | 171 | 194 |
| Lagevrio | 138 | 57 | 28 | 5 | 17 |
| Livestock (Animal Health) | 1,023 | 987 | 1,064 | 1,041 | 1,048 |
| Companion Animal (Animal Health) | 592 | 518 | 727 | 734 | 628 |
| Total sales | 17,276 | 16,400 | 16,286 | 16,607 | 18,085 |
| Region | FY2023 | FY2024 | FY2025 | FY2025 share (%) |
|---|---|---|---|---|
| United States | 28.5 | 32.3 | 36.5 | 56.2 |
| Europe, Middle East and Africa | 13.3 | 14.0 | 14.6 | 22.4 |
| China | 6.8 | 5.5 | 1.9 | 3.0 |
| Japan | 3.2 | 3.3 | 2.7 | 4.2 |
| Asia Pacific (other than China and Japan) | 3.2 | 3.1 | 3.0 | 4.6 |
| Latin America | 3.1 | 3.5 | 3.4 | 5.2 |
| Other | 2.1 | 2.6 | 2.9 | 4.4 |
| Region | Q3 2025 | Q4 2025 | Q1 2026 | Q2 2026 | Q3 2026 | Q3 growth (%) |
|---|---|---|---|---|---|---|
| United States | 9,493 | 8,662 | 8,512 | 8,827 | 10,119 | 6.6 |
| Europe | 2,675 | 2,839 | 2,725 | 2,801 | 2,837 | 6.1 |
| China | 377 | 364 | 353 | 368 | 429 | 13.8 |
| Japan | 693 | 684 | 535 | 558 | 569 | (17.9) |
| Latin America | 691 | 644 | 624 | 636 | 730 | 5.6 |
| Asia Pacific excl. China and Japan | 593 | 586 | 569 | 636 | 596 | 0.5 |
| Eastern Europe, Middle East and Africa | 365 | 348 | 413 | 408 | 399 | 9.3 |
| Canada | 134 | 153 | 137 | 154 | 152 | 13.4 |
| Other | 590 | 563 | 481 | 372 | 437 | (25.9) |
2 Keytruda & Oncology: Subcutaneous Switch Before the 2028 Patent Expiry
- Keytruda family $8.60bn in Q3 2026, +5.6%, 47.6% of sales; 9M 2026 $25.00bn, +7.3%; FY2025 $31.68bn, 48.7% of sales. About $200m of Q3 sales came from US purchase timing that reverses in Q4.
- Intravenous Keytruda $7.77bn, (4.6%), with US intravenous sales $4.5bn, (7%), as US patients moved to Keytruda Qlex at $693m. Qlex was 9.7% of the family in Q3 2026 against 1.6% in Q1 2026 and 5.5% in Q2 2026.
- Other oncology: Welireg $307m, +56.6%; Lynparza alliance $352m, (7.1%); Lenvima alliance $287m, +11.2%; Reblozyl alliance $177m, +30.1%.
- Pipeline: sac TMT cut the risk of death by 32% against chemotherapy in endometrial cancer (FDA action date 15 Jun 2027); intismeran with Keytruda cut the risk of melanoma recurrence or death by 42%; Terns ($6.8bn, May 2026) adds an oral CML drug.
How the PD1 market is changing
- Patents and prices: the key Keytruda US patent expires in 2028 (EU 2031, Japan 2032 to 2033, China 2028); Medicare price setting is expected from 1 Jan 2029, and a CMS proposed rule may cover Keytruda Qlex at the same time. A Keytruda biosimilar launched in Argentina in 2025.
- Subcutaneous dosing: BMS sold $334m of subcutaneous Opdivo Qvantig in Q3 2026, +398.5%, while intravenous Opdivo fell 6.2% and US Opdivo 8%. Merck's Keytruda Qlex reached $830m in the same quarter; its US patent runs to 2031.
- PD1/VEGF bispecific antibodies: Summit reported in Sep 2026 that ivonescimab showed an overall survival benefit against pembrolizumab in PD L1 positive lung cancer in a China study; AstraZeneca stopped a Phase 3 study of volrustomig for futility; fianlimab plus Libtayo missed against pembrolizumab in melanoma.

| Company and product | Period | Sales | Growth (%) | Filed detail |
|---|---|---|---|---|
| Merck Keytruda family | Q3 2026 | 8,601 | 5.6 | Qlex $830m, 9.7% of family |
| Merck Keytruda (intravenous) | Q3 2026 | 7,771 | (4.6) | US intravenous $4.5bn, (7%) |
| BMS Opdivo (intravenous) | Q3 2026 | 2,374 | (6.2) | US Opdivo (8%) as patients move to Qvantig |
| BMS Opdivo Qvantig (subcutaneous) | Q3 2026 | 334 | 398.5 | 9M $758m against Keytruda Qlex 9M $1.42bn |
| BMS Opdualag | Q3 2026 | 367 | 22.7 | Yervoy $793m, +7% |
| Regeneron Libtayo | Q3 2026 | 550 | 50.6 | fianlimab plus Libtayo missed significance against pembrolizumab in melanoma |
| Eli Lilly Verzenio | Q3 2026 | 1,511 | 2.8 | breast cancer; Verzenio US $897m |
| J&J oncology | quarter to 27 Sep 2026 | 7,602 | 16.4 | Darzalex $4.24bn, +15.4% |
| Pfizer Padcev | Q2 2026 | 667 | 23.1 | used with pembrolizumab in urothelial cancer |
3 Vaccines: Gardasil After China, in a Smaller US Market
- Gardasil $2.00bn in Q3 2026, +14.1%: US $1.37bn, +18.4%, incl. a CDC purchase and higher net prices; international $629m, +5.7%. 9M 2026 $4.23bn, +0.7%; FY2025 $5.23bn, (39%).
- China: Gardasil China sales were nil from Q2 2025 to Q1 2026, against $3.5bn across 2024; Merck pharmaceutical sales in China were $429m in Q3 2026, +13.8%, against $668m in Q1 2025. A revised Zhifei supply contract (Apr 2026) restarted limited shipments with immaterial 2026 revenue expected.
- Other vaccines, Q3 2026: ProQuad, MMR II and Varivax $730m, +6.7%; Capvaxive $263m, +7.8%, with US sales (13%); Vaxneuvance $195m, (13.7%); Enflonsia (RSV antibody) $187m against $79m. About $300m of Q3 vaccine sales came from purchase timing, most of which reverses in 2027.
- Royalties: 7% on US Gardasil sales until Dec 2028; the Vaxneuvance and Capvaxive royalty falls from 7.25% to 2.5% in 2027.
How the vaccine market is changing
- US policy: in Jan 2026 the acting CDC director cut the routine child and adolescent schedule and reduced HPV vaccination to a single dose; a district court stayed the changes on 16 Mar 2026 and the government appealed. Insurer association members cover vaccines recommended by ACIP as of 1 Sep 2025 without cost sharing through 2027.
- Demand: Merck states the US vaccines market has contracted; Pfizer reported US Prevnar sales (13%) in Q2 2026 on lower vaccination rates.
- Peers in Q3 2026: GSK vaccines (2%) at constant exchange rates, with Shingrix (5%) and Arexvy (24%); Sanofi vaccines (6.6%).

| Company and line | Period | Sales | Growth (%) | Filed detail |
|---|---|---|---|---|
| Merck Gardasil | Q3 2026 | $2.00bn | 14.1 | US $1.37bn +18.4%; international $629m +5.7% |
| Merck Capvaxive | Q3 2026 | $263m | 7.8 | US sales (13%) |
| Merck Vaxneuvance | Q3 2026 | $195m | (13.7) | royalty falls from 7.25% to 2.5% in 2027 |
| GSK vaccines | Q3 2026 | GBP 2.6bn | (2.0) | Shingrix (5%), Arexvy (24%), meningitis +12%; CER |
| Sanofi vaccines | Q3 2026 | EUR 3.2bn | (6.6) | phasing of respiratory prevention; CER |
| Pfizer Prevnar family | Q2 2026 | $1.34bn | (3.3) | US (13%) on lower vaccination rates; international +13% |
| Pfizer Abrysvo (RSV) | Q2 2026 | $208m | 45.5 | international launches; US (46%) |
| Pfizer Comirnaty | Q2 2026 | $261m | (31.5) | narrower US vaccination recommendation |
4 Cardiopulmonary: Winrevair and New Launches Against Generic Losses
- Winrevair $694m in Q3 2026, +92.8%: US $610m, +82.1%; international $84m against $25m; 9M 2026 $1.81bn, +85.2%; about 1,600 new US patients in the quarter. Merck pays BMS a 22% royalty; US data exclusivity runs to 2036.
- New products: Ohtuvayre (COPD, from Verona) $184m in Q3 2026 and $519m in 9M 2026; Lipfendra, an oral PCSK9 inhibitor approved in Jul 2026, reached over 11,000 prescriptions from over 6,500 prescribers in Q3, with commercial coverage expected in 2027 and Medicare in 2028.
- Exclusivity losses: Januvia and Janumet $380m, (39.2%), with US Januvia $78m, (70%); Bridion $144m, (67.2%), with US $108m, (72%).
- Net effect: Winrevair and Ohtuvayre added $518m year on year in Q3 2026; Januvia, Janumet and Bridion lost $540m.
How the cardiopulmonary market is changing
- Older PAH oral drugs face generics: J&J Opsumit and Opsynvi fell 35.7% in the quarter to 27 Sep 2026 after US generic entry; Uptravi generics are possible in 2027. United Therapeutics revenue fell 1.9% in Q2 2026 and it has filed for oral ralinepag.
- Diabetes drugs lose exclusivity: Januvia and Janumet lost US exclusivity in May 2026; Medicare negotiated prices apply to Januvia from 2026 and Janumet from 2027.
- Lipids and COPD: Merck entered oral PCSK9 therapy with Lipfendra (Jul 2026) and COPD with Ohtuvayre (Verona, Oct 2025).

| Company and line | Period | Sales | Growth (%) | Filed detail |
|---|---|---|---|---|
| Merck Winrevair | Q3 2026 | 694 | 92.8 | US $610m, international $84m; 22% royalty to BMS |
| J&J pulmonary hypertension | quarter to 27 Sep 2026 | 897 | (19.5) | Opsumit and Opsynvi $372m (35.7%) after US generic entry |
| J&J Uptravi | quarter to 27 Sep 2026 | 483 | (0.1) | US and EU generics possible in 2027 |
| United Therapeutics | Q2 2026 | 783 | (1.9) | Tyvaso DPI $327m +4%; NDA for ralinepag submitted |
| Merck Januvia and Janumet | Q3 2026 | 380 | (39.2) | US exclusivity lost May 2026 |
| Merck Bridion | Q3 2026 | 144 | (67.2) | US exclusivity lost Jul 2026 |
5 Animal Health: Livestock Growth, Slower Companion Animal Market
- Animal Health $1.68bn in Q3 2026, +3.8%, 9.3% of sales: Livestock $1.05bn, +2.4%; Companion Animal $628m, +6.1%; Bravecto $264m, +0.8%. 9M 2026 $5.24bn, +8.1%.
- Segment profit: FY2025 $2.13bn, 33.5% of segment sales, after $448m of its own R&D; Q1 2026 $723m (40.4%), Q2 2026 $636m (35.8%). Q3 2026 segment profit is published with the 10-Q.
- Additions: TARGAN (poultry biodevices, about $650m, Jul 2026); FDA approved Numelvi for dogs in Q1 2026.
How the animal health market is changing
- Companion animals: Zoetis reported fewer clinic visits, price sensitivity among pet owners and more competition in Q2 2026, with US companion animal sales (11%), and cut FY2026 revenue guidance to $9.12bn to $9.32bn.
- Livestock: Zoetis US livestock +23% in Q2 2026; New World screwworm has been confirmed in the US. Elanco revenue +10.2% in Q2 2026, led by Zenrelia and Credelio Quattro, with FY2026 guidance raised to $5.09bn to $5.14bn.

| Company | Period | Revenue | Growth (%) | Detail |
|---|---|---|---|---|
| Merck Animal Health | Q3 2026 | 1,676 | 3.8 | Q3 2026 segment profit with the 10-Q |
| Merck Animal Health | Q2 2026 | 1,775 | 7.8 | segment profit margin 35.8% |
| Zoetis | Q2 2026 | 2,500 | 0.0 | net income $691m, (5%); FY2026 guidance $9.12bn to $9.32bn |
| Elanco | Q2 2026 | 1,368 | 10.2 | adjusted EBITDA $288m, 21.1% of revenue (company measure) |
6 Financial Analysis & Ratios
- Operating income (computed as sales less cost of sales, SG&A, R&D and restructuring) TTM $5.5bn, 8.1% of sales, against 32.6% in FY2025; excluding the $15.1bn of 2026 acquisition and licence charges the TTM margin is 30.5%. FY2023 shows the same pattern: 3.9% after $11.4bn of acquired IPR&D.
- Net income TTM $2.5bn, diluted EPS $0.97; the Cidara and Terns charges are not tax deductible, so the 9M 2026 GAAP tax rate was 138.2% and 9M GAAP EPS ($0.21).
- Cash flow (latest available, TTM Q2 2026): operating cash flow $20.0bn, capex $3.9bn, free cash flow $16.1bn (24.1% of TTM Q2 2026 sales). FY2025 free cash flow $12.4bn after $16.5bn of operating cash flow; acquisitions paid in cash: Verona $10.04bn (FY2025), Cidara $8.78bn and Terns $5.84bn (H1 2026).
- Balance sheet at 30 Jun 2026 (latest filed): debt $53.9bn, cash and short term investments $7.1bn, net debt $46.8bn; equity $41.9bn against $52.6bn at end 2025 after the R&D charges; goodwill $21.6bn and other intangibles $25.0bn.
- Capital returns: dividends $8.2bn and buybacks $5.1bn in FY2025; H1 2026 dividends $4.25bn and buybacks $1.63bn; about $3bn of buybacks planned for 2026.
| Line item | FY2021 | FY2022 | FY2023 | FY2024 | FY2025 | TTM Q3 2026 |
|---|---|---|---|---|---|---|
| Revenue | 48.7 | 59.3 | 60.1 | 64.2 | 65.0 | 67.4 |
| Gross profit | 35.1 | 41.9 | 44.0 | 49.0 | 48.6 | 48.3 |
| Research and development | 12.2 | 13.5 | 30.5 | 17.9 | 15.8 | 30.8 |
| Selling, general and administrative | 9.6 | 10.0 | 10.5 | 10.8 | 10.7 | 11.4 |
| Operating income | 12.5 | 17.9 | 2.4 | 19.9 | 21.2 | 5.5 |
| Net income | 12.3 | 14.5 | 0.4 | 17.1 | 18.3 | 2.5 |
| Diluted EPS ($) | 4.86 | 5.71 | 0.14 | 6.74 | 7.28 | 0.97 |
| Operating cash flow | 13.1 | 19.1 | 13.0 | 21.5 | 16.5 | 20.0 |
| Capital expenditure | (4.4) | (4.4) | (3.9) | (3.4) | (4.1) | (3.9) |
| Free cash flow | 8.7 | 14.7 | 9.1 | 18.1 | 12.4 | 16.1 |
| Stock based compensation | 0.5 | 0.5 | 0.6 | 0.8 | 0.8 | n/a |
| Cash and investments | 8.5 | 13.7 | 7.3 | 14.2 | 15.5 | 7.1 |
| Total debt | 33.1 | 30.7 | 35.1 | 37.1 | 49.3 | 53.9 |
| Total equity | 38.2 | 46.0 | 37.6 | 46.3 | 52.6 | 41.9 |

| Metric | Q3 2025 | Q3 2026 | Change |
|---|---|---|---|
| Revenue ($bn) | 17.28 | 18.09 | 4.7% |
| Gross profit ($bn) | 13.42 | 13.19 | (1.7%) |
| Operating income ($bn) | 6.51 | 5.59 | (14.2%) |
| Net income ($bn) | 5.79 | 5.07 | (12.4%) |
| Diluted EPS ($) | 2.32 | 2.04 | (12.1%) |
| Operating margin (%) | 37.7 | 30.9 | (6.8 pts) |
| Net margin (%) | 33.5 | 28.0 | (5.5 pts) |
| Ratio | FY2021 | FY2022 | FY2023 | FY2024 | FY2025 | TTM Q3 2026 |
|---|---|---|---|---|---|---|
| Growth and margins | ||||||
| Revenue growth (%) | n/a | 21.7 | 1.4 | 6.7 | 1.3 | n/a |
| Gross margin (%) | 72.0 | 70.6 | 73.2 | 76.3 | 74.8 | 71.8 |
| Operating margin (%) | 25.7 | 30.3 | 3.9 | 31.0 | 32.6 | 8.1 |
| Net margin (%) | 25.3 | 24.5 | 0.6 | 26.7 | 28.1 | 3.6 |
| FCF margin (%) | 17.8 | 24.8 | 15.2 | 28.2 | 19.0 | n/a |
| Cost and investment intensity | ||||||
| R&D (%) revenue | 25.1 | 22.9 | 50.8 | 28.0 | 24.3 | 45.6 |
| SBC (%) revenue | 1.0 | 0.9 | 1.1 | 1.2 | 1.3 | n/a |
| Capex (%) revenue | 9.1 | 7.4 | 6.4 | 5.3 | 6.3 | n/a |
| Effective tax rate (%) | 11.0 | 11.7 | 80.0 | 14.1 | 13.3 | 48.6 |
| Returns | ||||||
| ROE (%) | 32.3 | 34.5 | 0.9 | 40.8 | 36.9 | 5.8 |
| ROA (%) | 11.7 | 13.5 | 0.3 | 15.3 | 14.4 | 1.9 |
| ROIC (%) | 17.8 | 25.2 | 3.0 | 24.7 | 21.3 | 5.0 |
| Asset turnover (x) | 0.46 | 0.54 | 0.56 | 0.55 | 0.47 | 0.52 |
| Liquidity and leverage | ||||||
| Current ratio (x) | 1.27 | 1.47 | 1.25 | 1.36 | 1.54 | 1.32 |
| Debt to equity (x) | 0.87 | 0.67 | 0.93 | 0.80 | 0.94 | 1.29 |
| Net cash ($bn) | (24.6) | (17.0) | (27.7) | (23.0) | (33.8) | (46.8) |
| Efficiency and cash quality | ||||||
| Days sales outstanding | 69 | 58 | 63 | 58 | 66 | 68 |
| Inventory days | 159 | 124 | 144 | 147 | 148 | 119 |
| FCF to net income (x) | 0.70 | 1.01 | 25.05 | 1.06 | 0.68 | n/a |
| Shareholder returns (%) FCF | 86 | 48 | 96 | 51 | 107 | n/a |


| Measure | Value |
|---|---|
| Market cap ($bn) | 368.8 |
| Enterprise value (net debt at 30 Jun 2026) ($bn) | 415.6 |
| P/E on TTM Q3 2026 GAAP EPS (x) | 154.1 |
| P/E on FY2026 guidance midpoint (x) | 53.5 |
| P/E on FY2026 guidance midpoint excl. one time charges (x) | 16.9 |
| EV/Sales TTM Q3 2026 (x) | 6.2 |
| FCF yield on TTM Q2 2026 FCF (%) | 4.4 |
| Price/Book at 30 Jun 2026 (x) | 8.8 |
| Dividend yield (%) | 2.3 |
Cost structure and profitability
- GAAP gross margin 72.9% in Q3 2026 against 77.7%, while non GAAP gross margin was 81.4% against 81.9%: amortization of the Ohtuvayre intangible and the Verona inventory step up run through cost of sales. Q4 2025 GAAP gross margin was 66.2% after accelerated depreciation under the 2025 restructuring program.
- R&D $4.54bn in Q3 2026, +7.2%, incl. the $400m SciBrunch charge and net of $200m Blackstone funding; 9M 2026 R&D $26.9bn against $11.9bn, of which $15.1bn acquisition and licence charges.
- SG&A $2.89bn, +9.6%, 16.0% of sales; Q2 2026 SG&A included IT investment.
- Restructuring: income statement line $184m in Q3 2026; total restructuring costs excluded from non GAAP $581m in Q3 2026 and $1.38bn in 9M 2026. The 2025 program targets about $3.0bn of cost (about 60% cash), the 2024 program about $4.0bn.
- Below operating income: Q3 2026 interest expense $546m against $327m; equity investment income $401m. GAAP tax rate 8.9% in Q3 2026.
- Operating margin 30.9% in Q3 2026 against 37.7%; 9M 2026 3.2% reported, 32.8% excluding the three charges, against 35.7% in 9M 2025.


| Line | Q3 2025 | Q4 2025 | Q1 2026 | Q2 2026 | Q3 2026 |
|---|---|---|---|---|---|
| Cost of sales (% of sales) | 22.3 | 33.8 | 25.8 | 26.5 | 27.1 |
| Selling, general and administrative (% of sales) | 15.2 | 17.7 | 16.6 | 17.5 | 16.0 |
| Research and development, reported (% of sales) | 24.5 | 23.7 | 77.3 | 58.7 | 25.1 |
| R&D excl. Cidara, Terns, SciBrunch charges (% of sales) | 24.5 | 23.7 | 22.1 | 24.3 | 22.9 |
| Restructuring (% of sales) | 0.3 | 1.3 | 1.2 | 0.9 | 1.0 |
| Operating income (computed) (% of sales) | 37.7 | 23.5 | (20.9) | (3.5) | 30.9 |
| Net income (% of sales) | 33.5 | 18.1 | (26.0) | (8.0) | 28.0 |
| Deal | Date | Value | Accounting |
|---|---|---|---|
| Verona Pharma (Ohtuvayre, COPD) | Oct 2025 | about $10.5bn incl. equity awards | business combination; intangible asset, no R&D charge |
| Cidara Therapeutics (long acting influenza antiviral, Phase 3) | Jan 2026 | $9.2bn | asset acquisition; $9.0bn R&D charge, $3.62 per share, not tax deductible |
| Terns Pharmaceuticals (oral CML drug, Phase 1/2) | May 2026 | $6.8bn | asset acquisition; $5.7bn R&D charge, $2.31 per share |
| TARGAN (poultry biodevices, Animal Health) | Jul 2026 | about $650m | business combination expected |
| SciBrunch Therapeutics licence (oral KRAS G12D inhibitor) | Q3 2026 | $400m upfront | R&D charge, $0.12 per share |
| Blackstone Life Sciences funding (sac TMT) | Q3 2026 | $200m | reduces Q3 2026 R&D |
| Prometheus Biosciences | 2023 | $10.2bn charge | acquired IPR&D in R&D; FY2023 operating margin 3.9% |
7 MD&A & Management Commentary
Q3 2026 earnings call and results release (29 Oct 2026)
- Q3 2026: sales $18.1bn, +5% (+4% excluding currency); GAAP EPS $2.04, (12%); non GAAP EPS $2.49, (3%), incl. the $0.12 SciBrunch charge; non GAAP gross margin 81.4% against 81.9%; non GAAP operating expenses +12% to $7.4bn; non GAAP tax rate 10.9% on discrete items.
- Purchase timing: about $550m of Q3 sales came from favourable US purchase timing, $200m Keytruda, $50m Winrevair and $300m vaccines, mostly Gardasil; the Keytruda and Winrevair amounts reverse in Q4 2026 and most of the vaccine amount in 2027.
- Keytruda Qlex: $830m, of which US $693m; target of 30% to 40% US subcutaneous use by end 2027; a permanent US billing code since 1 Apr 2026; a Dutch injunction in the Halozyme litigation blocks Qlex supply in six European markets; Japan and China approved subcutaneous pembrolizumab.
- 2027 outlook (qualitative): moderate sales growth; more than $2bn of exclusivity losses (Bridion, Januvia family, Adempas); underlying operating expenses up by a mid to high single digit %; higher gross margin as the 2.5% Keytruda royalty ends after 2026.
- Pipeline (8-K Ex 99.1): FDA accepted the sac TMT filing in endometrial cancer, action date 15 Jun 2027; intismeran with Keytruda cut melanoma recurrence or death risk by 42%; FDA approved Welireg with Lenvima in kidney cancer; the I DXd filing in small cell lung cancer was withdrawn.
- Q2 2026 call (4 Aug 2026): sales $16.6bn, +5%; Terns charge $2.31 per share; Lipfendra, an oral PCSK9 inhibitor, approved in Jul 2026; German GKV cost containment law approved in Jul 2026, mainly effective from 1 Jan 2027.
- Q1 2026 results (8-K Ex 99.1, 30 Apr 2026): sales $16.3bn, +5%; Cidara charge $3.62 per share; Gardasil $1.1bn, (19%), on lower demand in China and Japan.
| Item | Outlook | Source |
|---|---|---|
| FY2026 share repurchases | about $3bn | Q2 and Q3 2026 calls |
| Dividend | committed to growing it over time; quarterly dividend about $0.85 (yield 2.27% at $149.49) | Q2 2026 call |
| 2027 sales | moderate growth; more than $2bn of exclusivity losses | Q3 2026 call |
| 2027 costs and margin | underlying operating expenses up mid to high single digit %; gross margin up as the Keytruda royalty ends | Q3 2026 call |
| Mid 2030s | more than $70bn of commercial opportunity from over 20 products, excl. Terns and the PD1/VEGF program | Q2 and Q3 2026 calls |
Management and CFO commentary
- CFO Caroline Litchfield, Q2 2026 call: non GAAP gross margin 81.1%, down 1.1 points on larger inventory reserves; operating expenses excluding charges up about 7%; non GAAP tax rate 160.3% as the Terns charge is not tax deductible.
- CFO Litchfield, Q2 2026 call: about $3bn of buybacks in 2026; committed to growing the dividend and to an investment grade rating; current actions expected to lead to faster growth in 2027.
- CFO commentary, Q3 2026 release outlook: FY2026 non GAAP gross margin about 81%, other expense about $1.4bn, about 2.48bn diluted shares; currency adds about 1% to sales and $0.15 to EPS.
- Q4 2025 results (8-K Ex 99.1, 3 Feb 2026): Q4 2025 non GAAP gross margin 79.7% against 80.8%, on higher inventory write offs; GAAP gross margin 66.2% after accelerated depreciation under the 2025 restructuring program.
- CEO Robert Davis, Q2 2026 call: more than $70bn of commercial opportunity from over 20 new products, with 10 programs about 70% of it.
- CEO Davis, 8-K Ex 99.1 of 29 Oct 2026: ESMO 2026 data for sac TMT and the first Phase 3 result for a therapeutic cancer vaccine (intismeran, with Moderna) reduce clinical risk in the late stage pipeline.
- Dean Li, President of Merck Research Laboratories, Q2 2026 call: 17 Phase 3 studies for sac TMT; the Cidara influenza antiviral could be approved in 2029.
| Speaker | Date and source | Statement |
|---|---|---|
| Caroline Litchfield, CFO | 4 Aug 2026, Q2 2026 earnings call transcript | “We remain confident in the trajectory of Keytruda Qlex adoption.” |
| Caroline Litchfield, CFO | 4 Aug 2026, Q2 2026 earnings call transcript | “We remain committed to the dividend, with the goal of increasing it over time.” |
| Robert M. Davis, Chairman and CEO | 4 Aug 2026, Q2 2026 earnings call transcript | “more of a hill than a cliff” |
| Item | Disclosure |
|---|---|
| 10-K FY2025, concentration | Keytruda incl. Qlex $31.68bn, 48.7% of FY2025 sales; Pharmaceutical segment 89.4% of sales, Animal Health 9.8%. |
| 10-K FY2025, patents | Key Keytruda US patent expires in 2028 (EU 2031, Japan 2032 to 2033); two further US patents expire May and Nov 2029 and Merck expects litigation; Keytruda Qlex US patent runs to 2031. |
| 10-K FY2025, royalties | 2.5% royalty on worldwide Keytruda sales through 2026; 7% on US Gardasil until Dec 2028; 22% on Winrevair to BMS; 7.25% on Vaxneuvance and Capvaxive through 2026, then 2.5% from 2027 to 2035. |
| 10-K FY2025, intangibles | Other intangibles $26.68bn at end 2025 against $16.37bn a year earlier, mainly Ohtuvayre from Verona; amortization $2.79bn in FY2025. |
| 10-Q Q2 2026, exclusivity | Januvia and Janumet lost US exclusivity in May 2026, Janumet XR and Bridion in Jul 2026; US Bridion sales to be discontinued in 2027; Lagevrio US emergency use ends 29 Jun 2027. |
| 10-Q Q2 2026, vaccines policy | CDC schedule changes of Jan 2026, incl. a single HPV dose for adolescents, stayed by a federal court on 16 Mar 2026; revised supply contract with Zhifei in Apr 2026, limited China shipments resumed, revenue expected to be immaterial in 2026. |
| 10-Q Q2 2026, Germany | GKV cost containment law approved Jul 2026, most provisions effective 1 Jan 2027; Merck expects downward pressure on German sales. |
| 10-Q Q2 2026, restructuring | 2025 program about $3.0bn, $2.5bn incurred to 30 Jun 2026; 2024 program about $4.0bn, $1.9bn incurred. |
| Measure | 3 Feb 2026 | 30 Apr 2026 | 4 Aug 2026 | 29 Oct 2026 |
|---|---|---|---|---|
| Sales ($bn) | 65.5 to 67.0 | 65.8 to 67.0 | 66.3 to 67.3 | 66.8 to 67.3 |
| Non GAAP EPS ($) | 5.00 to 5.15 | 5.04 to 5.16 | 2.66 to 2.76 | 2.77 to 2.82 |
| One time charges inside EPS ($ per share) | Cidara about 3.65 | Cidara 3.62 | Cidara 3.62, Terns 2.31 | Cidara 3.62, Terns 2.31, SciBrunch 0.12 |
| Non GAAP gross margin (%) | about 82 | about 82 | about 81 | about 81 |
| Non GAAP operating expenses ($bn) | 35.9 to 36.9 | 36.0 to 36.8, excl. Terns | 42.0 to 42.7 | 42.4 to 42.9 |
| Other (income) expense, net ($bn) | about 1.3 | about 1.3 | about 1.4 | about 1.4 |
| Non GAAP tax rate (%) | 23.5 to 24.5 | 23.5 to 24.5 | 35.0 to 36.0 | 32.0 to 33.0 |
| Currency effect | about 1% of sales, $0.10 EPS | about 1%, $0.10 EPS | about 1%, $0.15 EPS | about 1%, $0.15 EPS |
| Diluted shares (bn) | about 2.48 | about 2.48 | about 2.48 | about 2.48 |
8 Peer Valuation & Sector Summary
- Sector: large pharmaceutical companies with human health, vaccines and animal health; Merck relies on one product more than the peer set, with Keytruda at 48.7% of FY2025 sales.
- FY2025 like for like: revenue growth MRK 1.3% against LLY 44.7%, ABBV 8.6%, AZN 8.6%, JNJ 6.0% and PFE (1.6%); operating margin before restructuring MRK 34.0% against LLY 45.6%, PFE 35.6%, ABBV 32.5%, JNJ 27.2% and AZN 23.7%.
- Free cash flow margin FY2025: MRK 19.0% against ABBV 29.1%, JNJ 20.9%, AZN 20.0%, PFE 14.5% and LLY 13.8%.
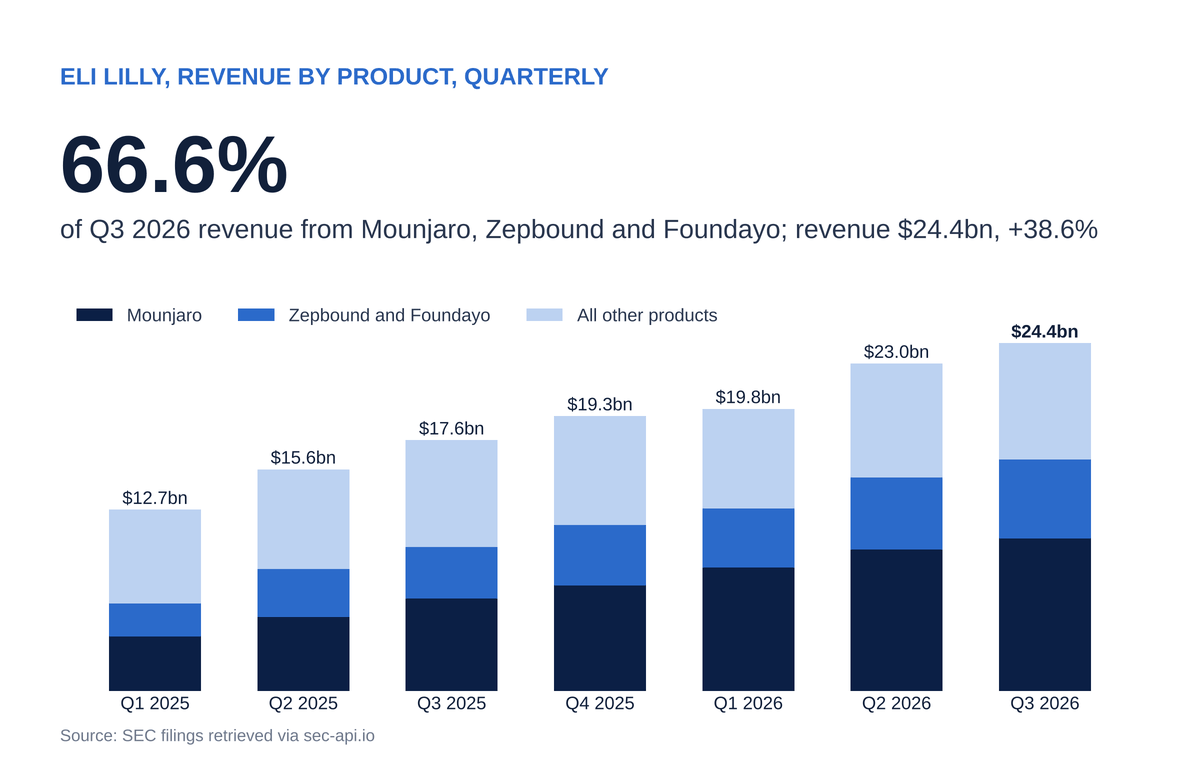
- 2026 growth: H1 2026 MRK 5.0% against LLY 51.2%, ABBV 11.2%, AZN 9.4%, JNJ 8.2% and PFE 3.9%; Q3 2026 MRK 4.7%, LLY 38.6%, AZN 7.0%.
- Valuation: EV/Sales on FY2025 sales MRK 6.2x (30 Oct 2026 price) against LLY 17.1x, ABBV 8.7x, JNJ 6.8x, AZN 4.6x and PFE 3.3x (6 Oct 2026 prices); MRK 16.9x FY2026 non GAAP EPS guidance excluding one time charges.
| Company | Revenue TTM ($bn) | Revenue growth (%) | Gross margin (%) | Operating margin (%) | FCF margin (%) | Net cash ($bn) | Market value ($bn) | EV/Sales (x) |
|---|---|---|---|---|---|---|---|---|
| MRK | 65.0 | 1.3 | 74.8 | 34.0 | 19.0 | (33.8) | 369 | 6.2 |
| LLY | 65.2 | 44.7 | 83.0 | 45.6 | 13.8 | (35.2) | 1,080 | 17.1 |
| PFE | 62.6 | (1.6) | 74.3 | 35.6 | 14.5 | (51.2) | 157 | 3.3 |
| ABBV | 61.2 | 8.6 | 70.2 | 32.5 | 29.1 | (62.2) | 471 | 8.7 |
| JNJ | 94.2 | 6.0 | 67.9 | 27.2 | 20.9 | (27.8) | 614 | 6.8 |
| AZN | 58.7 | 8.6 | 81.9 | 23.7 | 20.0 | (22.1) | 250 | 4.6 |

| Company | H1 2026 | Q3 2026 | Basis |
|---|---|---|---|
| Merck (MRK) | 5.0 | 4.7 | Q3 2026 8-K, 29 Oct 2026 |
| Eli Lilly (LLY) | 51.2 | 38.6 | Q3 2026 10-Q, 29 Oct 2026; revenue $24.40bn |
| AstraZeneca (AZN) | 9.4 | 7.0 | Q3 2026 6-K, 30 Oct 2026; revenue $16.21bn |
| AbbVie (ABBV) | 11.2 | not read | Q3 2026 8-K of 30 Oct 2026 not read |
| Johnson & Johnson (JNJ) | 8.2 | not read | quarter to 27 Sep 2026; segment lines only read |
| Pfizer (PFE) | 3.9 | not filed | Q3 2026 results after 31 Oct 2026 |
9 Material Events & Contracts
- Eight Forms 8-K in twelve months: four results releases (Ex 99.1 and 99.2 each), two notes offerings ($8.0bn in Dec 2025, $6.0bn in May 2026, each with officers' certificates and a legal opinion), the annual meeting vote results and a director election; 26 exhibits in total. The Verona, Cidara, Terns and TARGAN closings were not filed under Item 2.01.
- Business development: $26.5bn of announced value across Verona (about $10.5bn), Cidara ($9.2bn) and Terns ($6.8bn), plus TARGAN (about $650m) and the SciBrunch licence ($400m upfront).
| Date | Items | Event |
|---|---|---|
| 4 Dec 2025 | 8.01, 9.01 | Closed $8.0bn of senior notes in eight tranches, floating rate 2029 to 5.700% 2065, to fund the Cidara acquisition; Ex 4.1 to 4.8 officers' certificates, Ex 5.1 legal opinion. |
| 3 Feb 2026 | 2.02, 9.01 | Q4 and FY2025 results: Q4 sales $16.40bn (+5%), GAAP EPS $1.19, non GAAP $2.04; FY2025 sales $65.01bn (+1%), GAAP EPS $7.28, non GAAP $8.98; first FY2026 outlook. Ex 99.1 release, Ex 99.2 tables. |
| 30 Apr 2026 | 2.02, 9.01 | Q1 2026 results: sales $16.29bn (+5%); GAAP EPS ($1.72), non GAAP ($1.28) after the $9.0bn Cidara charge; second FY2026 outlook. Ex 99.1, Ex 99.2. |
| 22 May 2026 | 8.01, 9.01 | Closed $6.0bn of senior notes in seven tranches, floating rate 2028 to 5.850% 2056, which refinanced the Terns term loan; Ex 4.1 to 4.7, Ex 5.1. |
| 28 May 2026 | 5.07 | Annual meeting of 26 May 2026: 13 directors elected, say on pay 94.1% of votes cast, auditor ratified, three shareholder proposals rejected. |
| 4 Aug 2026 | 2.02, 9.01 | Q2 2026 results: sales $16.61bn (+5%); GAAP EPS ($0.54), non GAAP ($0.13) after the $5.7bn Terns charge; third FY2026 outlook. Ex 99.1, Ex 99.2. |
| 13 Oct 2026 | 5.02 | Paul J. Diaz elected director from 1 Nov 2026, Audit and Research Committees; board rises to 14 members. Ex 99.1 release. |
| 29 Oct 2026 | 2.02, 9.01 | Q3 2026 results: sales $18.09bn (+5%); GAAP EPS $2.04, non GAAP $2.49 incl. $0.12 SciBrunch charge; fourth FY2026 outlook. Ex 99.1, Ex 99.2. |
| Contract | Terms |
|---|---|
| Senior notes, Dec 2025 (Ex 4.1 to 4.8) | $8.0bn in eight tranches: floating rate 2029 at SOFR plus 0.570%, fixed 3.850% 2029 to 5.700% 2065; issued under the 2010 indenture with U.S. Bank Trust National Association as trustee. |
| Senior notes, May 2026 (Ex 4.1 to 4.7) | $6.0bn in seven tranches: floating rate 2028, fixed 4.300% 2028 to 5.850% 2056; proceeds repaid the $6.0bn 364 day term loan drawn in Apr 2026 for Terns. |
| Cidara and Terns mergers | Cidara $9.2bn incl. $570m equity award settlements (Jan 2026); Terns $6.8bn incl. $606m (May 2026); both asset acquisitions charged to R&D. |
| Blackstone Life Sciences funding | Funds part of sac TMT development; reduced Q3 2026 R&D by $200m. |
| US government pricing agreement (Dec 2025) | Three year most favoured nation agreement incl. Medicaid discounts, launch pricing and a direct to patient program; Section 232 tariffs delayed three years. |
| Royalty agreements | Keytruda 2.5% worldwide royalty ends after 2026; US Gardasil 7% until Dec 2028; Winrevair 22% to BMS; Koselugo agreement amended Aug 2025, with a $150m payment in Q1 2026. |
10 Ownership, Voting Power & Annual Meeting
- One class of common stock, one vote per share, no controlling holder. Directors and officers hold below 1%; CEO Robert Davis held about 443,602 shares directly after his Feb 2026 sale.
- 2026 annual meeting (26 May 2026): all 13 directors elected with 88.3% (Patricia Russo) to 99.7% of votes cast; say on pay 94.1%; auditor ratified with 94.1%; the political contributions report proposal received 12.4% and two other shareholder proposals 1.2% and 1.3%.
- Insiders, 12 months to 31 Oct 2026: no open market purchases; 27 open market sales by 11 officers of about 575,700 shares for about $71.3m, mostly after option exercises and clustered after the Q4 2025 and Q2 2026 results. Largest seller: General Counsel Jennifer Zachary, about $25.2m; CEO Davis $5.6m and CFO Caroline Litchfield $5.0m in Feb 2026.
- Board: Paul J. Diaz joins on 1 Nov 2026, taking the board to 14 members.
| Proposal | For (bn votes) | Against (bn votes) | Abstain (bn votes) | For as % of votes cast | Result |
|---|---|---|---|---|---|
| Elect director Douglas M. Baker, Jr. | 1.850 | 0.005 | 0.003 | 99.7 | Elected; highest director support |
| Elect director Robert M. Davis | 1.730 | 0.118 | 0.010 | 93.6 | Elected; Chair and CEO |
| Elect director Thomas H. Glocer | 1.733 | 0.122 | 0.003 | 93.4 | Elected |
| Elect director Patricia F. Russo | 1.637 | 0.217 | 0.004 | 88.3 | Elected; lowest director support |
| Say on pay (advisory) | 1.730 | 0.109 | 0.018 | 94.1 | Approved |
| Ratify independent auditor for 2026 | 2.012 | 0.126 | 0.003 | 94.1 | Approved |
| Shareholder: report on DEI risks in federal contracting | 0.023 | 1.812 | 0.022 | 1.2 | Rejected |
| Shareholder: report on healthcare coverage gaps | 0.024 | 1.812 | 0.022 | 1.3 | Rejected |
| Shareholder: report on political contributions | 0.227 | 1.607 | 0.024 | 12.4 | Rejected |
2026 annual meeting remarks
- CEO Davis: over $70bn of potential commercial opportunity by the mid 2030s from over 20 growth drivers, $20bn more than a year earlier; about 80 Phase 3 studies, more than 60 in oncology; more than $65bn spent on business development since 2021.
- Questions: shareholders asked about reliance on Keytruda, drug pricing and political donations; Davis called the financial effect of the US pricing agreement manageable and said political contributions are published on the company website.
11 Risk Factors
- Item 1A of the FY2025 Form 10-K holds 30 risk factors, as in FY2024; five were materially reworded, none added or removed; the Q1 and Q2 2026 Forms 10-Q report no material changes.
| Risk | Disclosure and change |
|---|---|
| Keytruda exclusivity | US biosimilar competition could begin in Dec 2028; two further patents expiring May and Nov 2029 expected to be litigated; Keytruda family 47.6% of Q3 2026 sales. |
| US price setting | Keytruda selection expected in 2027 with prices from 1 Jan 2029, after which Merck expects US Keytruda sales to decline materially; Januvia (2026), Janumet (2027), Lenvima (2028) already selected. |
| Subcutaneous conversion | Lower than expected use of Keytruda Qlex is named as a risk event; Dutch injunction in the Halozyme litigation blocks supply in six European markets. |
| Exclusivity losses 2026 to 2027 | Januvia and Janumet $380m in Q3 2026, (39.2%); Bridion $144m, (67.2%); more than $2bn of 2027 headwind cited by management. |
| China and vaccines | Gardasil China sales nil from Q2 2025 to Q1 2026 against $3.5bn in 2024; US vaccine schedule changes stayed by a court and under appeal. |
| Leverage and acquisition charges | Debt $53.9bn at 30 Jun 2026; $15.1bn of acquisition and licence charges in 9M 2026; 9M interest expense $1.55bn. |
| Germany and Europe pricing | German GKV cost containment law effective mainly from 1 Jan 2027. |
How risk factors changed
- Comparison: 10-K FY2025 filed 24 Feb 2026 acc 0000310158-26-000063 against 10-K FY2024 filed 25 Feb 2025 acc 0001628280-25-007732.
- The expected start of Keytruda US price setting moved one year later, from 1 Jan 2028 in the FY2024 10-K to 1 Jan 2029 in the FY2025 10-K, while US biosimilar entry stays tied to Dec 2028.
- Keytruda reached 49% of 2025 sales against 46% in 2024, and Keytruda Qlex uptake is named as a new risk event.
- US exclusivity losses are now dated: Januvia and Janumet May 2026, Bridion and Janumet XR Jul 2026.
- China language moved from expected decline to reported decline, with no material Gardasil recovery expected in 2026.
- US policy exposure widened: the pricing factor adds the MFN Agreement and Lenvima price setting, and the economic factor names the US directly.

| Measure | 10-K FY2024 | 10-K FY2025 |
|---|---|---|
| Risk factors (count) | 30 | 30 |
| Change | Risk factor | What changed |
|---|---|---|
| Reworded | Loss of market exclusivity causes rapid loss of sales | Keytruda timeline moved: FY2024 expected US decline from Jan 2028 on IRA pricing and from Dec 2028 compound patent expiry; FY2025 says biosimilar competition could begin Dec 2028, two further patents expiring May and Nov 2029 are expected to be litigated, and adds Bridion US exclusivity loss in Jul 2026 (US sales to stop by end 2026) and Januvia/Janumet (May 2026) and Janumet XR (Jul 2026) with nearly all US sales expected to be lost. |
| Reworded | Key products generate most profits and cash flows | Keytruda share of total sales rises from 46% (2024) to 49% (2025); Winrevair replaces Bridion in the key product list; new named events are selection for IRA price setting, lower than expected use of Keytruda Qlex and biosimilar availability; heading adds cash flows and prospects. |
| Reworded | Continued pricing pressure, now public and private sectors | Heading adds 'in the public and private sectors'; expected Keytruda IRA selection moves from 2026 (price from 1 Jan 2028) to 2027 (price from 1 Jan 2029) and the expected US decline becomes 'material'; adds Lenvima selection (Jan 2026, price from 1 Jan 2028) and the Dec 2025 MFN Agreement with the US government, including a direct to patient program. |
| Reworded | China business and Gardasil sales | FY2024 heading described China growth and an expected large Gardasil decline in 2025 after pausing shipments from Feb 2025; FY2025 heading states Gardasil sales in China fell in 2025 and will not materially increase in 2026, and that the China business declined as a result. |
| Reworded | Economic conditions and government cost cutting | Heading changes cost reduction measures 'being taken by certain governments' to 'by the U.S. and other countries'. |
| Filing | Change disclosed |
|---|---|
| 10-Q Q1 2026 filed 4 May 2026 | Full text search matches the Part II risk factor statement of no material changes from the 10-K FY2025; the extractor returned no Part II Item 1A text, so the wording was not read directly. |
| 10-Q Q2 2026 filed 7 Aug 2026 | Full text search matches the Part II risk factor statement of no material changes from the 10-K FY2025; wording not read directly. MD&A in this 10-Q adds CDC schedule changes (Jan 2026, stayed by court), a revised Zhifei supply contract (Apr 2026) and a 3 year delay of Section 232 tariffs, outside Item 1A. |
| 10-Q Q3 2026 | Not filed as of 31 Oct 2026. |
12 Stock Price, Scenarios & Sensitivity
- MRK closed at $149.49 on 30 Oct 2026, +73.9% on the Oct 2025 month end close of $85.98, 4.7% below the 52 week high of $156.90 and 86.6% above the low of $80.11.
- Valuation: 154.1x TTM GAAP EPS of $0.97, which carries the 2026 charges; 53.5x the FY2026 non GAAP EPS guidance midpoint of $2.795; 16.9x that midpoint plus the $6.05 of one time charges; EV/Sales 6.2x on TTM sales; free cash flow yield 4.4% on TTM Q2 2026 free cash flow.
- Scenario model: sales grow from TTM Q3 2026 for three years to FY2029; operating margin as stated; other expense $1.4bn a year (FY2026 guidance level); 16% tax rate; price equals FY2029 EPS times exit P/E.

Critical factors and core assumptions
| Factor | Current value | Best case requires | Evidence in filings and calls |
|---|---|---|---|
| Keytruda Qlex conversion | $830m in Q3 2026, 9.7% of Keytruda family; US $693m | 30% to 40% US subcutaneous share by end 2027, held after the 2028 intravenous patent expiry | 8-K Ex 99.2 Table 3a; Q3 2026 call |
| Winrevair | $694m in Q3 2026 (+92.8%); 9M 2026 $1.81bn | annual sales above $4bn by 2029 with label expansions | 8-K Table 3; Q3 2026 call |
| Launches against exclusivity losses | Lipfendra 11,000 Q3 prescriptions; Capvaxive $263m; Enflonsia $187m; Ohtuvayre $184m | launch sales exceed the more than $2bn 2027 exclusivity headwind | Q3 2026 call |
| Late stage pipeline | sac TMT action date 15 Jun 2027; intismeran positive Phase 3; Cidara antiviral in Phase 3 | approvals 2027 to 2029 contributing to the $70bn mid 2030s opportunity | 8-K Ex 99.1; Q3 2026 call |
| Gardasil | 9M 2026 $4.23bn (+0.7%); FY2025 $5.23bn (39%) | China volumes return; US two dose schedule stays in place | 8-K tables; 10-Q Q2 2026 |
| Pricing regulation | Keytruda Medicare price expected from 2029; MFN agreement; German law from 2027 | limited net price erosion beyond the Medicare selection | 10-Q Q2 2026 MD&A |
- Base: TTM Q3 2026 sales $67.4bn; operating margin 8.1% reported, 30.5% excluding the 2026 charges; FY2025 32.6%.
- Best case: 4.0% sales CAGR, 38% operating margin, 17x P/E, share count (3%) from buybacks.
- Base case: 2.0% sales CAGR, 33% margin, 14x P/E, share count (2%).
- Worst case: (3.0%) sales CAGR as Keytruda biosimilars and Medicare prices arrive with low Qlex conversion, 26% margin, 10x P/E, share count unchanged.
- Tax rate 16% (assumption; FY2026 guidance rate is inflated by charges that are not tax deductible); other expense $1.4bn a year; no further multi billion IPR&D charges.
Scenarios, three years forward
| Measure | Worst case | Base case | Best case |
|---|---|---|---|
| Revenue CAGR, 3 years (%) | (3.0) | 2.0 | 4.0 |
| Revenue, FY2029 ($bn) | 61.5 | 71.5 | 75.8 |
| Operating margin, FY2029 (%) | 26.0 | 33.0 | 38.0 |
| Net income, FY2029 ($bn) | 12.3 | 18.6 | 23.0 |
| EPS, FY2029 ($) | 4.97 | 7.71 | 9.62 |
| Exit P/E (x) | 10.0 | 14.0 | 17.0 |
| Implied price ($) | 50 | 108 | 163 |
| Change against $149.49 (%) | (67) | (28) | 9 |
| Implied annual return (%) | (30.7) | (10.3) | 3.0 |

Sensitivity analysis
| Revenue CAGR \ Operating margin | 26% | 30% | 33% | 36% | 38% |
|---|---|---|---|---|---|
| (3%) | $71 | $83 | $92 | $101 | $107 |
| (1%) | $76 | $89 | $98 | $108 | $114 |
| 2% | $84 | $98 | $108 | $118 | $125 |
| 3% | $86 | $101 | $111 | $122 | $129 |
| 4% | $89 | $104 | $115 | $126 | $133 |
| Exit P/E \ Operating margin | 26% | 30% | 33% | 36% | 38% |
|---|---|---|---|---|---|
| 10x | $60 | $70 | $77 | $85 | $90 |
| 12x | $72 | $84 | $93 | $101 | $107 |
| 14x | $84 | $98 | $108 | $118 | $125 |
| 15x | $90 | $104 | $116 | $127 | $134 |
| 17x | $102 | $118 | $131 | $144 | $152 |
Disclaimer
This analysis is for information only and is not financial advice. It is derived from public SEC filings retrieved via sec-api.io and is not a publication of the U.S. Securities and Exchange Commission. Scenario values are model outputs under stated assumptions and are not forecasts. Data as of 30 October 2026.
Sources
All company figures are read from SEC filings retrieved through the sec-api.io MCP server. Call statements come from the Q3 2026 and Q2 2026 earnings call transcripts posted by the company; Q1 2026 and Q4 2025 points come from the 8-K earnings releases.
| Form | Period | Filed | Accession number |
|---|---|---|---|
| 8-K (Ex 99.1, 99.2) | Q3 2026 | 29 Oct 2026 | 0001104659-26-119825 |
| 8-K | Director election | 13 Oct 2026 | 0000310158-26-000237 |
| 10-Q | Q2 2026 | 7 Aug 2026 | 0000310158-26-000212 |
| 8-K (Ex 99.1) | Q2 2026 | 4 Aug 2026 | 0001104659-26-090045 |
| 8-K Item 5.07 | Annual meeting | 28 May 2026 | 0001104659-26-067509 |
| 8-K Item 8.01 | Notes offering | 22 May 2026 | 0001628280-26-037738 |
| 10-Q | Q1 2026 | 4 May 2026 | 0001628280-26-029802 |
| 8-K (Ex 99.1) | Q1 2026 | 30 Apr 2026 | 0001104659-26-052081 |
| DEF 14A | 2026 proxy | 8 Apr 2026 | 0001193125-26-147704 |
| 10-K | FY2025 | 24 Feb 2026 | 0000310158-26-000063 |
| 8-K (Ex 99.1) | Q4 2025 | 3 Feb 2026 | 0001104659-26-009495 |
| 8-K Item 8.01 | Notes offering | 4 Dec 2025 | 0001628280-25-055388 |
| 10-Q | Q3 2025 | 5 Nov 2025 | 0000310158-25-000059 |
| 8-K (Ex 99.1) | Q3 2025 | 30 Oct 2025 | 0001104659-25-103974 |
| 10-K | FY2023 | 26 Feb 2024 | 0001628280-24-006850 |
| 10-K | FY2022 | 24 Feb 2023 | 0001628280-23-005061 |
| Company | Form | Filed | Accession number |
|---|---|---|---|
| Merck (10-K FY2024, risk factor comparison) | 10-K | 25 Feb 2025 | 0001628280-25-007732 |
| Eli Lilly | 10-Q Q3 2026 | 29 Oct 2026 | 0000059478-26-000108 |
| Bristol Myers Squibb | 10-Q Q3 2026 | 29 Oct 2026 | 0000014272-26-000024 |
| Johnson & Johnson | 10-Q Q3 2026 | 21 Oct 2026 | 0000200406-26-000197 |
| Regeneron | 10-Q Q3 2026 | 30 Oct 2026 | 0000872589-26-000034 |
| AstraZeneca | 6-K Q3 2026 | 30 Oct 2026 | 0001654954-26-009256 |
| Pfizer | 10-Q Q2 2026 | 4 Aug 2026 | 0000078003-26-000095 |
| Summit Therapeutics | 8-K | 14 Sep 2026 | 0001599298-26-000078 |
| GSK | 6-K Q3 2026 | 28 Oct 2026 | 0001654954-26-009181 |
| Sanofi | 6-K Q3 2026 | 30 Oct 2026 | 0001121404-26-000009 |
| United Therapeutics | 8-K Q2 2026 | 5 Aug 2026 | 0001082554-26-000028 |
| Zoetis | 8-K Q2 2026 | 6 Aug 2026 | 0001555280-26-000038 |
| Elanco | 8-K Q2 2026 | 5 Aug 2026 | 0001739104-26-000040 |
| Filed | Exhibit | Document | Content |
|---|---|---|---|
| 4 Dec 2025 | Ex 4.1 | Officers' certificate: Floating Rate Notes due 2029 | $500m floating rate notes maturing 15 March 2029, paying Compounded SOFR plus 0.570%, reset and paid quarterly from 15 March 2026. Net proceeds to the company 99.750% of principal; issued under the 6 January 2010 indenture with U.S. Bank Trust National Association as trustee and calculation agent. |
| 4 Dec 2025 | Ex 4.2 | Officers' certificate: 3.850% Notes due 2029 | Establishes $750m of 3.850% Notes due 2029 under the 2010 indenture (U.S. Bank Trust National Association, trustee). One of eight tranches totalling $8.0bn closed 4 December 2025. |
| 4 Dec 2025 | Ex 4.3 | Officers' certificate: 4.150% Notes due 2031 | Establishes $1.0bn of 4.150% Notes due 2031 under the 2010 indenture (U.S. Bank Trust National Association, trustee). One of eight tranches totalling $8.0bn closed 4 December 2025. |
| 4 Dec 2025 | Ex 4.4 | Officers' certificate: 4.450% Notes due 2032 | Establishes $1.0bn of 4.450% Notes due 2032 under the 2010 indenture (U.S. Bank Trust National Association, trustee). One of eight tranches totalling $8.0bn closed 4 December 2025. |
| 4 Dec 2025 | Ex 4.5 | Officers' certificate: 4.750% Notes due 2035 | Establishes $1.5bn of 4.750% Notes due 2035 under the 2010 indenture (U.S. Bank Trust National Association, trustee). One of eight tranches totalling $8.0bn closed 4 December 2025. |
| 4 Dec 2025 | Ex 4.6 | Officers' certificate: 5.500% Notes due 2046 | Establishes $750m of 5.500% Notes due 2046 under the 2010 indenture (U.S. Bank Trust National Association, trustee). One of eight tranches totalling $8.0bn closed 4 December 2025. |
| 4 Dec 2025 | Ex 4.7 | Officers' certificate: 5.550% Notes due 2055 | Establishes $1.5bn of 5.550% Notes due 2055 under the 2010 indenture (U.S. Bank Trust National Association, trustee). One of eight tranches totalling $8.0bn closed 4 December 2025. |
| 4 Dec 2025 | Ex 4.8 | Officers' certificate: 5.700% Notes due 2065 | Establishes $1.0bn of 5.700% Notes due 2065 under the 2010 indenture (U.S. Bank Trust National Association, trustee). One of eight tranches totalling $8.0bn closed 4 December 2025. |
| 4 Dec 2025 | Ex 5.1 | Legal opinion on December 2025 notes | General Counsel Jennifer Zachary opines the eight series totalling $8.0bn are duly authorized and, once authenticated and paid for, valid and binding obligations. Coupons range from 3.850% (2029) to 5.700% (2065); longest tenor 2065. |
| 3 Feb 2026 | Ex 99.1 | Q4 and FY 2025 earnings release with 2026 guidance | Q4 2025 sales $16.4bn (+5%; 4% ex FX); FY 2025 sales $65.0bn (+1%; 2% ex FX). FY Keytruda plus Qlex $31.7bn (+7%); Winrevair $1.4bn; Capvaxive $759m; Animal Health $6.4bn (+8%). FY 2025 Gardasil sales $5.2bn (39%) on lower demand in China and lower Japan sales; FY Lagevrio $380m (61%). |
| 3 Feb 2026 | Ex 99.2 | Q4 and FY 2025 supplemental financial tables | FY 2025 US sales $36.5bn (+13%) and international $28.5bn (11%); US share of pharmaceutical sales 59.2% versus 52.8%. China pharmaceutical sales $1.8bn in 2025 versus $5.4bn in 2024 (66%); Gardasil China sales $193m in Q1 2025 and nil in Q2 to Q4 2025, versus $3.5bn across 2024. |
| 30 Apr 2026 | Ex 99.1 | Q1 2026 earnings release | Q1 2026 sales $16.3bn ($16.29bn), up 5% (3% ex FX); Keytruda plus Qlex $8.0bn (+12%), helped by US wholesaler purchase timing, of which Qlex $128m; Winrevair $525m (+88%); Animal Health $1.8bn (+13%). Gardasil $1.1bn (19%) on lower demand in China and Japan; Januvia/Janumet $574m (28%); Koselugo alliance revenue $161m including a $150m AstraZeneca payment. |
| 30 Apr 2026 | Ex 99.2 | Q1 2026 supplemental financial tables | Q1 2026 US sales $9.2bn (+8%) and international $7.1bn (+2%); US Keytruda $4.6bn (+7%), international Keytruda $3.3bn (+14%). China pharmaceutical sales $353m versus $668m (47%); Gardasil sales in China $0 versus $193m a year earlier. |
| 22 May 2026 | Ex 4.1 | Officers' certificate: Floating Rate Notes due 2028 | Establishes $500m of Floating Rate Notes due 2028 under the 2010 indenture (U.S. Bank Trust National Association, trustee). One of seven tranches totalling $6.0bn closed 22 May 2026, the same month the $6.8bn Terns acquisition closed. |
| 22 May 2026 | Ex 4.2 | Officers' certificate: 4.300% Notes due 2028 | Establishes $1.0bn of 4.300% Notes due 2028 under the 2010 indenture (U.S. Bank Trust National Association, trustee). One of seven tranches totalling $6.0bn closed 22 May 2026, the same month the $6.8bn Terns acquisition closed. |
| 22 May 2026 | Ex 4.3 | Officers' certificate: 4.650% Notes due 2031 | Establishes $500m of 4.650% Notes due 2031 under the 2010 indenture (U.S. Bank Trust National Association, trustee). One of seven tranches totalling $6.0bn closed 22 May 2026, the same month the $6.8bn Terns acquisition closed. |
| 22 May 2026 | Ex 4.4 | Officers' certificate: 4.950% Notes due 2033 | Establishes $1.0bn of 4.950% Notes due 2033 under the 2010 indenture (U.S. Bank Trust National Association, trustee). One of seven tranches totalling $6.0bn closed 22 May 2026, the same month the $6.8bn Terns acquisition closed. |
| 22 May 2026 | Ex 4.5 | Officers' certificate: 5.200% Notes due 2036 | Establishes $1.5bn of 5.200% Notes due 2036 under the 2010 indenture (U.S. Bank Trust National Association, trustee). One of seven tranches totalling $6.0bn closed 22 May 2026, the same month the $6.8bn Terns acquisition closed. |
| 22 May 2026 | Ex 4.6 | Officers' certificate: 5.750% Notes due 2046 | Establishes $500m of 5.750% Notes due 2046 under the 2010 indenture (U.S. Bank Trust National Association, trustee). One of seven tranches totalling $6.0bn closed 22 May 2026, the same month the $6.8bn Terns acquisition closed. |
| 22 May 2026 | Ex 4.7 | Officers' certificate: 5.850% Notes due 2056 | Establishes $1.0bn of 5.850% Notes due 2056 under the 2010 indenture (U.S. Bank Trust National Association, trustee). One of seven tranches totalling $6.0bn closed 22 May 2026, the same month the $6.8bn Terns acquisition closed. |
| 22 May 2026 | Ex 5.1 | Legal opinion on May 2026 notes | General Counsel Jennifer Zachary opines the seven series totalling $6.0bn are duly authorized and valid and binding obligations once authenticated and paid for. Coupons range from 4.300% (2028) to 5.850% (2056). |
| 4 Aug 2026 | Ex 99.1 | Q2 2026 earnings release | Q2 2026 sales $16.6bn ($16.61bn), up 5% (4% ex FX); Keytruda plus Qlex $8.4bn (+5%), of which Qlex $463m; Winrevair $588m (+75%); Animal Health $1.8bn (+8%); Januvia/Janumet $429m (31%); Vaxneuvance $148m (35%). GAAP loss per share $0.54 and non GAAP loss per share $0.13, both including a $2.31 per share charge ($5.7bn R&D) for the $6.8bn Terns acquisition; R&D $9.7bn versus $4.0bn; GAAP tax rate (95.9%) as no tax benefit was recorded on the Terns charge. |
| 4 Aug 2026 | Ex 99.2 | Q2 2026 supplemental financial tables | Q1 2026 GAAP net loss $4.2bn on R&D of $12.6bn; H1 2026 GAAP loss per share $2.26 versus EPS of $3.77; H1 non GAAP loss per share $1.41. H1 2026 sales $32.9bn (+5%): US $18.5bn (+7%), international $14.4bn (+3%); H1 Keytruda IV $15.8bn (+4%) plus Qlex $590m. |
| 13 Oct 2026 | Ex 99.1 | Press release: Paul J. Diaz elected to board | Paul J. Diaz, managing partner at Cressey & Company and former CEO of Myriad Genetics and Kindred Healthcare, joins the board effective 1 November 2026, taking it to 14 members. Appointed to the Audit and Research Committees; stands for shareholder election in May 2027. |
| 29 Oct 2026 | Ex 99.1 | Q3 2026 earnings release | Q3 2026 sales $18.1bn ($18.09bn), up 5% (4% ex FX) from $17.3bn; US $10.6bn (+6%), international $7.5bn (+3%). Keytruda plus Keytruda Qlex sales $8.6bn (+6%), of which Qlex $830m; Winrevair $694m (+93%); Gardasil $2.0bn (+14%); Animal Health $1.7bn (+4%). Pharmaceutical growth benefited about $550m from timing of purchases. |
| 29 Oct 2026 | Ex 99.2 | Q3 2026 supplemental financial tables | Quarterly GAAP P&L: Q1 2026 net loss $4.2bn (EPS ($1.72)) and Q2 2026 net loss $1.3bn (EPS ($0.54)) on R&D of $12.6bn and $9.7bn; Q3 2026 net income $5.1bn. Nine month GAAP EPS ($0.21) versus $6.08. Nine month sales $51.0bn (+5%): US $29.1bn (+6%), international $21.8bn (+3%). Nine month Keytruda $23.6bn (+1%) plus Qlex $1.4bn; Winrevair $1.8bn (+85%); Animal Health $5.2bn (+8%). |