Amazon.com, Inc. (AMZN), Financial Analysis
Insights derived from analysing SEC filings. Independent analysis of Amazon.com, Inc. common stock, not a publication of the SEC. Figures are read from the 2023, 2024 and 2025 Forms 10-K, the 2025 and 2026 Forms 10-Q, the Forms 8-K and their earnings exhibits, the DEF 14A, Schedules 13D and 13G, Forms 13F, Forms 3, 4, 5 and 144 on the record for Central Index Key 1018724, together with the comparable filings of eight peers. Accession numbers for every filing used appear in Tables 36 and 37.
The argument in one page
Amazon books $716,924 million of net sales and earns most of its profit in one eighteenth of that revenue. AWS is 18.0% of net sales and 57.0% of consolidated operating income, so a point of AWS margin reaches group earnings at roughly three times its revenue weight. AWS margin fell from 37.0% to 35.4% in FY2025, and AWS grew 19.7%, slower than every rival cloud line on file: Google Cloud grew 35.8%, Oracle's cloud infrastructure line 76.9%, and Microsoft's Intelligent Cloud segment 29.7%.
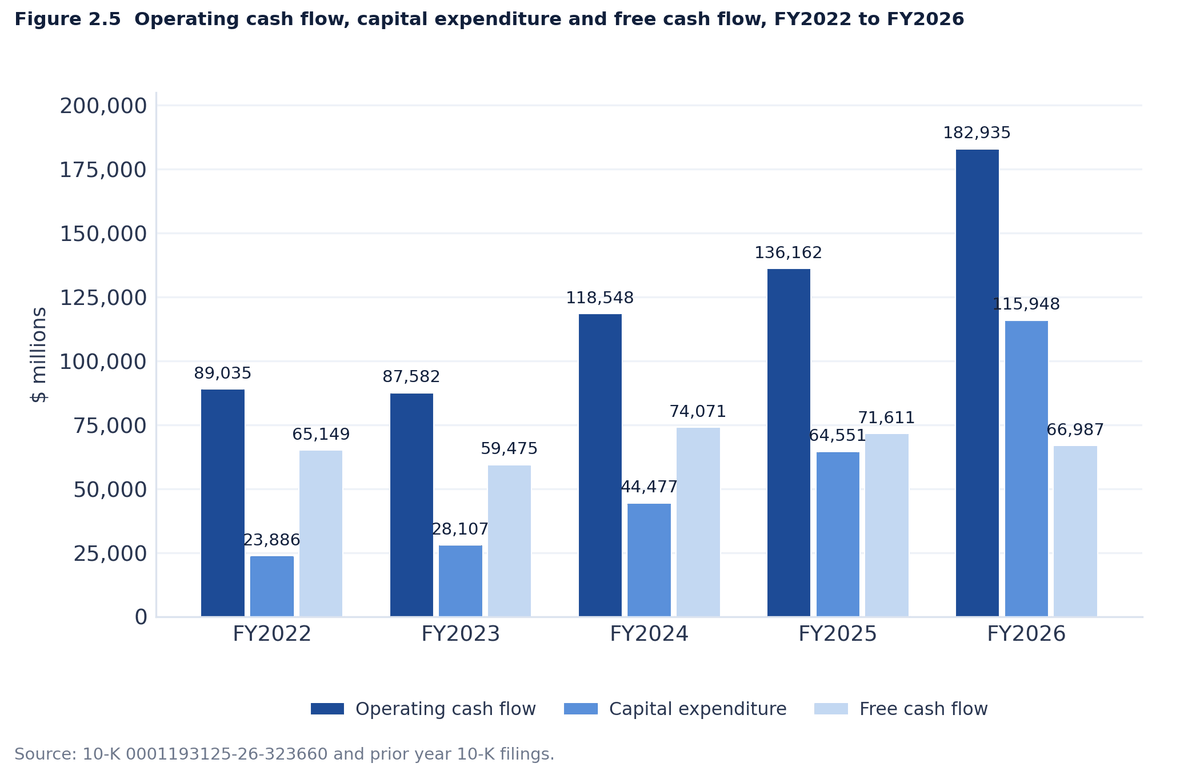
The capital behind that position has stopped being incremental. Cash purchases of property and equipment rose 58.8% to $131,819 million in FY2025 and took 94.5% of operating cash flow, cutting free cash flow measured as operating cash flow less gross purchases of property and equipment 76.6% to $7,695 million. That is the basis the capital intensity argument uses throughout; Amazon's own measure, which nets proceeds from sales and incentives against those purchases, gives $11,194 million, and chapter 2 bridges the two. AWS took 67.8% of property additions. Capital spending reached $173,028 million in the twelve months to 30 June 2026, 22.3% of revenue against 9.2% three years earlier. Item 1A never mentions capital expenditure, in either year.
Reported earnings have detached from operations at the same time. Of $80.9 billion of pretax income in the June 2026 quarter, $53.4 billion is nonoperating, almost all of it an unrealised upward revaluation of the Anthropic holding. Trailing twelve month reported earnings of $12.39 a share become $6.65 on a core basis, and the multiple paid goes from 20.6 times to 38.4 times.
Those three facts set the terms of the stock. A holder at $255.70 is underwriting AWS compounding in the mid twenties and a terminal multiple in the low thirties, and the sensitivity work in chapter 9 shows each can substitute for the other only within a narrow band.
1 Revenue & Business Model
Amazon.com, Inc. (NASDAQ: AMZN) booked net sales of $716,924 million in FY2025 across three reportable segments, and the profit sits in a much narrower place. AWS produced 18.0% of net sales and 57.0% of consolidated operating income. Over the five years to FY2025 the revenue mix moved 9.7 percentage points out of first party online stores and into AWS, advertising, subscriptions and third party seller commissions. AWS, advertising and subscriptions alone now supply 34.4% of net sales, against 26.6% in FY2021.
Consolidated net sales compounded at 11.1% a year from FY2021 to FY2025, adding $247,102 million. Consolidated operating income rose from $24,879 million to $79,975 million over the same period, and the operating margin from 5.3% to 11.2%. Amazon employed approximately 1,576,000 full time and part time people at 31 December 2025.
How the revenue is earned
Amazon serves seven customer sets: consumers, sellers, developers, enterprises, content creators, advertisers and employees. The recognition basis differs sharply between them, and that difference is the reason reported revenue understates the merchandise flowing through the stores. Amazon records gross revenue on goods it owns and sells, and only its net share on goods sold by third parties, for which it is not the seller of record. Seller fees are fixed fees, a percentage of sales, per unit activity fees, interest, or a combination.
Table 1. Revenue lines, recognition basis and FY2025 scale
| Revenue line | What is sold | Recognition basis | FY2025 net sales ($m) | Share of net sales |
|---|---|---|---|---|
| Online stores | Own inventory and digital media content, with related shipping fees | Gross | 269,287 | 37.6% |
| Third party seller services | Commissions, fulfilment and shipping fees on marketplace orders | Net share of the sale, as service revenue | 172,162 | 24.0% |
| AWS | Compute, storage, database, analytics and machine learning services | Gross, over the service period | 128,725 | 18.0% |
| Advertising services | Sponsored ads, display and video advertising sold to sellers, vendors, publishers and authors | Gross | 68,635 | 9.6% |
| Subscription services | Amazon Prime membership fees and digital video, music, audiobook and digital book subscriptions | Gross, over the service period | 49,619 | 6.9% |
| Physical stores | Goods a customer physically selects in a store | Gross | 22,561 | 3.1% |
| Other | Shipping services, healthcare services, video content licensing and credit card agreements | Not separately disclosed | 5,935 | 0.8% |
| Consolidated | 716,924 | 100.0% |
The gross to net distinction produces a wide gap between volume and revenue. Sellers supplied 61% of worldwide paid units in Q4 2025, and between 60% and 62% in every quarter since Q3 2024, yet third party seller services was 24.0% of FY2025 net sales. Amazon furnishes seller unit mix only quarterly in the Form 8-K earnings exhibit and publishes no audited annual figure for it. On the statement of operations the same shift appears as net service sales, which reached 58.7% of net sales in FY2025 against 48.5% in FY2021.
Segments

North America compounded at 11.1% a year and held its share of net sales at 59.5%. AWS compounded at 19.9% and took its share from 13.2% to 18.0%. International compounded at 6.1% and lost 4.6 points of share, held back by the FY2022 decline in net sales from $127,787 million to $118,007 million that took two years to recover.
Profit moved further than revenue. North America turned an operating loss of $(2,847) million in FY2022 into $29,619 million of operating income in FY2025, a swing of $32,466 million. International turned a $(7,746) million loss into $4,750 million of income. AWS operating margin reached 37.0% in FY2024 and then fell to 35.4% in FY2025 as technology and infrastructure spending rose to support AWS growth.
Amazon publishes no gross profit line and no gross profit by segment or by revenue line, stating that it regards operating income as the more meaningful measure given the diversity of its categories. Every gross profit figure in this document is therefore derived, and segment operating margin is the finest profitability cut the filings support.
Table 2. Net sales, operating income and operating margin by reportable segment, FY2021 to FY2025
| FY2021 | FY2022 | FY2023 | FY2024 | FY2025 | |
|---|---|---|---|---|---|
| Net sales ($m) | |||||
| North America | 279,833 | 315,880 | 352,828 | 387,497 | 426,305 |
| International | 127,787 | 118,007 | 131,200 | 142,906 | 161,894 |
| AWS | 62,202 | 80,096 | 90,757 | 107,556 | 128,725 |
| Consolidated | 469,822 | 513,983 | 574,785 | 637,959 | 716,924 |
| Operating income (loss) ($m) | |||||
| North America | 7,271 | (2,847) | 14,877 | 24,967 | 29,619 |
| International | (924) | (7,746) | (2,656) | 3,792 | 4,750 |
| AWS | 18,532 | 22,841 | 24,631 | 39,834 | 45,606 |
| Consolidated | 24,879 | 12,248 | 36,852 | 68,593 | 79,975 |
| Operating margin (%) | |||||
| North America | 2.6 | (0.9) | 4.2 | 6.4 | 6.9 |
| International | (0.7) | (6.6) | (2.0) | 2.7 | 2.9 |
| AWS | 29.8 | 28.5 | 27.1 | 37.0 | 35.4 |
| Consolidated | 5.3 | 2.4 | 6.4 | 10.8 | 11.2 |
The earnings base has broadened even as the revenue mix has concentrated. AWS supplied 74.5% of consolidated operating income in FY2021 and 57.0% in FY2025, as the stores businesses recovered. That reduces the single point dependence in the profit line, and 18.0% of revenue still carries the majority of the operating income, so any AWS margin compression reaches consolidated earnings at roughly three times its revenue weight.
Geography

The United States supplied 68.3% of FY2025 net sales and compounded at 11.7%, faster than the group. Germany, the United Kingdom and Japan together fell from 19.6% of net sales in FY2021 to 16.7% in FY2025, all three compounding below the group rate. Rest of world compounded at 14.1%, the fastest of any disclosed geography, and is the only line outside the United States gaining share.
The country table is a selling entity view. Amazon attributes net sales to countries primarily by the country focused store, and for AWS by the selling entity, so the rows record where a sale is booked rather than where the end customer sits. The country rows also do not nest inside the segment rows: Germany, the United Kingdom and Japan sit within the International segment, while the United States row absorbs AWS revenue booked by US selling entities. Amazon discloses no hedging or reconciling line inside this table.
Table 3. Net sales attributed to countries, FY2021 to FY2025 ($m)
| Country | FY2021 | FY2022 | FY2023 | FY2024 | FY2025 | CAGR | FY2025 share |
|---|---|---|---|---|---|---|---|
| United States | 314,006 | 356,113 | 395,637 | 438,015 | 489,657 | 11.7% | 68.3% |
| Germany | 37,326 | 33,598 | 37,588 | 40,856 | 45,900 | 5.3% | 6.4% |
| United Kingdom | 31,914 | 30,074 | 33,591 | 37,855 | 43,212 | 7.9% | 6.0% |
| Japan | 23,071 | 24,396 | 26,002 | 27,401 | 30,688 | 7.4% | 4.3% |
| Rest of world | 63,505 | 69,802 | 81,967 | 93,832 | 107,467 | 14.1% | 15.0% |
| Consolidated | 469,822 | 513,983 | 574,785 | 637,959 | 716,924 | 11.1% | 100.0% |
Currency added $4,409 million to FY2025 net sales. Amazon attributes an increase of $4.9 billion to International and a reduction of $(454) million to North America, and discloses no currency effect on AWS net sales. International grew 13% as reported and 10% excluding currency, while consolidated growth was 12% on both bases. Amazon presents this effect in its Effect of Foreign Exchange Rates table as $(4,409) million, because that column is the adjustment applied to reported net sales to restate them at prior year rates; a negative entry there means currency raised the reported figure.
Revenue lines


Advertising services compounded at 21.8% and AWS at 19.9%, against 4.9% for online stores. Online stores fell from 47.3% of net sales to 37.6% while still contributing 19.1% of the five year increase, because a slow growing line of that size still adds volume. Third party seller services and AWS between them supplied 54.7% of the $247,102 million increase in net sales.
Table 4. Net sales by product and service line, FY2021 to FY2025 ($m)
| Revenue line | FY2021 | FY2022 | FY2023 | FY2024 | FY2025 | CAGR | Share of the FY2021 to FY2025 increase |
|---|---|---|---|---|---|---|---|
| Online stores | 222,075 | 220,004 | 231,872 | 247,029 | 269,287 | 4.9% | 19.1% |
| Third party seller services | 103,366 | 117,716 | 140,053 | 156,146 | 172,162 | 13.6% | 27.8% |
| AWS | 62,202 | 80,096 | 90,757 | 107,556 | 128,725 | 19.9% | 26.9% |
| Advertising services | 31,160 | 37,739 | 46,906 | 56,214 | 68,635 | 21.8% | 15.2% |
| Subscription services | 31,768 | 35,218 | 40,209 | 44,374 | 49,619 | 11.8% | 7.2% |
| Physical stores | 17,075 | 18,963 | 20,030 | 21,215 | 22,561 | 7.2% | 2.2% |
| Other | 2,176 | 4,247 | 4,958 | 5,425 | 5,935 | 28.5% | 1.5% |
| Consolidated | 469,822 | 513,983 | 574,785 | 637,959 | 716,924 | 11.1% | 100.0% |
What is already contracted
Performance obligations under customer contracts with original terms longer than one year, primarily AWS, stood at approximately $244 billion at 31 December 2025, against approximately $177 billion a year earlier and $155.7 billion at the end of FY2023. That is growth of 37.9% in FY2025 and cover of 1.90 times FY2025 AWS net sales, up from 1.65 times a year earlier. The weighted average remaining life of these contracts is 4.1 years. Amazon rounds the 2024 and 2025 figures and states that the amount and timing of recognition depend on customer usage and on Amazon's own performance, which can extend past the original contractual duration, so the balance is a demand signal rather than a schedule. The same measure reached approximately $496 billion at 30 June 2026, which chapter 3 takes up.
Unearned revenue, which is cash already received for AWS prepayments and Prime memberships, was $25.0 billion at 31 December 2025 against $24.6 billion a year earlier. Of the opening balance, $17.4 billion was recognised as revenue during FY2025.
Three numbers carry the equity case out of this chapter. AWS is 18.0% of revenue and 57.0% of operating income, so group earnings track cloud pricing and cloud capacity more than they track retail volume. The contracted AWS book of roughly $244 billion is 1.9 times last year's AWS revenue and grew faster than AWS revenue did. And advertising, at 9.6% of net sales and compounding at 21.8%, is the fastest large line Amazon discloses, sold into demand that the stores business itself creates.
2 Financial Analysis & Ratios
Amazon runs two businesses inside one income statement. The operating business grew net sales 12.4% to $716.9 billion in 2025 and lifted operating margin to 11.2%, the highest of the five years. Alongside it sits a venture portfolio that produced $15.2 billion of unrealised gains in 2025 and $69.1 billion in the first half of 2026, 57% of reported pretax income for that half. The stock is asked to price both. The cost of the operating story is visible in cash. Net capital expenditure reached $128.3 billion in 2025 and $96.3 billion in the first half of 2026 alone, which turned free cash flow on Amazon's own measure, net of proceeds, from $38.2 billion in 2024 into $11.2 billion in 2025 and $(24.9) billion in the six months to June 2026.
What changed
Table 5. Consolidated results, year ended 31 December, $ millions
| 2024 | 2025 | Change | Change, % | |
|---|---|---|---|---|
| Net sales | 637,959 | 716,924 | 78,965 | 12.4 |
| Gross profit | 311,671 | 360,510 | 48,839 | 15.7 |
| Operating income | 68,593 | 79,975 | 11,382 | 16.6 |
| EBITDA | 121,388 | 145,731 | 24,343 | 20.1 |
| Other income (expense), net | (2,250) | 15,229 | 17,479 | n/a |
| Income before income taxes | 68,614 | 97,311 | 28,697 | 41.8 |
| Provision for income taxes | (9,265) | (19,087) | (9,822) | 106.0 |
| Net income | 59,248 | 77,670 | 18,422 | 31.1 |
| Diluted earnings per share, $ | 5.53 | 7.17 | 1.64 | 29.7 |
| Operating cash flow | 115,877 | 139,514 | 23,637 | 20.4 |
| Capital expenditure, net of proceeds | (77,658) | (128,320) | (50,662) | 65.2 |
| Free cash flow, Amazon's own measure | 38,219 | 11,194 | (27,025) | (70.7) |
| Margins | basis points | |||
| Gross margin | 48.9% | 50.3% | 143 | |
| Operating margin | 10.8% | 11.2% | 40 | |
| EBITDA margin | 19.0% | 20.3% | 130 | |
| Net margin | 9.3% | 10.8% | 155 | |
| Free cash flow margin, Amazon's own measure | 6.0% | 1.6% | (443) |
Gross profit and EBITDA are derived, since Amazon presents no gross profit line.
Two free cash flow measures run through this document, and the difference between them is one of definition. Both start from the same $139,514 million of FY2025 operating cash flow. Amazon's own measure deducts purchases of property and equipment net of $3,499 million of proceeds from property sales and incentives, so $128,320 million, and gives $11,194 million. Deducting instead the $131,819 million of gross cash purchases of property and equipment gives $7,695 million. The $3,499 million of proceeds is the whole of the gap. This chapter and chapter 9 quote Amazon's own measure and label it as such; the opening argument and the capital intensity work in chapter 8 use the gross purchases basis, because the question there is what the capital programme absorbs before any recovery on assets sold. Every figure in this document carries the basis it is measured on.
Operating income grew slower than gross profit because technology and infrastructure expense rose 22.6% to $108.5 billion, and because other operating expense reached $4,639 million against $763 million. That line carries a $2.5 billion charge for the settlement of the Federal Trade Commission lawsuit and $2.7 billion of estimated severance for planned role eliminations, together with the resolution of Italian tax disputes and physical store impairments. Tax expense doubled on a pretax base that grew 41.8%, because the Anthropic marks carry deferred tax; the deferred tax line swung from a $4,648 million benefit in 2024 to an $11,470 million charge in 2025.
Table 6. First half results, six months ended 30 June, $ millions
| H1 2025 | H1 2026 | Change, % | |
|---|---|---|---|
| Net sales | 323,369 | 382,125 | 18.2 |
| Gross profit | 165,584 | 198,884 | 20.1 |
| Operating income | 37,576 | 51,313 | 36.6 |
| Other income (expense), net | 3,866 | 69,062 | n/a |
| Income before income taxes | 42,536 | 120,691 | 183.7 |
| Net income | 35,291 | 92,902 | 163.2 |
| Net income excluding marks, after tax | 32,082 | 39,724 | 23.8 |
| Diluted earnings per share, $ | 3.27 | 8.53 | 160.9 |
| Operating cash flow | 49,530 | 71,419 | 44.2 |
| Capital expenditure, net of proceeds | (55,623) | (96,310) | 73.1 |
| Free cash flow, Amazon's own measure | (6,093) | (24,891) | n/a |
| AWS net sales | 60,140 | 79,819 | 32.7 |
| AWS operating income | 21,707 | 30,782 | 41.8 |
| Gross margin | 51.2% | 52.0% | 84 basis points |
| Operating margin | 11.6% | 13.4% | 181 basis points |
| AWS operating margin | 36.1% | 38.6% | 247 basis points |
| Effective tax rate | 17.0% | 23.0% |
Net income excluding marks removes other income (expense), net at the period effective tax rate.
The first half of 2026 is the strongest operating half in the record. Revenue growth accelerated from 12.4% for the full year 2025 to 18.2%, and AWS growth from 19.7% to 32.7% with margin expanding at the same time. Interest expense doubled to $2,114 million as long term debt went from $65.6 billion to $128.9 billion, with $67.0 billion of new long term debt issued in the half.

Trailing twelve month operating margin bottomed at 2.4% in the year to December 2022 and reached 12.1% in the year to June 2026, on trailing revenue of $775.7 billion and operating income of $93.7 billion. Revenue kept compounding through the margin collapse: net sales grew at a 13.2% compound annual rate from 2020 to 2025 while operating income compounded at 28.4%.
Segments

AWS margin fell from 37.0% to 35.4% even as revenue grew 19.7%, because AWS segment depreciation rose 61.0% to $21.5 billion. North America margin reached 6.9% and International 2.9%; International first turned profitable in 2024 after losses of $(7,746) million in 2022 and $(2,656) million in 2023.
Server useful lives changed twice inside this window, which breaks the comparability of the AWS margin line. The 2023 10-K disclosed that extending the useful life of servers from five years to six, effective 1 January 2024, was expected to raise 2024 operating income by about $3.1 billion. The 2025 10-K discloses that reducing the useful life of a subset of servers and networking equipment from six years to five, effective 1 January 2025, raised 2025 depreciation by $1.4 billion and reduced 2025 net income by $1.0 billion. Amazon allocates neither effect to segments, so the 2024 step up and the 2025 step down in AWS margin are both overstated in the reported numbers against what the underlying operations imply.
Ratio analysis
Table 7. Ratio analysis, year ended 31 December
| 2021 | 2022 | 2023 | 2024 | 2025 | |
|---|---|---|---|---|---|
| Growth, % | |||||
| Net sales | 21.7 | 9.4 | 11.8 | 11.0 | 12.4 |
| AWS net sales | 37.1 | 28.8 | 13.3 | 18.5 | 19.7 |
| Operating income | 8.6 | (50.8) | 200.9 | 86.1 | 16.6 |
| Net income | 56.4 | (108.2) | 1,217.7 | 94.7 | 31.1 |
| Margin, % | |||||
| Gross | 42.0 | 43.8 | 47.0 | 48.9 | 50.3 |
| Operating | 5.3 | 2.4 | 6.4 | 10.8 | 11.2 |
| EBITDA | 12.6 | 10.5 | 14.9 | 19.0 | 20.3 |
| Net | 7.1 | (0.5) | 5.3 | 9.3 | 10.8 |
| North America operating | 2.6 | (0.9) | 4.2 | 6.4 | 6.9 |
| International operating | (0.7) | (6.6) | (2.0) | 2.7 | 2.9 |
| AWS operating | 29.8 | 28.5 | 27.1 | 37.0 | 35.4 |
| Return, % | |||||
| Return on equity | 28.8 | (1.9) | 17.5 | 24.3 | 22.3 |
| Return on assets | 9.0 | (0.6) | 6.1 | 10.3 | 10.8 |
| Return on invested capital, pretax | 19.5 | 6.4 | 15.4 | 23.6 | 20.9 |
| Effective tax rate | 12.6 | 54.2 | 19.0 | 13.5 | 19.6 |
| Leverage | |||||
| Total debt, $m | 50,553 | 70,542 | 67,182 | 58,000 | 68,836 |
| Total debt to equity, % | 36.6 | 48.3 | 33.3 | 20.3 | 16.7 |
| Total debt to EBITDA, times | 0.85 | 1.30 | 0.79 | 0.48 | 0.47 |
| Net cash, $m | 45,496 | (516) | 19,598 | 43,202 | 54,193 |
| Interest cover, times | 13.8 | 5.2 | 11.6 | 28.5 | 35.2 |
| Liquidity, times | |||||
| Current ratio | 1.14 | 0.94 | 1.05 | 1.06 | 1.05 |
| Quick ratio | 0.91 | 0.72 | 0.84 | 0.87 | 0.88 |
| Efficiency | |||||
| Asset turnover, times | 1.27 | 1.16 | 1.16 | 1.11 | 0.99 |
| Inventory turns, times | 9.7 | 8.6 | 9.0 | 9.7 | 9.8 |
| Days inventory outstanding | 37.8 | 42.4 | 40.6 | 37.8 | 37.1 |
| Days sales outstanding | 22.3 | 26.7 | 30.0 | 30.8 | 31.4 |
| Days payables outstanding | 101.3 | 100.0 | 98.6 | 100.3 | 110.7 |
| Cash conversion cycle, days | (41.2) | (30.9) | (28.0) | (31.7) | (42.2) |
| Net capital expenditure to net sales, % | 11.8 | 11.3 | 8.4 | 12.2 | 17.9 |
| Operating cash flow to EBITDA, % | 78.1 | 86.3 | 99.3 | 95.5 | 95.7 |
| Stock based compensation to net sales, % | 2.7 | 3.8 | 4.2 | 3.5 | 2.7 |
Returns use average opening and closing balances. Invested capital is equity plus total debt plus long term lease liabilities, less cash and current marketable securities. Return on invested capital is stated before tax, since the reported effective rate is distorted by the marks. Total debt is taken from the debt note and includes the current portion, which the balance sheet reports inside accrued expenses. Net cash here is cash and current marketable securities less total debt and excludes lease liabilities; the peer table in chapter 4 uses a net debt definition that includes them. The 2022 effective tax rate is a benefit recognised on a pretax loss.
Amazon pays no dividend. It has repurchased no stock since the $6.0 billion bought in 2022; treasury stock has stood at $7,837 million at every balance sheet date since 31 December 2022. Every dollar of retained profit has gone back into the asset base.

Returns peaked in 2024 and turned down in 2025. Pretax return on invested capital fell 273 basis points to 20.9% while operating income rose 16.6%, because invested capital grew 38.4% to $444.2 billion. Asset turnover fell below one for the first time in the period, to 0.99 times. This is the central trade in the stock: margin and absolute profit are both rising, and the denominator is rising faster.
Cash flow

Net capital expenditure took 92.0% of operating cash flow in 2025 and 134.9% in the first half of 2026. Free cash flow on Amazon's own definition fell from $38,219 million to $11,194 million in 2025 and was $(24,891) million in the six months to June 2026. Operating cash flow grew 20.4% in 2025 and 44.2% in the first half of 2026, and converts 95.7% of EBITDA to cash. The gap is spending, and management expects cash capital expenditure to increase again in 2026.
Cash taxes fell even as book tax rose. The One Big Beautiful Bill Act of 2025 restored 100% accelerated depreciation on qualified property and immediate expensing of domestic research and development, both retroactive into 2025. Cash paid for income taxes fell from $12,308 million to $8,295 million while the reported provision rose from $9,265 million to $19,087 million. Amazon expects a similar cash effect in 2026.

Suppliers still fund the working capital. Days payables outstanding widened from 100.3 to 110.7 in 2025, more than offsetting a 0.6 day rise in days sales outstanding, and pushed the cash conversion cycle to (42.2) days, the most negative of the five years. Inventory turned 9.8 times, the fastest of the period.
Reported earnings against core earnings
Table 8. Reported profit bridged to operating profit, $ millions
| 2021 | 2022 | 2023 | 2024 | 2025 | H1 2026 | |
|---|---|---|---|---|---|---|
| Income before income taxes, as reported | 38,151 | (5,936) | 37,557 | 68,614 | 97,311 | 120,691 |
| Less other income (expense), net | (14,633) | 16,806 | (938) | 2,250 | (15,229) | (69,062) |
| Income before income taxes, excluding marks | 23,518 | 10,870 | 36,619 | 70,864 | 82,082 | 51,629 |
| As a percentage of net sales | 5.0 | 2.1 | 6.4 | 11.1 | 11.4 | 13.5 |
| Operating income bridge, 2025 | ||||||
| Operating income, as reported | 79,975 | |||||
| Federal Trade Commission settlement | 2,500 | |||||
| Estimated severance for role eliminations | 2,700 | |||||
| Operating income excluding these charges | 85,175 | |||||
| Operating margin excluding these charges | 11.9% |
Memorandum: 2025 depreciation includes $1,400 million from the reduction in server useful life, which reduced 2025 net income by $1,000 million.

Other income (expense), net has swung between $(16,806) million and $69,062 million in six periods and none of it is cash. Stripping it produces a clean picture: pretax income excluding marks compounded from $23.5 billion in 2021 to $82.1 billion in 2025 and reached $51.6 billion in the first half of 2026 alone, a margin of 13.5% of net sales. Reported net income of $92,902 million for the first half falls to about $39,724 million on the same basis, growth of 23.8% rather than 163.2%.
The marks come from Anthropic and, from the first quarter of 2026, OpenAI. Amazon invested $8.0 billion in Anthropic convertible notes between the third quarter of 2023 and the fourth quarter of 2025, then $5.0 billion in Series G and $5.0 billion in Series H nonvoting preferred stock in the second quarter of 2026, and $15.0 billion in OpenAI Series C preferred stock in the first quarter of 2026. At 30 June 2026 the Anthropic nonvoting preferred stock was carried at about $92.5 billion and the convertible notes at about $97.9 billion. Those two positions, $190.4 billion, plus the OpenAI investment, account for $144.8 billion of the $161.5 billion increase in noncurrent other assets over the six months.
Two features of these holdings govern how the income statement reads. The notes are classified as available for sale, so their unrealised gain sits in accumulated other comprehensive income and reaches earnings only on conversion. That pretax unrealised gain stood at $92.0 billion at 30 June 2026 against $39.5 billion at 31 December 2025, and it is a pipeline of future reported gains with no cash and no operating content. The balance sheet line, which is net of tax, rose from $(34) million at the end of 2024 to $28,230 million at the end of 2025 and $66,287 million at 30 June 2026. Both the notes and the preferred stock are also Level 3 fair value measurements built from valuation methods and management assumptions rather than quoted prices, so the size and timing of those gains is a matter of estimate. The 2025 10-K, filed on 5 February 2026, flagged a first quarter 2026 upward adjustment of about $12 billion and a reclassification gain of about $3 billion; the six months to June recorded $62,814 million and $4,479 million, with $50,486 million of the upward adjustment falling in the second quarter on Anthropic's later fundings.
Amazon has also committed a facility of up to $20.0 billion to Anthropic, drawable as compute delivery milestones are reached, reduced to $15.0 billion by the Series H investment. Nothing was available to draw at inception.
Balance sheet
Leverage remains light on any conventional measure. Total debt to EBITDA was 0.47 times at the end of 2025 and interest cover 35.2 times. That picture changed inside the first half of 2026: total debt rose from $68,836 million to $132,995 million, net cash of $54,193 million became net debt of $10,007 million, both on the Table 7 definition that excludes lease liabilities, and total debt to equity rose from 16.7% to 24.1%. Interest cover for the half was still 24.3 times. Liquidity is thin and stable, with a current ratio of 1.05 and a quick ratio of 0.88 at the end of 2025; the negative cash conversion cycle is what makes that workable.
3 MD&A & Management Commentary
Management has switched the story from margin to capacity. The MD&A now presents supply as the constraint: AWS grew 37% excluding foreign exchange in Q2 2026 against 17% a year earlier, contracted commitments not yet recognised reached about $496 billion at 30 June 2026 against about $195 billion a year earlier, and trailing twelve month free cash flow, Amazon's own headline measure, turned to an outflow of $7.6 billion. The 2026 capital plan moved from about $200 billion to approximately $220 billion between February and July, and the reason management gives is the price of memory. For the stock, the disclosure that matters is the gap between a $496 billion book of long dated cloud commitments and a cash outflow that management says will persist until the data centres come online.
What management flags itself
Table 9. Trends and risks management names, with the document and date each came from
| Trend or risk management names | What management says | Source | Date |
|---|---|---|---|
| AWS growth acceleration | "AWS is booming, growing 36.7% year-over-year in Q2", called the fastest growth in 18 quarters; 37% excluding foreign exchange against 17% in Q2 2025 | Form 8-K EX-99.1, 0001018724-26-000024 | 2026-07-30 |
| AWS capacity short of demand | "Even at that amount, we will still not have enough capacity to meet all the demand we have in 2026, and I believe this dynamic will also be true in 2027, too." | Q2 2026 earnings call, Andy Jassy | 2026-07-30 |
| 2026 capital expenditure plan | "we expect to invest about $200 billion in capital expenditures across Amazon in 2026, and anticipate strong long-term return on invested capital" | Form 8-K EX-99.1, 0001018724-26-000002 | 2026-02-05 |
| 2026 capital plan raised | "We now believe we will spend approximately $220 billion in cash CapEx in 2026." | Q2 2026 earnings call, Andy Jassy | 2026-07-30 |
| Memory and component supply | Forward looking factor list adds "resource and supply volatility, including for memory chips", absent from the FY2024 Form 10-K | Form 10-K Item 7, 0001018724-26-000004 | 2026-02-05 |
| Memory cost inflation | "the cost of these components, particularly memory, has skyrocketed" | Q1 2026 earnings call, Andy Jassy | 2026-04-29 |
| Capital spending hurts near term cash | Technology and infrastructure spending "will increase over time, which can negatively impact short-term free cash flow", a clause absent from the FY2024 Form 10-K | Form 10-K Item 7, 0001018724-26-000004 | 2026-02-05 |
| Capital expenditure still rising | Technology infrastructure and fulfilment capacity spending, "both of which we expect to increase in 2026" | Form 10-Q Item 2, 0001018724-26-000026 | 2026-07-30 |
| Additional financing to come | "We expect to undertake additional financing activities in 2026." | Form 10-Q Item 2, 0001018724-26-000026 | 2026-07-30 |
| Tariff and trade policy | Overview cites "unpredictable shifts in global tariff and trade policies"; Q2 2026 carried about $640 million of IEEPA tariff refunds, "the significant majority of refunds we expect to receive" | Form 10-Q Items 1 and 2, 0001018724-26-000026 | 2026-07-30 |
| Energy contract marks | Technology and infrastructure includes net unrealised energy derivative gains of $551 million in Q2 2026, "primarily related to AWS", on about 270 million megawatt hours with a weighted average life near 15 years | Form 10-Q Note 1, 0001018724-26-000026 | 2026-07-30 |
| Anthropic and OpenAI marks | Other income of $53.4 billion in Q2 2026, of which $50.5 billion is an upward adjustment on Anthropic nonvoting preferred stock; $15.9 billion of discrete tax expense in the half | Form 10-Q Items 1 and 2, 0001018724-26-000026 | 2026-07-30 |
| Prime Day timing | Q3 2026 growth guidance of 9% to 12%; "Excluding the impact of Prime Day in both 2025 and 2026, third quarter 2026 year-over-year growth would be nearly 400 basis points higher." | Form 8-K EX-99.1, 0001018724-26-000024 | 2026-07-30 |
| New venture cost drag | Q1 2026 guidance carried "approximately $1 billion of higher year-over-year Amazon Leo costs", plus quick commerce investment and sharper international prices | Form 8-K EX-99.1, 0001018724-26-000002 | 2026-02-05 |
| Restructuring and legal charges | FY2025 operating income absorbed a $2.5 billion FTC settlement and $2.7 billion of estimated severance for planned role eliminations | Form 10-K Item 7, 0001018724-26-000004 | 2026-02-05 |
| Server useful lives | Servers and networking equipment carry a five to six year life; servers moved from five to six years in 2024, then a subset moved from six to five years in 2025 | Form 10-K Note 1, 0001018724-26-000004 | 2026-02-05 |
The capacity story in numbers

The backlog note is the strongest disclosure in the filings and the one management leans on least in the release. Commitments on contracts with original terms over one year rose from about $195 billion at 30 June 2025 to about $496 billion at 30 June 2026, and the weighted average remaining life stretched from 4.0 years to 6.4 years. That is 3.3 times AWS trailing twelve month net sales of $148.4 billion, against 1.7 times a year earlier. Two disclosed contract expansions account for much of the step: an increase of $100.0 billion over 8.0 years in the OpenAI arrangement in Q1 2026, and an expansion of more than $100.0 billion over 10.0 years with Anthropic in Q2 2026.

Trailing twelve month capital expenditure net of proceeds rose from $88.0 billion to $169.0 billion in six quarters, or from 13.5% to 21.8% of trailing net sales. Operating cash flow grew 33% over the same period to $161.4 billion and could not keep pace. Quarterly cash capital expenditure reached $53.1 billion in Q2 2026 against $31.4 billion in Q2 2025. Management frames the lag as timing: on the Q1 2026 call Andy Jassy described the pattern as laying out cash for "land, power, buildings, chips, servers, and networking gear in advance of when we can monetize it, typically 6 to 24 months before we start billing customers".

Guidance against delivered
Table 10. Quarterly guidance as furnished on Form 8-K, against reported results ($ millions)
| Quarter | Guidance given | Net sales guided | Net sales reported | Against top end | Operating income guided | Operating income reported | Against top end |
|---|---|---|---|---|---|---|---|
| Q4 2025 | 2025-10-30 | 206,000 to 213,000 | 213,386 | 386 | 21,000 to 26,000 | 24,977 | (1,023) |
| Q1 2026 | 2026-02-05 | 173,500 to 178,500 | 181,519 | 3,019 | 16,500 to 21,500 | 23,852 | 2,352 |
| Q2 2026 | 2026-04-29 | 194,000 to 199,000 | 200,606 | 1,606 | 20,000 to 24,000 | 27,461 | 3,461 |
| Q3 2026 | 2026-07-30 | 197,000 to 202,000 | n/a | n/a | 22,500 to 26,500 | n/a | n/a |
Net sales landed above the guided top end in each of the three closed quarters. Operating income cleared the top of the range in Q1 and Q2 2026 by $2.4 billion and $3.5 billion. Q3 2026 guidance is the first in the sequence that implies deceleration, and management attributes almost 400 basis points of it to the placement of Prime Day rather than to demand.
Reported operating income against the charges management names
Table 11. Items management identifies inside reported operating income ($ millions)
| Period | Reported operating income | FTC lawsuit settlement | Estimated severance | Italy tax disputes and a lawsuit | Asset impairments | Before the items named |
|---|---|---|---|---|---|---|
| Q3 2025 | 17,422 | 2,500 | 1,800 | n/a | n/a | 21,722 |
| Q4 2025 | 24,977 | n/a | 730 | 1,100 | 610 | 27,417 |
| FY2025 | 79,975 | 2,500 | 2,700 | n/a | n/a | 85,175 |
The Q4 2025 earnings release states that without its three special charges operating income would have been $27.4 billion. Two disclosure limits sit in this table. The Form 10-K puts full year estimated severance at $2.7 billion with $1.8 billion in Q3 2025, and the Q4 release names $730 million in Q4, leaving about $170 million of the year's severance unallocated between the two documents. The Q4 release also bundles the Italy stores tax resolution with an unnamed lawsuit settlement in a single $1.1 billion figure, so neither component is separately quantified.
What changed in the MD&A language
Table 12. Overview and forward looking language, FY2024 Form 10-K against FY2025 Form 10-K
| Topic | FY2024 Form 10-K, filed 2025-02-06 | FY2025 Form 10-K, filed 2026-02-05 |
|---|---|---|
| Named external risks | Foreign exchange, global economic conditions, customer demand and spending, inflation, interest rates | Adds energy prices, tariff and trade policies, and "resource and supply volatility, including for memory chips" |
| Ability to quantify | Macroeconomic factors "difficult to isolate and quantify" | Macroeconomic factors "difficult to predict, isolate, and quantify" |
| Artificial intelligence | Named as a technology trend supporting investment in AWS | Adds "we expect to continue making additional investments in our artificial intelligence initiatives" to the results overview |
| Technology spending | Will increase "as we add computer scientists, designers, software and hardware engineers, and merchandising employees" | Will increase "which can negatively impact short-term free cash flow, as we add infrastructure and employees" for artificial intelligence and machine learning |
| Capital expenditure outlook | "We expect cash capital expenditures to increase in 2025, primarily driven by investments in technology infrastructure" | Technology infrastructure and fulfilment capacity, "both of which we expect to increase in 2026" |
| Financing options | Liquidity paragraph ends at repurchasing, refinancing "or otherwise restructure our debt for strategic reasons" | Adds "or access capital through other financing arrangements", and the 2026 Forms 10-Q add "and other financing activities" to the twelve month sufficiency statement |
Where management's framing and the numbers part company
The 2026 capital figure investors quote appears in no EDGAR document. The $220 billion came from the Q2 2026 earnings call on 30 July 2026. The Form 10-Q filed the same day says only that technology infrastructure and fulfilment capacity spending are expected "to increase in 2026", with no amount. The $200 billion plan from February does appear in a furnished Form 8-K exhibit. Anyone modelling 2026 capital expenditure from EDGAR alone is working with a number that management superseded on a call.
Reported profit is now dominated by items management itself calls nonoperating. Q2 2026 net income of $62.6 billion sits against operating income of $27.5 billion; other income of $53.4 billion is 85% of net income, and $50.5 billion of that is a Level 3 upward adjustment on Anthropic nonvoting preferred stock with no cash movement. The carrying value of equity investments in private companies moved from $16.2 billion at 31 December 2025 to $122.3 billion at 30 June 2026, so the same mechanism can run in reverse.
The AWS margin carries a mark as well as a mix. AWS reported a 39.4% operating margin in Q2 2026 against 32.9% a year earlier. Technology and infrastructure in that quarter includes $551 million of net unrealised gains on energy contracts subject to derivative accounting, "primarily related to AWS", which is 1.3 points of the AWS margin. Management flags the item in Note 1, says it does not affect cash flows, and excludes remeasurements from Q3 2026 guidance. The release headline does not mention it.
Set against these, management's supporting evidence for the capacity claim is disclosed rather than asserted. The backlog note, the contract life, the two named contract expansions and the five to six year server life in the property note all sit in the filings, and Andy Jassy's call remark that "The servers currently have a useful life of at least five to six years, and most of our AI capacity these days is being contracted for at least five-year terms" matches the useful life table in the Form 10-K.
Earnings call transcripts are not EDGAR documents. Quotations from the second quarter 2026 call of 30 July 2026 and the first quarter 2026 call of 29 April 2026 were each corroborated across two independent transcript publications before use.
4 Sector & Competitor Analysis
Amazon is two businesses priced as one. Strip out AWS and the remaining $588.2 billion of revenue earned a 5.8% operating margin in fiscal 2025, against a 1.4% to 4.9% band across the retail panel. AWS earned 35.4% on $128.7 billion, inside the 30.6% to 46.8% band of the platform panel. The stock trades at 35.1 times operating income against a peer median of 30.1 times, so the market already pays for the platform half while funding the retail half.
Two sectors, two panels
Amazon files under SIC 5961, retail catalogue and mail order houses. Its largest profit pool is cloud infrastructure. A single blended peer set would average a 4% margin retailer against a 47% margin software company and produce a midpoint that describes nobody. Panel A holds the companies that compete for the retail and marketplace half, Panel B the companies that compete for the cloud and platform half, and Amazon appears in both. Every ratio is computed the same way in both panels, so each comparison rests on a like business at the cost of comparing Amazon twice.
The rule is mechanical and was applied to the latest annual report on file at 3 September 2026. Panel A takes SEC registrants whose SIC code is 5961, Amazon's own code, or 5331, retail variety stores, with revenue above $30 billion in the most recent audited year. That yields Walmart, Costco, Target and Coupang; Coupang is the only other SIC 5961 registrant above the threshold. Panel B takes registrants whose SIC code is 7370 or 7372, with revenue above $50 billion in the most recent audited year and a separately reported cloud or cloud infrastructure revenue line. That yields Microsoft, Alphabet and Oracle.
Two names fail the rule and are worth naming. Alibaba sells online and sells cloud, which makes it a competitor on both sides, and it files on Form 20-F under SIC 7389 and reports in renminbi, so it fails both the code screen and the currency basis. International Business Machines passes the code and revenue screens and fails the segment screen, because it reports Software, Consulting and Infrastructure with no standalone cloud revenue line.
The sector
Cloud infrastructure services generated $419 billion of revenue in calendar 2025, with fourth quarter revenue of $119.1 billion growing 30% on the year. Amazon held 28% of that fourth quarter, Microsoft 21% and Google 14%, on Synergy Research Group estimates published 5 February 2026. AWS reported $128.7 billion of revenue for the year, which is 30.7% of the $419 billion figure. The gap against the 28% share estimate reflects a different market definition rather than a disagreement between the two numbers.
Retail is the slower half. Electronic commerce reached 16.4% of United States retail sales in the second quarter of 2026, against 15.5% a year earlier, on United States Census Bureau series ECOMPCTNSA retrieved from the Federal Reserve Bank of St. Louis and updated 18 August 2026. That is nine tenths of a percentage point of share migration a year into a category Amazon already leads.
The two sectors set margins by opposite mechanisms. Retail margin is a function of scale against a fixed cost base of stores, warehouses and delivery, and it compresses when volume growth stalls: Target's revenue fell 1.7% and its operating margin from 5.2% to 4.9%. Cloud margin is a function of utilisation against a depreciating asset base, and it compresses when capacity is added ahead of demand. AWS shows exactly that, with revenue up 19.7% and margin down from 37.0% to 35.4%.
Table 13. Peer comparison on a common definition, latest audited year
Revenue in $ millions. Growth is on the prior fiscal year. Gross margin is revenue less the filer's own cost of sales or cost of revenues line. Return on invested capital is operating income after the company's effective tax rate, over period end equity plus interest bearing debt plus lease liabilities less cash and short term investments. Net debt includes lease liabilities. Enterprise value to operating income uses the market prices described under Price basis.
| Company | Fiscal period | Revenue | Growth | Gross margin | Operating margin | Return on capital | Net debt / EBITDA | EV / operating income |
|---|---|---|---|---|---|---|---|---|
| Panel A, retail and marketplace | ||||||||
| Amazon.com, Inc. | 12 months to 31 Dec 2025 | 716,924 | 12.4% | 50.3% | 11.2% | 14.0% | 0.3x | 35.1x |
| Walmart Inc. | 12 months to 31 Jan 2026 | 713,163 | 4.7% | 24.9% | 4.2% | 13.9% | 1.3x | 30.1x |
| Costco Wholesale Corporation | 12 months to 31 Aug 2025 | 275,235 | 8.2% | 12.8% | 3.8% | 32.6% | (0.4x) | 39.2x |
| Target Corporation | 12 months to 31 Jan 2026 | 104,780 | (1.7%) | 27.9% | 4.9% | 12.8% | 1.8x | 17.4x |
| Coupang, Inc. | 12 months to 31 Dec 2025 | 34,534 | 14.1% | 29.4% | 1.4% | 5.8% | (1.7x) | 57.2x |
| Panel B, cloud and platform | ||||||||
| Amazon.com, Inc. | 12 months to 31 Dec 2025 | 716,924 | 12.4% | 50.3% | 11.2% | 14.0% | 0.3x | 35.1x |
| Microsoft Corporation | 12 months to 30 Jun 2026 | 331,839 | 17.8% | 67.9% | 46.8% | 25.3% | 0.3x | 24.2x |
| Alphabet Inc. | 12 months to 31 Dec 2025 | 402,836 | 15.1% | 59.7% | 32.0% | 30.2% | (0.4x) | 31.6x |
| Oracle Corporation | 12 months to 31 May 2026 | 67,357 | 17.3% | 65.8% | 30.6% | 10.1% | 4.5x | 27.0x |
| Amazon split into its two halves | ||||||||
| Amazon excluding AWS | 12 months to 31 Dec 2025 | 588,199 | 10.9% | n/a | 5.8% | n/a | n/a | n/a |
| AWS | 12 months to 31 Dec 2025 | 128,725 | 19.7% | n/a | 35.4% | n/a | n/a | n/a |
Amazon excluding AWS earns 5.8%, ahead of every Panel A peer: Target at 4.9%, Walmart at 4.2%, Costco at 3.8% and Coupang at 1.4%. AWS at 35.4% sits between Oracle at 30.6% and Microsoft at 46.8%. Amazon's consolidated 11.2% belongs to neither group.

Amazon is the only company on the chart in the empty middle. It grows faster than every Panel A peer except Coupang, whose revenue is 4.8% of Amazon's. Its margin is a third of Oracle's and under a quarter of Microsoft's. Walmart matches Amazon almost exactly on revenue, $713.2 billion against $716.9 billion, and produces $29.8 billion of operating income against Amazon's $80.0 billion.
The cloud comparison

Table 14. Cloud lines as each company discloses them
Revenue in $ millions. Amazon, Microsoft and Alphabet report cloud inside a reportable segment that carries an operating income line. Oracle reports cloud inside its revenue disaggregation note and gives no cloud operating income.
| Line | Basis | Fiscal period | Revenue | Prior year | Growth | Operating margin |
|---|---|---|---|---|---|---|
| Microsoft Intelligent Cloud | reportable segment | 12 months to 30 Jun 2026 | 137,791 | 106,265 | 29.7% | 41.3% |
| Amazon AWS | reportable segment | 12 months to 31 Dec 2025 | 128,725 | 107,556 | 19.7% | 35.4% |
| Alphabet Google Cloud | reportable segment | 12 months to 31 Dec 2025 | 58,705 | 43,229 | 35.8% | 23.7% |
| Oracle total cloud | revenue disaggregation | 12 months to 31 May 2026 | 33,989 | 24,506 | 38.7% | n/a |
| Oracle cloud infrastructure | revenue disaggregation | 12 months to 31 May 2026 | 18,101 | 10,234 | 76.9% | n/a |
| Microsoft server products and cloud services | revenue disaggregation | 12 months to 30 Jun 2026 | 129,425 | 98,435 | 31.5% | n/a |
AWS grows slower than every rival line on the table. Google Cloud grew 35.8% and lifted its operating margin from 14.1% to 23.7%, the sharpest profitability improvement anywhere in the peer set. Oracle's cloud infrastructure line grew 76.9% off a base of $10.2 billion. Microsoft's Intelligent Cloud segment is larger than AWS at $137.8 billion, and it carries server licences and enterprise services alongside Azure, so it is not a like for like cloud line.
The lines are not defined identically. Intelligent Cloud and AWS are reportable segments audited on a segment basis. Oracle's cloud figures and Microsoft's server products and cloud services figure come from revenue disaggregation notes and carry no allocated cost. Growth rates compare cleanly within a line across years. Levels compare only loosely across companies.
Returns and the balance sheet

Amazon returns 14.0% on invested capital, fourth of eight, ahead of Walmart at 13.9% and Target at 12.8% and behind Costco at 32.6%, Alphabet at 30.2% and Microsoft at 25.3%. Costco leads on a capital base of $23.8 billion, a nineteenth of Amazon's $458.4 billion, because it holds $15.3 billion of cash and short term investments against only $5.8 billion of debt and $4.1 billion of lease liabilities.
Leverage separates the panel more sharply than returns. Amazon carries 0.3 times net debt to EBITDA, matching Microsoft. Oracle carries 4.5 times, having taken its borrowings to $129.5 billion and its lease liabilities to $37.9 billion to fund cloud infrastructure capacity. Costco, Alphabet and Coupang hold net cash. Amazon's $47.4 billion of net debt on this definition, which includes lease liabilities, against $145.7 billion of EBITDA leaves the balance sheet as an option rather than a constraint.
Reported earnings against operating earnings across the panel
Three companies in the peer set reported income before tax well above operating income in the latest year, on nonoperating marks rather than on operations. Ranking them on net income would rank them by the volatility of their investment portfolios.
Table 15. Operating income against income before tax, latest audited year, $ millions
| Company | Operating income | Income before tax | Nonoperating contribution | Net income |
|---|---|---|---|---|
| Amazon.com, Inc. | 79,975 | 97,311 | 17,336 | 77,670 |
| Alphabet Inc. | 129,039 | 158,826 | 29,787 | 132,170 |
| Microsoft Corporation | 155,237 | 165,934 | 10,697 | 133,749 |
| Walmart Inc. | 29,825 | 29,469 | (356) | 21,893 |
| Costco Wholesale Corporation | 10,383 | 10,818 | 435 | 8,099 |
| Target Corporation | 5,117 | 4,767 | (350) | 3,705 |
| Coupang, Inc. | 473 | 597 | 124 | 208 |
| Oracle Corporation | 20,606 | 19,554 | (1,052) | 17,087 |
Amazon's $17.3 billion contribution is $4.4 billion of interest income less $2.3 billion of interest expense, plus $15.2 billion of other income. Inside that other income sit a $7.7 billion upward price adjustment on equity securities without readily determinable fair values and a $5.6 billion reclassification from accumulated other comprehensive income on debt securities. Neither is cash from operations. Alphabet's $29.8 billion contribution is larger still, and lifted its net income above its operating income. Every ratio in this chapter rests on operating income for that reason.
What the comparison cannot settle
Fiscal years do not align. The panel spans year ends from 31 August 2025 to 30 June 2026, and each company contributes its latest audited year rather than a common period. Costco is the widest gap: its FY2026 Form 10-K was not on file at the price date, so Costco stands a full year behind the rest of the panel.
Gross margin is not comparable across the panel and is shown for completeness rather than for ranking. Amazon's cost of sales excludes fulfilment and technology and infrastructure, which it reports as separate operating expense lines, which is why its 50.3% reads closer to a software company than to Walmart's 24.9%. Walmart, Target and Costco carry distribution costs inside cost of sales. Operating margin is the only margin on Table 13 that rests on the same expense base for every company.
Target reports finance lease obligations inside long term debt, so its lease line covers operating leases only, which changes the split between the two components of net debt and not the total. Amazon names the largest parts of its $15.2 billion of other income and leaves an unnarrated residual of $1.1 billion, carried as its own item rather than pushed into a named component.
Price basis
Every market price in this chapter is the last traded price on 3 September 2026, taken in a single snapshot at 10:45 UTC. Market capitalisation multiplies that price by the shares outstanding stated on the cover of each company's most recent periodic report. Alphabet and Coupang have several share classes and are priced off the class A line across all classes.
Target had not printed a trade in the 3 September session when the snapshot was taken, so its $163.36 is its last trade, carried from the previous session. Its quote at that moment was $163.11 bid against $163.50 asked, which brackets the price.
Table 16. Price basis and market capitalisation, 3 September 2026
| Company | Last trade, 3 Sep 2026 | Shares outstanding | Cover date | Market capitalisation, $m |
|---|---|---|---|---|
| Amazon.com, Inc. | $255.70 | 10,786,313,572 | 22 Jul 2026 | 2,758,060 |
| Walmart Inc. | $106.06 | 7,933,746,241 | 26 Aug 2026 | 841,453 |
| Costco Wholesale Corporation | $928.98 | 443,478,804 | 27 May 2026 | 411,983 |
| Target Corporation | $163.36 | 454,296,736 | 21 Aug 2026 | 74,214 |
| Coupang, Inc. | $16.00 | 1,797,511,702 | 31 Jul 2026 | 28,760 |
| Microsoft Corporation | $498.17 | 7,425,545,491 | 23 Jul 2026 | 3,699,184 |
| Alphabet Inc. | $338.30 | 12,230,000,000 | 15 Jul 2026 | 4,137,409 |
| Oracle Corporation | $146.45 | 2,880,471,000 | 12 Jun 2026 | 421,845 |
5 Material Events & Contracts
Amazon spent the last twelve months turning its balance sheet into artificial intelligence capacity. Fourteen 8-K filings between 3 September 2025 and 3 September 2026 carry four earnings releases, five note offerings, one term loan, one annual meeting, one merger agreement and one $50.0 billion equity commitment. Amazon is a domestic filer and files no 6-K, so the 8-K record is the whole current report trail.
The financing side is the larger number. Amazon settled $77.0 billion of dollar notes, EUR 14.5 billion of euro notes and C$14.0 billion of Canadian dollar notes in the window, and arranged a further $17.5 billion of delayed draw term debt that was undrawn at 30 June 2026. The deployment side matches it: $50.0 billion into OpenAI Series C Preferred Stock, a $20.0 billion financing facility opened to Anthropic, and an agreed acquisition of Globalstar, Inc. that the Q2 2026 10-Q values at about $10.9 billion including Globalstar debt.
Three consequences follow for the stock. Funding cost rose 30 to 60 basis points across the dollar curve between March and July 2026, so each successive raise is dearer than the last. Reported earnings now depend heavily on marks: $53.4 billion of the $80.9 billion of pretax income in the June quarter came from nonoperating income, mostly revaluation of the Anthropic holding, against $27.5 billion from operations. And the contract book that supports the AWS growth rate reached $496 billion of remaining performance obligations at 30 June 2026, with a weighted average remaining life of 6.4 years.
Table 17. Material events from 8-K filings, 3 September 2025 to 3 September 2026
| Date | Form and item | Event | Accession number |
|---|---|---|---|
| 2026-07-30 | 8-K, 2.02, 9.01 | Q2 2026 results: net sales of $200.6 billion, up 20%, operating income of $27.5 billion, and net income of $62.6 billion that includes $53.4 billion of pretax nonoperating income, mostly marks on the Anthropic holding. | 0001018724-26-000024 |
| 2026-07-09 | 8-K, 8.01, 9.01 | Closed $25.0 billion of senior unsecured notes in eight tranches maturing 2029 to 2066, priced at $24.923 billion for net proceeds of about $24.867 billion. | 0001104659-26-082293 |
| 2026-06-12 | 8-K, 8.01, 9.01 | Closed C$14.0 billion of senior unsecured notes in five tranches maturing 2029 to 2056, priced at C$13.967 billion for net proceeds of about C$13.934 billion. | 0001104659-26-073562 |
| 2026-06-10 | 8-K, 1.01, 2.03, 9.01 | Entered a $17.5 billion senior unsecured delayed draw term loan with Citibank N.A. as administrative agent, drawable to 30 September 2026 and maturing three years after the draw. | 0001104659-26-072140 |
| 2026-05-22 | 8-K, 5.07 | Annual meeting held 20 May 2026 elected all eleven directors, ratified Ernst & Young LLP, passed say on pay, and defeated all five shareholder proposals. | 0001104659-26-065717 |
| 2026-04-29 | 8-K, 2.02, 9.01 | Q1 2026 results: net sales of $181.5 billion, up 17%, operating income of $23.9 billion, and net income of $30.3 billion including $16.8 billion of pretax gains on the Anthropic holding. | 0001018724-26-000012 |
| 2026-04-14 | 8-K, 7.01, 9.01 | Announced a definitive merger agreement dated 13 April 2026 to acquire Globalstar, Inc. at $90.00 per share in cash or 0.3210 Amazon shares capped at $90.00, alongside a satellite services agreement with Apple Inc. | 0001104659-26-042880 |
| 2026-04-08 | 8-K, 7.01, 9.01 | Furnished the annual letter to shareholders accompanying the 2025 annual report, with a reconciliation of the one measure in it that is not stated under generally accepted accounting principles. | 0001104659-26-041034 |
| 2026-03-16 | 8-K, 8.01, 9.01 | Closed EUR 14.5 billion of senior unsecured notes in eight tranches maturing 2028 to 2064, priced at EUR 14.473 billion for net proceeds of about EUR 14.447 billion. | 0001104659-26-028556 |
| 2026-03-13 | 8-K, 8.01, 9.01 | Closed $37.0 billion of senior unsecured notes in eleven tranches maturing 2028 to 2076, priced at $36.898 billion for net proceeds of about $36.813 billion, the largest single offering in the window. | 0001104659-26-027729 |
| 2026-02-27 | 8-K, 1.01, 7.01, 8.01, 9.01 | Signed a $35.0 billion equity commitment letter for OpenAI Series C Preferred Stock guaranteed by the parent, on top of a $15.0 billion purchase due 31 March 2026, with an AWS cloud arrangement and a joint collaboration agreement alongside it. | 0001104659-26-021050 |
| 2026-02-05 | 8-K, 2.02, 9.01 | Q4 and full year 2025 results: full year net sales of $716.9 billion, operating income of $80.0 billion, and Q4 operating income of $25.0 billion after $2.4 billion of special charges for tax disputes, severance and impairments. | 0001018724-26-000002 |
| 2025-11-20 | 8-K, 8.01, 9.01 | Closed $15.0 billion of senior unsecured notes in six tranches maturing 2028 to 2065, priced at $14.961 billion for net proceeds of about $14.926 billion. | 0001104659-25-114647 |
| 2025-10-30 | 8-K, 2.02, 9.01 | Q3 2025 results: net sales of $180.2 billion, up 13%, and flat operating income of $17.4 billion after a $2.5 billion Federal Trade Commission settlement and $1.8 billion of severance. | 0001018724-25-000121 |
No 8-K in the window reports a change of director or executive officer under Item 5.02. Amazon filed no 8-K/A in the window, and no 6-K at any time.
The cost of the money
Five registered offerings settled in the window, and the three dollar deals share enough maturity points to read as a repricing series.

Between the March and July 2026 offerings, coupons on the seven maturities common to both rose by 30 to 60 basis points, and the widening was largest at the short end: 2029 by 60 basis points, 2031 and 2033 by 55, 2036 by 42.5, and 2046 through 2066 by 30 to 35. The 2033 point moved from 4.350% in November 2025 to 4.550% in March 2026 to 5.100% in July 2026, 75 basis points in eight months, 55 of them in the last four. Amazon has no financial covenants under the notes, and it may redeem them in whole or in part at specified redemption prices.
Table 18. Senior unsecured note offerings settled in the window
Face values, aggregate public offering price and estimated net proceeds in millions of the issuance currency.
| Settled | Currency | Tranches | Face value | Offering price | Net proceeds | Accession number |
|---|---|---|---|---|---|---|
| 2025-11-20 | USD | 6 | 15,000 | 14,961 | 14,926 | 0001104659-25-114647 |
| 2026-03-13 | USD | 11 | 37,000 | 36,898 | 36,813 | 0001104659-26-027729 |
| 2026-03-16 | EUR | 8 | 14,500 | 14,473 | 14,447 | 0001104659-26-028556 |
| 2026-06-12 | CAD | 5 | 14,000 | 13,967 | 13,934 | 0001104659-26-073562 |
| 2026-07-09 | USD | 8 | 25,000 | 24,923 | 24,867 | 0001104659-26-082293 |
Face value exceeds the aggregate offering price in every row because the notes priced at an original issue discount, which runs from 19 basis points of face on the euro deal to 31 basis points on the July dollar deal. The underwriting spread is the second gap and it is thin: 22 basis points of face on the July offering and 18 basis points on the euro offering. Each offering was issued under the indenture dated 29 November 2012 as supplemented on 13 April 2022, with an officers' certificate setting each series. The November 2025 offering ties to the line "2025 Notes issuance of $15.0 billion" in the FY2025 10-K debt table.
Where the money went

The OpenAI position was built in three steps. Amazon.com NV Investment Holdings LLC bought $15.0 billion of Series C Preferred Stock in the first quarter of 2026 under an obligation to close on 31 March 2026, then $13.7 billion of the separate $35.0 billion commitment letter in the second quarter, then the remaining $21.3 billion after 30 June 2026. The commitment letter obliges Amazon to buy any unpurchased shares on the earlier of stated OpenAI milestones and a public listing, and terminates if the money is not invested by 31 December 2028. The deadline never bound: the Q2 2026 10-Q reports the commitment fully drawn.
The Anthropic arrangement is a facility. Amazon made up to $20.0 billion available, drawable as new convertible notes only as compute delivery milestones are met, expiring 30 months after an Anthropic liquidity event. Nothing was drawable at inception. Amazon used $5.0 billion of it in the second quarter of 2026 to buy Series H nonvoting preferred stock, leaving $15.0 billion.
Table 19. Material contracts disclosed in the 10-K and in 8-K filings
| Counterparty | Subject | Term | Filing |
|---|---|---|---|
| OpenAI Group PBC | Equity commitment letter for OpenAI Series C Preferred Stock, aggregate purchase price $35.0 billion, entered by Amazon.com NV Investment Holdings LLC with Amazon.com, Inc. as guarantor | Purchasable at Amazon's discretion, mandatory on stated milestones or a public listing, terminating if unfunded by 31 December 2028 | 8-K filed 2026-02-27, Exhibit 10.1, confidential portions omitted |
| OpenAI Group PBC | AWS cloud services commercial arrangement, expanding the existing $38.0 billion commitment by $100.0 billion, plus a joint collaboration agreement putting OpenAI models on AWS and inside Amazon | Expansion runs 8.0 years | 8-K filed 2026-02-27 Item 8.01 and the Q2 2026 10-Q, no exhibit filed |
| Anthropic, PBC | Expanded strategic collaboration and AWS commercial arrangement of more than $100.0 billion, plus a financing facility of up to $20.0 billion drawable as convertible notes against compute delivery milestones | Commitment runs 10.0 years, and the facility expires 30 months after an Anthropic liquidity event | Q2 2026 10-Q, no 8-K and no exhibit filed |
| Globalstar, Inc. | Definitive merger agreement dated 13 April 2026, $90.00 per share in cash or 0.3210 Amazon shares capped at $90.00, cash elections capped at 40% of shares, consideration cut by up to $110 million if operational milestones are missed | Expected to close in 2027, subject to regulatory approvals and satellite replacement milestones | 8-K filed 2026-04-14 Item 7.01, and Form S-4 filed 2026-07-31 |
| Apple Inc. | Agreements for Amazon Leo to power satellite services on supported iPhone and Apple Watch models, and to redeem Apple equity interests in a Globalstar special purpose entity | Services begin after the Globalstar acquisition closes | 8-K filed 2026-04-14 Exhibit 99.1 and the Q2 2026 10-Q, no exhibit filed |
| Citibank N.A. and syndicate | $17.5 billion senior unsecured delayed draw term loan, Term SOFR plus 0.625% to 0.875% by credit rating, base rate margin nil, no financial covenants | Commitments expire 30 September 2026, and drawn loans mature three years from the draw date | 8-K filed 2026-06-10, Exhibit 10.1 |
| Citibank N.A. and syndicate | $5.0 billion amended and restated 364 day revolving credit agreement, SOFR plus 0.45%, commitment fee 0.03% on the undrawn portion, amended 8 June 2026 | Matures October 2026, extendable once by 364 days with lender approval | Q2 2026 10-Q, Exhibit 10.2 |
| Citibank N.A. and syndicate | $15.0 billion five year revolving credit agreement dated 1 November 2023, benchmark rate plus 0.45%, commitment fee 0.03%, amended 8 June 2026 | Extends to November 2028, extendable in one year terms with lender approval | FY2025 10-K Exhibit 10.8, and Q2 2026 10-Q Exhibit 10.3 |
| Computershare Trust Company, N.A., as successor trustee | Indenture dated 29 November 2012 as supplemented 13 April 2022, the governing instrument for every note offering in the window | Open ended, with an officers' certificate setting the terms of each series | FY2025 10-K Exhibits 4.1 and 4.2, incorporated by reference |
Three disclosure choices limit what an investor can read. The Globalstar merger agreement reached the market under Item 7.01 as furnished Regulation FD material rather than under Item 1.01 as an entry into a material definitive agreement, and the agreement itself was never filed as an 8-K exhibit; the terms are readable only through the press release and the Form S-4 filed on 31 July 2026. The Anthropic expansion of more than $100.0 billion and the $20.0 billion facility beside it appear in no 8-K at all, reaching investors first in the Q2 2026 10-Q. And the OpenAI equity commitment letter was filed with confidential portions omitted under Commission rules, so the milestone triggers that make the $35.0 billion purchase mandatory are not public.
The undrawn commitments are large next to the drawn ones. Amazon held $20.0 billion of unsecured revolving capacity and $30.0 billion of commercial paper programmes with nothing outstanding at 30 June 2026, plus $17.5 billion of undrawn term loan and $9.5 billion of unused letters of credit at 31 December 2025. Total contractual commitments in the FY2025 10-K reached $439.7 billion, of which $84.8 billion are unconditional purchase obligations for content, energy, property and software.
What the events did to reported earnings

The source of reported profit shifted sharply across the window. Nonoperating income supplied 38% of pretax income in the September 2025 quarter, 6% in December, 40% in March 2026 and 66% in June 2026. Operating income over the same four quarters moved from $17.4 billion to $25.0 billion to $23.9 billion to $27.5 billion, a steadier and far smaller series. Marks on private holdings do not settle in cash, and the Anthropic revaluation of roughly $50.5 billion in the June quarter came to 1.8 times that quarter's operating income.
Two of those quarters also carry the charges management set apart, which Table 11 sets out. Before them the operating income series runs $21.7 billion, $27.4 billion, $23.9 billion and $27.5 billion, and the shape of the comparison does not change.
6 Ownership, Voting Power & Annual Meeting
Amazon has one class of common stock and one vote per share. The only gap between economic ownership and voting power anywhere in the register is 68,232,131 shares that Jeffrey P. Bezos votes and cannot sell. He is the largest holder at 950,434,581 shares, 8.8% of the class at 24 February 2026, and the block has fallen in every reported period since 2021. The three largest index managers hold 2,006,801,718 shares between them at 30 June 2026, 18.6% of the class and 2.11 times the Bezos block, and two of the three report voting authority over a small part of what they hold. At the 20 May 2026 annual meeting every board sponsored item passed with at least 90.0% of the votes cast, and all five shareholder proposals failed, the best of them at 18.4%.
Who owns the stock and who votes it
The Bezos stake splits in two. 68,232,131 shares carry sole voting power and no investment power, so the economic stake is 882,202,450 shares, 8.2% of the class. A year earlier the same table showed 1,021,742,026 shares and 112,032,131 vote only shares. The total fell by 71,307,445 shares over the year, 43,800,000 of that in the vote only block and 27,507,445 in shares he can also sell. Directors and executive officers as a group held 953,863,330 shares, 8.9% of the class, of which the Bezos holding is 99.6%. No other director or officer holds one percent.
The proxy statement carries The Vanguard Group and BlackRock at share counts taken from Schedule 13G filings made in February 2024 for positions as of 31 December 2023, while the percent of class beside them is computed on the February 2026 share count. Form 13F for the June 2026 quarter puts the Vanguard complex 87,752,271 shares above the proxy figure and BlackRock 120,621,253 shares above it. Table 20 shows both bases rather than blending them.
Table 20. Economic and voting stakes of the largest holders
| Holder | Basis and date | Shares held | Economic shares | Economic, % of class | Shares carrying voting power | Voting, % of class |
|---|---|---|---|---|---|---|
| Proxy statement basis | ||||||
| Jeffrey P. Bezos | DEF 14A, 24 Feb 2026 | 950,434,581 | 882,202,450 | 8.21% | 950,434,581 | 8.84% |
| The Vanguard Group, Inc. | SC 13G/A, 31 Dec 2023 | 771,052,550 | 771,052,550 | 7.2% | 12,172,954 | 0.11% |
| BlackRock, Inc. | SC 13G/A, 31 Dec 2023 | 630,188,686 | 630,188,686 | 5.9% | 565,960,396 | 5.26% |
| Directors and officers, 17 persons | DEF 14A, 24 Feb 2026 | 953,863,330 | 885,631,199 | 8.24% | 953,863,330 | 8.9% |
| Form 13F basis, quarter ended 30 June 2026 | ||||||
| Vanguard complex, eleven filers | 13F-HR, 30 Jun 2026 | 858,804,821 | 858,804,821 | 7.96% | 96,080,055 | 0.89% |
| BlackRock, Inc. | 13F-HR, 30 Jun 2026 | 750,809,939 | 750,809,939 | 6.96% | 674,780,296 | 6.26% |
| State Street Corp | 13F-HR, 30 Jun 2026 | 397,186,958 | 397,186,958 | 3.68% | 54,431,500 | 0.50% |
Percent of class is computed on 10,751,236,247 shares for the proxy rows and 10,786,313,572 shares for the 13F rows. Voting power on the two index manager proxy rows is the sole and shared voting power stated in the February 2024 Schedule 13G filings, and Vanguard reported no sole voting power at all on that filing. Voting power on the 13F rows is the voting authority the manager reports for the position. The economic column for directors and officers removes the same vote only block that sits inside the Bezos row.
Voting authority is where the index positions stop resembling one another. BlackRock reports it over 89.9% of its position, the Vanguard complex over 11.2% and State Street over 13.7%, the remainder sitting with fund boards and clients. The Bezos block of 950,434,581 voting shares is 1.41 times the largest voting authority any single manager reports.
The 13F holder base
Filings reporting the stock rose from 5,729 for the September 2025 quarter to 6,248 for the June 2026 quarter, a gain of 519. The index positions moved far less: the Vanguard complex added 7,086,449 shares over the four quarters and State Street 15,505,517 shares. The June 2026 count will rise as late filings arrive.

Table 21. Institutional holdings by quarter
| Quarter ended | 13F filings reporting the stock | Vanguard complex, shares | State Street Corp, shares | BlackRock, Inc., shares |
|---|---|---|---|---|
| 2025-09-30 | 5,729 | 851,718,372 | 381,681,441 | n/a |
| 2025-12-31 | 6,227 | 846,821,971 | 388,653,121 | n/a |
| 2026-03-31 | 6,139 | 858,103,414 | 390,450,321 | n/a |
| 2026-06-30 | 6,248 | 858,804,821 | 397,186,958 | 750,809,939 |
BlackRock is shown for the June 2026 quarter only. Its quarterly filing payload for the three earlier quarters could not be retrieved through the filings interface, and no estimate is put in its place. Vanguard reported through a single filer to December 2025 and through eleven separate filers from March 2026 after an internal realignment. The figures above aggregate every filer in the group, so the series stays comparable across that change.
Schedule 13D and 13G history
Two Schedule 13G amendments were filed on the stock in the two years to 3 September 2026, both by Mr Bezos. No Schedule 13D has been filed, so no investor has declared an intent to influence control. Neither Vanguard nor BlackRock has amended its Schedule 13G since February 2024, and both positions have moved since.
Table 22. Schedule 13D and 13G filings on the common stock
| Filed | Event date | Form | Filer | In two year window | Shares owned | % of class | Sole voting power | Sole investment power | Accession |
|---|---|---|---|---|---|---|---|---|---|
| 2025-10-14 | 2025-09-30 | SC 13G/A | Jeffrey P. Bezos | Yes | 964,340,319 | 9.0% | 964,340,319 | 883,258,188 | 0001104659-25-099267 |
| 2024-11-08 | 2024-09-30 | SC 13G/A | Jeffrey P. Bezos | Yes | 1,066,606,645 | 10.1% | 1,066,606,645 | 927,474,514 | 0001104659-24-115906 |
| 2024-02-13 | 2023-12-29 | SC 13G/A | The Vanguard Group | No | 771,052,550 | 7.5% | 0 | 731,881,113 | 0001104659-24-020003 |
| 2024-02-12 | 2023-12-31 | SC 13G/A | BlackRock, Inc. | No | 630,188,686 | 6.1% | 565,960,396 | 630,188,686 | 0001086364-24-006979 |
| 2024-01-26 | 2023-12-31 | SC 13G/A | Jeffrey P. Bezos | No | 1,189,047,364 | 11.5% | 1,189,047,364 | 988,251,817 | 0001104659-24-007255 |
| 2023-01-27 | 2022-12-31 | SC 13G/A | Jeffrey P. Bezos | No | 1,258,689,760 | 12.3% | 1,258,689,760 | 992,633,688 | 0001193125-23-017572 |
| 2022-01-28 | 2021-12-31 | SC 13G/A | Jeffrey P. Bezos | No | 1,296,471,400 | 12.7% | 1,296,471,400 | 999,280,940 | 0001193125-22-021680 |
Rows outside the two year window are carried for the movement baseline. December 2021 figures are adjusted for the twenty for one split of June 2022.

The gap between the two bars is the vote only block. It stood at 81,082,131 shares at 30 September 2025 and 68,232,131 shares in the February 2026 proxy table, so it is shrinking faster than the stake around it.
The 2026 annual meeting
Holders of 8,952,851,024 shares voted, 83.25% of the 10,754,251,799 shares outstanding at the 26 March 2026 record date, against 84.59% a year earlier. Broker nonvotes came to 1,064,491,660 shares, 11.9% of the shares represented, and had no effect on the outcome of any item. All eleven nominees were elected. The board went from twelve members to eleven, since Keith B. Alexander appears in the February 2026 ownership table and did not stand for reelection.
Table 23. Items voted on at the annual meeting of 20 May 2026
| Item | Proponent | Board recommendation | For | Against | Abstained | Broker nonvotes | Support, % of votes cast |
|---|---|---|---|---|---|---|---|
| 1. Election of eleven directors | Board | For | see Table 24 | see Table 24 | see Table 24 | 1,064,491,660 | see Table 24 |
| 2. Ratification of Ernst & Young LLP as auditors | Board | For | 8,403,029,398 | 522,632,825 | 27,188,801 | 0 | 94.1% |
| 3. Advisory vote on named executive officer compensation | Board | For | 7,391,737,243 | 470,466,853 | 26,155,268 | 1,064,491,660 | 94.0% |
| 4. Report on charitable partnerships | The Heritage Foundation | Against | 72,712,599 | 7,742,421,980 | 73,224,785 | 1,064,491,660 | 0.9% |
| 5. Reporting on the effect of data centres on climate commitments | Brian Kariger, represented by As You Sow, and Mercy Investment Services, Inc. | Against | 1,436,334,642 | 6,372,517,458 | 79,507,264 | 1,064,491,660 | 18.4% |
| 6. Report on the effect of climate commitments | National Legal and Policy Center | Against | 95,945,426 | 7,732,242,560 | 60,171,378 | 1,064,491,660 | 1.2% |
| 7. Mandatory independent board chair policy | AFL-CIO Reserve Fund | Against | 1,112,511,990 | 6,730,245,638 | 45,601,736 | 1,064,491,660 | 14.2% |
| 8. Worker oriented AI advisory council, presented under the bylaws | Proponent not named in the proxy statement | Against | 49,093 | 7,888,309,366 | 905 | 1,064,491,660 | 0.0% |
Support is votes for as a share of votes cast for and against. Abstentions and broker nonvotes had no effect on the outcome of any item. Item 8 was presented from the floor under the bylaws rather than under Rule 14a-8, and the proxy statement does not name its proponent.
Table 24. Election of directors, 20 May 2026
| Nominee | For | Against | Abstained | Support, % of votes cast |
|---|---|---|---|---|
| Jeffrey P. Bezos | 7,470,968,677 | 393,242,148 | 24,148,539 | 95.0% |
| Andrew R. Jassy | 7,803,190,739 | 65,688,660 | 19,479,965 | 99.2% |
| Edith W. Cooper | 7,644,518,512 | 221,722,802 | 22,118,050 | 97.2% |
| Jamie S. Gorelick | 7,298,413,009 | 566,479,319 | 23,467,036 | 92.8% |
| Daniel P. Huttenlocher | 7,781,614,899 | 83,580,848 | 23,163,617 | 98.9% |
| Andrew Y. Ng | 7,426,600,997 | 438,607,163 | 23,151,204 | 94.4% |
| Indra K. Nooyi | 7,724,900,429 | 137,471,449 | 25,987,486 | 98.3% |
| Jonathan J. Rubinstein | 7,078,042,809 | 785,068,955 | 25,247,600 | 90.0% |
| Brad D. Smith | 7,812,423,713 | 52,993,544 | 22,942,107 | 99.3% |
| Patricia Q. Stonesifer | 7,347,480,399 | 516,023,466 | 24,855,499 | 93.4% |
| Wendell P. Weeks | 7,751,614,351 | 114,022,271 | 22,722,742 | 98.6% |
Broker nonvotes of 1,064,491,660 applied to every nominee. Support ran from 90.0% for Jonathan J. Rubinstein to 99.3% for Brad D. Smith. Mr Bezos drew 95.0%, ahead of four of the other ten nominees and behind six, with the chief executive at 99.2%. Ernst & Young was ratified with 94.1% of votes cast, close to the 94.6% of a year earlier. The advisory vote on executive pay drew 94.0% against 78.0% in 2025, a move of 16.0 points and the largest change on the ballot.
Shareholder proposals
Four proposals reached the ballot under Rule 14a-8 and one more came from the floor, against eight voted on in 2025. The company disclosed that two further proposals were withdrawn by their proponents and seven were excluded. The board opposed all five, and none passed. Reporting on the effect of data centres on climate commitments came back for a second year and drew 18.4% against 20.1% in 2025. The mandatory independent board chair proposal drew 14.2%, against 17.4% for the 2025 proposal to separate the roles of chief executive and chair.

Support fell on every comparable question between the two meetings, which management can present as endorsement of the reporting it already publishes. Proponents can point to a narrower ballot: two proposals withdrawn and seven excluded means fewer questions reached a vote than in 2025. The company engaged 66 of its 100 largest unaffiliated shareholders during the year.
What it means for the stock
No shareholder can block a board decision. The largest holder controls 8.8% of the votes, down from 12.7% at the end of 2021. The index managers hold more stock between them and disperse the votes across funds and clients. Control therefore rests on the board's own standing, and at 90.0% for the weakest nominee it is not in question. The pay vote returning to 94.0% from 78.0% closes the one item where holders had registered a protest. For the share price the number that matters is supply: 27,507,445 shares of economic stake left the Bezos block in a single year, on top of a vote only block that is winding down.
7 Insider Activity
Amazon insiders sold and never bought. Over the twelve months to 3 September 2026, 17 Section 16 filers reported 1,663,532 shares disposed on the market for $457.5 million and no share acquired on the market. All 129 sale lines cite a Rule 10b5-1 plan, so no insider picked a sale date inside the window.
The buy to sell ratio is computed on open market transactions only. Read strictly, counting only trades the insider timed, purchases were nil and sales were nil, and the ratio does not exist. Read widely, counting plan executions as open market trades, purchases were nil against 1,663,532 shares sold, a ratio of 0.00x. Neither reading carries a timing signal, because nothing in the window was discretionary.
The window holds 73 Form 4 filings and no Form 3 or Form 5. Twelve separate plan adoption dates appear in the footnotes, the earliest 7 November 2024 and the latest 14 May 2026, so the selling runs off staggered plans rather than one programme.
Selling by month
Monthly net market activity was negative in eleven of twelve months and zero in January 2026. Volume clusters in November, February, May and August, the months in which restricted stock vests. August 2026 carries (1,279,238) shares, of which the founder is (1,209,649). Officers and directors alone peak in May 2026 at (134,719) shares. Weighted average sale prices ranged from $196.75 to $286.41 across the individual lines. The lowest monthly average was $204.25 in March 2026 and the highest $284.96 in August 2026.

Transaction record
Table 25 lists every market sale and every gift, one row per Form 4 tranche. Where a plan executed across consecutive days on one filing, the row shows the date span, the total shares, the share weighted average price and the holding reported after the last line. Vesting deliveries and awards carry no price and no market execution, so they are summarised by person in Table 26 rather than listed here.
Code S is a sale, in every case here under a Rule 10b5-1 plan. Code G is a bona fide gift, which moves stock without a trade and without proceeds. Code A, a grant from the issuer, and code M, delivery of common stock on the settlement of a restricted stock unit, appear in the window but never touch the market. Code P, an open market purchase, and code F, shares withheld by the issuer to pay tax, appear on no filing in the window.
Table 25. Insider market sales and gifts, twelve months to 3 September 2026, 53 reported tranches
| Date | Insider | Role | Code | Shares | Price | Holding after |
|---|---|---|---|---|---|---|
| 2 Sep 25 | Douglas J. Herrington | CEO Worldwide Amazon Stores | S | (2,500) | $223.49 | 518,007 |
| 1 Oct 25 | Douglas J. Herrington | CEO Worldwide Amazon Stores | S | (2,500) | $217.10 | 515,507 |
| 31 Oct 25 to 3 Nov 25 | Douglas J. Herrington | CEO Worldwide Amazon Stores | S | (24,500) | $250.58 | 491,007 |
| 31 Oct 25 | Jonathan Rubinstein | Director | S | (8,173) | $250.03 | 80,030 |
| 6 Nov 25 to 7 Nov 25 | Jeffrey P. Bezos | Director, Executive Chair | G | (1,013,128) | n/a | 882,245,060 |
| 7 Nov 25 | Jamie S. Gorelick | Director | G | (7,944) | n/a | 38,117 |
| 14 Nov 25 | Jeffrey P. Bezos | Director, Executive Chair | G | (42,610) | n/a | 882,202,450 |
| 17 Nov 25 | Douglas J. Herrington | CEO Worldwide Amazon Stores | S | (4,784) | $232.71 | 498,182 |
| 17 Nov 25 | Keith Brian Alexander | Director | S | (900) | $233.00 | 7,170 |
| 20 Nov 25 | Daniel P. Huttenlocher | Director | S | (1,237) | $226.61 | 26,148 |
| 21 Nov 25 | Andrew R. Jassy | Director, President and CEO | S | (19,872) | $216.94 | 2,208,310 |
| 21 Nov 25 to 24 Nov 25 | David Zapolsky | Senior VP | S | (20,670) | $220.58 | 41,190 |
| 21 Nov 25 | Douglas J. Herrington | CEO Worldwide Amazon Stores | S | (6,835) | $216.40 | 508,434 |
| 21 Nov 25 | Matthew S. Garman | CEO Amazon Web Services | S | (17,768) | $216.90 | 6,273 |
| 21 Nov 25 | Shelley Reynolds | Vice President | S | (2,695) | $216.41 | 119,780 |
| 1 Dec 25 | Douglas J. Herrington | CEO Worldwide Amazon Stores | S | (2,500) | $233.22 | 505,934 |
| 11 Feb 26 | Douglas J. Herrington | CEO Worldwide Amazon Stores | S | (1,000) | $208.00 | 504,934 |
| 12 Feb 26 | Keith Brian Alexander | Director | S | (900) | $203.88 | 6,270 |
| 17 Feb 26 | Douglas J. Herrington | CEO Worldwide Amazon Stores | S | (4,784) | $198.37 | 512,109 |
| 23 Feb 26 | Andrew R. Jassy | Director, President and CEO | S | (19,872) | $205.18 | 2,238,118 |
| 23 Feb 26 to 24 Feb 26 | David Zapolsky | Senior VP | S | (17,749) | $205.40 | 41,190 |
| 23 Feb 26 | Douglas J. Herrington | CEO Worldwide Amazon Stores | S | (6,835) | $205.82 | 522,361 |
| 23 Feb 26 | Matthew S. Garman | CEO Amazon Web Services | S | (17,751) | $205.22 | 9,405 |
| 23 Feb 26 | Shelley Reynolds | Vice President | S | (2,695) | $205.90 | 119,780 |
| 2 Mar 26 | Douglas J. Herrington | CEO Worldwide Amazon Stores | S | (1,000) | $204.25 | 521,361 |
| 1 Apr 26 | Douglas J. Herrington | CEO Worldwide Amazon Stores | S | (1,000) | $210.50 | 520,361 |
| 14 Apr 26 | Douglas J. Herrington | CEO Worldwide Amazon Stores | S | (20,500) | $245.00 | 499,861 |
| 17 Apr 26 | Andrew R. Jassy | Director, President and CEO | S | (31,000) | $255.00 | 2,207,118 |
| 24 Apr 26 | Jonathan Rubinstein | Director | S | (3,849) | $260.00 | 78,654 |
| 30 Apr 26 | Jonathan Rubinstein | Director | S | (3,706) | $273.02 | 74,948 |
| 1 May 26 to 4 May 26 | Douglas J. Herrington | CEO Worldwide Amazon Stores | S | (28,500) | $274.67 | 471,361 |
| 1 May 26 to 4 May 26 | Jeffrey P. Bezos | Director, Executive Chair | G | (1,253,797) | n/a | 880,948,653 |
| 4 May 26 | Andrew R. Jassy | Director, President and CEO | S | (31,352) | $275.00 | 2,175,766 |
| 15 May 26 | Douglas J. Herrington | CEO Worldwide Amazon Stores | S | (3,742) | $262.59 | 476,972 |
| 15 May 26 | Matthew S. Garman | CEO Amazon Web Services | S | (11,475) | $262.66 | 11,430 |
| 21 May 26 | Andrew R. Jassy | Director, President and CEO | S | (20,000) | $263.42 | 2,205,766 |
| 21 May 26 to 22 May 26 | David Zapolsky | Senior VP | S | (15,450) | $266.49 | 41,190 |
| 21 May 26 | Douglas J. Herrington | CEO Worldwide Amazon Stores | S | (6,370) | $262.39 | 486,527 |
| 21 May 26 | Matthew S. Garman | CEO Amazon Web Services | S | (15,467) | $263.40 | 14,159 |
| 21 May 26 | Shelley Reynolds | Vice President | S | (2,363) | $262.38 | 119,780 |
| 1 Jun 26 | Douglas J. Herrington | CEO Worldwide Amazon Stores | S | (1,000) | $266.19 | 485,527 |
| 1 Jul 26 | Douglas J. Herrington | CEO Worldwide Amazon Stores | S | (1,000) | $239.77 | 484,527 |
| 3 Aug 26 | Douglas J. Herrington | CEO Worldwide Amazon Stores | S | (1,000) | $278.39 | 483,527 |
| 3 Aug 26 | Jeffrey P. Bezos | Director, Executive Chair | S | (1,209,649) | $286.41 | 879,739,004 |
| 6 Aug 26 | Douglas J. Herrington | CEO Worldwide Amazon Stores | G | (22,000) | n/a | 461,527 |
| 17 Aug 26 | Douglas J. Herrington | CEO Worldwide Amazon Stores | S | (3,741) | $262.76 | 467,138 |
| 21 Aug 26 | Andrew R. Jassy | Director, President and CEO | S | (20,000) | $259.01 | 2,235,766 |
| 21 Aug 26 | Brian T. Olsavsky | Senior VP and CFO | S | (6,172) | $260.31 | 109,207 |
| 21 Aug 26 to 24 Aug 26 | David Zapolsky | Senior VP | S | (15,430) | $259.52 | 41,190 |
| 21 Aug 26 | Douglas J. Herrington | CEO Worldwide Amazon Stores | S | (6,362) | $259.01 | 476,681 |
| 21 Aug 26 | Matthew S. Garman | CEO Amazon Web Services | S | (14,541) | $259.06 | 17,794 |
| 21 Aug 26 | Shelley Reynolds | Vice President | S | (2,343) | $259.01 | 119,780 |
| 25 Aug 26 to 26 Aug 26 | Jeffrey P. Bezos | Director, Executive Chair | G | (415,580) | n/a | 879,323,424 |
Most reported movement never reached the market
Reported share movement totalled 5,624,258 shares. Of that, 3,960,726 shares, or 70.4%, never reached a public order book: restricted stock unit awards of 640,418, vesting deliveries of 565,249 and gifts to nonprofits of 2,755,059. Plan sales of 1,663,532 shares are the only channel that traded. Excluding new awards, which create a future claim rather than move an existing share, the nonmarket share is 66.6%.

The issuer withheld no shares for tax. Code F appears on no filing in the window, so tax settlement does not reduce the reported vesting figure, and any stock sold to meet tax sits inside the plan sale total. Every share an officer or director noticed for sale on Form 144, 458,124 across 42 entries, names restricted stock vesting as its source.
Founder activity separated from officers and directors
The founder is one filer out of 17 and 72.7% of the share volume sold, 75.7% of the value, so aggregating him with the rest would hide both groups.

Founder plan sales fell from 41,354,620 shares and $9,031 million in the twelve months to August 2025 to 1,209,649 shares and $346.5 million in the twelve months to August 2026, a fall of 97% in shares and 96% in value. The average realised price rose from $218.38 to $286.41. Direct holdings went from 883,258,188 shares at 28 August 2025 to 879,323,424 at 26 August 2026, a fall of 3,934,764 shares, or 0.45% of the opening position, made up of sales of 1,209,649 and gifts of 2,725,115. A further 5,087,266 shares sit indirectly in trusts and a wholly owned limited liability company, with beneficial ownership disclaimed.
Gifts were the larger founder channel. The 2,725,115 shares given to nonprofits are 69% of his reported movement and left the market untouched at his own account.
Officers and directors sold 453,883 shares for $111.1 million at an average of $244.68. Against that they took delivery of 565,249 vested shares and received awards of 640,418 units. On a delivered share basis the group retained 111,366 shares, 19.7% of what vested. Seven of the 17 filers reported no sale at all: Andrew Y. Ng, Indra K. Nooyi, Jamie S. Gorelick, Wendell P. Weeks, Patricia Q. Stonesifer, Edith W. Cooper and Brad D. Smith. Selling is concentrated: the five largest sellers account for 97.9% of the shares sold, and Douglas J. Herrington filed 22 of the 73 Form 4 filings, more than any other insider.
Table 26. Insider activity by person, twelve months to 3 September 2026, shares
| Insider | Role | Awards | Vested | Plan sales | Value, $m | Avg price | Gifts | Holding |
|---|---|---|---|---|---|---|---|---|
| Jeffrey P. Bezos | Director, Executive Chair | n/a | n/a | (1,209,649) | (346.5) | $286.41 | (2,725,115) | 879,323,424 |
| Andrew R. Jassy | Director, President and CEO | n/a | 199,360 | (142,096) | (35.4) | $248.87 | n/a | 2,235,766 |
| Douglas J. Herrington | CEO Worldwide Amazon Stores | 174,741 | 108,627 | (130,453) | (32.3) | $247.71 | (22,000) | 476,681 |
| Matthew S. Garman | CEO Amazon Web Services | 218,535 | 91,658 | (77,002) | (18.4) | $238.33 | n/a | 17,794 |
| David Zapolsky | Senior VP | 106,374 | 66,379 | (69,299) | (16.3) | $235.60 | n/a | 41,190 |
| Jonathan Rubinstein | Director | 4,695 | 2,473 | (15,728) | (4.1) | $257.89 | n/a | 74,948 |
| Shelley Reynolds | Vice President | 20,309 | 10,096 | (10,096) | (2.4) | $234.25 | n/a | 119,780 |
| Brian T. Olsavsky | Senior VP and CFO | 106,374 | 66,379 | (6,172) | (1.6) | $260.31 | n/a | 109,207 |
| Keith Brian Alexander | Director | n/a | 2,605 | (1,800) | (0.4) | $218.44 | n/a | 6,270 |
| Daniel P. Huttenlocher | Director | 4,695 | 2,473 | (1,237) | (0.3) | $226.61 | n/a | 26,148 |
| Andrew Y. Ng | Director | n/a | 1,984 | n/a | n/a | n/a | n/a | 3,968 |
| Indra K. Nooyi | Director | n/a | 1,602 | n/a | n/a | n/a | n/a | 31,942 |
| Jamie S. Gorelick | Director | n/a | 2,677 | n/a | n/a | n/a | (7,944) | 40,794 |
| Wendell P. Weeks | Director | n/a | 1,816 | n/a | n/a | n/a | n/a | 46,216 |
| Patricia Q. Stonesifer | Director | 4,695 | 2,473 | n/a | n/a | n/a | n/a | 53,639 |
| Edith W. Cooper | Director | n/a | 2,042 | n/a | n/a | n/a | n/a | 8,222 |
| Brad D. Smith | Director | n/a | 2,605 | n/a | n/a | n/a | n/a | 17,610 |
| Total | 640,418 | 565,249 | (1,663,532) | (457.5) | $275.02 | (2,755,059) |
Notices of intent against reported sales
Form 144 notices in the window cover 16,012,398 shares with a stated market value of $4,330.2 million, against 1,663,532 shares reported sold on Form 4. The gap is almost entirely one filing: the founder gave notice on 3 August 2026 for 15,000,000 shares valued at $4,073.7 million, sourced to stock purchased at original issue on 5 July 1994 and tied to a plan adopted 14 November 2025. Form 4 filings through 3 September 2026 report 1,209,649 of those shares sold, 8.1% of the notice. A Form 144 states capacity to sell, so the residual 13,790,351 shares is an overhang on the register rather than a completed disposal. Officers and directors track their notices closely, selling 453,883 shares against 458,124 noticed.
Table 27. Form 144 notices against Form 4 executions, twelve months to 3 September 2026
| Filer group | Notices | Shares noticed | Market value, $m | Shares sold on Form 4 | Noticed but not reported sold |
|---|---|---|---|---|---|
| Founder, own account | 1 | 15,000,000 | 4,073.7 | (1,209,649) | 13,790,351 |
| Founder controlled nonprofits | 3 | 554,274 | 145.5 | n/a | n/a |
| Officers and directors | 37 | 458,124 | 111.0 | (453,883) | 4,241 |
| Total | 41 | 16,012,398 | 4,330.2 | (1,663,532) | 13,794,592 |
| Of which Section 16 filers | 38 | 15,458,124 | 4,184.7 | (1,663,532) | 13,794,592 |
Three notices totalling 554,274 shares came from Day 1 Academies and the Bezos Earth Fund Foundation, described in their own filings as nonprofits founded by Jeffrey P. Bezos. Each traces to a founder gift reported days earlier on Form 4: 103,437 shares gifted 7 November 2025, 220,200 gifted 4 May 2026 and 230,637 gifted 26 August 2026. These entities file no Form 4, so whether they sold is not observable in Section 16 data, and their sales do not appear in any figure above. The notices cover 20.3% of the 2,725,115 shares the founder gifted in the window, which leaves the disposition of the remaining 79.7% unreported in the filings reviewed.
What the record supports
Insider selling at Amazon is mechanical. Plans set before the window governed every sale, vesting dates set the calendar, and the largest single channel of share movement was a gift rather than a trade. The absence of purchases is normal for this filer group and matches the prior twelve months, in which the founder also bought nothing. The two facts that carry information are the 97% slowdown in founder disposals year on year and the 13,790,351 share balance of his August 2026 notice that has not yet appeared as a reported sale.
8 Risk Factors
Amazon changed the words in Item 1A and left the architecture alone. The FY2025 10-K carries 23 risk factors in three categories, the same 23 headings in the same order as the FY2024 10-K. Nothing was added and nothing was dropped. Fourteen headings were reworded and nine are identical word for word. Total churn across the item is 194 words added or deleted against a base of 8,297, 2.3%.
The rewording runs in two directions. Artificial intelligence moves from a technology Amazon sells to a hazard Amazon carries: nine mentions become 16, machine learning three become six, and the new placements are in security, hiring, expansion strain and share price volatility rather than in the product sections. Tariffs go from two mentions to eight, and for the first time the filing names tariffs proposed or implemented by the United States and retaliatory action by other countries. Antitrust language did not move. Item 1A carries no risk factor on the capital intensity of the artificial intelligence build.
Table 28. Item 1A risk factor inventory, FY2025 10-K against FY2024 10-K
Status is measured by paragraph level diff of the extracted item text rather than by heading string.
| Risk factor | Status | What changed |
|---|---|---|
| Business and industry risks | ||
| We Face Intense Competition | Reworded | Adds artificial intelligence to the technologies that let smaller rivals enter and let customers compare. |
| Our Expansion into New Products, Services, Technologies, and Geographic Regions Subjects Us to Additional Risks | Reworded | Names development and adoption of automation and artificial intelligence, for customer and internal use, as a newer activity whose profitability may miss expectations. |
| Our International Operations Expose Us to a Number of Risks | Reworded | Adds retaliatory trade measures and names tariff policy changes twice, once against China sourcing and third party seller exposure. |
| The Variability in Our Retail Business Places Increased Strain on Our Operations | Reworded | Ties inflation risk to tariff policy changes. |
| We Are Impacted by Fraudulent or Unlawful Activities of Sellers | Unchanged | No change in wording. |
| We Face Risks Related to Adequately Protecting Our Intellectual Property Rights and Being Accused of Infringing Intellectual Property Rights of Third Parties | Unchanged | No change. The claim that Amazon and customer use of artificial intelligence may raise infringement claims stands as filed a year ago. |
| We Have Foreign Exchange Risk | Unchanged | No change in the 10-K. Extended in the Q2 2026 10-Q, see Table 29. |
| Operating risks | ||
| Our Expansion Places a Significant Strain on our Management, Operational, Financial, and Other Resources | Reworded | Adds scaling technology infrastructure and adopting artificial intelligence and machine learning as sources of strain. Densest change in the item at 19 words on a base of 83. |
| We Experience Significant Fluctuations in Our Operating Results and Growth Rate | Reworded | Names tariffs proposed or implemented by the United States and other countries, and any retaliatory action, as a driver of quarterly variability. Largest absolute change at 47 words. |
| We Face Risks Related to Successfully Optimizing and Operating Our Fulfillment Network and Data Centers | Reworded | Adds tariff policy changes to the events that disrupt inbound inventory and outbound shipment. Data centre capacity language is unchanged. |
| We Could Be Harmed by Data Loss or Other Security Incidents | Reworded | Names artificial intelligence twice, as third party technology relied on and as a means by which security controls may be circumvented. |
| We Face Risks Related to System Interruption and Lack of Redundancy | Reworded | Extends technical hiring competition to artificial intelligence and machine learning staff. |
| Our Supplier Relationships Subject Us to a Number of Risks | Reworded | Adds labour and trade disputes to supplier disruption causes. The warning on a limited group of graphics processing unit suppliers is unchanged. |
| Our Commercial Agreements, Strategic Alliances, and Other Business Relationships Expose Us to Risks | Unchanged | No change in wording. |
| Our Business Suffers When We Are Unsuccessful in Making, Integrating, and Maintaining Acquisitions and Investments | Unchanged | No change in the 10-K. A new investee governance bullet appears in the Q1 2026 10-Q, see Table 29. |
| We Face Significant Inventory Risk | Reworded | Attributes rapid pricing change to tariff policy changes. |
| We Are Subject to Payments-Related Risks | Unchanged | No change in wording. |
| We Have a Rapidly Evolving Business Model and Our Stock Price Is Highly Volatile | Reworded | Adds artificial intelligence to the technology trends that move the share price. |
| Legal and regulatory risks | ||
| Government Regulation Is Evolving and Unfavorable Changes Could Harm Our Business | Reworded | Broadens open competition and consumer protection investigations from rules to rules or regulations. The named exposures, Amazon stores, the fulfilment network, Prime and AWS cloud services, are unchanged. |
| Claims, Litigation, Government Investigations, and Other Proceedings May Adversely Affect Our Business and Results of Operations | Unchanged | No change. Price fixing, monopolisation and consumer protection matters brought by state attorneys general and the Federal Trade Commission stay as filed in FY2024. |
| We Are Subject to Product Liability Claims When People or Property Are Harmed by the Products We Sell or Manufacture | Unchanged | No change in wording. |
| We Face Additional Tax Liabilities and Collection Obligations | Reworded | Drops a forward commitment phrase. No change to the substance of the exposure. |
| We Are Subject to Risks Related to Government Contracts and Related Procurement Regulations | Unchanged | No change in wording. |
The preamble gained a hedge that no individual risk factor carries. FY2025 adds that the disclosures reflect Amazon's beliefs and opinions, and that references to past events are examples only and are not a representation as to whether such factors have occurred. That addition is drafting language, and it applies to all 23 factors at once.

Artificial intelligence moved from opportunity to operating hazard
Amazon reclassified artificial intelligence inside Item 1A without writing a dedicated risk factor for it. The FY2024 filing treated artificial intelligence mainly as a competitive and infringement topic. FY2025 adds it in four operating places: technology infrastructure scaling strain, third party technology dependence, circumvention of security controls, and competition for engineering staff. The supplier paragraph already warned that a limited group of suppliers provides semiconductor products related to artificial intelligence infrastructure such as graphics processing units, and that constraints could hurt Amazon's ability to develop and operate artificial intelligence services. That sentence is unchanged year on year, so the graphics processing unit supply concentration is not a new disclosure.
Management now treats artificial intelligence as a cost and execution exposure inside AWS and the retail infrastructure as well as a revenue driver. The disclosure lags the spending. Capital expenditure rose 58.8% to $131,819 million in FY2025 while the risk language absorbed 194 words of edits.
Tariffs are now the named macro risk
Tariff mentions rose from two to eight, and the wording shifted from generic trade protection to named policy. The FY2025 filing attributes inflation, inventory pricing volatility, quarterly result variability and fulfilment network disruption to tariff policy changes, and adds retaliatory measures by other countries to the international operations factor. It also links tariff policy to China, where the filing already states that China based sellers account for significant portions of third party seller services and advertising revenue and that China based suppliers provide significant portions of components and finished goods. Tariffs now touch the revenue line, the cost line and the inventory carrying value in the same item.
Antitrust language did not escalate
The two factors that carry competition exposure moved by seven words and zero words. Government Regulation broadened investigations from rules to rules or regulations. Claims and Litigation is identical, still naming price fixing, monopolisation and consumer protection matters brought by state attorneys general and the Federal Trade Commission. Amazon did not add a jurisdiction, a named statute or a quantified exposure in the annual filing.
Two readings are available. The disclosure implies no material change in antitrust exposure over FY2025. The alternative is that the FY2024 wording was already drafted at maximum breadth, covering Amazon stores, the fulfilment network, Prime and AWS cloud services, so any new proceeding lands inside existing language and needs no amendment. The interim filings favour the second reading: Q1 2026 added a named jurisdiction, Italy, to the same paragraph, which shows the paragraph does get amended when a specific exposure becomes material enough to name.
Capital intensity is the disclosure gap
Item 1A contains no risk factor on capital expenditure, funding of the infrastructure build, returns on invested capital, or asset impairment from overbuilt capacity. The phrase capital expenditure does not appear in the item in either year. The fulfilment and data centre factor mentions insufficient or excess capacity and impairment charges, and it has been in the filing for years and moved by three words.

Capital expenditure took 94.5% of operating cash flow in FY2025, against 71.6% in FY2024 and 62.1% in FY2023. Free cash flow measured as operating cash flow less gross purchases of property and equipment fell to $7,695 million from $32,878 million, a decline of 76.6%. That is the basis this chapter uses throughout; on Amazon's own measure, net of proceeds, the FY2025 figure is $11,194 million, as chapter 2 sets out. Capital expenditure reached 18.4% of net sales from 13.0%, and 2.00 times depreciation and amortisation from 1.57 times. Amazon issued $15,673 million of long term debt in FY2025 after issuing none in FY2024 and none in FY2023, and long term debt rose to $65,648 million from $52,623 million.

AWS took $96,496 million of the $142,352 million of property and equipment additions in FY2025, 67.8% of the total, from 62.1% in FY2024 and 51.4% in FY2023. Segment additions exceed the $131,819 million of cash purchases because additions include assets acquired under finance leases and financing obligations and the movement in unpaid capital accruals.
The stock implication is direct. A single segment now absorbs two thirds of a capital programme that consumes almost all operating cash flow, funded at the margin by new debt, and the risk disclosure that would frame utilisation, useful life and impairment for that programme was not written. An investor reading Item 1A alone would not learn that free cash flow fell by three quarters.
Table 29. Interim updates in 10-Q Part II Item 1A against the FY2025 10-K
Amazon reproduces the full Item 1A in each 10-Q rather than filing an update only section, so change is measured by diff against the 10-K.
| Filing | Risk factor | Status | What changed |
|---|---|---|---|
| Q1 2026 10-Q | Government Regulation Is Evolving and Unfavorable Changes Could Harm Our Business | Added | Names a jurisdiction for the first time: tax and other challenges in Italy. Carried into Q2 2026. |
| Q1 2026 10-Q | Our Business Suffers When We Are Unsuccessful in Making, Integrating, and Maintaining Acquisitions and Investments | Added | New bullet: investees may hold different strategic priorities, and Amazon does not control their decisions on strategy, operations, governance or compliance. Carried into Q2 2026. |
| Q2 2026 10-Q | We Have Foreign Exchange Risk | Added | Adds issuance of notes in foreign currencies, and foreign denominated note balances and payments, to the exposure. Absent from the Q1 2026 filing. |
The investee governance bullet is the interim change that matters. Other income moved to a gain of $15,229 million in FY2025 from a loss of $2,250 million in FY2024, and the FY2025 10-K attributes $7,709 million of that to upward adjustments on equity securities without readily determinable fair value, against $49 million in FY2024. Amazon is telling investors that a line item now large enough to move reported earnings sits with entities whose strategy and governance it does not control. The Q2 2026 foreign currency note addition is consistent with the shift to debt funded capital spending shown in Figure 27.
What the disclosure does not tell you
Item 1A is extracted as plain text, so risk factor boundaries are identified from heading structure rather than from the filer's typographic emphasis. The heading set is identical across both years, which removes ambiguity about additions and deletions, and a heading that Amazon styled differently would not be visible in the text stream.
Amazon quantifies nothing in Item 1A. No risk factor carries a loss estimate, a reserve, a probability or a sensitivity, in either year. The change measurement here is therefore textual. A risk whose likelihood rose sharply during FY2025 without a wording change would register as unchanged in Table 28.
9 Stock Price, Scenarios & Sensitivity
At $255.70, the last trade recorded on 3 September 2026, and on the 10,786,313,572 shares reported on the cover of the second quarter Form 10-Q, Amazon is valued at $2,758 billion. Reported earnings for the twelve months to 30 June 2026 were $12.39 a share, 20.6 times the price. Of the $175,466 million of pretax income behind that figure, $80,425 million is other income (expense), net, almost all of it an unrealised upward revaluation of the private holding in Anthropic. Strip that line and the equity method result, tax what is left at the 23.0% rate the company's own disclosure implies, and earnings are $6.65 a share, 38.4 times the price. Across a three year scenario built on stated inputs, the implied value per share at FY2028 runs from $112.83 to $415.42. The base case is $279.38, a 3.9% annualised total return over the 2.33 years to 31 December 2028, and the terminal multiple moves it more than the growth rate or the margin.
Where the stock stands

The five year record is a 55.7% gain from a September 2021 month end price of $164.25, 9.3% a year, and a tripling from the December 2022 month end of $84.00. The stock sits 10.0% below its highest daily close of $284.02 on 3 August 2026 and 28.6% above its lowest daily close of $198.79 on 13 February 2026. The twelve month path is four discrete repricings, each on a results release.
Table 30. Reaction of the stock to each results release, twelve months to 2 September 2026
| Release date | Release | Prior close | Next close | Move |
|---|---|---|---|---|
| 30 Oct 2025 | Third quarter 2025 results | 222.86 | 244.22 | 9.6% |
| 5 Feb 2026 | FY2025 results and first quarter 2026 guidance | 222.69 | 210.32 | (5.6%) |
| 29 Apr 2026 | First quarter 2026 results | 263.04 | 265.06 | 0.8% |
| 30 Jul 2026 | Second quarter 2026 results | 235.50 | 271.58 | 15.3% |
Each release was furnished on Form 8-K after the close, so the reaction is the following session. The two large gains both followed AWS acceleration: AWS revenue grew 36.8% in the second quarter of 2026 against 17.0% a year earlier, and 32.7% across the first half. The February fall followed the guidance: first quarter 2026 operating income was guided to $16,500 million to $21,500 million against $18,405 million a year earlier, a range whose midpoint implied a decline. The outcome was $23,852 million, 10.9% above the top of that guide, and the stock moved 0.8% on it, having already risen from $198.79 on 13 February to $263.04 by 29 April.
What the earnings number contains
Table 31. Reported earnings reconciled to core earnings, twelve months to 30 June 2026, $ millions
| Amount | |
|---|---|
| Operating income | 93,712 |
| Interest income | 4,660 |
| Interest expense | (3,331) |
| Other income (expense), net | 80,425 |
| Income before income taxes | 175,466 |
| Provision for income taxes | (39,615) |
| Equity method investment activity, net of tax | (570) |
| Reported net income | 135,281 |
| Less other income (expense), net | (80,425) |
| Core income before income taxes | 95,041 |
| Tax at 23.0% | (21,859) |
| Equity method investment activity, net of tax | (570) |
| Core net income | 72,612 |
| Diluted shares, million | 10,916 |
| Reported earnings per share, $ | 12.39 |
| Core earnings per share, $ | 6.65 |
The income tax note in the second quarter Form 10-Q names $15,900 million of net discrete tax expense in the first half of 2026, primarily attributable to the upward adjustments on the Anthropic investment. Removing that from the $27,759 million provision and removing other income from the pretax base leaves $11,859 million on $51,629 million, a rate of 23.0%. That is what the operating business pays.
Other income (expense), net was $15,229 million in FY2025 and $69,062 million in the first half of 2026 alone, of which $62,814 million was an upward adjustment for observable changes in price on equity investments in private companies. The carrying value of those holdings went from $16.2 billion at 31 December 2025 to $122.3 billion at 30 June 2026. None of it passes through operating income, and none of it is cash generated by the business.
Table 32. Multiple paid at each fiscal year end and at the price date
| Price | Reported EPS, $ | On reported | Core EPS, $ | On core | |
|---|---|---|---|---|---|
| FY2023 year end | 151.94 | 2.90 | 52.4x | 2.69 | 56.6x |
| FY2024 year end | 219.39 | 5.53 | 39.7x | 5.08 | 43.2x |
| FY2025 year end | 230.82 | 7.17 | 32.2x | 5.79 | 39.9x |
| At 3 September 2026 | 255.70 | 12.39 trailing | 20.6x | 6.65 trailing | 38.4x |
Core earnings grew 46.7% a year across the two audited years while the multiple paid on them fell from 56.6 times to 39.9 times. The rating has done none of the work in this stock since 2023; compounding has done all of it. That is the opposite of the pattern in most large capitalisation stocks and it sets the frame for the terminal multiple assumption below. One further adjustment belongs here. FY2025 operating income of $79,975 million carries the two charges the annual report names, $2,500 million on the Federal Trade Commission settlement and $2,700 million of severance, both in the third quarter of 2025 and therefore both inside the trailing twelve months. Before them, trailing core earnings are $7.02 a share and the multiple is 36.4 times.
The capital programme and what it does to the margin

Cash purchases of property and equipment went from $52,729 million in FY2023 to $82,999 million in FY2024 to $131,819 million in FY2025, and reached $173,028 million in the twelve months to 30 June 2026, 22.3% of revenue against 9.2% three years earlier. AWS took 67.8% of property additions in FY2025 and 76.0% in the first half of 2026. Free cash flow on Amazon's own definition was $38,219 million in FY2024, $11,194 million in FY2025 and $(7,604) million in the twelve months to 30 June 2026. Proceeds from debt were $82,400 million in the first half against $25,000 million in the whole of FY2025, and quarterly interest expense went from $516 million to $1,314 million on that.
The depreciation follows. Servers and networking equipment at gross cost went from $113,156 million to $172,492 million during FY2025, and in that year the estimated useful life of a subset of them was cut from six years to five, taking $1,000 million off net income and $0.10 off earnings per share. AWS segment depreciation was $15,353 million in the first half of 2026 against $9,234 million, up 66.3%, while AWS revenue grew 32.7%. Depreciation is now growing faster than the revenue it supports.
The scenarios model that directly. Servers and networking equipment depreciate at 20.0% a year, the five year life the annual report discloses. Applied to the average FY2025 balance that accounts for $28,565 million of the $41,860 million of property depreciation the company filed; the residual $13,295 million falls on the other $289,861 million of in service property, a rate of 5.07% and an implied life of 19.7 years. Both rates are then held fixed and the capital programme is run through them.
Three year scenarios
The horizon is FY2028, the year ending 31 December 2028, three fiscal years beyond the audited FY2025 figures and 2.33 years beyond the price date. Every case runs the same mechanics and differs only on the inputs in the top block of Table 33. Revenue growth is stated for each of the three years rather than as one compound rate, because the first year is already half reported and its third quarter is guided. Contribution is segment operating income before property depreciation, and it walks in equal steps from the FY2025 base to the stated FY2028 target: 52.09% for AWS, and for retail an advertising line at a 60% contribution margin blended with everything else at 2.62%. Depreciation comes from the two pools above. Operating income is contribution less depreciation. Core net income is operating income less net interest, taxed at 23.0%. Diluted shares grow 1.0% a year, the rate FY2025 and the first half of 2026 both show, and the filed cash flow statements record no dividend and no share repurchase in FY2023, FY2024 or FY2025. Implied value per share is FY2028 core earnings per share multiplied by the stated terminal multiple.
Table 33. Three year scenarios to FY2028, with every input stated so each case can be rebuilt from this table alone
| Best | Base | Worst | |
|---|---|---|---|
| Assumptions | |||
| AWS revenue growth, FY2026, FY2027, FY2028 | 33, 29, 25% | 32, 25, 20% | 29, 18, 12% |
| AWS contribution margin, FY2028 | 58.0% | 54.0% | 47.0% |
| Retail revenue growth, FY2026, FY2027, FY2028 | 14, 11, 10% | 13, 9, 8% | 11, 6, 5% |
| Advertising revenue growth, FY2026, FY2027, FY2028 | 26, 23, 20% | 24, 20, 17% | 20, 13, 9% |
| Retail contribution margin outside advertising, FY2028 | 3.60% | 2.80% | 2.00% |
| Capital expenditure, $ bn, FY2026, FY2027, FY2028 | 210, 240, 255 | 200, 225, 240 | 200, 230, 250 |
| Net interest expense, $m a year | 1,000 | 2,000 | 3,500 |
| Terminal multiple on FY2028 core EPS | 42x | 36x | 28x |
| FY2028 result, $ millions except where stated | |||
| AWS revenue | 276,067 | 254,876 | 219,459 |
| Retail revenue | 818,738 | 782,443 | 726,679 |
| Total revenue | 1,094,805 | 1,037,319 | 946,137 |
| Advertising revenue | 127,645 | 119,491 | 101,445 |
| Advertising share of retail revenue | 15.6% | 15.3% | 14.0% |
| AWS contribution | 160,119 | 137,633 | 103,146 |
| Retail contribution | 101,466 | 90,257 | 73,372 |
| Retail contribution margin, blended | 12.39% | 11.54% | 10.10% |
| Property depreciation | (117,293) | (113,461) | (114,640) |
| Depreciation as a share of revenue | 10.7% | 10.9% | 12.1% |
| Operating income | 144,292 | 114,429 | 61,877 |
| Operating margin | 13.18% | 11.03% | 6.54% |
| Core net income | 110,335 | 86,570 | 44,950 |
| Diluted shares, million | 11,155 | 11,155 | 11,155 |
| Core earnings per share, $ | 9.89 | 7.76 | 4.03 |
| Implied value per share, $ | 415.42 | 279.38 | 112.83 |
| Total return over the horizon | 62.5% | 9.3% | (55.9%) |
| Annualised over 2.33 years | 23.2% | 3.9% | (29.6%) |
The base case is an estimate built on the assumptions stated, and three things break it. The first is the opening year. Base case FY2026 revenue of $834,582 million needs $452,457 million in the second half against $393,555 million a year earlier. With the third quarter at the midpoint of the $197,000 million to $202,000 million guide, the fourth quarter has to reach $252,957 million, growth of 18.5% against a quarter that itself grew 13.6%. Management flagged that Prime Day timing costs the third quarter nearly 400 basis points of growth, which the fourth quarter should recover, and a fourth quarter below 15% starts every subsequent year lower.
The second is the depreciation. In the base case property depreciation reaches $113,461 million by FY2028, 10.9% of revenue against 5.8% in FY2025, and it consumes 49.8% of the $227,890 million of segment contribution. The worst case spends $680,000 million of capital across the three years, only $25,000 million less than the best case, and earns $103,146 million of AWS contribution against $160,119 million. That asymmetry is the whole distance between $112.83 and $415.42. The downside case is capital committed against demand that does not arrive.
The third is the terminal multiple, and it has no basis in any filing. At 36 times the base sits below the 38.4 times the stock trades on at the price date and below the 39.9 times paid at the FY2025 year end, and well below the 56.6 times paid at the FY2023 year end. Nothing in the accounts fixes where it settles. Table 33 states what each answer is worth.
What the best case requires
Five things have to hold together, and each is measurable in the filings.
AWS has to hold a growth rate it has held for two quarters. AWS revenue grew 18.5% in FY2024, 19.7% in FY2025, then 36.8% in the second quarter of 2026. The best case asks for 33%, 29% and 25%, a compound 29.0% over three years, which takes AWS from 18.0% of revenue to 25.2%. The acceleration is two quarters old and the capital behind it is committed for five years. AWS property and equipment, net of depreciation, stood at $263,750 million at 30 June 2026 against $190,055 million six months earlier.
The AWS contribution margin has to stay near where it has just moved to. AWS operating income before property depreciation was 52.09% of AWS revenue in FY2025, 51.45% in the first half of 2025 and 57.80% in the first half of 2026. The best case asks for 58.0% in FY2028, which is the level of the last two quarters. The improvement came from operating leverage against a depreciation charge that had not yet arrived. It arrives over the next five years.
Advertising has to keep compounding several times faster than the store it sits on. Advertising revenue grew 19.8% in FY2024, 22.1% in FY2025 and 25.1% in the first half of 2026, against retail revenue growth of 14.8%. It reached 11.7% of retail revenue in FY2025 and 12.3% in the first half of 2026. The best case takes it to 15.6% by FY2028. At the 60% contribution margin assumed here, advertising already accounts for 75.2% of retail contribution, which is why moving its growth rate is worth $37.24 a share in Table 35 while moving the whole retail revenue line is worth $6.41.
The retail business outside advertising has to improve at all. At the assumed split it runs at a 2.62% contribution margin, before any depreciation. The best case takes it to 3.60% and the worst to 2.00%. That is a narrower range than it looks: 160 basis points on the $691,093 million of FY2028 retail revenue outside advertising in the best case is $11,057 million of contribution, an eighth of the $82,415 million FY2028 gap between the best and worst operating income.
Capital has to be spent and then stopped. The best case spends $705,000 million over three years, $40,000 million more than the base. It works only because the revenue arrives with it. Free cash flow on Amazon's own measure was already $(7,604) million in the twelve months to 30 June 2026 against $18,184 million a year earlier, and the shortfall is being funded with debt.
Core assumptions and what drives demand
Demand rests on three things the filings measure. AWS customer usage, which the annual report names as the driver of AWS growth, partially offset by price reductions on long term contracts. Unit volume through the store, which the segment commentary attributes to price, selection and delivery speed, and which carried North America to 16% growth and International to 15% in the second quarter of 2026. And advertising, which grew 26.2% in the same quarter. Foreign exchange increased net sales by $4,409 million in FY2025 and by $2,952 million in the first half of 2026, and the scenarios are stated in reported dollars, so that swing sits outside them.
Table 34. The assumptions in Table 33 that no filing supports, and what bounds each
| Assumption | Value used | What bounds it |
|---|---|---|
| Terminal multiple on FY2028 core earnings | 28x to 42x | Core multiples of 56.6x, 43.2x and 39.9x at the last three year ends, and 38.4x at the price date |
| Advertising contribution margin | 60% | Amazon discloses no cost against advertising revenue. The blend with the rest of retail reproduces the filed FY2025 segment result at any split |
| Server share of capital spend | 45% | The FY2025 gross property roll forward, in which servers and networking equipment took $59,336 million of the $140,043 million increase, 42.4%, before any of the $71,745 million of construction in progress converts |
| Net interest expense a year | $1,000m to $3,500m | Interest expense went from $516 million in the second quarter of 2025 to $1,314 million in the second quarter of 2026 as $82,400 million of debt was raised |
One disclosure limit runs through the AWS margin assumption. The second quarter Form 10-Q states that technology and infrastructure costs in the quarter include net unrealised gains on energy contracts subject to derivative accounting, primarily related to AWS, and adds that those measurements may be material to the line in future periods. The amount is not given. The AWS contribution margin of 58.48% in that quarter therefore cannot be cleanly compared with the 48.60% of the same quarter a year earlier, and the FY2028 target of 54.0% in the base case carries that much imprecision at its starting point.
Sensitivity

Table 35. One way sensitivity of implied value per share, ranked by swing, $
| Variable | Input behind the low value | Input behind the high value | Low value | High value | Swing |
|---|---|---|---|---|---|
| Terminal multiple on FY2028 core EPS | 28x | 42x | 217.30 | 325.95 | 108.65 |
| AWS revenue growth, compound, FY2025 to FY2028 | 19.5% | 29.0% | 231.86 | 307.82 | 75.96 |
| AWS contribution margin, FY2028 | 47.0% | 58.0% | 235.05 | 304.72 | 69.67 |
| Advertising contribution margin | 50% | 70% | 249.69 | 309.08 | 59.39 |
| Server share of capital spend | 55% | 35% | 259.17 | 299.60 | 40.43 |
| Advertising revenue growth, compound, FY2025 to FY2028 | 13.9% | 23.0% | 253.73 | 290.97 | 37.24 |
| Capital expenditure, $ bn a year | 230, 275, 310 | 200, 225, 240 | 245.69 | 279.38 | 33.69 |
| Retail contribution margin outside advertising, FY2028 | 2.00% | 3.60% | 266.20 | 292.56 | 26.36 |
| Retail revenue growth, compound, FY2025 to FY2028 | 7.3% | 11.7% | 275.50 | 281.91 | 6.41 |
| Net interest expense, $m a year | 3,500 | 1,000 | 275.65 | 281.87 | 6.21 |
Moving the terminal multiple across the range the stock has been paid over three year ends changes the implied value by $108.65 a share. The two operating variables that come next are both AWS, at $75.96 and $69.67. The whole retail revenue line, moved across a 440 basis point range of compound growth, is worth $6.41. Amazon is a cloud stock with a large distribution business attached, and the sensitivity says so before any narrative does.
Two entries in the table are modelling assumptions rather than business outcomes, and both rank high. The advertising contribution margin is worth $59.39 across a 50% to 70% range, which is a fair statement of how much of the retail result depends on a split Amazon does not disclose. The server share of capital spend is worth $40.43 across 35% to 55%, because the same dollar of capital creates four times the annual depreciation if it buys a server rather than a building.

The two inputs that move the outcome most are the multiple and AWS growth, so they are the axes. Growth enters the grid as one compound rate, which reaches the identical FY2028 revenue, margin and depreciation as the three annual rates the scenarios state, so nothing is lost at the horizon. Nineteen of the thirty six combinations clear the price of $255.70, and their shape is the argument. At 16% compound AWS growth the stock needs 44.5 times to stand still, above anything paid since FY2023. At 20% it needs 39.0 times, which is the FY2025 year end rating. At 26%, close to the base case, it needs 32.5 times. At 32% it needs 27.5 times. A holder at $255.70 is underwriting AWS compounding in the mid twenties and a multiple in the low thirties, and each can substitute for the other only within a narrow band.
An alternative reading is available and deserves stating. AWS grew 36.8% in the last reported quarter and 32.7% across the half, third quarter operating income is guided to $22,500 million to $26,500 million against $17,422 million, and the first quarter beat the top of its own guide by 10.9%. On that reading the base case understates the first two years, the top left of the grid is the relevant region rather than the middle, and the capital programme is the reason to own the stock rather than the risk in it. The counter is in the same accounts: free cash flow is negative, the depreciation from $665,000 million of base case capital spending has barely started to land, and $62,669 million of the $135,281 million of reported net income, 46.3% of it, is unrealised marks on private holdings. Table 33 does not settle which reading is right. It states what each is worth.
Sources
All financial statement data comes from filings with the Securities and Exchange Commission, retrieved through the SEC-API.io MCP server. Amazon.com, Inc. is Central Index Key 1018724.
Table 36. Amazon.com, Inc. filings used
| Form | Period or date | Filed or furnished | Accession number |
|---|---|---|---|
| 10-K | Year ended 31 December 2025 | 5 February 2026 | 0001018724-26-000004 |
| 10-K | Year ended 31 December 2024 | 6 February 2025 | 0001018724-25-000004 |
| 10-K | Year ended 31 December 2023 | 1 February 2024 | 0001018724-24-000008 |
| 10-K | Year ended 31 December 2021 | 3 February 2022 | 0001018724-22-000005 |
| 10-Q | Quarter ended 30 June 2026 | 30 July 2026 | 0001018724-26-000026 |
| 10-Q | Quarter ended 31 March 2026 | 29 April 2026 | 0001018724-26-000014 |
| 10-Q | Quarter ended 30 September 2025 | 30 October 2025 | 0001018724-25-000123 |
| 10-Q | Quarter ended 30 June 2025 | 31 July 2025 | 0001018724-25-000086 |
| 10-Q | Quarter ended 31 March 2025 | 2 May 2025 | 0001018724-25-000036 |
| 10-Q | Quarters ended 30 June and 30 September, 2022 to 2024 | various | 0001018724-22-000019, 0001018724-22-000023, 0001018724-23-000012, 0001018724-23-000018, 0001018724-24-000130, 0001018724-24-000161 |
| 8-K, Exhibit 99.1 | Q2 2026 results | 30 July 2026 | 0001018724-26-000024 |
| 8-K, Exhibit 99.1 | Q1 2026 results | 29 April 2026 | 0001018724-26-000012 |
| 8-K, Exhibit 99.1 | Q4 and full year 2025 results | 5 February 2026 | 0001018724-26-000002 |
| 8-K, Exhibit 99.1 | Q3 2025 results | 30 October 2025 | 0001018724-25-000121 |
| 8-K, Exhibit 99.1 | Q4 and full year results, 2021 to 2024 | various | 0001018724-22-000002, 0001018724-23-000002, 0001018724-24-000006, 0001018724-25-000002 |
| 8-K | July 2026 note offering | 9 July 2026 | 0001104659-26-082293 |
| 8-K | Canadian dollar note offering | 12 June 2026 | 0001104659-26-073562 |
| 8-K | Delayed draw term loan | 10 June 2026 | 0001104659-26-072140 |
| 8-K, Item 5.07 | 2026 annual meeting results | 22 May 2026 | 0001104659-26-065717 |
| 8-K, Item 7.01 | Globalstar merger agreement | 14 April 2026 | 0001104659-26-042880 |
| 8-K, Item 7.01 | Annual letter to shareholders | 8 April 2026 | 0001104659-26-041034 |
| 8-K | Euro note offering | 16 March 2026 | 0001104659-26-028556 |
| 8-K | March 2026 dollar note offering | 13 March 2026 | 0001104659-26-027729 |
| 8-K, Item 1.01 | OpenAI equity commitment letter | 27 February 2026 | 0001104659-26-021050 |
| 8-K | November 2025 note offering | 20 November 2025 | 0001104659-25-114647 |
| DEF 14A | 2026 annual meeting | 8 April 2026 | 0001104659-26-041026 |
| DEF 14A | 2025 annual meeting | 9 April 2025 | 0001104659-25-033442 |
| SC 13G/A | Bezos, event 30 September 2025 | 14 October 2025 | 0001104659-25-099267 |
| SC 13G/A | Bezos, event 30 September 2024 | 8 November 2024 | 0001104659-24-115906 |
| SC 13G/A | The Vanguard Group, event 29 December 2023 | 13 February 2024 | 0001104659-24-020003 |
| SC 13G/A | BlackRock, Inc., event 31 December 2023 | 12 February 2024 | 0001086364-24-006979 |
| SC 13G/A | Bezos, event 31 December 2023 | 26 January 2024 | 0001104659-24-007255 |
| SC 13G/A | Bezos, event 31 December 2022 | 27 January 2023 | 0001193125-23-017572 |
| SC 13G/A | Bezos, event 31 December 2021 | 28 January 2022 | 0001193125-22-021680 |
| 13F-HR | Vanguard complex, quarter ended 30 September 2025 | 7 November 2025 | 0000102909-25-000353 |
| 13F-HR | Vanguard complex, quarter ended 31 December 2025 | 29 January 2026 | 0000102909-26-000031 |
| 13F-HR | Vanguard complex, quarters ended 31 March and 30 June 2026, eleven filers each | various | listed in the note below |
| 13F-HR | State Street Corp, four quarters ended 30 June 2026 | 14 November 2025 to 7 August 2026 | 0000093751-25-000651, 0000093751-26-000100, 0000093751-26-000315, 0000093751-26-000507 |
| 13F-HR | BlackRock, Inc., quarter ended 30 June 2026 | 7 August 2026 | 0002012383-26-003238 |
| 13F-HR | Census of all filers reporting the stock, four quarters ended 30 June 2026 | various | 24,343 filings, not enumerated |
| Form 4 | Twelve months to 3 September 2026, 73 filings by 17 Section 16 filers | various | five founder filings at 0001043298-25-000003, 0001043298-25-000005, 0001018724-26-000016, 0001018724-26-000028 and 0001043298-26-000002; the remaining 68 not enumerated |
| Form 144 | Twelve months to 3 September 2026, 41 notices | various | four notices named in the text at 0001950047-25-008654, 0001950047-26-004091, 0001950047-26-007580 and 0001950047-26-008794; the remaining 37 not enumerated |
| S-4 | Globalstar merger | 31 July 2026 | 0001104659-26-089294 |
The Vanguard complex reported through a single combination report to the December 2025 quarter and through eleven separate filers from the March 2026 quarter after an internal realignment, which is why the two 2026 quarters carry eleven accession numbers each. For the quarter ended 31 March 2026 they are 0000217448-26-000012, 0000933478-26-000004, 0000947529-26-000012, 0001104659-26-061303, 0001550100-26-000004, 0001680208-26-000005, 0001730578-26-000002, 0001811242-26-000004, 0001984256-26-000004, 0002100119-26-001306 and 0002100121-26-000861, with seven later amendments superseding parts of them. For the quarter ended 30 June 2026 they are 0000217448-26-000023, 0000933478-26-000015, 0000947529-26-000022, 0001104659-26-093984, 0001550100-26-000015, 0001680208-26-000016, 0001730578-26-000003, 0001811242-26-000015, 0001984256-26-000011, 0002100119-26-001527 and 0002100121-26-001018.
Three sets of accession numbers are not enumerated above, and each is a count rather than a citation. The first column of Table 21 is a census of every 13F-HR filing reporting CUSIP 023135106, 24,343 filings across the four quarters, and no individual filing supports a number in this document. The Form 4 record behind Tables 25 and 26 is 73 filings and the Form 144 record behind Table 27 is 41 notices, each identified in those tables by filer and date; the filings singled out in the text carry their accession numbers in Table 36. BlackRock filed 13F-HR reports for the September 2025, December 2025 and March 2026 quarters, but the holdings payload for those three quarters could not be retrieved through the filings interface, so Table 21 shows the June 2026 quarter alone and puts no estimate in the other three.
Table 37. Peer company filings used
| Company | Form | Fiscal year end | Accession number |
|---|---|---|---|
| Walmart Inc. | 10-K | 31 Jan 2026 | 0000104169-26-000055 |
| Costco Wholesale Corporation | 10-K | 31 Aug 2025 | 0000909832-25-000101 |
| Target Corporation | 10-K | 31 Jan 2026 | 0000027419-26-000016 |
| Coupang, Inc. | 10-K | 31 Dec 2025 | 0001834584-26-000024 |
| Microsoft Corporation | 10-K | 30 Jun 2026 | 0001193125-26-323660 |
| Alphabet Inc. | 10-K | 31 Dec 2025 | 0001652044-26-000018 |
| Oracle Corporation | 10-K | 31 May 2026 | 0001193125-26-277521 |
Peer share counts come from the cover pages of the most recent periodic report for each company: accession numbers 0001018724-26-000026, 0000104169-26-000154, 0000909832-26-000051, 0000027419-26-000042, 0001834584-26-000073, 0001193125-26-323660, 0001652044-26-000071 and 0001193125-26-277521.
Four classes of figure sit outside the SEC-API.io credit above, and each is named where it is used. Sector sizing comes from Synergy Research Group, 5 February 2026, and from the United States Census Bureau series ECOMPCTNSA retrieved from the Federal Reserve Bank of St. Louis, updated 18 August 2026. Share prices, the results day moves and the twelve month extremes come from a market data feed and are not part of the filings above; prices are the last trade recorded on the date stated rather than a session close. Earnings call transcripts are not EDGAR documents; each quotation was corroborated across two independent transcript publications before use, and the $220 billion 2026 capital figure exists only there. Insider prices are the share weighted averages reported on the filings themselves and are inside the credit.
Disclaimer
This document is not financial advice. It is a factual analysis of public filings prepared for information only. It is not an offer, a solicitation or a recommendation to buy, sell or hold any security, and it takes no account of the objectives, financial situation or needs of any reader. Figures are drawn from the filings listed above and from the market and sector sources named beside them, and they may contain error or have been superseded. Anyone acting on it should take their own advice. Past performance is no guide to future returns, and the scenarios in chapter 9 are estimates built on stated assumptions, not forecasts.