Insights derived from analysing SEC filings. Independent analysis, not a publication of the SEC.
Figures come from Forms 10-K for FY2021 to FY2025, Forms 10-Q for FY2025 and FY2026, and Forms 8-K from Jul 2024 to Sep 2026 with their quarterly earnings exhibits 99.1. Other sources are proxy statements of 2025 and 2026, Schedules 13G, Forms 13F and Forms 4 and 144 filed under central index key 1730168, and comparable filings of seven peers. The Sources appendix lists the accession number of every filing used. Market prices are closing prices of 30 September 2026.
AI revenue drives growth. Q3 FY2026 revenue (to 2 Aug 2026) was $29.59bn, up 86%. AI semiconductor revenue was
$16.7bn, up 221% and 56% of the total. Q4 FY2026 guidance is about $34.8bn of revenue, including $21.7bn of AI revenue. On the Sep 2026 call,
management put FY2026 AI revenue at about $58bn and FY2027 AI revenue at about $115bn.
Contracted revenue rose 5.4x. Remaining performance obligations were $179.2bn at 2 Aug 2026, up from $33.3bn at FY2025 year end.
The increase followed a long term custom AI accelerator contract signed in Q2 FY2026. About 25% is due within twelve months. Purchase commitments rose to $126.8bn.
Core operating margin was 57.5% TTM. TTM gross margin was 68.8% and GAAP operating margin 48.0%.
Core margin excludes acquired intangible amortization and restructuring but counts stock compensation as a cost.
On the call, management guided Q4 gross margin to about 73%, down from 75.0% non GAAP in Q3, due to higher memory content.
Concentration and financing exposure increased. One distributor was 50% of Q3 revenue and the five largest end customers about 55%, up from
32% and 40% a year earlier. Broadcom backstops one customer's AI rack leases, with maximum exposure of about $29bn.
Shares trade at 45x TTM GAAP EPS. At $351.19, shares trade at 36x TTM non GAAP EPS and
30x FY2026 non GAAP EPS of $11.61. The FY2026 figure combines nine month actuals and Q4 guidance. EV is 19.2x TTM revenue.
Scenario values for end FY2029 are $118 (worst), 447 (base) and 841 (best) per share.
Current price is 44x worst case, 17x base case and 12x best case FY2029 core EPS. In the sensitivity analysis,
AI revenue and the exit P/E move value the most.
Views on these results differ. Arguments for a lower valuation cite customer concentration, the lease backstop, supply limits in memory and
advanced wafers, and 66.4% say on pay support in 2026. Arguments for a higher valuation cite $179.2bn of contracted revenue, Google, Apple and Anthropic agreements, and hyperscaler capital spending of about $720bn to 745bn guided for 2026.
Broadcom designs and supplies semiconductors and infrastructure software. Semiconductor solutions covers custom AI accelerators (XPUs),
Ethernet switching and routing, network interface cards, optics, wireless, storage and broadband chips. Infrastructure software covers VMware private cloud,
mainframe, cybersecurity and other enterprise software. Semiconductors were 67% of TTM revenue
and 70% of Q3 FY2026 revenue.
Acquisitions. VMware closed on 22 Nov 2023 for about $30.8bn in cash and 544m shares (split adjusted); goodwill rose from $43.7bn to
$97.9bn. Broadcom sold the end user computing unit to KKR for $3.5bn on 1 Jul 2024. It repaid the 2023 term loans that funded the deal by Jul 2025.
Customer agreements. Google: custom TPUs and AI rack components, with terms up to 2031. Anthropic will access about 3.5 GW of TPU based compute through
Broadcom from 2027 (8-K, 6 Apr 2026). Apple: custom silicon across several product generations through 2031 (8-K, 6 Jul 2026).
AI XPV platform. Broadcom set up the platform with financial partners for more than 20 GW of XPU based compute through 2028. A first $35bn tranche in Jun 2026 funds more
than 1 GW for one customer. The customer may issue Broadcom up to $42bn of convertible notes (Q3 FY2026 10-Q).
Supply and people. TSMC made about 95% of contract manufactured wafers in FY2025. Broadcom has about 33,000 employees, 57% of them in R&D, and about 19,000 patents.
Table 1.1. Revenue by segment
Segment
FY2021
FY2022
FY2023
FY2024
FY2025
TTM
FY2025 y/y
9M FY2026 y/y
TTM share
Semiconductor solutions
20.38bn
25.82bn
28.18bn
30.10bn
36.86bn
59.44bn
22.5%
87.6%
66.7%
Infrastructure software
7.07bn
7.38bn
7.64bn
21.48bn
27.03bn
29.67bn
25.8%
13.1%
33.3%
Total revenue
27.45bn
33.20bn
35.82bn
51.57bn
63.89bn
89.10bn
23.9%
55.0%
100.0%
TTM = Q4 FY2025 to Q3 FY2026. Software revenue in FY2024 and later includes VMware.
Table 1.2. Segment operating income
$
FY2021
FY2022
FY2023
FY2024
FY2025
TTM
Semiconductor solutions
10.98bn
15.07bn
16.49bn
16.76bn
21.23bn
36.06bn
Infrastructure software
4.94bn
5.22bn
5.64bn
13.98bn
20.77bn
23.71bn
Unallocated expenses
(7.39)bn
(6.07)bn
(5.92)bn
(17.27)bn
(16.51)bn
(16.96)bn
Semiconductor segment margin
53.8%
58.4%
58.5%
55.7%
57.6%
60.7%
Software segment margin
69.8%
70.7%
73.8%
65.1%
76.8%
79.9%
Unallocated expenses include acquired intangible amortization, stock compensation, restructuring and other items; from FY2025 they equal total operating income less the two segments.
Table 1.3. Revenue by ship to country
Country
FY2021
FY2022
FY2023
FY2024
FY2025
FY2025 share
United States
5.29bn
5.92bn
6.97bn
12.89bn
16.51bn
25.8%
China
9.75bn
11.64bn
11.53bn
10.48bn
11.15bn
17.5%
Singapore
2.75bn
4.00bn
4.48bn
9.56bn
10.80bn
16.9%
Taiwan
n/a
n/a
n/a
n/a
6.45bn
10.1%
Other
9.66bn
11.65bn
12.83bn
18.64bn
18.98bn
29.7%
China includes Hong Kong. Taiwan is reported separately from FY2025; before that it is in Other. Broadcom states that a substantial portion of products shipped to China ends up in devices sold in the US and Europe.
Nine month FY2026 revenue rose 55.0% to $71.09bn; semiconductor revenue rose 87.6% and software
13.1%. GAAP operating income rose 96.4% to $35.31bn.
Net income rose 103.6% to $29.75bn. Nine month tax provision rose to $3.85bn from
$1.25bn a year earlier after Singapore's global minimum tax took effect.
Table 2.1. Income statement; TTM = Q4 FY2025 to Q3 FY2026
$
FY2021
FY2022
FY2023
FY2024
FY2025
TTM
Revenue
27.45bn
33.20bn
35.82bn
51.57bn
63.89bn
89.10bn
Cost of revenue
(10.61)bn
(11.11)bn
(11.13)bn
(19.07)bn
(20.59)bn
(27.83)bn
Gross profit
16.84bn
22.09bn
24.69bn
32.51bn
43.29bn
61.28bn
Research and development
(4.85)bn
(4.92)bn
(5.25)bn
(9.31)bn
(10.98)bn
(11.84)bn
Selling, general and administrative
(1.35)bn
(1.38)bn
(1.59)bn
(4.96)bn
(4.21)bn
(4.18)bn
Operating income
8.52bn
14.22bn
16.21bn
13.46bn
25.48bn
42.81bn
of which acquired intangible amortization
(5.40)bn
(4.36)bn
(3.25)bn
(9.27)bn
(8.06)bn
(7.99)bn
of which restructuring and impairment
(165.0)m
(62.0)m
(248.0)m
(1.79)bn
(667.0)m
(466.0)m
Interest expense
(1.89)bn
(1.74)bn
(1.62)bn
(3.95)bn
(3.21)bn
(3.12)bn
Other income, net
131.0m
(54.0)m
512.0m
406.0m
455.0m
771.0m
Income tax
(29.0)m
(939.0)m
(1.01)bn
(3.75)bn
397.0m
(2.20)bn
Net income
6.74bn
11.49bn
14.08bn
5.89bn
23.13bn
38.27bn
Diluted EPS, $
1.50
2.65
3.30
1.23
4.77
7.83
Diluted shares, m
4,290
4,230
4,270
4,778
4,853
4,887
Fiscal years end on the Sunday nearest 31 Oct; FY2024 had 53 weeks. EPS and share counts are adjusted for the 10 for 1 split of Jul 2024. FY2021 and FY2022 EPS deduct preferred dividends of $299m and 272m. FY2024 tax includes a $4.5bn non cash provision in Q3 FY2024. TTM EPS is the sum of four quarters.
Table 2.2. What changed: FY2025 against FY2024 and 9M FY2026 against 9M FY2025
Full year
Nine months
$
FY2024
FY2025
Change
9M FY2025
9M FY2026
Change
Revenue
51.57bn
63.89bn
23.9%
45.87bn
71.09bn
55.0%
Semiconductor solutions
30.10bn
36.86bn
22.5%
25.79bn
48.36bn
87.6%
Infrastructure software
21.48bn
27.03bn
25.8%
20.09bn
22.73bn
13.1%
Gross profit
32.51bn
43.29bn
33.2%
31.05bn
49.03bn
57.9%
Research and development
9.31bn
10.98bn
17.9%
8.00bn
8.86bn
10.7%
Selling, general and administrative
4.96bn
4.21bn
(15.1%)
3.10bn
3.07bn
(1.1%)
Operating income
13.46bn
25.48bn
89.3%
17.98bn
35.31bn
96.4%
Net income
5.89bn
23.13bn
292.3%
14.61bn
29.75bn
103.6%
Operating cash flow
19.96bn
27.54bn
37.9%
19.83bn
32.95bn
66.1%
Free cash flow
19.41bn
26.91bn
38.6%
19.45bn
31.94bn
64.2%
Stock based compensation
5.67bn
7.57bn
33.5%
5.37bn
6.29bn
17.0%
Dividends paid
9.81bn
11.14bn
13.5%
8.35bn
9.28bn
11.2%
Share repurchases
7.18bn
2.45bn
(65.9%)
2.45bn
8.45bn
244.9%
Gross margin
63.0%
67.8%
4.7 pts
67.7%
69.0%
1.3 pts
Operating margin
26.1%
39.9%
13.8 pts
39.2%
49.7%
10.5 pts
Table 2.3. Core earnings reconciliation
$
FY2025
TTM
Operating income, GAAP
25.48bn
42.81bn
Add: acquired intangible amortization
8.06bn
7.99bn
Add: restructuring and impairment
667.0m
466.0m
Operating income, core
34.21bn
51.27bn
Operating margin, core
53.6%
57.5%
Income before tax, GAAP
22.73bn
40.47bn
Less: business sale gain (FY2025) and VMware excise tax reversal (TTM)
(163.0)m
(315.0)m
Add: amortization, restructuring and impairment
8.73bn
8.46bn
Income before tax, core
31.30bn
48.61bn
Net income, core (16% tax)
26.29bn
40.84bn
Diluted EPS, GAAP / core, $
4.77 / 5.42
7.83 / 8.36
Diluted EPS, company non GAAP, $
6.82
9.76
Core earnings count stock based compensation as a cost and tax adjusted income at 16%, the company non GAAP tax rate in 9M FY2026. Company non GAAP EPS also excludes stock compensation (Ex 99.1 of each quarter).
Table 2.4. Ratio analysis, FY2021 to FY2025 and TTM
Ratio
FY2021
FY2022
FY2023
FY2024
FY2025
TTM
Growth
Revenue growth
n/a
21.0%
7.9%
44.0%
23.9%
48.7%
Semiconductor growth
n/a
26.7%
9.2%
6.8%
22.5%
n/a
Software growth
n/a
4.5%
3.4%
181.2%
25.8%
n/a
Software share
25.7%
22.2%
21.3%
41.6%
42.3%
33.3%
Profitability
Gross margin
61.4%
66.5%
68.9%
63.0%
67.8%
68.8%
Operating margin
31.0%
42.8%
45.2%
26.1%
39.9%
48.0%
Core operating margin
51.3%
56.2%
55.0%
47.5%
53.6%
57.5%
Net margin
24.5%
34.6%
39.3%
11.4%
36.2%
42.9%
FCF margin
48.5%
49.1%
49.2%
37.6%
42.1%
44.2%
ROE
27.0%
48.2%
60.3%
12.9%
31.0%
44.2%
ROA
8.9%
15.4%
19.3%
4.9%
13.7%
21.6%
Cost structure
R&D / revenue
17.7%
14.8%
14.7%
18.1%
17.2%
13.3%
SG&A / revenue
4.9%
4.2%
4.4%
9.6%
6.6%
4.7%
SBC / revenue
6.2%
4.6%
6.1%
11.0%
11.8%
9.5%
Amortization / revenue
19.7%
13.1%
9.1%
18.0%
12.6%
9.0%
Balance sheet and working capital
Goodwill and intangibles / assets
72.5%
69.3%
65.2%
83.6%
76.0%
66.0%
Days sales outstanding
28
33
32
31
41
56
Days inventory
91
104
88
66
66
83
Current ratio
2.64x
2.62x
2.82x
1.17x
1.71x
2.50x
Leverage and returns
Debt / equity
1.59x
1.74x
1.64x
1.00x
0.80x
0.60x
Net debt / EBITDA
1.91x
1.42x
1.25x
2.50x
1.43x
0.69x
Interest coverage
4.5x
8.2x
10.0x
3.4x
7.9x
13.7x
Shareholder returns / FCF
47%
86%
76%
88%
51%
52%
Valuation
EV / sales at year end
n/a
6.4x
10.1x
16.3x
28.0x
19.2x
P/E at year end
n/a
17x
25x
136x
77x
45x
Returns use average equity and assets. EBITDA = operating income plus depreciation and acquired intangible amortization. Days inventory uses cost of revenue less amortization. Year end valuation uses the October close; TTM uses 30 Sep 2026. TTM growth is measured against Q4 FY2024 to Q3 FY2025.
Table 2.5. Balance sheet, period end
$
FY2021
FY2022
FY2023
FY2024
FY2025
2 Aug 2026
Cash and equivalents
12.16bn
12.42bn
14.19bn
9.35bn
16.18bn
23.98bn
Accounts receivable
2.07bn
2.96bn
3.15bn
4.42bn
7.14bn
13.71bn
Inventories
1.30bn
1.93bn
1.90bn
1.76bn
2.27bn
4.52bn
Goodwill
43.45bn
43.61bn
43.65bn
97.87bn
97.80bn
97.80bn
Intangible assets
11.37bn
7.11bn
3.87bn
40.58bn
32.27bn
26.32bn
Total assets
75.57bn
73.25bn
72.86bn
165.65bn
171.09bn
188.15bn
Total debt
39.73bn
39.52bn
39.23bn
67.57bn
65.14bn
59.42bn
Net debt
27.57bn
27.10bn
25.04bn
58.22bn
48.96bn
35.44bn
Stockholders' equity
24.96bn
22.71bn
23.99bn
67.68bn
81.29bn
99.69bn
Shares outstanding, m
4,130
4,180
4,140
4,686
4,741
4,774
Table 2.6. Debt principal by maturity at 2 Aug 2026
Maturity
Principal
Within twelve months
2.25bn
2028 to 2029
7.53bn
2030 to 2031
14.76bn
2032 to 2033
12.18bn
2034 to 2036
17.01bn
2037 to 2056
7.35bn
Total principal, 42 instruments
61.08bn
Senior notes $59.3bn and fixed rate term loans $1.75bn; weighted coupon about 4.0%. A $7.5bn revolving facility is undrawn. Remaining buyback authorization is $10.1bn. Quarterly dividend is $0.65.
Broadcom guided Q4 FY2026 revenue to about $34.8bn, up 93%, with AI semiconductor revenue of $21.7bn and non GAAP operating margin of
about 66%. The Q3 release replaced adjusted EBITDA guidance with non GAAP operating income guidance. Releases guide one quarter ahead; the multiyear AI outlook comes from the call.
Table 3.1. Recent quarters and guidance (earnings releases, Ex 99.1)
Item
Q4 FY2025
Q1 FY2026
Q2 FY2026
Q3 FY2026
Q4 FY2026 guide
Revenue
$18.02bn
$19.31bn
$22.19bn
$29.59bn
$34.8bn
Revenue growth y/y
28%
29%
48%
86%
93%
AI revenue
n/a (+74%)
$8.4bn
$10.8bn
$16.7bn
$21.7bn
Semiconductor / software revenue
$11.07bn / 6.94bn
$12.52bn / 6.80bn
$15.01bn / 7.18bn
$20.84bn / 8.75bn
n/a
Gross margin, GAAP / non GAAP
68.0% / 77.9%
68.1% / 77.0%
69.5% / 77.1%
69.1% / 75.0%
about 73% non GAAP (call)
Operating margin, non GAAP
66.2%
66.4%
67.3%
67.9%
about 66%
Diluted EPS, GAAP / non GAAP
$1.74 / 1.95
$1.50 / 2.05
$1.91 / 2.44
$2.68 / 3.32
n/a
Free cash flow
$7.47bn
$8.01bn
$10.26bn
$13.67bn
n/a
Sources: 8-K 0001730168-25-000116, 0001730168-26-000011, 0001730168-26-000051 and 0001730168-26-000076. Q4 FY2025 release states AI revenue growth only.
MD&A, FY2025 10-K. Revenue rose 24% to $63.89bn. Semiconductor revenue rose 22% on custom AI accelerators and AI networking; software revenue rose 26% on VMware
Cloud Foundation. A $397m tax benefit was net of a $1.32bn valuation allowance after the One Big Beautiful Bill Act. Singapore's minimum tax would raise FY2026 tax materially (10-K).
MD&A, Q3 FY2026 10-Q. Gross margin was 69%. A higher mix of semiconductor revenue offset the benefit of growth. Inventory rose to $4.52bn
from $2.27bn to support AI shipments. Debt principal fell to $61.1bn after Broadcom repurchased $5.64bn of notes in Q3. The 10-Q states that
most new software contracts now exclude termination for convenience provisions.
Earnings call, 2 Sep 2026 (company investor materials, summarised from third party transcripts). CEO Hock Tan put FY2026 AI revenue at about
$58bn. He said Broadcom has secured supply to roughly double it to about $115bn in FY2027 and has line of sight to about $230bn in FY2028. He cited six XPU
customers and named Google, Anthropic, OpenAI and Meta. He said Broadcom is "on target to exceed $30 in earnings per share in fiscal 2028".
Constraints named on the call. Data center power and space, lasers, substrates, high bandwidth memory and leading edge wafers. CFO Amie Thuener
(in the role since 12 Jun 2026) guided Q4 capex to about $1.4bn. She named Apollo and Blackstone as AI XPV partners.
Broadcom's year to date revenue growth of 55.0% is below NVIDIA (95.8%) and above AMD (44.1%), Arista,
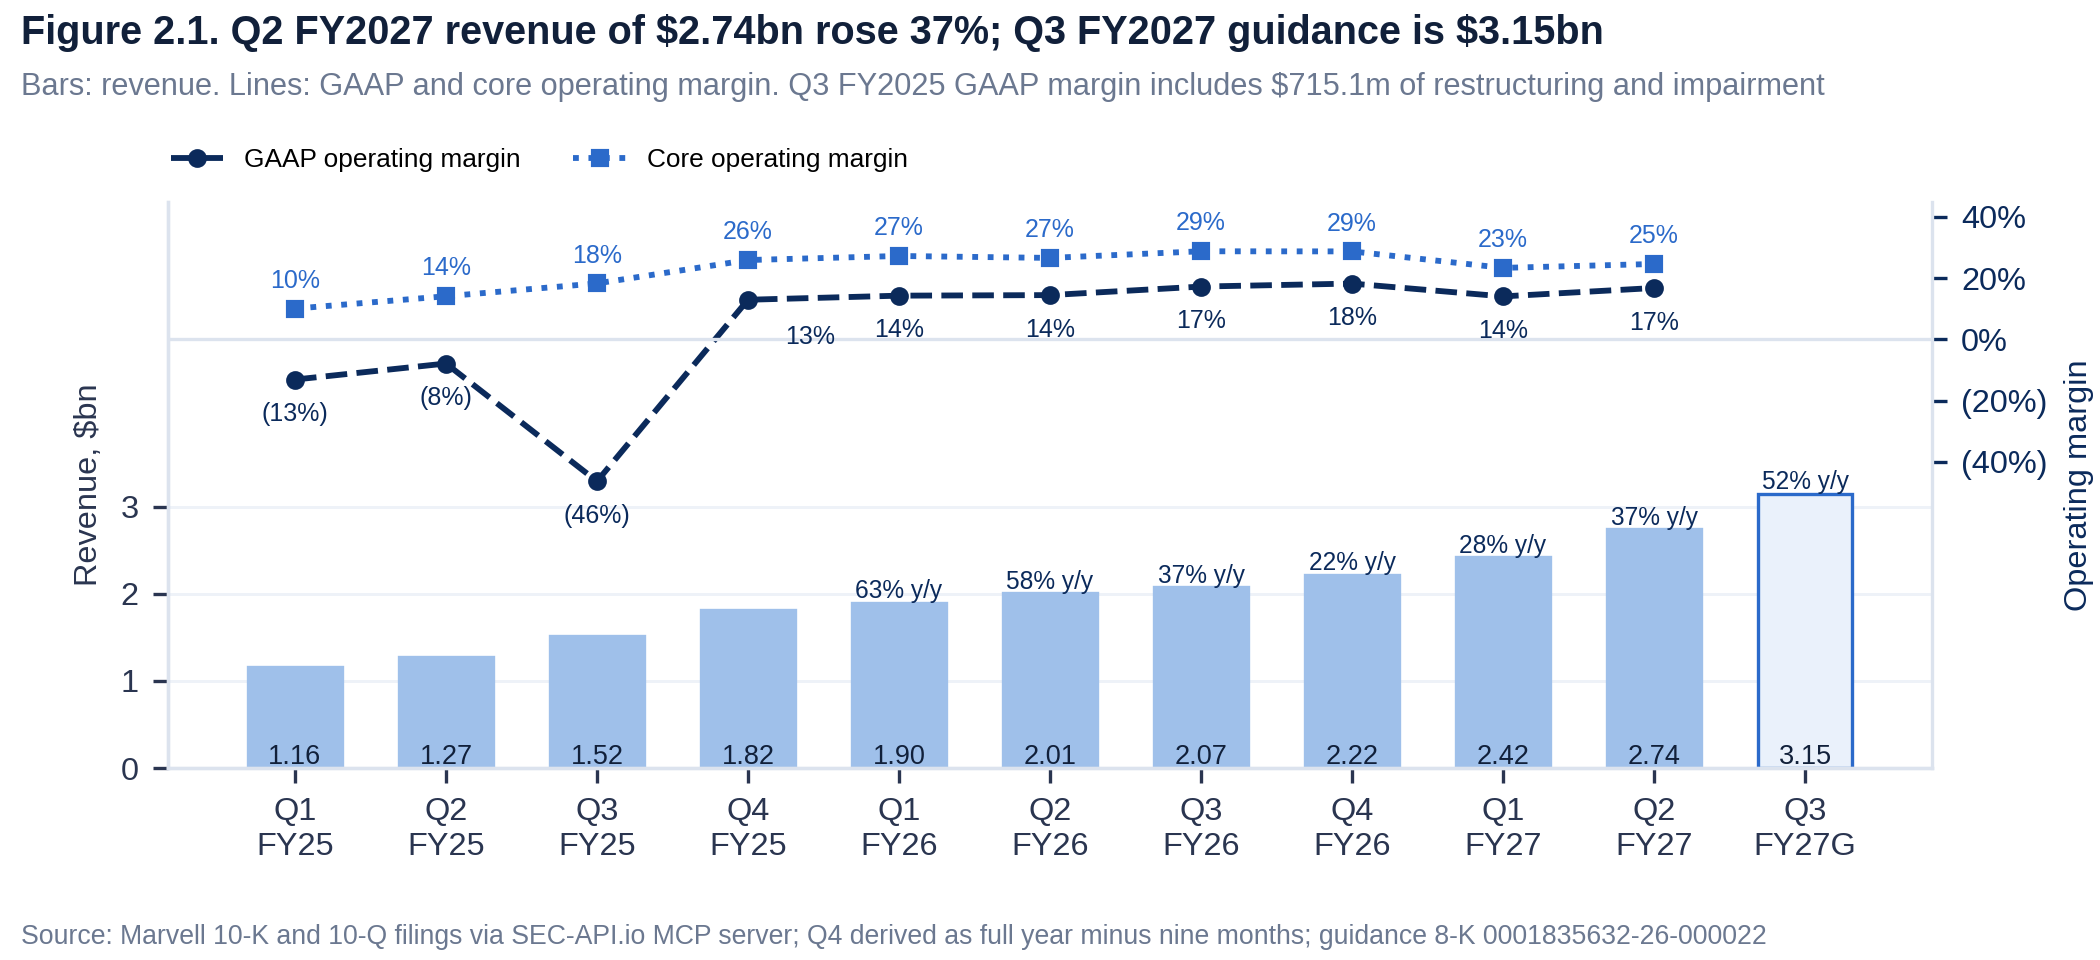
Marvell, Texas Instruments, Intel and Qualcomm. Its TTM gross margin of 68.8% compares with 74.7% at NVIDIA and 52.2% at Marvell, which also sells custom AI chips. Its TTM revenue of $89.10bn ranks second after NVIDIA.
Hyperscaler capital spending. Microsoft spent $115.9bn in its year to Jun 2026, Amazon $131.8bn in 2025, Alphabet $91.4bn in 2025 and
Meta $69.7bn in 2025 (10-K filings). Their combined 2026 guidance is about $720bn to 745bn. Meta's $130bn to 145bn comes from its 8-K; the other figures
come from earnings calls.
AI networking. Dell'Oro reported that AI back end switch sales exceeded front end switch sales for the first time in Q2 2026. It projects cumulative
AI back end switch spending of nearly $1tn over 2026 to 2030 and expects Ethernet to lead scale up networks by 2030.
Custom silicon. Marvell estimated a custom XPU market of $40.8bn by calendar 2028 (company blog, Jul 2025). Broadcom's Q3 FY2026 AI revenue was $16.7bn.
China. Shipments to China, including Hong Kong, were 11.15bn in FY2025, or 17% of revenue, down from 20% in FY2024. In Jan 2026 the Commerce
Department moved advanced AI chip exports to China to case by case review.
Software. In Mar 2026 CISPE, a group of European cloud providers, filed a complaint with the European Commission over changes to the VMware partner program
(trade press report).
Table 4.1. Peer comparison, TTM to the latest 10-Q; market data at 29 to 30 Sep 2026
Company
Year end
Revenue
Growth YTD
Gross margin
Operating margin
FCF margin
R&D / revenue
Market cap, $
P/E TTM
Broadcom
FY Nov
89.10bn
55.0%
68.8%
48.0%
44.2%
13.3%
1.68tn
45x
NVIDIA
FY Jan
302.97bn
95.8%
74.7%
65.2%
41.9%
7.8%
5.51tn
29x
AMD
FY Dec
41.30bn
44.1%
53.2%
15.7%
20.3%
22.7%
998.7bn
157x
Marvell
FY Jan
9.45bn
32.2%
52.2%
16.5%
18.3%
25.8%
238.5bn
88x
Qualcomm
FY Sep
44.07bn
(0.7%)
54.2%
23.2%
23.6%
22.4%
196.6bn
21x
Intel
FY Dec
57.03bn
16.4%
38.6%
(0.1%)
5.0%
23.1%
631.3bn
n/m
Texas Instruments
FY Dec
19.45bn
20.8%
58.3%
37.3%
27.5%
10.7%
257.2bn
43x
Arista
FY Dec
10.54bn
36.5%
63.0%
43.1%
48.9%
13.0%
257.5bn
65x
Growth compares the latest fiscal year to date with the prior year period. P/E uses filed TTM diluted EPS. NVIDIA TTM earnings include equity security gains; Marvell TTM earnings a $1.83bn divestiture gain; Intel has a TTM loss.
In the year to Sep 2026 Broadcom signed long term agreements with Google, Anthropic and Apple, launched its AI XPV financing platform,
started a $10bn buyback program and changed its CFO. In 9M FY2026 it issued $4.5bn of notes and repaid or repurchased $10.54bn of debt.
Table 5.1. FY2025 10-K items and Q3 FY2026 10-Q updates
Item
Content
Items 1 and 7, Business and MD&A
Two segments; about 33,000 employees. One distributor was 32% of FY2025 revenue, distributors in total 48% and the five largest end customers about 40%. Competitors are described by type, without names.
Item 1A, Risk factors
FY2025 against FY2024: 19 new and 45 reworded paragraphs. New topics: AI cycle sustainability, customers with constrained capital seeking vendor financing, rack sales or leasing that may lower gross margin, tariffs, factoring and buyback variability. VMware integration risk was removed.
Q3 FY2026 10-Q, Part II Item 1A
Adds backstop and guarantee obligations, an AI spending 'bubble' reference, the 'supply chain risk' designation, memory as a critical material and a materially higher tax provision from the global minimum tax.
Item 1C, Cybersecurity
Program aligned with NIST CSF and ISO 27001; Audit Committee briefed at least quarterly.
Item 3, Legal proceedings
VMware backlog securities class action settled; the court approved the settlement in Mar 2025.
Item 9A, Controls
Controls were effective at 2 Nov 2025; PricewaterhouseCoopers audited internal control.
10-K 0001730168-25-000121; 10-Q 0001730168-26-000080; risk factor comparison against 10-K 0001730168-24-000139.
Shareholders elected all eight directors and ratified the auditor. Say on pay passed with 66.4% of votes cast for or against, down from
92.5% in 2025. It was the first vote after Hock Tan's Sep 2025 performance share award. Shares represented were 4,105m of
4,736m (computed from vote totals).
Board. Lead independent director Eddy Hartenstein retired at the meeting under the age 75 policy. Harry You received the lowest support,
74.0%; Hock Tan received 99.7%.
Pay. Hock Tan's reported pay was $205.3m in FY2025, $2.6m in FY2024 and $161.8m in FY2023.
The FY2025 figure is the target value of 610,521 performance shares. They pay 0% to 300% based on AI revenue in any four quarters of FY2028 to FY2030: 100% at
$90bn and 300% at $120bn. CEO pay ratio was 543 to 1 (DEF 14A 0001193125-26-085691).
Table 6.1. Proposals and support (for as % of for plus against)
Proposal
Board view
2026
2025
Outcome
Say on pay
For
66.4%
92.5%
Approved
Ratify PricewaterhouseCoopers
For
98.0%
98.5%
Approved
Broker non votes: 420.7m in 2026. Say on pay support was about 61% in 2024 (2025 proxy). Shareholder proposals: none in either year. Sources: 8-K 0001730168-26-000039 and 0001730168-25-000037.
Table 6.2. Director elections, support as % of for plus against
Insiders sold $1,132m of stock in the twelve months to Sep 2026. Of this, $879m was sold under
Rule 10b5-1 plans, mostly by entities of chair Henry Samueli, and $150m covered tax on vesting awards. Director Harry You
bought 2,000 shares for $0.7m. Vanguard Capital Management held 7.49% at 31 Mar 2026 (Schedule 13G).
Table 6.3. Largest institutional holders from Form 13F, shares m
Holder
30 Jun 2026
% of shares
31 Mar 2026
31 Dec 2025
Change since Dec 2025
Vanguard
436.2
9.1%
436.4
482.7
(9.6%)
BlackRock
398.2
8.3%
n/a
379.9
4.8%
State Street
196.9
4.1%
191.4
190.1
3.6%
FMR
144.4
3.0%
124.1
123.2
17.2%
Capital World Investors
121.9
2.6%
116.2
123.3
(1.1%)
Geode Capital Management
116.4
2.4%
114.3
111.3
4.6%
Capital Research Global Investors
113.1
2.4%
116.0
86.4
31.0%
JPMorgan Chase
95.0
2.0%
91.8
93.8
1.3%
T. Rowe Price Associates
82.9
1.7%
84.5
85.5
(3.1%)
Capital International Investors
81.8
1.7%
84.0
141.9
(42.3%)
n/a: filing not retrieved. From 2026, Vanguard combines Vanguard Capital Management and Vanguard Portfolio Management. 13F positions combine more reporting entities than the 13G filings, so percentages differ.
Table 6.4. Insider sales, Oct 2025 to Sep 2026, $m (Form 4)
Insider
Role
Sales
Of which 10b5-1
Of which tax
Henry Samueli
Chair
878.3
878.3
0.0
Mark Brazeal
Chief Legal Officer
99.9
0.0
51.1
Hock Tan
President and CEO
58.9
0.0
34.6
Ram Velaga
President, Software
34.4
0.0
20.8
Kirsten Spears
Former CFO
31.9
0.0
21.5
Charlie Kawwas
President, Semiconductors
25.5
0.0
22.0
Justine Page
Director
2.1
0.8
0.0
Gayla Delly
Director
1.1
0.0
0.0
Total
1,132.1
879.1
150.0
50 Form 4 and 2 Form 3 filings. In Dec 2025 Hock Tan also contributed 130,000 shares ($42.4m) to an exchange fund. It was reported under sale code S and is excluded here. Forms 144 covered about $1.34bn of proposed sales.
EV to sales was 28.0x at the Oct 2025 close. It is now 19.2x TTM revenue and
16.2x the FY2026 revenue estimate of $105.89bn. Market capitalization is $1.68tn. The FY2026 dividend of $2.60 a share
is a 0.7% yield. TTM free cash flow is 2.4% of market capitalization.
Table 7.1. Fiscal year end valuation (October close)
Fiscal year
Market cap, $bn
Price, $
Diluted EPS, $
EV / sales
FY21
n/a
n/a
1.50
n/a
FY22
186
44.41
2.65
6.4x
FY23
337
81.44
3.30
10.1x
FY24
782
166.87
1.23
16.3x
FY25
1,739
366.87
4.77
28.0x
30 Sep 2026
1,676
351.19
7.83 TTM
19.2x
Prices are split and dividend adjusted monthly closes; Oct 2021 is unavailable. FY2024 EPS includes the Q3 FY2024 tax provision of $4.5bn.
The model starts from the FY2026 revenue estimate of $105.89bn. FY2029 core EPS is $7.90 (worst),
$20.34 (base) and $30.04 (best), against $10.22 for FY2026 on a core basis. Implied
values per share at end FY2029 are $118, 447 and 841.
Table 8.1. Scenario assumptions, FY2027 to FY2029
Driver
Worst
Base
Best
AI revenue FY2027 / FY2028 / FY2029, $bn
75 / 75 / 65
100 / 150 / 175
115 / 200 / 240
Other revenue growth a year
(2%)
2%
4%
Core operating margin FY2027 / FY2028 / FY2029
52% / 48% / 45%
57% / 55% / 54%
60% / 60% / 60%
Diluted share count change a year
0.5%
0.0%
(0.5%)
Exit P/E on FY2029 core EPS
15x
22x
28x
Common to all
FY2026 base year: revenue $105.9bn (9M actual plus Q4 guidance); AI revenue $58bn (call), other revenue $47.9bn. Core operating income $62.5bn (59.0%), with Q4 at the guided 66% non GAAP margin less Q3 stock compensation. Net interest and other $(2.4)bn a year; tax rate 16%; 4,937m diluted shares in FY2026. Lease backstop losses excluded.
Demand. Best case follows the call outlook for FY2027 and reaches $200bn of AI revenue in FY2028, below the $230bn line of sight. Base case uses $100bn, 150bn and 175bn. Worst case holds AI revenue at $75bn and cuts it to $65bn in FY2029, as hyperscaler
spending slows, a customer moves designs in house or a financed customer defaults.
Margin. Core margin includes stock compensation (9.5% of TTM revenue) and excludes acquired intangible amortization.
10-K risk factors state that rack sales or leasing will likely lower future gross margin. In the base case, core margin falls from 59.0% in FY2026 to 54% in FY2029.
Per share. In the base case, buybacks offset share issuance. Dividends are excluded from the implied value.
Excluded. Acquisitions, backstop payments, changes in export rules and one off items.
In Figure 9.1, 18 of 25 combinations of exit P/E and FY2029 core margin give a value at or above today's $351.19. At
14x, every combination gives a value below it. In Table 9.1, 18 of 25 combinations of AI revenue and margin reach today's price at 22x.
Table 9.1. Value per share, end FY2029, by AI revenue path and FY2029 core margin, 22x exit P/E
Margin \ AI revenue
50% of base
75% of base
100% of base
125% of base
150% of base
44%
219
291
363
435
507
49%
245
325
405
485
566
54%
271
359
447
536
624
59%
296
393
490
586
683
64%
322
427
532
637
742
Base AI revenue: $100bn, 150bn and 175bn in FY2027 to FY2029. Shading: values at or above $351.19 in blue.
Gross margin mix. On the call, management guided Q4 FY2026 gross margin to about 73%, down from 75.0% non GAAP in Q3, due to higher memory content in XPUs.
Backstop. A default by the financed customer could cost up to about $29bn, or $5.87 a share, before recovery from the racks.
Rates. Debt is fixed rate at a weighted coupon of about 4.0%; $9.78bn of principal matures by the end of 2029.
Data. Financial statements from XBRL in the 10-K for FY2021 to FY2025 and 10-Q filings for Q1 FY2025 to Q3 FY2026, retrieved through the SEC-API.io
MCP server. Q4 FY2025 equals full year less the first nine months; quarterly cash flows are derived from year to date statements. AI revenue is
taken from each earnings release.
Other sources. Earnings call of 2 Sep 2026 from third party transcript summaries. Peer data from peer 10-K and 10-Q filings. Sector data:
hyperscaler 10-K and 8-K filings, Dell'Oro press releases, Commerce Department, Marvell company materials and trade press. Market prices: 29 to 30 Sep 2026.
Definitions. FCF = operating cash flow less purchases of property and equipment. Core earnings are GAAP excluding items in Table 2.3.
Net debt = total debt less cash.
Scenario model. EPS = ((AI revenue plus other revenue) x core margin less $2.4bn) x (1 less 16%) over diluted shares. Implied value =
FY2029 EPS x exit P/E, undiscounted.
Disclaimer: for information only, not financial advice. This report is not a recommendation to buy, sell or hold any
security. Figures come from SEC filings retrieved through the SEC-API.io MCP server and from sources named above. Scenario values follow arithmetically
from the stated assumptions. Consult a licensed adviser before investing.