CVS Health Corporation (CVS), Financial Analysis
Insights derived from analysing SEC filings. Independent analysis of CVS Health Corporation common stock, not a publication of the SEC. Figures are read from the Forms 10-K for FY2021 to FY2025, the Forms 10-Q for 2025 and 2026, the Forms 8-K and their earnings exhibits, the 2026 proxy statement, Schedules 13G and 13G/A, Forms 13F and Forms 3, 4 and 5 on the record for Central Index Key 64803, together with the comparable filings of seven peers. Accession numbers for every filing used appear in the Sources appendix. Market prices are the last trade of 3 September 2026.
CVS compounded revenue at 8.3% a year for five years, to $402,067m, and shrank adjusted operating income at 4.3% a year and Adjusted EPS at 5.3% a year while doing it. Over those five years the company excluded $31,034m from operating income, 39.2% of the $79,217m of adjusted operating income it reported. Goodwill exceeded book equity in every one of the five years. Of the 128 basis point improvement in the Health Care Benefits medical benefit ratio that the stock has rerated on, 58 basis points came from underwriting and 70 came from a larger prior year reserve release. Those four facts run through every chapter that follows.
1 Revenue & Business Model
CVS Health sells three things to the same dollar of American health spending: insurance risk through Aetna, pharmacy benefit administration through CVS Caremark, and dispensed prescriptions and front store goods through CVS Pharmacy. FY2025 consolidated revenue was $402,067m, up 7.8% on FY2024 and an 8.3% compound rate since FY2021. The four reportable segments billed $473,630m between them. The difference, $(71,563)m, is CVS billing CVS. Add the segments up and the company looks 17.8% larger than the audited income statement says it is.
The mix has moved. Insurance premiums went from 26.1% of revenue in FY2021 to 33.5% in FY2025, while dispensed pharmacy fell from 63.2% to 57.0% and the front store from 7.3% to 5.3%. Health Care Benefits compounded at 14.9% a year over the period; Health Services compounded at 5.5% and fell 7.1% in FY2024. For the stock, revenue moved less than earnings: FY2025 revenue grew 7.8% while income before income tax fell to $2,136m from $6,148m, on a $5,725m goodwill impairment in the Health Care Delivery reporting unit and $1,220m of legacy litigation charges.
How CVS earns the money
Table 1.1 Revenue model by reportable segment, FY2025
| Segment | What it sells | Who pays | Revenue basis | FY2025 revenue ($m) | Share of segment sum |
|---|---|---|---|---|---|
| Health Services | Pharmacy benefit administration, formulary and network management, specialty and mail order dispensing, biosimilar commercialisation through Cordavis, value based primary care through Oak Street Health and in home assessments through Signify Health | Employers, health plans, unions, government employee groups, CMS, Managed Medicaid plans and 340B covered entities | Gross for drug claims where CVS is principal, including retail copayments; fees for administration; capitation for risk based care | 190,425 | 40.2% |
| Health Care Benefits | Commercial medical, dental, behavioural, vision and stop loss cover, Medicare Advantage, Medicare Part D, Medicare Supplement, Medicaid and CHIP management, and dual eligible coverage | Employer plan sponsors, individuals, CMS and state agencies | Premiums billed monthly for insured business, fees for administrative services contracts, plus net investment income on the insurance float | 143,354 | 30.3% |
| Pharmacy & Consumer Wellness | Retail and specialty dispensing, vaccination and pharmacy patient care, infusion and enteral nutrition, and front store health, beauty and general merchandise | Pharmacy benefit managers, managed care organisations, government programmes, employers and retail consumers | Point of sale on transfer of the goods, with fulfilment fees billed to Health Services for its mail and specialty volume | 139,367 | 29.4% |
| Corporate/Other | Run off products no longer sold, chiefly large case pensions and long term care insurance, plus corporate administration | Legacy policyholders | Residual premiums and net investment income | 484 | 0.1% |
Item 1 of the FY2025 10-K gives the scale behind those numbers: approximately 9,000 retail locations, more than 1,000 walk in and primary care clinics, approximately 87 million pharmacy benefit plan members, more than 37 million people served with health benefits, 1.9 billion prescriptions filled or managed by the pharmacy benefit manager and 1.8 billion filled at retail on a 30 day equivalent basis, about 28.5% of all United States retail pharmacy prescriptions.

Table 1.2 Segment revenue and the intersegment elimination, $m
| 2021 | 2022 | 2023 | 2024 | 2025 | |
|---|---|---|---|---|---|
| Health Care Benefits | |||||
| Revenues from external customers | 81,457 | 90,798 | 104,800 | 129,120 | 141,454 |
| Intersegment revenues | 76 | 76 | 81 | 72 | 118 |
| Net investment income | 586 | 476 | 765 | 1,473 | 1,782 |
| Total revenues | 82,119 | 91,350 | 105,646 | 130,665 | 143,354 |
| Health Services | |||||
| Revenues from external customers | 143,912 | 157,968 | 174,018 | 158,016 | 164,603 |
| Intersegment revenues | 9,980 | 11,608 | 12,826 | 15,304 | 25,802 |
| Net investment income (loss) | 0 | 0 | (1) | 285 | 20 |
| Total revenues | 153,892 | 169,576 | 186,843 | 173,605 | 190,425 |
| Pharmacy & Consumer Wellness | |||||
| Revenues from external customers | 65,418 | 72,739 | 77,748 | 83,464 | 93,724 |
| Intersegment revenues | 36,185 | 35,901 | 39,020 | 41,036 | 45,643 |
| Net investment income (loss) | 17 | (44) | (5) | 0 | 0 |
| Total revenues | 101,620 | 108,596 | 116,763 | 124,500 | 139,367 |
| Corporate/Other | |||||
| Total revenues | 721 | 530 | 451 | 451 | 484 |
| Segment total revenues | 338,352 | 370,052 | 409,703 | 429,221 | 473,630 |
| Intersegment eliminations | (46,241) | (47,585) | (51,927) | (56,412) | (71,563) |
| Total consolidated revenues | 292,111 | 322,467 | 357,776 | 372,809 | 402,067 |
| Elimination, share of the segment sum | 13.7% | 12.9% | 12.7% | 13.1% | 15.1% |
| Elimination, share of consolidated revenue | 15.8% | 14.8% | 14.5% | 15.1% | 17.8% |
The 2021 and 2022 columns are the recast comparatives published in the FY2023 10-K, which moved Signify Health and Oak Street Health into Health Services and reassigned Maintenance Choice economics to Pharmacy & Consumer Wellness. The recast raised the 2022 elimination from $(45,302)m as first reported to $(47,585)m, and the 2021 elimination from $(43,923)m to $(46,241)m, leaving consolidated revenue unchanged in both years.
The elimination, and why it grows faster than the company

Two flows create almost all of the elimination. Pharmacy & Consumer Wellness bills Health Services when a Caremark member fills a prescription at a CVS pharmacy and when it performs mail and specialty fulfilment on Health Services' behalf, $45,643m in FY2025 and 32.8% of its own revenue. Health Services bills Health Care Benefits for the pharmacy benefit on Aetna's own members, $25,802m and 13.5% of Health Services revenue, up from 8.8% a year earlier. Health Care Benefits bills $118m outward, 0.1% of its revenue. The elimination compounded at 11.5% a year against 8.3% for consolidated revenue, and its share of the segment sum held near 13% through FY2024 before jumping to 15.1%. More of what one CVS unit sells, another CVS unit buys.
Table 1.3 What the elimination removes, by revenue line, $m
| 2021 | 2022 | 2023 | 2024 | 2025 | |
|---|---|---|---|---|---|
| Pharmacy | (43,913) | (45,154) | (49,369) | (52,942) | (67,594) |
| Premiums | 0 | 0 | 0 | 0 | (43) |
| Other | (2,328) | (2,431) | (2,558) | (3,470) | (3,926) |
| Total intersegment eliminations | (46,241) | (47,585) | (51,927) | (56,412) | (71,563) |
| Pharmacy revenue, Health Services | 150,646 | 166,793 | 180,710 | 162,527 | 181,109 |
| Pharmacy revenue, Pharmacy & Consumer Wellness | 77,886 | 83,480 | 92,111 | 100,687 | 115,510 |
| Pharmacy revenue, consolidated | 184,619 | 205,119 | 223,452 | 210,272 | 229,025 |
| Elimination, share of gross pharmacy revenue | 19.2% | 18.0% | 18.1% | 20.1% | 22.8% |
Pharmacy is 94.5% of the FY2025 elimination. Gross pharmacy revenue across the two segments was $296,619m and $229,025m reached the income statement. The premiums elimination appears for the first time in FY2025, at $(43)m.
Revenue by major goods and services line

Table 1.4 Consolidated revenue by major goods and services line, $m
| 2021 | 2022 | 2023 | 2024 | 2025 | CAGR 2021 to 2025 | |
|---|---|---|---|---|---|---|
| Pharmacy | 184,619 | 205,119 | 223,452 | 210,272 | 229,025 | 5.5% |
| Premiums | 76,132 | 85,330 | 99,192 | 122,896 | 134,751 | 15.3% |
| Front store | 21,315 | 22,780 | 22,458 | 21,522 | 21,459 | 0.2% |
| Other | 8,846 | 8,400 | 11,521 | 15,966 | 14,599 | 13.3% |
| Net investment income | 1,199 | 838 | 1,153 | 2,153 | 2,233 | 16.8% |
| Total consolidated revenues | 292,111 | 322,467 | 357,776 | 372,809 | 402,067 | 8.3% |
| Revenue before net investment income | 290,912 | 321,629 | 356,623 | 370,656 | 399,834 | 8.3% |
Premiums added $58,619m over four years, more than the pharmacy line's $44,406m, on a base less than half the size; management attributes the FY2025 step to the Government business and to the effect of the Inflation Reduction Act on Medicare Part D. The front store has been flat in dollars since FY2021 and has lost two points of revenue share. Net investment income of $2,233m is not customer revenue; strip it and the operating revenue base is $399,834m. Inside that line sit net realised capital results, which CVS removes from its principal measure of segment performance: a $(44)m loss in FY2025, a $117m gain in FY2024 and a $(497)m loss in FY2023. Those swings move revenue by no more than 0.2% and operating income by more.
Health Services distribution channel

Table 1.5 Health Services revenue by distribution channel, $m
| 2021 | 2022 | 2023 | 2024 | 2025 | |
|---|---|---|---|---|---|
| Pharmacy network | 96,834 | 102,968 | 112,718 | 91,650 | 101,775 |
| Mail and specialty | 53,812 | 63,825 | 67,992 | 70,877 | 79,334 |
| Other | 3,246 | 2,783 | 6,134 | 10,793 | 9,296 |
| Net investment income (loss) | 0 | 0 | (1) | 285 | 20 |
| Total revenues | 153,892 | 169,576 | 186,843 | 173,605 | 190,425 |
| Retail copayments included above, $bn | 11.6 | 12.6 | 13.7 | 11.4 | 10.9 |
Pharmacy network revenue fell $(21,068)m in FY2024 on the previously announced loss of a large client and continued pharmacy client price improvements, and recovered $10,125m in FY2025 without regaining the FY2023 level. Mail and specialty has risen every year and now carries 41.7% of Health Services revenue against 35.0% in FY2021. Retail copayments, the amounts plan members pay the retail pharmacy directly, sit inside Health Services revenue and fell from $13.7bn to $10.9bn over two years, which lowers reported revenue without touching the economics CVS keeps.
Geography

No 10-K filed in the five year window discloses revenue from external customers by country or geographic area, and CVS reports no revenue hedging line. Item 1 states that the retail pharmacy network of approximately 63,000 pharmacies sits in the United States including Puerto Rico, the District of Columbia, Guam and the United States Virgin Islands, and that CVS serves some medical members in certain countries outside the United States without quantifying them.
The only quantified split of the domestic and foreign footprint is the income tax note, and only the FY2025 10-K carries it. Foreign income before income tax was $66m in 2023, $184m in 2024 and $801m in 2025, against consolidated pretax income of $11,173m, $6,148m and $2,136m. The foreign share reads 0.6%, 3.0% and 37.5%. The FY2025 reading follows from the collapse in domestic income.
Table 1.6 Federal government revenue concentration, as each 10-K states it
| Filing | Accession number | Years covered by the statement | Federal government share of consolidated revenue | CMS share of federal government revenue |
|---|---|---|---|---|
| 10-K FY2023 | 0000064803-24-000007 | 2023, 2022 and 2021 | 14% | 73%, 74% and 79% |
| 10-K FY2024 | 0000064803-25-000007 | 2024, 2023 and 2022 | 18% | 74%, 73% and 74% |
| 10-K FY2025 | 0000064803-26-000010 | 2025, 2024 and 2023 | approximately 20% | 79%, 74% and 73% |
The three statements overlap and disagree. Each gives one rounded percentage covering three years, so 2023 reads 14%, 18% or approximately 20% depending on which 10-K is open, and 2024 reads 18% or approximately 20%. The direction is clear while the level varies with the filing, so the disclosure supports a direction and stops short of a series. On the latest filing, roughly one dollar in five of consolidated revenue comes from the federal government through Health Care Benefits, and CMS contracts for Medicare eligible individuals are 79% of that.
Segment revenue for CVS is a gross concept, $(71,563)m of FY2025 revenue exists only inside the group, and the elimination grows faster than the company. The mix is migrating from dispensing to underwriting, which raises the weight of medical cost trend and Medicare star ratings on results and lowers the weight of retail footfall.
2 Financial Analysis & Ratios
Total revenues rose from $292,111m in 2021 to $402,067m in 2025 while adjusted operating income fell from $17,227m to $14,443m and Adjusted EPS from $8.40 to $6.75. Insurance premium drove the growth, compounding at 15.3% and rising to 33.5% of revenue from 26.1%, and it is now the thinnest margin dollar in the group: Health Care Benefits earned a 2.05% adjusted operating margin in 2025 against 3.76% at Health Services and 4.33% at Pharmacy & Consumer Wellness. Group adjusted operating margin lost 231 basis points, from 5.90% to 3.59%.
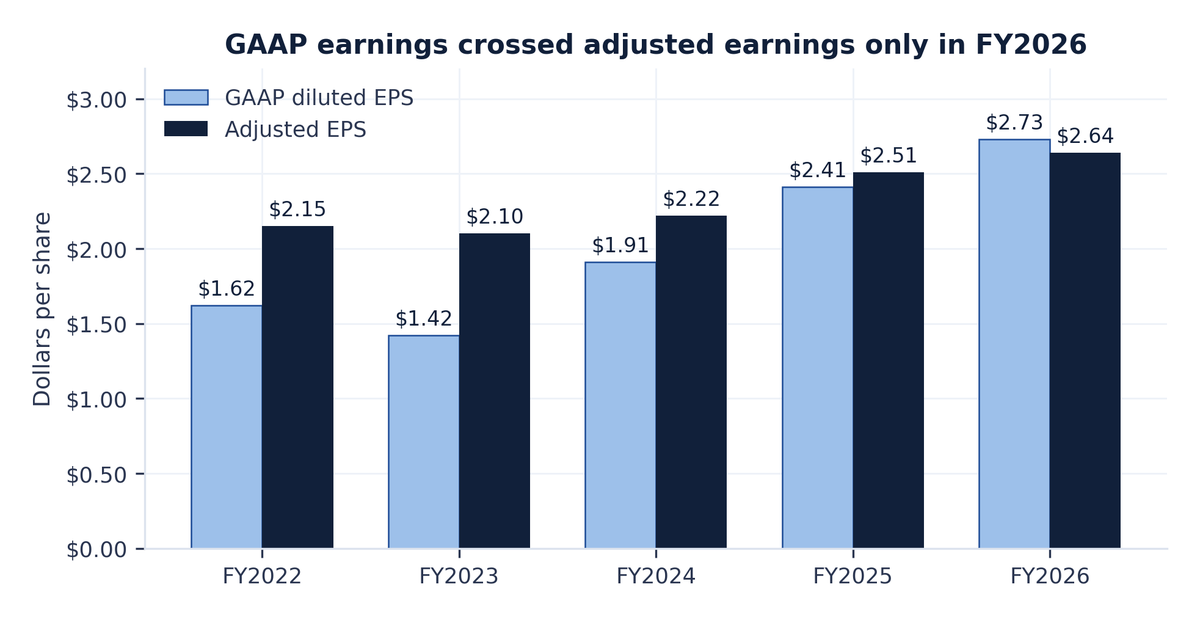
The 2025 GAAP result is unusable on its own. Operating income fell 45.3% to $4,660m on the $5,725m goodwill impairment and $1,220m of legacy litigation charges, while adjusted operating income rose 20.6% to $14,443m. GAAP diluted EPS of $1.39 contains a $1,928m tax benefit from a worthless stock deduction; strip that single item and net income attributable to CVS Health of $1,768m becomes a $160m loss. Adjusted EPS of $6.75 is the number the market trades on and the number the 2026 guide extends.
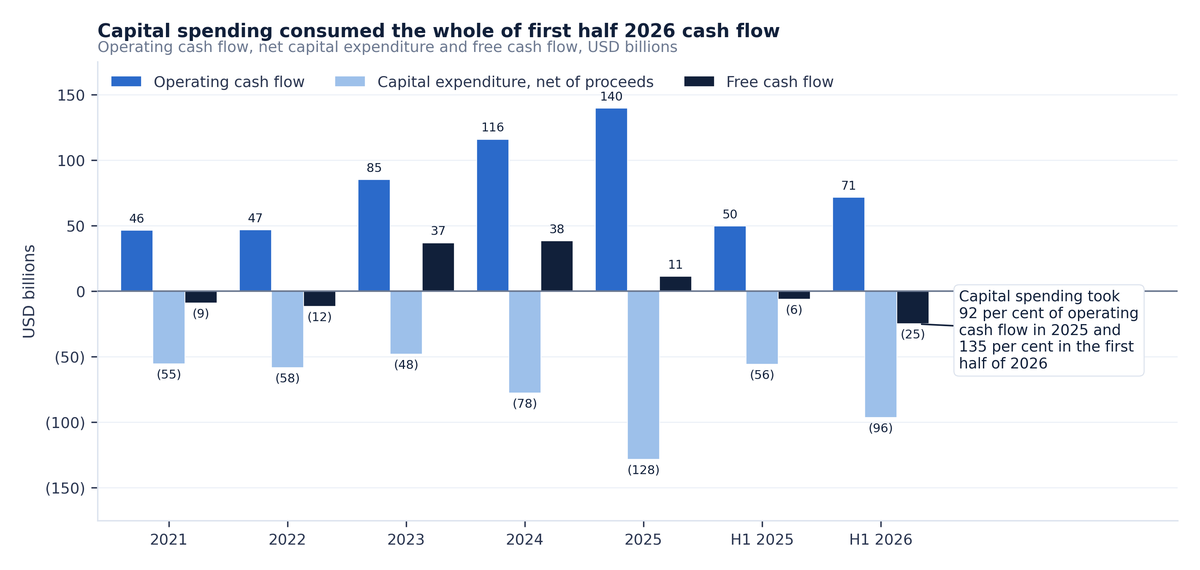
Two things carry the equity from here. The first is the quality of the insurance recovery. The Health Care Benefits medical benefit ratio fell to 91.2% from 92.5%, but favourable prior years' reserve development of $1,982m took 147 basis points off the 2025 ratio against 77 in 2024, so 58 basis points of the 128 basis point improvement came from underwriting and 70 from the larger release. That release equalled 67.4% of the segment's $2,939m of adjusted operating income, and days claims payable fell to 38.9 days from 44.0. The second is capital return: free cash flow of $7,807m, up 23.4%, is half the $15,745m of 2021, net debt to adjusted EBITDA sits at 3.29 times against 1.92 times in 2022, buybacks were zero in 2025 and the dividend has been frozen at $2.66 for two years.
What changed in 2025
Table 2.1 Consolidated results, 2025 against 2024 ($m except per share)
| 2024 | 2025 | Change | Change % | |
|---|---|---|---|---|
| Products | 231,521 | 249,908 | 18,387 | 7.9% |
| Services | 16,239 | 15,175 | (1,064) | (6.6%) |
| Premiums | 122,896 | 134,751 | 11,855 | 9.6% |
| Net investment income | 2,153 | 2,233 | 80 | 3.7% |
| Total revenues | 372,809 | 402,067 | 29,258 | 7.8% |
| Cost of products sold | 206,287 | 221,167 | 14,880 | 7.2% |
| Health care costs | 115,121 | 125,538 | 10,417 | 9.0% |
| Operating expenses | 41,706 | 44,977 | 3,271 | 7.8% |
| Goodwill impairment | 5,725 | 5,725 | n/a | |
| Restructuring charges | 1,179 | (1,179) | (100.0%) | |
| Total operating costs | 364,293 | 397,407 | 33,114 | 9.1% |
| Operating income | 8,516 | 4,660 | (3,856) | (45.3%) |
| Adjusted operating income | 11,976 | 14,443 | 2,467 | 20.6% |
| Interest expense | (2,958) | (3,119) | (161) | (5.4%) |
| Gain on early extinguishment of debt | 491 | (491) | (100.0%) | |
| Gain on deconsolidation of subsidiary | 483 | 483 | n/a | |
| Other income | 99 | 112 | 13 | 13.1% |
| Income before income tax provision | 6,148 | 2,136 | (4,012) | (65.3%) |
| Income tax provision | 1,562 | 408 | (1,154) | (73.9%) |
| Net income attributable to CVS Health | 4,614 | 1,768 | (2,846) | (61.7%) |
| GAAP diluted EPS | $3.66 | $1.39 | $(2.27) | (62.0%) |
| Adjusted EPS | $5.42 | $6.75 | $1.33 | 24.5% |
| Diluted weighted average shares (m) | 1,262 | 1,271 | 9 | 0.7% |
| Operating cash flow | 9,107 | 10,639 | 1,532 | 16.8% |
| Capital expenditure | 2,781 | 2,832 | 51 | 1.8% |
| Free cash flow | 6,326 | 7,807 | 1,481 | 23.4% |
| Dividends paid | 3,373 | 3,397 | 24 | 0.7% |
| Share repurchases | 3,023 | (3,023) | (100.0%) | |
| Operating margin | 2.28% | 1.16% | (113 bps) | n/a |
| Adjusted operating margin | 3.21% | 3.59% | 38 bps | n/a |
| Net margin | 1.24% | 0.44% | (80 bps) | n/a |
| Effective tax rate | 25.41% | 19.10% | (631 bps) | n/a |
Free cash flow is operating cash flow less capital expenditure, a measure CVS does not present; operating cash flow comes from a direct method statement and carries no reconciliation from net income. The Omnicare deconsolidation of September 2025 produced the $483m gain below the operating line and removed long term care pharmacy volume from the fourth quarter. The 631 basis point fall in the effective tax rate is the worthless stock deduction on that bankrupt subsidiary, partly offset by the goodwill impairment and the legacy litigation charges, neither of which was deductible.

GAAP against adjusted
Table 2.2 Reconciliation of operating income to adjusted operating income, 2021 to 2025 ($m)
| 2021 | 2022 | 2023 | 2024 | 2025 | |
|---|---|---|---|---|---|
| Operating income (GAAP measure) | 13,310 | 7,954 | 13,743 | 8,516 | 4,660 |
| Amortisation of intangible assets | 2,233 | 1,785 | 1,905 | 2,025 | 1,976 |
| Net realised capital (gains) losses | (176) | 320 | 497 | (117) | 44 |
| Acquisition related transaction and integration costs | 132 | 487 | 243 | 117 | |
| Goodwill impairment | 431 | 5,725 | |||
| Health Care Delivery clinic closure charge | 83 | ||||
| Opioid litigation charges | 5,803 | 100 | 320 | ||
| Legacy litigation charges | 1,220 | ||||
| Loss on Accountable Care assets | 288 | ||||
| Office real estate optimisation charges | 117 | 46 | 30 | 10 | |
| Restructuring charges | 507 | 1,179 | |||
| Store impairments | 1,358 | ||||
| Loss on assets held for sale | 2,533 | 349 | |||
| Gain on divestiture of subsidiaries | (475) | ||||
| Acquisition purchase price adjustment | (61) | ||||
| Adjusted operating income | 17,227 | 18,037 | 17,534 | 11,976 | 14,443 |
| Total adjustments | 3,917 | 10,083 | 3,791 | 3,460 | 9,783 |
| Adjustments as a share of adjusted operating income | 22.7% | 55.9% | 21.6% | 28.9% | 67.7% |
Across the five years CVS excluded $31,034m from operating income, 39.2% of the $79,217m of adjusted operating income it reported and 64.4% of the $48,183m of GAAP operating income it earned. The exclusions span several different items: a goodwill impairment in 2021 and again in 2025, opioid litigation in 2022, restructuring in 2023 and 2024, and three separate legal and disposal charges in 2025. Only intangible amortisation, at $1,785m to $2,233m a year, is constant, and it alone was 49 basis points of revenue in 2025. The 2021 and 2022 columns are the recast figures published in the 2023 Form 10-K after CVS adopted ASU 2018-12 on long duration insurance contracts, with a 1 January 2021 transition date; as first reported in February 2022, 2021 operating income was $13,193m and adjusted operating income $17,312m.

Table 2.3 Reconciliation of net income to adjusted income and Adjusted EPS, 2025 and 2024
| 2024 $m | 2024 per share | 2025 $m | 2025 per share | |
|---|---|---|---|---|
| Net income attributable to CVS Health (GAAP measure) | 4,614 | $3.66 | 1,768 | $1.39 |
| Amortisation of intangible assets | 2,025 | $1.61 | 1,976 | $1.56 |
| Net realised capital (gains) losses | (117) | $(0.09) | 44 | $0.03 |
| Acquisition related integration costs | 243 | $0.19 | 117 | $0.09 |
| Goodwill impairment | 5,725 | $4.50 | ||
| Health Care Delivery clinic closure charge | 83 | $0.07 | ||
| Opioid litigation charges | 100 | $0.08 | 320 | $0.25 |
| Office real estate optimisation charges | 30 | $0.02 | 10 | $0.01 |
| Legacy litigation charges | 1,220 | $0.96 | ||
| Loss on Accountable Care assets | 288 | $0.23 | ||
| Restructuring charges | 1,179 | $0.93 | ||
| Gain on early extinguishment of debt | (491) | $(0.39) | ||
| Gain on deconsolidation of subsidiary | (483) | $(0.38) | ||
| Tax benefit from worthless stock deduction | (1,928) | $(1.51) | ||
| Tax impact of other adjustments | (745) | $(0.59) | (568) | $(0.45) |
| Adjusted income attributable to CVS Health | 6,838 | $5.42 | 8,572 | $6.75 |
CVS does not only add charges back. It removes the $483m deconsolidation gain and the $1,928m worthless stock tax benefit, together $2,411m and $1.89 per share of GAAP earnings it declines to count. The adjusted measure is stricter than GAAP in 2025, and the $5.36 gap between $1.39 and $6.75 would be $7.25 without those two deductions.

Underwriting
Table 2.4 Health Care Benefits underwriting, 2021 to 2025 ($m except ratios)
| 2021 | 2022 | 2023 | 2024 | 2025 | |
|---|---|---|---|---|---|
| Premium revenues | 76,064 | 85,274 | 99,144 | 122,849 | 134,749 |
| Of which Government | 55,739 | 63,141 | 70,094 | 88,433 | 103,362 |
| Of which Commercial | 20,325 | 22,133 | 29,050 | 34,416 | 31,387 |
| Government share of premium | 73.3% | 74.0% | 70.7% | 72.0% | 76.7% |
| Health care costs | 64,531 | 71,473 | 85,504 | 113,659 | 122,949 |
| Medical benefit ratio | 84.8% | 83.8% | 86.2% | 92.5% | 91.2% |
| Favourable prior years' development | 788 | 654 | 685 | 947 | 1,982 |
| Development as a share of premium | 1.04% | 0.77% | 0.69% | 0.77% | 1.47% |
| Medical benefit ratio before that development | 85.9% | 84.6% | 86.9% | 93.3% | 92.7% |
| Days claims payable | 49.0 | 51.3 | 45.9 | 44.0 | 38.9 |
| Segment adjusted operating income | 5,110 | 6,338 | 5,577 | 307 | 2,939 |
| Development as a share of segment adjusted operating income | 15.4% | 10.3% | 12.3% | 308.5% | 67.4% |
Two years of underwriting damage were followed by a partial repair. The medical benefit ratio jumped 630 basis points in 2024 as Medicare Advantage utilisation ran ahead of pricing, and segment adjusted operating income fell 94.5% to $307m. In 2025 the ratio came back 130 basis points to 91.2% and adjusted operating income recovered to $2,939m, still 47.3% below 2023. Government business is 76.7% of premium, the highest in the five years, so the segment's earnings now turn on Medicare Advantage rates and on Part D seasonality under the Inflation Reduction Act.
Reserve releases carry more of the reported improvement than the underwriting does. Favourable development of $1,982m in 2025 was 2.09 times the 2024 figure and 1.47% of premium against a 0.69% to 1.04% range in the three earlier years. Before that development the ratio was 92.7% against 93.3%, a 58 basis point improvement rather than 128. CVS states the move as 130 basis points, working from ratios rounded to one decimal place. The 10-K decomposes the release: completion factors ran 31 basis points higher than assumed, worth $541m, and fourth quarter 2024 claims came in 6.1% below the estimate, worth $1.4bn, against 23 basis points and $339m, and 3.2% and $546m, a year earlier.
The cushion thins as the releases grow. Days claims payable fell 12.4 days, from 51.3 at the end of 2022 to 38.9 at the end of 2025. CVS carries $10.4bn of incurred but not reported claims at 31 December 2025 and states that a plus or minus 14 basis point move in weighted average completion factors would move health care costs payable by about $372m before tax. The fourth quarter 2025 medical benefit ratio was 94.8%, level with the fourth quarter of 2024, and that 94.8% sets the base rate for the current year, above the 91.2% full year figure.
The 2023 development of $685m in Table 2.4 is the audited figure from the health care costs payable table in the Form 10-K. The fourth quarter 2023 earnings release, filed the same day, gave $675m for the same measure. The year to date development figures in the quarterly releases are rounded and run below the audited table: $885m for 2024 against $947m, and $2.0bn for 2025 against $1,982m.

Segment profit
Table 2.5 Segment revenue and adjusted operating income, 2021 to 2025 ($m)
| 2021 | 2022 | 2023 | 2024 | 2025 | |
|---|---|---|---|---|---|
| Health Care Benefits | |||||
| Total revenues | 82,119 | 91,350 | 105,646 | 130,665 | 143,354 |
| Operating income (loss) | 3,662 | 5,270 | 3,949 | (984) | 1,793 |
| Adjusted operating income | 5,110 | 6,338 | 5,577 | 307 | 2,939 |
| Adjusted operating margin | 6.22% | 6.94% | 5.28% | 0.23% | 2.05% |
| Health Services | |||||
| Total revenues | 153,892 | 169,576 | 186,843 | 173,605 | 190,425 |
| Operating income | 6,293 | 6,612 | 6,842 | 6,937 | 220 |
| Adjusted operating income | 6,492 | 6,781 | 7,312 | 7,243 | 7,151 |
| Adjusted operating margin | 4.22% | 4.00% | 3.91% | 4.17% | 3.76% |
| Pharmacy & Consumer Wellness | |||||
| Total revenues | 101,620 | 108,596 | 116,763 | 124,500 | 139,367 |
| Operating income | 4,984 | 3,560 | 5,349 | 4,770 | 4,860 |
| Adjusted operating income | 7,260 | 6,531 | 5,963 | 5,774 | 6,040 |
| Adjusted operating margin | 7.14% | 6.01% | 5.11% | 4.64% | 4.33% |
| Corporate/Other | |||||
| Total revenues | 721 | 530 | 451 | 451 | 484 |
| Operating loss | (1,629) | (7,488) | (2,397) | (2,207) | (2,213) |
| Adjusted operating loss | (1,635) | (1,613) | (1,318) | (1,348) | (1,687) |
| Intersegment revenue eliminations | (46,241) | (47,585) | (51,927) | (56,412) | (71,563) |
| Total revenues | 292,111 | 322,467 | 357,776 | 372,809 | 402,067 |
| Adjusted operating income | 17,227 | 18,037 | 17,534 | 11,976 | 14,443 |
Health Services adjusted operating income has been flat at $6,492m to $7,312m for five years on revenue that grew 23.7%, so its margin fell 46 basis points to 3.76%. Its 2025 GAAP operating income of $220m carries the goodwill impairment, the clinic closure charge and the Accountable Care loss. Pharmacy & Consumer Wellness lost 281 basis points of adjusted margin over the five years on pharmacy reimbursement pressure, with revenue up 37.1% and adjusted operating income down 16.8%. Corporate and other costs grew to $1,687m of adjusted operating loss, the largest in the five years.

Goodwill
Table 2.6 Goodwill and impairment, 2021 to 2025 ($m except ratios)
| 2021 | 2022 | 2023 | 2024 | 2025 | |
|---|---|---|---|---|---|
| Goodwill carrying value | 79,121 | 78,150 | 91,272 | 91,272 | 85,478 |
| Goodwill impairment charge | 431 | 5,725 | |||
| Reporting unit impaired | Long term care | Health Care Delivery | |||
| Goodwill as a share of total assets | 34.0% | 34.2% | 36.5% | 36.0% | 33.7% |
| Goodwill as a share of shareholders' equity | 106.2% | 109.3% | 119.4% | 120.8% | 113.6% |
Goodwill has exceeded book equity in every one of the five years. It rose $13,122m in 2023, the year CVS paid $16,612m net of cash acquired for businesses including Oak Street Health and Signify Health, and $5,725m of it was written off in the third quarter of 2025 when management cut the Health Care Delivery projections for 2026 and beyond. Health Services goodwill fell from $34,066m to $28,272m. The Health Care Delivery reporting unit carries $4,200m of goodwill at 31 December 2025 against $5,700m of accumulated impairment, so a further write down there is capped at $4,200m. The remaining $81,278m sits in reporting units that were not impaired in 2025.
Ratio analysis
Table 2.7 Ratio analysis, 2021 to 2025
| 2021 | 2022 | 2023 | 2024 | 2025 | |
|---|---|---|---|---|---|
| Growth | |||||
| Total revenue growth | n/a | 10.4% | 10.9% | 4.2% | 7.8% |
| Premium growth | n/a | 12.1% | 16.2% | 23.9% | 9.6% |
| Operating income growth | n/a | (40.2%) | 72.8% | (38.0%) | (45.3%) |
| Adjusted operating income growth | n/a | 4.7% | (2.8%) | (31.7%) | 20.6% |
| Adjusted EPS growth | n/a | 7.5% | (3.2%) | (38.0%) | 24.5% |
| Margin | |||||
| Health care costs, share of revenue | 21.97% | 22.04% | 24.11% | 30.88% | 31.22% |
| Operating expenses, share of revenue | 12.67% | 11.85% | 11.13% | 11.19% | 11.19% |
| Operating margin | 4.56% | 2.47% | 3.84% | 2.28% | 1.16% |
| Adjusted operating margin | 5.90% | 5.59% | 4.90% | 3.21% | 3.59% |
| Net margin | 2.74% | 1.34% | 2.33% | 1.24% | 0.44% |
| Effective tax rate | 24.18% | 25.86% | 25.11% | 25.41% | 19.10% |
| Return | |||||
| Return on equity | 10.7% | 6.0% | 10.9% | 6.1% | 2.4% |
| Return on equity, adjusted earnings | 15.0% | 16.7% | 14.7% | 9.1% | 11.4% |
| Return on assets | 3.4% | 1.9% | 3.3% | 1.8% | 0.7% |
| Return on invested capital, notional 25% tax | 9.9% | 10.9% | 9.5% | 6.3% | 7.7% |
| Leverage | |||||
| Total debt | 56,176 | 52,254 | 61,610 | 66,270 | 64,570 |
| Net debt | 46,768 | 39,309 | 53,414 | 57,684 | 56,117 |
| Adjusted EBITDA | 19,480 | 20,476 | 19,995 | 14,548 | 17,073 |
| Net debt to adjusted EBITDA | 2.40x | 1.92x | 2.67x | 3.97x | 3.29x |
| Total debt to equity | 0.75x | 0.73x | 0.81x | 0.88x | 0.86x |
| Adjusted operating income to interest expense | 6.88x | 7.89x | 6.60x | 4.05x | 4.63x |
| Liquidity | |||||
| Current ratio | 0.88x | 0.95x | 0.86x | 0.81x | 0.84x |
| Cash and cash equivalents | 9,408 | 12,945 | 8,196 | 8,586 | 8,453 |
| Efficiency and cash | |||||
| Asset turnover | 1.25x | 1.41x | 1.43x | 1.47x | 1.59x |
| Inventory turns | 9.90x | 10.31x | 12.04x | 11.39x | 11.49x |
| Capital expenditure, share of revenue | 0.9% | 0.8% | 0.8% | 0.7% | 0.7% |
| Operating cash flow to adjusted operating income | 1.06x | 0.90x | 0.77x | 0.76x | 0.74x |
| Free cash flow | 15,745 | 13,450 | 10,395 | 6,326 | 7,807 |
| Dividends and share repurchases | 2,625 | 6,407 | 5,144 | 6,396 | 3,397 |
| Free cash flow cover of that payout | 6.00x | 2.10x | 2.02x | 0.99x | 2.30x |
| Dividends declared per share | $2.00 | $2.20 | $2.42 | $2.66 | $2.66 |
| Dividend, share of Adjusted EPS | 23.8% | 24.4% | 27.7% | 49.1% | 39.4% |
Adjusted EBITDA is adjusted operating income plus depreciation, since intangible amortisation is already outside the adjusted measure. Return on invested capital applies a flat 25% notional tax to adjusted operating income over closing total debt plus total shareholders' equity, so it compares the five years with each other rather than testing a cost of capital. CVS republished 2021 shareholders' equity at $74,535m against the $75,075m first reported, but never republished a full 2021 balance sheet after adopting ASU 2018-12, so total assets, current assets and current liabilities for 2021 are as originally reported.
Operating cash flow converted 74% of adjusted operating income in 2025 against 106% in 2021 and declined at 12.6% a year, and the current ratio has been below 1.0 in every year. Cumulative free cash flow of $53,723m covered cumulative dividends and buybacks of $23,969m with room, but the trend inside that period runs one way and free cash flow covered the 2024 payout 0.99 times. Repurchases were $3,023m in 2024 and nil in 2025, and the full $10,000m November 2022 authorisation was unused at 31 December 2025.

Revenue by quarter
Table 2.8 Total revenues by quarter, 2021 to 2025 ($m)
| 2021 | 2022 | 2023 | 2024 | 2025 | |
|---|---|---|---|---|---|
| First quarter | 69,097 | 76,826 | 85,278 | 88,437 | 94,588 |
| Second quarter | 72,616 | 80,636 | 88,921 | 91,234 | 98,915 |
| Third quarter | 73,794 | 81,159 | 89,764 | 95,428 | 102,871 |
| Nine months, as filed | 215,507 | 238,621 | 263,963 | 275,099 | 296,374 |
| Fourth quarter | 76,604 | 83,846 | 93,813 | 97,710 | 105,693 |
| Full year, audited | 292,111 | 322,467 | 357,776 | 372,809 | 402,067 |
| Fourth quarter growth | n/a | 9.5% | 11.9% | 4.2% | 8.2% |
First and second quarter figures come from the second quarter Form 10-Q of each year, third quarter and nine month figures from the third quarter Form 10-Q, and the fourth quarter from the unaudited Exhibit 99.1 of the fourth quarter Form 8-K. The fourth quarter carried more than a quarter of revenue in every year, 26.2% in 2021 and 26.3% in 2025.
First half 2026
Table 2.9 First half 2026 against first half 2025 ($m except per share)
| H1 2025 | H1 2026 | Change | Change % | |
|---|---|---|---|---|
| Total revenues | 193,503 | 206,522 | 13,019 | 6.7% |
| Health Care Benefits revenue | 71,068 | 73,509 | 2,441 | 3.4% |
| Health Services revenue | 89,915 | 100,032 | 10,117 | 11.3% |
| Pharmacy & Consumer Wellness revenue | 65,493 | 65,805 | 312 | 0.5% |
| Operating income | 5,755 | 9,383 | 3,628 | 63.0% |
| Adjusted operating income | 8,387 | 10,307 | 1,920 | 22.9% |
| Health Care Benefits adjusted operating income | 3,301 | 5,467 | 2,166 | 65.6% |
| Health Services adjusted operating income | 3,178 | 3,222 | 44 | 1.4% |
| Pharmacy & Consumer Wellness adjusted operating income | 2,651 | 2,672 | 21 | 0.8% |
| Interest expense | (1,548) | (1,531) | 17 | 1.1% |
| Income before income tax provision | 4,264 | 7,915 | 3,651 | 85.6% |
| Net income attributable to CVS Health | 2,800 | 5,922 | 3,122 | 111.5% |
| GAAP diluted EPS | $2.21 | $4.61 | $2.40 | 108.6% |
| Adjusted EPS | $4.06 | $5.16 | $1.10 | 27.1% |
| Operating cash flow | 6,453 | 10,594 | 4,141 | 64.2% |
| Capital expenditure | 1,350 | 1,540 | 190 | 14.1% |
| Free cash flow | 5,103 | 9,054 | 3,951 | 77.4% |
| Dividends paid | 1,706 | 1,725 | 19 | 1.1% |
| Medical benefit ratio | 88.6% | 86.0% | (260 bps) | n/a |
| Operating margin | 2.97% | 4.54% | 157 bps | n/a |
| Adjusted operating margin | 4.33% | 4.99% | 66 bps | n/a |
The recovery is real and it is concentrated. Health Care Benefits supplied $2,166m of the $1,920m increase in group adjusted operating income, so the other segments together went backwards net of corporate cost. The medical benefit ratio of 86.0% is 260 basis points better than a year earlier, helped by the absence of a $471m Group Medicare Advantage premium deficiency reserve taken in the second quarter of 2025 and by $1.2bn of favourable development already booked in six months. First half operating cash flow of $10,594m meets 92% of the raised full year floor of $11,500m, and the company guides that figure as a floor. Chapter 3 takes the guidance apart.
3 MD&A & Management Commentary
CVS Health's own commentary turns on one number. The Health Care Benefits medical benefit ratio fell to 86.0% in the first half of 2026 from 88.6%, and management attributes it to improved underlying performance in the Government business plus the absence of the premium deficiency reserves booked a year earlier. That single line carries the earnings: adjusted operating income at Aetna rose $2,166m in the half against $1,920m for the whole company.
Management does not expect the improvement to continue at that rate. Adjusted earnings guidance for 2026 was raised on 5 August 2026 to $7.90 to $8.10 a share, from $7.00 to $7.20 issued in December. First half adjusted earnings of $5.16 leave $2.74 to $2.94 for the second half, growth of 1.9% to 9.3% against 27.1% delivered in the first half. The guided full year benefit ratio of 89.75% against 86.0% in the first half carries the same message. Management wrote the caution into the release itself and the chief financial officer repeated it on the call.
What management flags
Table 3.1 Trends and risks CVS Health names itself, with the filing or call and the date
| Trend management names | What management says | Quantum disclosed | Source | Date |
|---|---|---|---|---|
| Utilisation | Elevated utilisation is expected to persist in 2026, and utilisation beyond current levels may pressure Health Care Benefits and the health care delivery assets. The 10-Q changes the tense: utilisation persisted at elevated levels in the second quarter of 2026. | Not quantified | Form 10-K, Item 7; Form 10-Q, Part I Item 2 | 10 Feb 2026; 5 Aug 2026 |
| Medical benefit ratio | Improved underlying performance in the Government business and the absence of prior year premium deficiency reserves. | 86.0% in H1 2026 against 88.6% | Form 10-Q, Part I Item 2 | 5 Aug 2026 |
| Prior year reserve development | Prior years' health care costs payable estimates developed favourably. The company states this does not directly correspond to an increase in current year results. | $1.2bn in H1 2026 against $1.9bn in H1 2025 | Form 8-K exhibit 99.1 | 5 Aug 2026 |
| Medicare Advantage star ratings | More than 81% of Medicare Advantage members are in plans rated at least four stars for 2026, against 88% for 2025. | 700 basis point fall in the four star share | Form 10-K, Item 7 | 10 Feb 2026 |
| Medicare Advantage rates | The final 2027 rate notice gives the industry an average revenue increase of 2.48%, above the 0.09% in the January advance notice and below the 5.06% for 2026. | 2.48% for 2027 | Form 10-Q, Part I Item 2 | 5 Aug 2026 |
| Medical membership | Total medical membership fell about 700,000 in a year on the exit from the individual exchange business, offset in part by Commercial administrative services growth. | 26.0m at 30 June 2026 | Form 10-Q, Part I Item 2 | 5 Aug 2026 |
| PBM economics | A larger share of rebates, fees and discounts goes to clients, minimum pricing guarantees cannot always be achieved, and marketplace and regulatory change has limited retail network differential or spread. The company expects these trends to continue. | Not quantified | Form 10-K, Item 7; Form 10-Q, Part I Item 2 | 10 Feb 2026; 5 Aug 2026 |
| PBM regulation | Comprehensive PBM legislation is proposed or enacted in most states and federally. Some states are considering bans on pharmacy licensure for pharmacies affiliated with a PBM. | Not quantified | Form 10-Q, Part I Item 2 | 5 Aug 2026 |
| 340B drug pricing | The environment for the federal 340B programme remains dynamic and may continue to affect Health Services. New to the quarterly commentary; absent from the 10-K trend list. | Not quantified | Form 10-Q, Part I Item 2 | 5 Aug 2026 |
| Federal Trade Commission | A proposed settlement announced in July 2026 would resolve all outstanding FTC investigations of the PBM and affiliated pharmacy businesses. The FTC has halted its litigation pending a public comment period. | Not quantified | Form 10-Q, Note 8 | 5 Aug 2026 |
| Pharmacy pricing | Regulatory related price reductions on certain drugs, recent generic introductions and continued reimbursement pressure offset drug mix, volume and brand inflation. | Segment revenue up 0.7% in the quarter | Form 10-Q, Part I Item 2 | 5 Aug 2026 |
| Pharmacy volume | Rite Aid prescription file acquisitions and increased utilisation lift prescriptions filled, offset by the loss of long term care volume after the Omnicare deconsolidation. | Prescriptions filled up 4.3% | Form 10-Q, Part I Item 2 | 5 Aug 2026 |
| Health care delivery | A $5,725m goodwill impairment on the Health Care Delivery reporting unit, plus an $83m charge for planned Oak Street Health clinic closures in 2026. | $5,808m combined | Form 10-K, Item 7 | 10 Feb 2026 |
| Legacy litigation | Two court decisions on past business practices produced charges in the Omnicare dispensing matter and the PBM direct and indirect remuneration matter. | $1,220m in 2025 | Form 10-K, Item 7 | 10 Feb 2026 |
| Tariffs and inflation | New or changed tariffs, inflation and labour dynamics could raise costs, disrupt supply and reduce the ability to deliver client savings. | Not quantified | Form 10-K, Item 7; Form 10-Q, Part I Item 2 | 10 Feb 2026; 5 Aug 2026 |
| Front store demand | Consumer confidence and lower discretionary spending, plus a shift to value, grocery and digital retailers, could reduce front store sales. | Front store same store sales up 1.0% | Form 10-K, Item 7; Form 10-Q, Part I Item 2 | 5 Aug 2026 |
| Geopolitical risk | Heightened tensions raise the likelihood of slowdown, market volatility, supply chain cost and cyberattack. New to the quarterly trend list. | Not quantified | Form 10-Q, Part I Item 2 | 5 Aug 2026 |
Three of these appear in the quarterly commentary and not in the annual one: 340B, the state pharmacy licensure proposals and geopolitical risk. Utilisation, the PBM pricing trends and the FTC settlement are not quantified, and those three sit under the numbers that move the stock.
The benefit ratio, and what sits behind it

Table 3.2 Health Care Benefits, as management reports it
| Measure | Q2 2025 | Q2 2026 | H1 2025 | H1 2026 | FY2024 | FY2025 |
|---|---|---|---|---|---|---|
| Total revenues ($m) | 36,258 | 37,538 | 71,068 | 73,509 | 130,665 | 143,354 |
| Adjusted operating income ($m) | 1,308 | 2,426 | 3,301 | 5,467 | 307 | 2,939 |
| Medical benefit ratio | 89.9% | 87.4% | 88.6% | 86.0% | 92.5% | 91.2% |
| Premium deficiency reserve in the period ($m) | 471 | 0 | 902 | 0 | n/a | n/a |
| Favourable prior year development, period to date ($m) | 1,900 | 1,200 | 1,900 | 1,200 | 885 | 2,000 |
| Days claims payable at the period end | 40.9 | 41.7 | 40.9 | 41.7 | 44.0 | 38.9 |
| Total medical membership (thousands) | 26,721 | 26,023 | 26,721 | 26,023 | 27,095 | 26,591 |
| Insured medical membership (thousands) | 11,069 | 9,829 | 11,069 | 9,829 | 12,514 | 10,868 |
The development row carries the rounded year to date figures from the earnings releases. The audited health care costs payable table gives $947m for 2024 and $1,982m for 2025, and Table 2.4 uses those.
The 250 basis point improvement in the June quarter has two components management separates. Absent premium deficiency reserves account for the $471m charged a year earlier, 140 basis points of that quarter's ratio; the rest is what management calls improved underlying performance in the Government business. For the half, management adds a partial offset it does not size: development fell to $1.2bn from $1.9bn, a $700m reduction against a $2,166m increase in adjusted operating income.
Days claims payable ended the June quarter at 41.7 days, against 42.9 at 31 March 2026 and 0.8 days above the same point a year earlier, and the 38.9 day reading at 31 December 2025 is the lowest in the series. Management gives the metric as an indicator of the adequacy of the health care costs payable liability and does not comment on the December fall.
Membership is shrinking where the risk sits. Insured membership fell 1,240,000 in the year to 30 June 2026 while administrative services membership rose 542,000, and standalone Medicare Part D membership fell to 3,870,000 from 4,065,000. The benefit ratio applies to the Insured book alone.
Star ratings are the one place where the disclosure and the framing diverge. The release of 29 October 2025 headed its operational highlights with Aetna receiving industry leading Medicare Advantage star ratings results, and stated in the same release that more than 81% of members are in 2026 plans rated four stars or higher and more than 63% in a 4.5 star plan. The year on year comparator appears only in the 10-K of 10 February 2026: 88% of members were in plans rated at least four stars on the 2025 ratings. The 2026 ratings determine bonus payments in 2027.
Guidance revisions through the year

Table 3.3 Fiscal 2026 guidance, as issued and as revised
| Metric | 9 Dec 2025 | 10 Feb 2026 | 6 May 2026 | 5 Aug 2026 |
|---|---|---|---|---|
| Total revenues | At least $400.0bn | n/a | At least $405.0bn | At least $414.0bn |
| GAAP diluted earnings per share | $5.94 to $6.14 | Confirmed | $6.24 to $6.44 | $6.84 to $7.04 |
| Adjusted earnings per share | $7.00 to $7.20 | Confirmed | $7.30 to $7.50 | $7.90 to $8.10 |
| Cash flow from operations | At least $10.0bn | At least $9.0bn | At least $9.5bn | At least $11.5bn |
| GAAP operating income | $13.26bn to $13.60bn | n/a | n/a | n/a |
| Adjusted operating income | $15.07bn to $15.41bn | n/a | n/a | n/a |
| Implied second half adjusted earnings per share | n/a | n/a | n/a | $2.74 to $2.94 |
| Implied second half growth on the prior year | n/a | n/a | n/a | 1.9% to 9.3% |
The adjusted earnings guide has moved in one direction only, the midpoint rising from $7.10 to $8.00 in eight months, an increase of 12.7%. Cash flow from operations is the exception, cut to at least $9.0bn in February from at least $10.0bn in December and then raised twice to at least $11.5bn; that February cut is the only downward revision in the 2026 guide.
Fiscal 2025 ran the same way on the adjusted measure, the midpoint rising from $5.875 on 12 February 2025 to $6.65 on 9 December 2025, with reported adjusted earnings of $6.75 landing $0.05 above the top of that last range. The GAAP guide ran the other way at every date, from $4.58 to $4.83 in February 2025 to $(0.34) to $(0.24) in October, as the impairment and the litigation charges landed. On 9 December 2025, three weeks from the year end, the company guided GAAP diluted earnings of $(0.32) to $(0.22) and reported $1.39, $1.61 above the top of the range; the reconciliation published that day carried no line for the $1,928m worthless stock deduction, worth $1.51 a share, that appears in the 10 February 2026 bridge. The reconciling item is a tax event. Cash flow from operations behaved the same way, $10,639m reported against a range of $7.5bn to $8.0bn confirmed on 9 December. The 10-K attributes the increase to the timing of payments and receipts and to improved Health Care Benefits performance, and does not address the variance against the December range.
The implied second half is the part of the guide worth holding. First half adjusted earnings of $5.16 against a full year guide of $7.90 to $8.10 leave $2.74 to $2.94, against $2.69 in the second half of 2025. On the call the chief financial officer said the company expects second half earnings a share to be weighted more to the third quarter on typical seasonality, and guided a full year medical benefit ratio of 89.75% plus or minus 25 basis points. That implies a second half benefit ratio of 93.0% to 93.9% against 93.8% in the second half of 2025: the first half improved 260 basis points and the guided second half improves by close to nothing. The implied ratio is derived here, because the company guides a full year ratio without guiding premium revenue; second half premiums are estimated by carrying the 2025 second half to first half premium ratio of 1.0114 onto the 2026 first half.
Reported earnings against the adjusted measure

Eight of the twelve adjusting lines in Table 2.3 are one off items and they run in both directions. The three charges management treats as outside the ordinary course, the goodwill impairment, the legacy litigation charges and the loss on Accountable Care assets, total $7,233m before tax. Against them sit a $483m gain on the Omnicare deconsolidation and a $1,928m tax benefit from a worthless stock deduction on the same subsidiary, which filed for bankruptcy in September 2025, so the bankruptcy that removed the business produced $2,411m of the $2,979m of credits in the bridge.
The effective tax rate tells the same story, falling to 19.1% in 2025 from 25.4% on that deduction, offset in part by the goodwill impairment and the legacy litigation charges being nondeductible. In the June 2026 quarter it was 24.7% against 38.5%, the prior year rate having been lifted by those same nondeductible charges.
The gap between the two operating income measures has closed: $6,666m in the September 2025 quarter, $485m in December, $470m in March 2026 and $454m in June 2026. Adjusted operating income for the June quarter was $5,157m, $7m above the March quarter, on revenue $5,670m higher.
Table 3.4 Segment adjusted operating income and what management attributes it to
| Segment | Q2 2026 ($m) | Change on the prior year | Management's attribution |
|---|---|---|---|
| Health Care Benefits | 2,426 | 85.5% | Improved underlying performance in the Government business and the absence of a $471m premium deficiency reserve in Group Medicare Advantage. |
| Health Services | 1,733 | 10.0% | Improved purchasing economics, drug mix and modest improvement in health care delivery, offset by continued pharmacy client price improvements. |
| Pharmacy & Consumer Wellness | 1,475 | 10.2% | Core pharmacy strength and the Rite Aid asset acquisitions, offset by business investment and consumer dynamics. |
| Corporate/Other | (477) | (15.5%) | The adjusted operating loss widened from $(413)m. The quarterly commentary gives no attribution for this segment. |
Health Services is the segment to watch. Full year 2025 adjusted operating income of $7,151m was $92m below 2024 and $161m below 2023, on revenue $16.8bn higher than 2024. Pharmacy claims processed were flat in the June 2026 quarter and fell 0.9% across 2025. Management names continued pharmacy client price improvements as the offset in every period. On the 5 August call it reiterated rather than raised the segment's full year outlook, citing an updated view of 340B.
The pharmacy model change and the retail footprint

The pricing model change is complete on the retail side and still moving on the PBM side. The release of 10 February 2026 states that CVS Pharmacy completed the transition to cost based reimbursement across its Commercial, Third Party Discount, Medicare and Medicaid businesses, while the Health Services commentary continues to name pharmacy client price improvements as the drag on adjusted operating income in every period since. On the 5 August call the chairman and chief executive said the company expects the transition to net cost price models to accelerate while preserving the value PBMs deliver, citing recent legislation and regulatory developments including the proposed FTC settlement, which the 10-Q describes as resolving all outstanding FTC investigations of the PBM and affiliated pharmacy businesses subject to a public comment period.
The retail closure programme has run its course. CVS closed 243 stores in 2025 against 299 in 2024 and 318 in 2023, and opened 87 against 39 in each of the two prior years, ending 2025 at 8,979 stores. The 2024 restructuring plan named further closures for 2025; no equivalent programme is named for 2026. The only closure charge in the 2026 outlook is the $83m for planned Oak Street Health clinic closures, inside the reporting unit that took the $5,725m goodwill impairment, and clinic count is unchanged at more than 1,000 walk in and primary care locations. Capital return has not moved with earnings: the quarterly dividend held at $0.665 through 2024 and 2025 and is expected to hold through 2026, and $11.5bn of buyback authorisation stands unused while the adjusted earnings guide rose 12.7% in eight months.
Where the framing and the numbers part company
The chief financial officer said on 6 May 2026 that the outlook continues to maintain the same respectful and prudent view on medical cost trends until the company has greater visibility into how those trends are developing. Both 2026 releases repeat that the company is raising guidance while maintaining a cautious view for the remainder of the year in light of continued elevated cost trends and the potential for macro headwinds. The identical clause appears in the release of 1 May 2025, a year that ended $0.05 above the top of the last range issued.
The 10-K and the 10-Q disagree in tense on utilisation. The 10-K states that utilisation is expected to persist at elevated levels in 2026; the 10-Q for the June quarter states that utilisation persisted at elevated levels in that quarter, the quarter in which the benefit ratio improved 250 basis points. Both statements can hold at once if price and mix are carrying the recovery rather than cost, and the filings do not separate the two.
The GAAP guide is the weakest of the published measures. The last 2025 GAAP range missed by $1.61 a share, essentially all of it a discrete tax benefit absent from that day's reconciliation, and cash flow from operations missed the top of its range by $2,639m over the same three weeks. Neither variance is explained in the subsequent filings, and the 2026 GAAP range of $6.84 to $7.04 carries the same construction: $1.06 a share of amortisation and other adjustments, and no allowance for items of the kind that moved 2025.
Two disclosures are absent. Management does not quantify the utilisation trend in any filing reviewed, and it does not size the pharmacy client price improvements it names as the offset to Health Services adjusted operating income in every period. Those two omissions sit directly beneath the segment that produced the earnings and the segment that did not.
4 Sector & Competitor Analysis
CVS Health is the slowest growing company in its peer set, carries the most debt, earns the lowest return on capital of the seven whose capital base can be measured, and trades on the highest reported earnings multiple of the eight. Revenue of $402.1bn for the year to 31 December 2025 grew 7.8% against a peer median of 11.5%. Return on capital of 3.2% compares with a peer median of 10.3%. Net financial debt of $56.1bn is 5.69 times reported EBITDA, more than double the peer median of 2.34 times. The last trade on 3 September 2026 was $97.15, a market value of $124bn and 69.9 times reported diluted earnings of $1.39.
Reverse the one charge that produced that reading and the picture changes. The $5,725m goodwill impairment is entirely nondeductible, so it costs $5,725m of earnings and nothing in tax. Reverse it and the discrete $1,900m worthless stock tax benefit disclosed in the same accounts, and core earnings are $4.40 a share, a multiple of 22.1 times against a peer median of 30.3 times reported. Leverage on core EBITDA is 3.60 times rather than 5.69. Enterprise value is 11.6 times core EBITDA against 17.9 times median on reported EBITDA. On core earnings the stock trades at 22.1 times; on the accounts as filed it trades at 69.9 times.
Three businesses, one filer
CVS reports three operating segments that compete against different companies, and no single listed company matches the combination. This chapter uses one blended peer set at the consolidated level and segment panels beneath it. The blend is unavoidable for anything needing a whole company denominator: CVS files one income statement, one balance sheet and one share count, so growth, return on capital, leverage and every valuation line can only be struck on the consolidated group. The panels are necessary for anything needing a cost denominator, because a margin struck on premium revenue and a margin struck on drug distribution revenue describe different economics and different capital intensities. Comparator coverage is uneven: health benefits has five comparators at whole company level and one at segment level, because UnitedHealth alone reports its health benefits business apart from its services business while Elevance, Humana and Centene are payers almost in full; pharmacy benefits has two segment comparators, Optum Rx and Evernorth Health Services; retail pharmacy has none at any level.
The sector
United States health spending reached $5.3 trillion in 2024, up 7.2%, and 18.0% of gross domestic product against 17.7% a year earlier. Private health insurance accounted for $1.6 trillion, Medicare $1.1 trillion and Medicaid $931.7bn. Retail prescription drug spending was $467.0bn, up 7.9% after 10.8% growth the year before.
Three forces set margins in this sector. Government contracting sets the price on a rising share of revenue. On the FY2025 10-K statement, roughly one dollar in five of CVS consolidated revenue comes from the federal government, almost all of it CMS contracts inside Health Care Benefits, and the three most recent 10-K statements do not agree on the level for the years they overlap (Table 1.6). Medicare Advantage covers 35.2 million of the 64.2 million people eligible, 55% of them, and the four largest carriers hold 64% of that enrolment: UnitedHealth 26%, Humana 20%, CVS Health 12% and Kaiser Permanente 6%. Elevance holds 5%.
Concentration in claims processing sets the fee. Three companies processed 80% of all equivalent prescription claims in 2025, and scale there buys manufacturer discounts and network terms, which is why the claim count matters more than the covered lives.

The benefit ratio sets the payer margin, and the spread between the best and worst in the payer panel is 7.8 percentage points on revenue bases running from $130bn to $448bn.
Retail pharmacy has stopped being a listed business. Walgreens Boots Alliance was removed from listing on 28 August 2025 on Form 25-NSE, its last annual report covering the year to 31 August 2024 with $147,658m of revenue. CVS is the only large filer left under its own SIC code, 5912 Retail Drug Stores and Proprietary Stores, and the next largest active filer under that code, Guardian Pharmacy Services, reported $1,449m for 2025, less than 0.4% of CVS revenue. A reader who wants to value the retail pharmacy segment has no market comparator to work from.
The peer set and the rule that picks it
Selection rule: every United States listed filer reporting under SIC 6324 Hospital and Medical Service Plans or 5122 Wholesale Drugs, Proprietaries and Druggists' Sundries, or named by CVS in Item 1 as a competitor of one of its three segments and earning most of its revenue from health benefits, pharmacy benefits or pharmacy distribution, with revenue above $100bn in its latest annual report. Delisted filers are excluded. The screen returns five payers and two distributors, and excludes Molina Healthcare, which reports under SIC 6324 but earned $45,426m in 2025; Prime Therapeutics and MedImpact, which CVS names as pharmacy benefits competitors but which are not listed; Walmart and Amazon, which fail the majority of revenue test; and Walgreens Boots Alliance, which is delisted.
Table 4.1 The peer set, the business each runs, and the filing each figure is read from
| Ticker | Company | Business | SIC | Fiscal period | Form | Accession |
|---|---|---|---|---|---|---|
| CVS | CVS Health Corporation | Payer, pharmacy benefits and retail pharmacy | 5912 | Year to 31 Dec 2025 | 10-K | 0000064803-26-000010 |
| UNH | UnitedHealth Group Inc | Payer with Optum Rx pharmacy benefits | 6324 | Year to 31 Dec 2025 | 10-K | 0000731766-26-000062 |
| CI | The Cigna Group | Payer with Express Scripts pharmacy benefits | 6324 | Year to 31 Dec 2025 | 10-K | 0001739940-26-000006 |
| ELV | Elevance Health, Inc. | Payer with CarelonRx pharmacy benefits | 6324 | Year to 31 Dec 2025 | 10-K | 0001156039-26-000013 |
| HUM | Humana Inc. | Medicare focused payer | 6324 | Year to 31 Dec 2025 | 10-K | 0000049071-26-000009 |
| CNC | Centene Corporation | Medicaid and exchange focused payer | 6324 | Year to 31 Dec 2025 | 10-K | 0001071739-26-000049 |
| MCK | McKesson Corporation | Pharmaceutical distribution | 5122 | Year to 31 Mar 2026 | 10-K | 0000927653-26-000069 |
| COR | Cencora, Inc. | Pharmaceutical distribution | 5122 | Year to 30 Sep 2025 | 10-K | 0001140859-25-000131 |
Six of the eight close on 31 December 2025. McKesson closes on 31 March 2026 and Cencora on 30 September 2025, so each overlaps the CVS year by nine months. McKesson carries a quarter of calendar 2026 that no other company in the table has seen, and Cencora carries a quarter of calendar 2024 that the other seven have already left behind.
Like for like comparison
Table 4.2 Peer comparison on one set of definitions, latest reported fiscal year
| Ticker | Fiscal period | Revenue $bn | Growth % | Gross margin % | Operating margin % | Return on capital % | Return on assets % | Net debt / EBITDA x | Price / earnings x | EV / EBITDA x | Market value $bn |
|---|---|---|---|---|---|---|---|---|---|---|---|
| CVS | Year to 31 Dec 2025 | 402.1 | 7.8 | 13.8 | 1.31 | 3.2 | 1.68 | 5.69 | 69.9 | 18.3 | 124 |
| UNH | Year to 31 Dec 2025 | 447.6 | 11.8 | 18.5 | 4.18 | 10.6 | 5.26 | 2.34 | 30.3 | 17.9 | 359 |
| CI | Year to 31 Dec 2025 | 274.9 | 11.2 | 9.3 | 3.34 | 11.3 | 4.70 | 1.99 | 12.9 | 8.3 | 76 |
| ELV | Year to 31 Dec 2025 | 199.1 | 12.5 | 14.9 | 4.07 | 10.3 | 5.63 | 2.34 | 16.5 | 11.6 | 90 |
| HUM | Year to 31 Dec 2025 | 129.7 | 10.1 | 14.5 | 1.69 | 7.1 | 3.75 | 2.71 | 41.3 | 18.9 | 49 |
| CNC | Year to 31 Dec 2025 | 194.8 | 19.4 | 17.7 | (3.11) | (30.7) | (7.82) | n/a | n/a | n/a | 34 |
| MCK | Year to 31 Mar 2026 | 403.4 | 12.4 | 3.6 | 1.60 | n/a | 6.44 | 0.36 | 24.0 | 15.3 | 107 |
| COR | Year to 30 Sep 2025 | 321.3 | 9.3 | 3.6 | 0.79 | 35.0 | 2.31 | 0.91 | 42.3 | 18.7 | 64 |
Definitions, applied identically to every company. Revenue is total revenue on the face of the income statement, and growth compares it with the prior year as filed in the same annual report. Gross margin is revenue less the direct cost of insured benefits and of products and services sold, over revenue. Operating margin is income before income taxes plus interest expense on borrowings, over revenue, because four of the eight present no operating income subtotal; on that definition CVS operating profit reads $5,255m against the $4,660m of GAAP operating income CVS itself presents. Return on capital is that operating profit after the company's own effective tax rate, over total equity including noncontrolling interests plus financial debt less cash; return on assets uses the same numerator over year end total assets. EBITDA is operating profit plus depreciation and amortisation from the cash flow statement. Price to earnings uses diluted earnings per share as filed, and both it and market value use the last trade on 3 September 2026 and the share count on the cover page of each issuer's Form 10-Q for the quarter to 30 June 2026.
Four limits on comparability. Return on capital is not reported for McKesson because its book equity is negative, at $(1,777)m after years of repurchases, so the ratio would be an artefact of that negative equity. Cencora's 35.0% rests on equity of $1,747m and is inflated by the same mechanism in milder form, so read its return on assets of 2.31% alongside it. Centene alone presents premium taxes as a separate revenue line of $20,196m and cost line of $20,538m, both inside revenue and total costs, so its operating margin is unaffected and its gross margin is not comparable. And gross margin cannot be read across the two panels at all: 3.6% at a distributor that buys and resells drugs and 18.5% at a payer that collects premiums are not the same measure of anything.

CVS sits at an extreme on three of the five measures. It is the slowest grower of the eight at 7.8%, against 19.4% for Centene and 12.5% for Elevance; the most leveraged at 5.69 times, against a range from net cash at Centene to 2.71 times at Humana; and it earns 3.2% on capital, above only Centene's loss making $(30.7)%. On operating margin it is close to the middle at 1.31% against a median of 1.64%, and on gross margin it sits between the distributors and the payers because it is both.
Reported earnings against core earnings
Three of the eight wrote off goodwill in the latest year, and in two cases the charge is large enough to invert the reading of Table 4.2.
Table 4.3 Reported to core earnings, latest fiscal year, $m except per share and multiples
| Item | CVS | CNC | COR |
|---|---|---|---|
| Nature of the item | Goodwill impairment, Health Care Delivery, and a discrete tax benefit | Goodwill impairment, Medicaid, Commercial and other units | Goodwill impairment, International Healthcare Solutions |
| Operating profit, reported | 5,255 | (6,050) | 2,550 |
| Item inside operating profit | 5,725 | 6,723 | 724 |
| Operating profit, core | 10,980 | 673 | 3,274 |
| Operating margin, reported % | 1.31 | (3.11) | 0.79 |
| Operating margin, core % | 2.73 | 0.35 | 1.02 |
| Net income, reported | 1,768 | (6,674) | 1,554 |
| Item after tax | 3,825 | 6,723 | 724 |
| Net income, core | 5,593 | 49 | 2,278 |
| Diluted earnings per share, reported | 1.39 | (13.53) | 7.96 |
| Diluted earnings per share, core | 4.40 | 0.10 | 11.67 |
| Price to earnings, reported x | 69.9 | n/a | 42.3 |
| Price to earnings, core x | 22.1 | 684.9 | 28.9 |
| Net debt to EBITDA, reported x | 5.69 | n/a | 0.91 |
| Net debt to EBITDA, core x | 3.60 | n/a | 0.76 |
No tax benefit is attributed to either large impairment, because neither company's own tax rate reconciliation attributes one. CVS added back $1,202m of nondeductible impairment loss, 21% of $5,725m, and Centene added back $1,409m of nondeductible goodwill, 21% of $6,723m. Both charges cost earnings in full.
The CVS after tax item of $3,825m is the $5,725m impairment less the worthless stock investment tax benefit, which flatters reported earnings in the opposite direction. The same FY2025 filing gives that benefit two ways: the income taxes note discloses $1.9bn and the reconciliation of net income to adjusted income in Table 2.3 gives $1,928m, and Table 4.3 uses the tax note figure. Both items are one off, both belong in the same restatement, and the net effect lifts diluted earnings a share from $1.39 to $4.40 and cuts the multiple from 69.9 times to 22.1 times, below UnitedHealth at 30.3 times and Humana at 41.3 times and above Cigna at 12.9 times and Elevance at 16.5 times.
Centene's restatement leaves core net income of $49m and core earnings of $0.10 a share, so the 684.9 times multiple carries no information; the row shows an underlying result close to break even.
The impairment is one part of the gap between what CVS reports and what it measures itself on. The full $9,783m bridge from adjusted operating income of $14,443m to operating income of $4,660m is in Table 2.2, and adjusted operating income on that basis rose 20.6% year on year.
Where CVS makes its margin, and against whom
Table 4.4 Each CVS segment against the closest listed comparator that reports the same business, latest fiscal year
| Business | Company and segment | Revenue $bn | Intersegment share of revenue % | Segment profit $m | Margin % | Profit measure |
|---|---|---|---|---|---|---|
| Health benefits | CVS Health Care Benefits | 143.4 | 0 | 2,939 | 2.05 | Adjusted operating income |
| Health benefits | UNH UnitedHealthcare | 344.9 | 0 | 9,425 | 2.73 | Earnings from operations |
| Pharmacy benefits and services | CVS Health Services | 190.4 | 14 | 7,151 | 3.76 | Adjusted operating income |
| Pharmacy benefits and services | UNH Optum Rx | 154.7 | 63 | 7,193 | 4.65 | Earnings from operations |
| Pharmacy benefits and services | CI Evernorth Health Services | 235.0 | 1 | 7,221 | 3.07 | Adjusted pretax income |
| Retail pharmacy | CVS Pharmacy & Consumer Wellness | 139.4 | 33 | 6,040 | 4.33 | Adjusted operating income |
| Retail pharmacy | No listed comparator | n/a | n/a | n/a | n/a | n/a |
The three profit measures are not identical and the table names each one. The denominators differ more than the numerators: 63% of Optum Rx revenue is sold to other UnitedHealth segments against 14% at CVS Health Services, which flatters the Optum Rx margin denominator. A third of Pharmacy & Consumer Wellness revenue is sold to Caremark, so the retail segment's 4.33% margin rests in part on an internal transfer price.
Read the levels rather than the rankings. All three pharmacy benefits businesses earn between 3.07% and 4.65% on revenue running from $155bn to $235bn, and all three earn between $7.15bn and $7.22bn of profit: a scale business with a narrow and converged margin, and CVS sits inside the band. Health benefits shows CVS at 2.05% against UnitedHealth at 2.73%, on a segment that recovered from $307m of adjusted operating income in 2024 to $2,939m in 2025, the single largest swing in the CVS accounts.
Table 4.5 The cost ratio that sets margin in each panel, latest fiscal year
| Panel | Company | Ratio % | Definition |
|---|---|---|---|
| Payer and pharmacy benefits | CI | 85.32 | Benefit costs divided by premiums earned, net |
| Payer and pharmacy benefits | UNH | 89.15 | Benefit costs divided by premiums earned, net |
| Payer and pharmacy benefits | ELV | 90.03 | Benefit costs divided by premiums earned, net |
| Payer and pharmacy benefits | HUM | 90.22 | Benefit costs divided by premiums earned, net |
| Payer and pharmacy benefits | CNC | 91.92 | Benefit costs divided by premiums earned, net |
| Payer and pharmacy benefits | CVS | 93.16 | Benefit costs divided by premiums earned, net |
| Pharmacy supply chain | MCK | 3.61 | Gross profit divided by revenue |
| Pharmacy supply chain | COR | 3.57 | Gross profit divided by revenue |
CVS reads worst on the consolidated benefit ratio, and part of that is presentation. The consolidated numerator includes $4,834m of health care costs booked inside Health Services and $177m inside Corporate, neither of which is funded by a premium. Measured on the segment that writes the premium, Health Care Benefits paid $122,949m of benefits on $134,749m of premiums, a ratio of 91.24%, which places CVS between Humana at 90.22% and Centene at 91.92% rather than last. The same presentation effect exists at UnitedHealth, Cigna and Elevance, each of which also books provider costs inside a services segment. It is quantified here only for CVS, because only the CVS segment note sets out the amount.
What the balance sheet costs

CVS carries $56.1bn of net financial debt, the largest of the eight and slightly above UnitedHealth at $54.0bn on a market value about a third of UnitedHealth's. At 3.60 times core EBITDA the leverage is 1.5 times the peer median of 2.34 times on reported EBITDA and more than four times what either distributor carries. That is the constraint the equity story runs into: CVS earns 3.2% on capital, or 6.8% on core operating profit before the impairment, and interest of $3,119m takes 28% of the $10,980m of core operating profit before tax.
Two facts support the rating. Adjusted operating income rose 20.6% to $14,443m, driven by a $2,632m recovery in Health Care Benefits, and the pharmacy benefits segment sits inside the same 3% to 5% margin band as Optum Rx and Evernorth on comparable scale. Two facts weigh against it. CVS grows slower than every company in the peer set, at 7.8% against a median of 11.5%, and its 1.900 billion equivalent prescription claims fell 0.9% in a year when Express Scripts grew 4.8% and Optum Rx 2.2%. The leverage means the equity absorbs the difference either way.
5 Material Events & Contracts
One event dominates the twelve months to 3 September 2026. Omnicare, LLC filed for Chapter 11 on 22 September 2025 and was deconsolidated in the third quarter. That single filing produced a $483m deconsolidation gain, a fourth quarter worthless stock deduction that took the quarterly effective tax rate to (115.9)% and the full year rate to 19.1%, and a July 2026 settlement capping the Department of Justice claim at a $440m minimum. The rest of the log runs the same way: two consecutive guidance raises, a combined Chair and Chief Executive, two board seats exchanged, no new debt sold, $3.3bn of long term debt repaid in six months, and three revolving credit facilities extended by a year each.
CVS filed ten current reports on Form 8-K in the window and no Form 6-K, which a domestic filer does not use. Three further material items reached the market through periodic filings: the credit facility amendments of 22 May 2026, a fresh automatic shelf on the same day, and the Omnicare settlement agreements signed in July 2026.
The twelve month event log
Table 5.1 Material events reported by CVS Health, 3 September 2025 to 3 September 2026
| Event date | Form and item | Summary | Accession number |
|---|---|---|---|
| 17 Aug 2026 | 8-K, Items 5.02, 7.01, 9.01 | Board appointed Teresa Heitsenrether, Chief Data and Analytics Officer of JPMorgan Chase, effective 18 November 2026, after Larry M. Robbins resigned from the Board on 13 August 2026. | 0001193125-26-354096 |
| 5 Aug 2026 | 8-K, Items 2.02, 9.01 | Second quarter revenue of $106.1bn, up 7.3%, GAAP diluted EPS of $2.31 and adjusted EPS of $2.58; full year 2026 adjusted EPS guidance raised to $7.90 to $8.10 and operating cash flow guidance to at least $11.5bn. | 0000064803-26-000097 |
| Jul 2026 | 10-Q, Note 8 | Agreements signed with the Department of Justice and the Omnicare Unsecured Creditors Committee settling the Bassan judgment, giving the DOJ a minimum of $440m. | 0000064803-26-000098 |
| 22 May 2026 | 10-Q, Exhibits 10.1 to 10.3 | Three back up revolving credit facilities of $2.5bn each amended, moving maturities from May 2028, 2029 and 2030 to May 2029, 2030 and 2031. | 0000064803-26-000098 |
| 22 May 2026 | S-3ASR | New automatic shelf registration for an indeterminate amount of debt securities, file number 333-296179, replacing the 2023 shelf under which the August 2025 notes were sold. | 0001193125-26-236988 |
| 14 May 2026 | 8-K, Items 5.02, 5.07 | All 13 directors elected, Ernst & Young ratified, say on pay carried and the 2026 Incentive Compensation Plan approved; the stockholder proposal to lower the written consent threshold was defeated. | 0000064803-26-000082 |
| 6 May 2026 | 8-K, Items 2.02, 9.01 | First quarter revenue of $100.4bn, up 6.2%, GAAP diluted EPS of $2.30 and adjusted EPS of $2.57; full year adjusted EPS guidance raised to $7.30 to $7.50. | 0000064803-26-000051 |
| 18 Mar 2026 | 8-K, Item 5.02 | Board elected John E. Gallina, former Chief Financial Officer of Elevance Health, effective 19 March 2026, and designated him an audit committee financial expert. | 0000064803-26-000017 |
| 10 Feb 2026 | 8-K, Items 2.02, 9.01 | Full year 2025 revenue of $402.1bn, up 7.8%, GAAP diluted EPS of $1.39 and adjusted EPS of $6.75; 2026 operating cash flow guidance cut to at least $9.0bn from at least $10.0bn. | 0000064803-26-000009 |
| 9 Dec 2025 | 8-K, Items 7.01, 9.01 | Investor Day set 2026 guidance of at least $400.0bn of revenue and $7.00 to $7.20 adjusted EPS, and committed to a mid teens adjusted EPS growth rate through 2028. | 0000064803-25-000082 |
| 20 Nov 2025 | 8-K, Items 8.01, 9.01 | Board elected President and Chief Executive David Joyner as Chair effective 1 January 2026; Michael Mahoney continues as Lead Independent Director and Roger Farah remains on the Board. | 0001193125-25-289805 |
| 29 Oct 2025 | 8-K, Items 2.02, 9.01 | Third quarter revenue of $102.9bn, up 7.8%, a GAAP diluted loss per share of $(3.13) after a $5.7bn goodwill impairment in Health Care Delivery, and adjusted EPS of $1.60. | 0000064803-25-000036 |
| 22 Sep 2025 | 8-K, Items 8.01, 9.01 | Omnicare, LLC filed a voluntary Chapter 11 petition in the Northern District of Texas with $110m of debtor in possession financing, and was deconsolidated in the third quarter. | 0001193125-25-211349 |

Four of the ten current reports carry Item 2.02 results and three carry Item 5.02 leadership changes. The two Item 8.01 filings are the highest impact in the set: the Omnicare bankruptcy and the combination of the Chair and Chief Executive roles. Nothing in the window used Item 1.01, Item 2.01 or Item 4.02.
What the events did to guidance

The 2026 guide opened at $7.00 to $7.20 on 9 December 2025, held in February, then rose $0.30 at the midpoint in May and a further $0.60 in August; Table 3.3 carries the full path. The 2025 outturn beat the guidance set nine weeks earlier on every measure: adjusted EPS of $6.75 cleared the guided $6.60 to $6.70, and adjusted operating income of $14,443m cleared the guided $14,220m to $14,390m. The GAAP line broke away much further, $1.39 against Investor Day guidance of $(0.32) to $(0.22), on the worthless stock deduction that produced a fourth quarter tax benefit at an effective rate of (115.9)% and pulled the full year rate to 19.1% from 25.4%. That beat is a consequence of the Omnicare filing.
Opioid and PBM litigation
The opioid settlement is now a payment schedule. Forty five states, the District of Columbia and all eligible territories participate, with separate agreements covering Florida, West Virginia, New Mexico and Nevada. Maryland has not joined, and litigation continues with Maryland subdivisions, the City of Philadelphia, hospitals and third party payors. A Florida hospital trial ended in a mistrial in December 2025 on a deadlocked jury, with a retrial scheduled for August 2026.

The contractual obligation stood at $3,975m at 31 December 2025, of which $648m falls due inside 2026 and $3,327m after. The remaining accrual was approximately $3.4bn at 30 June 2026, a runoff of $575m in six months against $648m scheduled for the full year. A further $320m opioid charge went through 2025 operating expenses, up from $243m in 2024, so the accrual is still being topped up as it is paid down.
PBM exposure sits in three places. The Federal Trade Commission's September 2024 administrative complaint on insulin pricing is still live, with the constitutional challenge to it on appeal at the Eighth Circuit, and CVS is defending it while attempting a negotiated resolution. Rebate and drug pricing claims from state attorneys general, subdivisions, private parties and putative classes have largely been consolidated into a multidistrict litigation in the District of New Jersey. Separately, the Behnke direct and indirect remuneration case produced an entered judgment of $291m after trebling and penalties, reserved in 2025 and now on appeal to the Third Circuit.
Legacy litigation charges recognised in 2025 total $1,220m: $387m for the Omnicare trebled damages award in the first quarter, $542m for the penalties in the second, and $291m for the PBM reporting judgment. Of the $542m Omnicare penalty, CVS was found jointly and severally liable for $165m, and that reserve remained on the balance sheet at 30 June 2026.
The July 2026 settlement caps the exposure. The Department of Justice receives a minimum of $440m, of which CVS pays $130m in cash within two weeks of the agreements taking effect, at which point both appeals are dismissed, and CVS guarantees collection of the remaining $310m if Omnicare has not paid it by 31 March 2028. The agreements depend on Bankruptcy Court approval and on the sale of Omnicare's assets closing, so neither condition is settled.
On PBM legislation the filings describe pressure in general terms. Comprehensive PBM legislation has been proposed or enacted in a majority of states, nearly all states now require PBMs to register or hold a licence, and one state has passed a law prohibiting the licensing of pharmacies affiliated with a PBM while others consider the same. No specific bill is quantified in the filings.
Financing
CVS raised no public debt inside the twelve month window. The last sale priced on 11 August 2025 and settled on 15 August 2025, three weeks before the window opens: $750m of 5.0% notes due September 2032, $1.5bn of 5.45% due September 2035, $1.25bn of 6.2% due September 2055 and $500m of 6.25% due September 2065, $4.0bn net of discounts and fees, used to repay commercial paper and other borrowings.
Since then the direction has been repayment. Long term debt fell from $60,502m at 31 December 2025 to $59,452m at 30 June 2026, with $3,287m repaid and nothing issued in the first half. Commercial paper was nil at both dates against $2,119m a year earlier, and total debt principal was $65,035m at 31 December 2025.

The three back up revolving credit facilities supporting the commercial paper programme were amended on 22 May 2026, one amendment each to the 2019, 2021 and 2022 agreements. Committed capacity is unchanged at $2.5bn each, $7.5bn in total, undrawn at both dates, with a weighted average quarterly facility fee of about 0.03%, and the maturities moved from May 2028, 2029 and 2030 to May 2029, 2030 and 2031. On the same day CVS filed a new automatic shelf registration for an indeterminate amount of debt securities under Rule 457(r), replacing the shelf that carried the August 2025 notes. Capacity to issue is in place and unused.
Governance and leadership
The board turned over at both ends of the window. David Joyner, named President and Chief Executive in October 2024, was elected Chair effective 1 January 2026, with Roger Farah stepping back from Executive Chair to director and Michael Mahoney continuing as Lead Independent Director. John E. Gallina, formerly Chief Financial Officer of Elevance Health, joined on 19 March 2026 and went straight onto the Audit Committee as a financial expert. Larry M. Robbins of Glenview Capital resigned on 13 August 2026 after two years, the filing stating no disagreement, and Teresa Heitsenrether of JPMorgan Chase was appointed four days later to start on 18 November 2026. Chapter 6 sets out the annual meeting vote.
Material contracts
Table 5.2 Material contracts disclosed in the 10-K and in filings inside the window
| Counterparty | Subject | Term and key economics | Source |
|---|---|---|---|
| Bank of America, N.A., as administrative agent | Five year back up revolving credit facility of 16 May 2019, Fourth Amendment of 22 May 2026 | $2,500m commitment, undrawn; maturity moved to May 2029; facility fee about 0.03% a quarter | 10-Q Q2 2026, Exhibit 10.1 (0000064803-26-000098) |
| Bank of America, N.A., as administrative agent | Five year back up revolving credit facility of 11 May 2021, Fifth Amendment of 22 May 2026 | $2,500m commitment, undrawn; maturity moved to May 2030 | 10-Q Q2 2026, Exhibit 10.2 (0000064803-26-000098) |
| Bank of America, N.A., as administrative agent | Five year back up revolving credit facility of 16 May 2022, Third Amendment of 22 May 2026 | $2,500m commitment, undrawn; maturity moved to May 2031 | 10-Q Q2 2026, Exhibit 10.3 (0000064803-26-000098) |
| U.S. Department of Justice and the Omnicare Unsecured Creditors Committee | Settlement of the Bassan False Claims Act judgment | DOJ receives at least $440m; CVS pays $130m within two weeks of effectiveness and guarantees collection of $310m unpaid by 31 March 2028; conditional on Bankruptcy Court approval and the Omnicare asset sale | 10-Q Q2 2026, Note 8 (0000064803-26-000098) |
| 45 states, the District of Columbia and all eligible territories, plus Florida, West Virginia, New Mexico and Nevada | National opioid settlement and four separate state settlements | $3,975m remaining obligation at 31 December 2025, of which $648m falls due within one year | 10-K FY2025, Note 18 and Item 7 (0000064803-26-000010) |
| Rite Aid | Purchase of prescription files and of certain stores in Idaho, Oregon and Washington | $465m total consideration agreed in May 2025, closings completed in the third quarter of 2025; $285m of customer relationship intangibles amortised over about ten years | 10-K FY2025, Note 2, disclosed but not filed as an exhibit (0000064803-26-000010) |
| Target Corporation | Pharmacy and clinic space leases inside Target stores | $2,268m of contractual lease obligations at 31 December 2025 | 10-K FY2025, Item 7 and Note 7 (0000064803-26-000010) |
| The Bank of New York Mellon Trust Company, N.A., as trustee | Senior Indenture of 15 August 2006 | Governs the senior notes within $65,035m of total debt principal at 31 December 2025 | 10-K FY2025, Exhibit 4.2 (0000064803-26-000010) |
| The Bank of New York Mellon Trust Company, N.A., as trustee | Subordinated Indenture of 25 May 2007 with the Second and Third Supplemental Indentures of 10 December 2024 | Governs $2,250m of 7.0% Series A junior subordinated notes due March 2055 and $750m of 6.75% Series B due December 2054, each resetting every five years | 10-K FY2025, Exhibits 4.3 to 4.5 (0000064803-26-000010) |
| Glenview Capital Management, LLC | Confidentiality agreement of 17 November 2024 | Still listed as a material contract in the FY2025 10-K; Glenview's Larry Robbins left the Board on 13 August 2026 | 10-K FY2025, Exhibit 10.1 (0000064803-26-000010) |
The Exhibit 10 series in the FY2025 10-K runs to 69 entries, of which 56 are compensatory plans, award forms or individual executive agreements. The commercial contracts reduce to the Glenview confidentiality agreement plus twelve entries covering three revolving credit agreements and their nine amendments. The Exhibit 4 series carries the debt architecture: one senior indenture from 2006, one subordinated indenture from 2007, and forms of note for every issue back to 2018, including the 2032, 2035, 2055 and 2065 notes from August 2025.
What the record does not contain
No merger, acquisition or divestiture agreement was filed in the window. No share repurchases were made in 2025, against $3,023m in 2024, and none appear in the first half of 2026, while dividends of $3,397m were paid in 2025 and $1,725m in the first half of 2026. The August 2026 board announcement reports Glenview's own account of a fully repaired balance sheet and dramatically improved financial performance, a characterisation the announcement attributes to the departing director.
6 Ownership, Voting Power & Annual Meeting
CVS Health has one class of common stock and one vote per share, so voting power tracks economic ownership share for share. There is no founder block, no dual class structure and no holder above ten percent. Control sits with index managers: the four holders the proxy identifies as owning more than five percent hold 354,790,463 shares, 27.68% of the 1,281,604,403 shares outstanding at the 16 March 2026 record date, enough for four stockholders acting together to meet the 25 percent threshold needed to request a written consent record date. Directors and executive officers hold 0.85% between them, and 1,777,089 shares of that are options, stock appreciation rights and deferred units rather than voting stock.
No investor has filed a Schedule 13D against CVS in the last two years, and none appears anywhere in the beneficial ownership record for the stock. Every one of the eight schedules filed in the window is a passive Schedule 13G or 13G/A. The nearest thing to an activist position is a board seat: Larry M. Robbins, founder of Glenview Capital Management, joined the board in November 2024 and the Glenview funds held 8,196,799 shares at the record date. Glenview cut that position to 4,824,799 shares in the June 2026 quarter, a reduction of 41.1% while its principal sat on the board.
Say on pay recovered from 59.0% support at the 2025 meeting to 94.0% in 2026, a gain of 35.0 points after a year in which management met holders of about 48% of the shares. The written consent proposal lost a second time, at 40.2% against 42.5% a year earlier.
Table 6.1 Ownership and voting power at the 16 March 2026 record date
| Holder | Shares held | Economic stake | Shares carrying a vote | Voting stake | Stake as disclosed | Source schedule | Filed |
|---|---|---|---|---|---|---|---|
| The Vanguard Group, Inc. | 117,681,195 | 9.18% | 1,662,275 | 0.13% | 9.14% | Schedule 13G/A | 2024-02-13 |
| BlackRock, Inc. | 105,292,588 | 8.22% | 95,632,723 | 7.46% | 8.30% | Schedule 13G/A | 2025-07-16 |
| Capital World Investors | 68,785,990 | 5.37% | 68,208,572 | 5.32% | 5.50% | Schedule 13G | 2025-05-13 |
| Dodge & Cox | 63,030,690 | 4.92% | 59,793,915 | 4.67% | 5.00% | Schedule 13G | 2024-11-13 |
| Four disclosed holders above five percent | 354,790,463 | 27.68% | 225,297,485 | 17.58% | n/a | ||
| Directors and executive officers as a group (23 persons) | 10,916,522 | 0.85% | 8,760,525 | 0.68% | n/a | DEF 14A | 2026-04-03 |
| of which Larry M. Robbins, through the Glenview funds | 8,582,951 | 0.67% | 8,196,799 | 0.64% | n/a | DEF 14A | 2026-04-03 |
Economic and voting stakes are separate columns, both struck on the record date count, and they differ only where a schedule reports shares over which the holder has dispositive power but no voting power. Vanguard is the extreme case, reporting voting power over 1,662,275 shares against 117,681,195 held. Robbins holds shared voting power over the Glenview shares, with no sole voting power, and disclaims beneficial ownership beyond his pecuniary interest; the balance of his reported total is 8,152 deferred director units and 378,000 shares under cash settled swaps, neither of which carries a current vote.
The stake as disclosed column carries each holder's own figure, computed in its own schedule against the share count in force at that schedule's event date, which accounts for the gap of up to 0.13 points against the economic stake column; the combined total is 27.68% either way. The Vanguard line is the weakest disclosure in the table. It rests on a Schedule 13G/A filed 13 February 2024 reporting a December 2023 position, and Vanguard has since reorganised: The Vanguard Group filed an exit amendment on 26 March 2026 reporting no shares, and Vanguard Capital Management LLC filed a new Schedule 13G on 29 April 2026 reporting 95,598,528 shares, 7.51 percent, at 31 March 2026. Both events fall after the record date and neither is reflected in the proxy table.

Breadth and concentration moved in opposite directions. Institutional managers reporting CVS common stock rose from 1,849 for the September 2025 quarter to 2,081 for the June 2026 quarter, 232 more filers or 12.5%, while the five largest managers with a complete series cut their combined holding by 9,730,300 shares, 2.8%, from 348.5 million to 338.8 million. Counts exclude amended filings; 38 managers amended their June 2026 quarter report.
Table 6.2 Institutional positions by quarter, shares held and stake in the shares outstanding
| Manager | Q3 2025 shares (m) | Q3 2025 stake | Q4 2025 shares (m) | Q4 2025 stake | Q1 2026 shares (m) | Q1 2026 stake | Q2 2026 shares (m) | Q2 2026 stake |
|---|---|---|---|---|---|---|---|---|
| Vanguard complex | 119.0 | 9.38% | 120.9 | 9.50% | 122.0 | 9.56% | 123.6 | 9.67% |
| BlackRock, Inc. | 119.8 | 9.44% | 121.0 | 9.51% | n/a | n/a | 123.2 | 9.63% |
| Capital World Investors | 68.4 | 5.39% | 67.7 | 5.32% | 77.2 | 6.05% | 75.0 | 5.86% |
| State Street Corporation | 58.9 | 4.64% | 60.2 | 4.73% | 59.3 | 4.65% | 60.3 | 4.71% |
| Dodge & Cox | 73.2 | 5.76% | 62.5 | 4.91% | 51.8 | 4.06% | 50.0 | 3.91% |
| Geode Capital Management | 29.0 | 2.28% | 29.0 | 2.28% | 29.5 | 2.31% | 29.9 | 2.34% |
| Glenview Capital Management | 8.2 | 0.65% | 8.2 | 0.64% | 8.2 | 0.64% | 4.8 | 0.38% |
| Five manager panel, complete series | 348.5 | 27.46% | 340.3 | 26.75% | 339.8 | 26.63% | 338.8 | 26.49% |
| Memo: shares outstanding at the cover date (m) | 1,269.4 | n/a | 1,272.2 | n/a | 1,275.9 | n/a | 1,279.0 | n/a |
BlackRock's stake for the March 2026 quarter reads n/a. BlackRock files one consolidated Form 13F of roughly fourteen megabytes, and three retrieval attempts for that quarter ended the data session before the payload finished. The three quarters that did return show a position moving steadily higher, from 119.8 million to 123.2 million shares, so the missing cell sits inside a rising trend. Dodge & Cox is the mirror image and the one genuine seller among the large holders: 73.2 million shares in September 2025 down to 50.0 million in June 2026, a cut of 31.7% that took it back below five percent and produced the 13 August 2026 amendment.

Voting authority varies across holders of the single share class. Form 13F splits each stake into shares the manager votes itself and shares it does not. Vanguard votes 10.5% of a 123.6 million share position on its sole authority, leaving 110,650,316 shares directed elsewhere, and State Street votes 11.8% of its 60.3 million shares. BlackRock is the opposite, voting 92.2% of its stake itself, and the active managers vote almost everything they hold. Read on votes rather than shares, BlackRock is the single largest voice on the register.
Table 6.3 Schedule 13D and 13G filings naming CVS Health, September 2024 to September 2026
| Filed | Form | Amendment | Filer | Event date | Shares | Stake | Accession | Note |
|---|---|---|---|---|---|---|---|---|
| 2024-10-24 | SC 13G/A | n/a | BlackRock, Inc. | 2024-09-30 | 104,561,659 | 8.30% | 0002012383-24-002307 | Sole voting power over 93,976,550 shares. |
| 2024-11-13 | SC 13G | n/a | Dodge & Cox | 2024-09-30 | 63,030,690 | 5.01% | 0001193125-24-256941 | First crossing of five percent. Share count as restated in the 2026 proxy. |
| 2025-04-17 | SC 13G/A | 13 | BlackRock, Inc. | 2025-03-31 | 89,218,268 | 7.10% | 0001576419-25-000710 | Position cut by 15.3 million shares against the prior amendment. |
| 2025-05-13 | SC 13G | n/a | Capital World Investors | 2025-03-31 | 68,785,990 | 5.50% | 0001422848-25-000113 | First crossing of five percent. Sole voting power over 68,208,572 shares. |
| 2025-07-16 | SC 13G/A | 14 | BlackRock, Inc. | 2025-06-30 | 105,292,588 | 8.30% | 0002052113-25-002537 | Position rebuilt to the 2024 level. Latest BlackRock schedule on file. |
| 2026-03-26 | SC 13G/A | 10 | The Vanguard Group, Inc. | 2026-03-13 | 0 | 0.00% | 0000102909-26-001096 | Exit filing on the group reorganisation. Holdings moved to registered affiliates. |
| 2026-04-29 | SC 13G | n/a | Vanguard Capital Management LLC | 2026-03-31 | 95,598,528 | 7.51% | 0002100119-26-000439 | Successor filer. Sole voting power over 12,948,452 shares. |
| 2026-08-13 | SC 13G/A | 1 | Dodge & Cox | 2026-06-30 | 50,012,765 | 3.90% | 0001193125-26-349359 | Fell below five percent. |
Eight filings, no Schedule 13D, no group formation and no stated intent to influence control, and every filer certified the shares were acquired in the ordinary course of business. The window covers a full turnover of the five percent register: Dodge & Cox and Capital World Investors each crossed above five percent for the first time, Dodge & Cox then fell back below it, and Vanguard's reporting entity changed identity without the position changing hands.
The 2026 annual meeting
The meeting was held on 14 May 2026. Holders of 1,142,802,406 shares were present in person or by proxy, 89.17% of the shares outstanding at the record date, against a quorum requirement of a simple majority. Directors are elected by a majority of the votes cast, where abstentions and broker nonvotes are not votes cast. Every other item needs a majority of the shares present and entitled to vote, where an abstention has the effect of a vote against and a broker nonvote has none, so the support percentages below are struck on each item's own base. Brokers may vote uninstructed shares on the auditor ratification only, which is why that item alone carries no broker nonvotes; broker nonvotes ran to 104,083,932 shares, 9.11% of the shares present, on every other item.
Table 6.4 2026 annual meeting, election of directors (Item 1)
| Nominee | For | Against | Abstained | Broker nonvotes | Support, votes cast |
|---|---|---|---|---|---|
| Fernando Aguirre | 1,022,555,114 | 14,973,034 | 1,190,326 | 104,083,932 | 98.56% |
| Jeffrey R. Balser | 1,027,705,454 | 9,787,711 | 1,225,309 | 104,083,932 | 99.06% |
| C. David Brown II | 963,381,905 | 74,082,639 | 1,253,930 | 104,083,932 | 92.86% |
| Alecia A. DeCoudreaux | 996,234,731 | 41,326,102 | 1,157,641 | 104,083,932 | 96.02% |
| Anne M. Finucane | 1,010,527,586 | 27,032,194 | 1,158,694 | 104,083,932 | 97.39% |
| John E. Gallina | 1,024,886,453 | 12,566,628 | 1,265,393 | 104,083,932 | 98.79% |
| J. David Joyner | 968,110,706 | 66,554,762 | 4,053,006 | 104,083,932 | 93.57% |
| J. Scott Kirby | 995,832,249 | 41,667,652 | 1,218,573 | 104,083,932 | 95.98% |
| Michael F. Mahoney | 940,279,615 | 96,450,126 | 1,988,733 | 104,083,932 | 90.70% |
| Leslie V. Norwalk | 1,021,952,646 | 15,580,839 | 1,184,989 | 104,083,932 | 98.50% |
| Larry M. Robbins | 1,026,332,859 | 11,150,192 | 1,235,423 | 104,083,932 | 98.93% |
| Guy P. Sansone | 995,433,957 | 42,056,031 | 1,228,486 | 104,083,932 | 95.95% |
| Douglas H. Shulman | 1,020,665,806 | 16,793,215 | 1,259,453 | 104,083,932 | 98.38% |
Table 6.5 2026 annual meeting, company and stockholder proposals
| Item | Proposal | Proponent | Board | For | Against | Abstained | Broker nonvotes | Support | Outcome |
|---|---|---|---|---|---|---|---|---|---|
| 2 | Ratify Ernst & Young LLP as independent registered public accounting firm | Company | For | 1,117,411,640 | 24,102,167 | 1,288,599 | None | 97.78% | Approved |
| 3 | Advisory vote on named executive officer compensation | Company | For | 976,252,194 | 59,088,923 | 3,377,357 | 104,083,932 | 93.99% | Approved |
| 4 | Approve the 2026 Incentive Compensation Plan | Company | For | 1,006,709,390 | 28,851,289 | 3,157,795 | 104,083,932 | 96.92% | Approved |
| 5 | Reduce the written consent record date threshold from 25 percent to 10 percent | John Chevedden | Against | 417,969,177 | 617,361,014 | 3,388,283 | 104,083,932 | 40.24% | Not approved |
All thirteen nominees were elected. Support ranged from 90.70% for Michael F. Mahoney to 99.06% for Jeffrey R. Balser, against a low of 91.50% for C. David Brown II in 2025. The chief executive, J. David Joyner, drew 93.57% against 99.07% a year earlier, a fall of (5.51) points and the largest on the board. Mahoney and Brown attract the most opposition, and Brown chairs the committee that owns executive pay, which is where the 2025 say on pay result landed.

Say on pay moved further than any other item on the ballot. Support of 59.0% in 2025 was weak enough that the proxy devotes a committee letter to it: management contacted holders of about 60% of the shares, met holders of about 48%, and the compensation committee chair joined meetings covering about 35%. Support came back to 94.0%.
The stockholder side produced one vote out of three submissions. CVS received three proposals, negotiated one withdrawal, excluded one under SEC guidance and put one to a vote. That one, from John Chevedden, asked the board to cut the written consent record date threshold from 25 percent to 10 percent. It drew 40.2% against a board recommendation to vote against, down from 42.5% on a near identical proposal in 2025 and the third defeat for the idea after 2021. The board answered on arithmetic: four holders can already reach 25 percent, and ten percent would put the right in the hands of as few as two. The four holders above five percent hold 27.68% of the shares outstanding between them at the record date.
7 Insider Activity
CVS insiders sold 3,441,551 shares into the market in the twelve months to 31 August 2026, worth $323,701,515, and bought none. The buy to sell ratio is 0.00, computed on open market transactions only, Form 4 codes P and S, excluding grants, vesting, tax withholding and disposals to the issuer. Every open market share moved inside a fourteen day stretch of May 2026, and the other eleven months carry no market trade at all.
The selling is concentrated in two reporting persons. The Glenview investment funds account for 3,372,000 of the 3,441,551 shares, 98%, an indirect holding reported by director Larry M. Robbins, who disclaims beneficial ownership beyond his pecuniary interest. The balance, 69,551 shares, is a single sale by one executive officer, and eight of the nine executive officers who filed in the window sold nothing on the market.
Open market against plan and award driven activity
The window carries 51 common stock transactions. Eight are open market sales; the other 43 are plan or award driven, being annual equity awards, the semi annual director retainer paid in stock, shares withheld by CVS to settle tax on vesting, and disposals to the issuer under Rule 16b-3(e).
Of 3,781,242 shares of gross movement across all Form 4 common stock lines, 339,691 never touched the market, or 9%, and the Glenview block dominates that measure. Excluding it, gross movement is 409,242 shares and 83% never touched the market: 237,335 shares issued as awards and retainer stock, 70,356 shares withheld for tax at a weighted average $79.20, and 32,000 shares returned to the issuer. Add the derivative side, 768,260 shares under option and 17,205.7 deferred stock units, and the nonmarket share of everything reported outside the Glenview block rises to 94%.


Table 7.1 Insider activity by category, transaction dates 1 September 2025 to 31 August 2026
| Category | Shares or units | Weighted average price ($) | Value ($) | Detail |
|---|---|---|---|---|
| Open market purchases (code P) | 0 | n/a | 0 | None disclosed with a transaction date in the window |
| Open market sales (code S) | 3,441,551 | 94.06 | 323,701,515 | Two reporting persons, all sales in May 2026 |
| Open market sales, the Glenview funds block | 3,372,000 | 94.15 | 317,471,136 | Indirect holding reported by a director, 19 to 21 May 2026 |
| Open market sales, an executive officer | 69,551 | 89.58 | 6,230,379 | One sale on 8 May 2026 |
| Awards, restricted stock and retainer stock (code A) | 237,335 | n/a | n/a | Annual officer grant on 31 March 2026 and two director retainers |
| Shares withheld to pay tax on vesting (code F) | 70,356 | 79.20 | 5,571,983 | Seventeen withholdings across ten reporting persons |
| Shares disposed to CVS under Rule 16b-3(e) (code D) | 32,000 | 93.76 | 3,000,372 | One director, 20 and 21 May 2026 |
| Deferred stock units granted | 17,205.7 | n/a | n/a | Directors deferring the semi annual retainer |
| Stock options granted | 768,260 | 71.82 | n/a | Eight officers, exercise price $71.82, first tranche vests 31 March 2027 |
| Cash settled swaps closed | 378,000 | 93.31 | n/a | Reference shares, no common stock moved |
Weighted average prices are share weighted.
The sales
Tilak Mandadi, EVP, Chief Experience and Technology Officer, sold 69,551 shares on 8 May 2026 at $89.58, in a stated range of $89.30 to $89.81, leaving 10,133 shares held directly, weeks after the 31 March annual award of 22,277 restricted stock units.
The Glenview funds sold 3,372,000 shares across seven trades on 19, 20 and 21 May 2026, at a weighted average of $94.15 in stated ranges running from $93.125 to $96.34, cutting the position from 8,196,799 shares to 4,824,799, 41% in three days. The Form 3 of 25 November 2024 reported 11,946,799 shares, and sales of 3,750,000 shares on 2, 5 and 6 May 2025 at prices between $66.67 and $69.66 bridge the two, so across eighteen months the funds sold 7,122,000 shares, 60% of the position first reported, into a rising price. A cash settled swap over 378,000 reference shares, held since 16 August 2024, was closed on 21 May 2026 at $93.311, and no common stock moved on that line. No Form 4 filed in the window carries the Rule 10b5-1 affirmative defence flag, and no Form 144 was filed by a CVS insider.
Purchases
No insider bought CVS stock on the market with a transaction date inside the twelve months. The only code P transactions disclosed are 104 shares across four trades reported late and dated before the window: 80 shares for Heidi B. Capozzi between 9 September 2024 and 23 October 2024 at $56.47, $62.24 and $56.85, and 24 for Steven H. Nelson on 23 January 2025 at $53.70. Both Forms 4 state the shares were bought by a broker exercising discretion over a managed account held in trust and were omitted from earlier filings through broker error.
Awards, vesting and withholding
The annual officer award landed on 31 March 2026 at a reference price of $71.82 for every recipient: nine officers took 214,698 restricted stock units and eight took 768,260 shares under option at that exercise price, the first third exercisable on 31 March 2027 and the last expiring 31 March 2036. J. David Joyner, President, CEO and Chair, took the largest share award at 86,326 units and no option; Brian Newman, EVP, Chief Financial Officer, took 19,493 units and 125,748 shares under option.
Vesting drives the disposals. Seventeen withholdings across ten reporting persons removed 70,356 shares at prices from $72.49 to $90.98, none of which reached the market: CVS retains the shares and remits the cash tax. Two further withholdings, 12,834 shares from Tilak Mandadi and 6,995 from Prem S. Shah, both dated 31 August 2025 at $73.15, sit one day outside the window and are filed inside it. Director pay runs through the same channel, the semi annual retainer settled in stock at $76.04 on 20 November 2025 and $97.15 on 14 May 2026 and pro rata at $71.86 on 19 March 2026, with six directors taking the May retainer in common stock and six deferring it into stock units.
Forms 3
One Form 3 was filed by a new appointee. John E. Gallina joined the board on 19 March 2026 holding no CVS securities, took the pro rata retainer of 582 shares the next day, and deferred the May retainer into 1,447.5039 stock units. No new executive officer filed a Form 3 in the window; the two most recent officer Forms 3, Brian Newman on 21 May 2025 and Amy Compton-Phillips on 27 May 2025, precede it. Two Form 3/A amendments were filed inside the window, both adding small trust holdings a broker had omitted.
Table 7.2 Forms 3 and 3/A filed by CVS insiders, 1 September 2025 to 3 September 2026
| Filed | Reporting person | Role | Form | Event date | Shares reported | Detail |
|---|---|---|---|---|---|---|
| 14 Oct 2025 | Heidi B. Capozzi | EVP and Chief People Officer | 3/A | 9 Sep 2024 | 5 | Amends the 19 September 2024 Form 3 to add 5 shares held in a spousal trust. |
| 7 Nov 2025 | Amy Compton-Phillips | EVP, Chief Medical Officer | 3/A | 19 May 2025 | 35 | Amends the 27 May 2025 Form 3 to add 35 shares held in a living trust. |
| 19 Mar 2026 | John E. Gallina | Director | 3 | 19 Mar 2026 | 0 | New director. No CVS securities held on appointment. |
A filing to read with care
The Form 4 filed for Fernando Aguirre on 22 May 2026, accession 0000064803-26-000084, reports two lines coded D, a disposition to the issuer under Rule 16b-3(e), for 30,437 shares on 20 May and 1,563 on 21 May. The reported holding falls from 42,513 to 12,076 to 10,513, consistent with the coding, but the footnotes describe the prices as a weighted average purchase price and the second footnote states 93.775 against a price field of 93.501 on the same line. The figures above use the coded transactions as filed, with no adjustment, and treat the 32,000 shares as a disposal that did not pass through the market. If those lines were instead market sales, open market disposals would rise to 3,473,551 shares and the nonmarket share of movement excluding the Glenview block would fall from 83% to 75%. The buy to sell ratio stays at 0.00 either way.
The full ledger
Table 7.3 Every transaction reported by a CVS insider on Forms 4 with a transaction date between 1 September 2025 and 31 August 2026, 70 lines across Table I and Table II. Code A is a grant or award, F a share withheld to pay tax on vesting, D a disposition to the issuer under Rule 16b-3(e), S a sale. Shares in parentheses left the reporting person.
| Date | Insider | Role | Code | Nature | Security | Shares | Price ($) | Holding after |
|---|---|---|---|---|---|---|---|---|
| 20 Nov 2025 | Fernando Aguirre | Director | A | Plan or award | Common stock | 1,800 | 76.04 | 40,950 |
| 20 Nov 2025 | Jeffrey R. Balser | Director | A | Plan or award | Common stock | 1,775 | 76.04 | 13,659 |
| 20 Nov 2025 | C. David Brown II | Director | A | Plan or award | Common stock | 1,775 | 76.04 | 127,772 |
| 20 Nov 2025 | Alecia A. DeCoudreaux | Director | A | Plan or award | Deferred stock unit | 1,652.0910 | 76.04 | 40,053.5157 |
| 20 Nov 2025 | Anne M. Finucane | Director | A | Plan or award | Common stock | 591 | 76.04 | 591 |
| 20 Nov 2025 | Anne M. Finucane | Director | A | Plan or award | Deferred stock unit | 1,775.3814 | 76.04 | 16,530.0615 |
| 20 Nov 2025 | J. Scott Kirby | Director | A | Plan or award | Common stock | 1,652 | 76.04 | 12,987 |
| 20 Nov 2025 | Michael F. Mahoney | Director | A | Plan or award | Deferred stock unit | 2,021.9621 | 76.04 | 4,613.3964 |
| 20 Nov 2025 | Leslie V. Norwalk | Director | A | Plan or award | Common stock | 1,652 | 76.04 | 5,929 |
| 20 Nov 2025 | Larry M. Robbins | Director | A | Plan or award | Deferred stock unit | 2,202.7880 | 76.04 | 8,080.2915 |
| 20 Nov 2025 | Guy P. Sansone | Director | A | Plan or award | Common stock | 1,652 | 76.04 | 13,659.3550 |
| 20 Nov 2025 | Douglas H. Shulman | Director | A | Plan or award | Common stock | 1,652 | 76.04 | 5,929 |
| 30 Nov 2025 | Heidi B. Capozzi | EVP and Chief People Officer | F | Plan or award | Common stock | (9,470) | 80.36 | 11,415 |
| 30 Nov 2025 | Roger N. Farah | Director | F | Plan or award | Common stock | (9,748) | 80.36 | 19,438.4534 |
| 30 Nov 2025 | Tilak Mandadi | EVP, Chief Experience and Technology Officer | F | Plan or award | Common stock | (6,575) | 80.36 | 74,085 |
| 1 Dec 2025 | James D. Clark | SVP, Controller and Chief Accounting Officer | F | Plan or award | Restricted stock or RSU | (220) | 79.10 | 24,401 |
| 1 Jan 2026 | Prem S. Shah | EVP and Group President | F | Plan or award | Common stock | (247) | 80.13 | 61,509.3235 |
| 28 Feb 2026 | J. David Joyner | President, CEO and Chair | F | Plan or award | Common stock | (1,944) | 79.90 | 49,996 |
| 28 Feb 2026 | Samrat S. Khichi | EVP, Chief Policy Officer and General Counsel | F | Plan or award | Common stock | (7,886) | 79.60 | 29,775 |
| 19 Mar 2026 | John E. Gallina | Director | A | Plan or award | Common stock | 582 | 71.86 | 582 |
| 31 Mar 2026 | Heidi B. Capozzi | EVP and Chief People Officer | A | Plan or award | Restricted stock or RSU | 10,025 | 71.82 | 84,450 |
| 31 Mar 2026 | Heidi B. Capozzi | EVP and Chief People Officer | A | Plan or award | Stock option | 64,670 | 71.82 | 64,670 |
| 31 Mar 2026 | James D. Clark | SVP, Controller and Chief Accounting Officer | A | Plan or award | Restricted stock or RSU | 11,138 | 71.82 | 35,539 |
| 31 Mar 2026 | James D. Clark | SVP, Controller and Chief Accounting Officer | A | Plan or award | Stock option | 11,976 | 71.82 | 11,976 |
| 31 Mar 2026 | Amy Compton-Phillips | EVP, Chief Medical Officer | A | Plan or award | Restricted stock or RSU | 5,569 | 71.82 | 58,660 |
| 31 Mar 2026 | Amy Compton-Phillips | EVP, Chief Medical Officer | A | Plan or award | Stock option | 35,928 | 71.82 | 35,928 |
| 31 Mar 2026 | J. David Joyner | President, CEO and Chair | A | Plan or award | Restricted stock or RSU | 86,326 | 71.82 | 160,860 |
| 31 Mar 2026 | Samrat S. Khichi | EVP, Chief Policy Officer and General Counsel | A | Plan or award | Restricted stock or RSU | 12,531 | 71.82 | 38,139 |
| 31 Mar 2026 | Samrat S. Khichi | EVP, Chief Policy Officer and General Counsel | A | Plan or award | Stock option | 80,838 | 71.82 | 80,838 |
| 31 Mar 2026 | Tilak Mandadi | EVP, Chief Experience and Technology Officer | A | Plan or award | Restricted stock or RSU | 22,277 | 71.82 | 88,543 |
| 31 Mar 2026 | Tilak Mandadi | EVP, Chief Experience and Technology Officer | A | Plan or award | Stock option | 143,712 | 71.82 | 143,712 |
| 31 Mar 2026 | Steven H. Nelson | EVP and President, Aetna | A | Plan or award | Restricted stock or RSU | 22,277 | 71.82 | 43,606 |
| 31 Mar 2026 | Steven H. Nelson | EVP and President, Aetna | A | Plan or award | Stock option | 143,712 | 71.82 | 143,712 |
| 31 Mar 2026 | Brian Newman | EVP, Chief Financial Officer | A | Plan or award | Restricted stock or RSU | 19,493 | 71.82 | 41,354 |
| 31 Mar 2026 | Brian Newman | EVP, Chief Financial Officer | A | Plan or award | Stock option | 125,748 | 71.82 | 125,748 |
| 31 Mar 2026 | Prem S. Shah | EVP and Group President | A | Plan or award | Restricted stock or RSU | 25,062 | 71.82 | 62,852 |
| 31 Mar 2026 | Prem S. Shah | EVP and Group President | A | Plan or award | Stock option | 161,676 | 71.82 | 161,676 |
| 1 Apr 2026 | Heidi B. Capozzi | EVP and Chief People Officer | F | Plan or award | Common stock | (1,334) | 72.49 | 13,023 |
| 1 Apr 2026 | James D. Clark | SVP, Controller and Chief Accounting Officer | F | Plan or award | Common stock | (3,262) | 72.49 | 15,457 |
| 1 Apr 2026 | J. David Joyner | President, CEO and Chair | F | Plan or award | Common stock | (8,029) | 72.49 | 70,349 |
| 1 Apr 2026 | Samrat S. Khichi | EVP, Chief Policy Officer and General Counsel | F | Plan or award | Common stock | (3,541) | 72.49 | 33,421 |
| 1 Apr 2026 | Tilak Mandadi | EVP, Chief Experience and Technology Officer | F | Plan or award | Common stock | (3,634) | 72.49 | 79,684 |
| 1 Apr 2026 | Steven H. Nelson | EVP and President, Aetna | F | Plan or award | Common stock | (2,432) | 72.49 | 2,900 |
| 1 Apr 2026 | Prem S. Shah | EVP and Group President | F | Plan or award | Common stock | (1,484) | 72.49 | 64,356.0985 |
| 8 May 2026 | Tilak Mandadi | EVP, Chief Experience and Technology Officer | S | Open market | Common stock | (69,551) | 89.58 | 10,133 |
| 14 May 2026 | Fernando Aguirre | Director | A | Plan or award | Common stock | 1,563 | 97.15 | 42,513 |
| 14 May 2026 | Jeffrey R. Balser | Director | A | Plan or award | Common stock | 2,058 | 97.15 | 15,717 |
| 14 May 2026 | C. David Brown II | Director | A | Plan or award | Common stock | 1,544 | 97.15 | 129,316 |
| 14 May 2026 | Alecia A. DeCoudreaux | Director | A | Plan or award | Deferred stock unit | 1,447.5039 | 97.15 | 42,181.8314 |
| 14 May 2026 | Anne M. Finucane | Director | A | Plan or award | Deferred stock unit | 1,544.0041 | 97.15 | 18,355.0364 |
| 14 May 2026 | John E. Gallina | Director | A | Plan or award | Deferred stock unit | 1,447.5039 | 97.15 | 1,447.5039 |
| 14 May 2026 | J. Scott Kirby | Director | A | Plan or award | Common stock | 1,447 | 97.15 | 14,434 |
| 14 May 2026 | Michael F. Mahoney | Director | A | Plan or award | Deferred stock unit | 1,737.0046 | 97.15 | 6,428.8174 |
| 14 May 2026 | Leslie V. Norwalk | Director | A | Plan or award | Common stock | 1,447 | 97.15 | 7,376 |
| 14 May 2026 | Larry M. Robbins | Director | A | Plan or award | Deferred stock unit | 1,930.0051 | 97.15 | 10,147.6418 |
| 14 May 2026 | Guy P. Sansone | Director | A | Plan or award | Common stock | 1,447 | 97.15 | 15,106.3550 |
| 14 May 2026 | Douglas H. Shulman | Director | A | Plan or award | Deferred stock unit | 1,447.5039 | 97.15 | 1,447.5039 |
| 19 May 2026 | Larry M. Robbins | Director | S | Open market | Common stock | (1,983,387) | 94.448 | 6,213,412 |
| 19 May 2026 | Larry M. Robbins | Director | S | Open market | Common stock | (151) | 95.18 | 6,213,261 |
| 20 May 2026 | Fernando Aguirre | Director | D | Plan or award | Common stock | (30,437) | 93.775 | 12,076 |
| 20 May 2026 | Larry M. Robbins | Director | S | Open market | Common stock | (797,628) | 93.4766 | 5,415,633 |
| 20 May 2026 | Larry M. Robbins | Director | S | Open market | Common stock | (152,691) | 94.8061 | 5,262,942 |
| 20 May 2026 | Larry M. Robbins | Director | S | Open market | Common stock | (66,881) | 95.6655 | 5,196,061 |
| 20 May 2026 | Larry M. Robbins | Director | S | Open market | Common stock | (800) | 96.2819 | 5,195,261 |
| 21 May 2026 | Fernando Aguirre | Director | D | Plan or award | Common stock | (1,563) | 93.501 | 10,513 |
| 21 May 2026 | Larry M. Robbins | Director | S | Open market | Common stock | (370,462) | 93.4482 | 4,824,799 |
| 21 May 2026 | Larry M. Robbins | Director | S | Derivative close out | Cash settled swap | (378,000) | 93.311 | 0 |
| 31 May 2026 | Amy Compton-Phillips | EVP, Chief Medical Officer | F | Plan or award | Common stock | (7,618) | 90.98 | 9,557 |
| 31 May 2026 | Brian Newman | EVP, Chief Financial Officer | F | Plan or award | Common stock | (2,478) | 90.98 | 3,008 |
| 26 Jun 2026 | James D. Clark | SVP, Controller and Chief Accounting Officer | F | Plan or award | Restricted stock or RSU | (454) | 90.98 | 27,606 |
8 Risk Factors
CVS Health added no risk factor and dropped seven. The FY2025 10-K carries 40 risk factors against 47 in the FY2024 10-K, under five category headings instead of six, and Item 1A fell to 18,678 words from 21,368, a cut of (2,690) words or (12.6)%. Twenty six factors were reworded and 14 are unchanged. The direction of travel is subtraction, and most of what went was quantified: the goodwill carrying amount, the Insured share of Health Care Benefits revenue, the prescription drug plan star rating, the guaranty fund charge example and a named Department of Justice investigation into Medicare risk adjustment chart reviews all left Item 1A. What came in is policy: state legislation that would bar a PBM from owning a pharmacy, a universal Medicare Advantage audit programme, Medicaid financing cuts under the Working Families Tax Cut Act, direct to consumer drug sales by manufacturers, and 340B. Both 2026 10-Q filings state that there have been no material changes to those risk factors, so Item 1A has not moved since 10 February 2026.

The mergers, acquisitions and divestitures category disappears entirely, taking (995) words with it, with the integration risk folded into the acquisitions factor and the acquisitions factor moved into Business. Operations lost (801) words across two mergers and heavy cuts to broker marketing and data governance. Manufacturers and providers lost (541) words, and that block is the one place where disclosure was withdrawn with nothing put back: the supplier failure factor and the out of network provider cost factor are both gone with no replacement language anywhere in Item 1A. Public policy and regulatory is almost flat at (63) words, but the composition inside it changed more than any other category.

Public Exchange goes from 22 mentions to none and COVID-19 from 9 to none. Oak Street Health halves to 6 and Signify Health falls to 2 as the named subsidiary sub risk lists come out. AI rises to 9 from 1 and enters a risk factor heading for the first time. PBM rises to 36 from 33 and Medicaid to 44 from 42, the only two terms in the set that gained.
The change map
Table 8.1 Item 1A risk factor change map, FY2025 10-K against FY2024 10-K
| # | Risk | Status | What changed |
|---|---|---|---|
| Business | |||
| 1 | Forecasting health care and benefit costs | Reworded | The whole COVID-19 paragraph and the influenza season history are cut, and the statement that Insured products were 94 percent of Health Care Benefits segment revenue is removed. |
| 2 | Adverse economic conditions | Reworded | Drops the long term care pharmacy customer solvency clause and the sale leaseback financing clause. |
| 3 | Competition across the three segments | Reworded | Adds direct to consumer prescription drug sales by manufacturers bypassing pharmacies and PBMs, and adds Medicaid rate adequacy as a driver of Health Care Benefits results. |
| 4 | Health Care Benefits product mix | Reworded | Adds that a shift in product mix may introduce volatility in cash flows. |
| 5 | Health Care Delivery businesses | Reworded | The named Signify Health and Oak Street Health sub risk lists, including CMS Innovation Center models such as ACO REACH and the MSSP, are deleted; exposure to changes in United States immigration policy is added. |
| 6 | Negative public perception | Unchanged | |
| 7 | Retail and specialty pharmacy customer relationships | Unchanged | |
| 8 | Prescription drug availability, pricing and safety | Unchanged | |
| 9 | Claim reserves and premium deficiency reserves | Reworded | The 2024 example of about $1.1bn of premium deficiency reserves is replaced by a $448m first quarter 2025 individual exchange reserve and a $471m second quarter 2025 Group Medicare Advantage reserve; the statement that no reserve was held at 31 December 2024 and none was set in 2023 or 2022 is deleted. |
| 10 | Extreme events | Reworded | The physical and transition climate risk paragraph is deleted; the crisis management, disaster recovery and insurance adequacy language from the dropped business continuity factor is folded in. |
| 11 | Corporate responsibility and sustainability goals | Unchanged | |
| 12 | Acquisitions, joint ventures and divestitures | Reworded | Absorbs the dropped integration factor, so post closing integration of products, services, assets and internal controls now sits inside this factor; the competition for targets and the forced divestiture clauses are deleted. The factor also moves out of its own category into Business. |
| Public Exchange competition and profitability | Dropped | Removed outright. The FY2025 10-K states in Item 1 that the Company exited the states in which Aetna operated on the Public Exchanges effective January 2026. | |
| Solvency of other insurers | Dropped | Merged into the compliance factor as state guaranty fund assessments. The Penn Treaty example of a $231m pretax charge is not carried over. | |
| Public policy and regulatory | |||
| 13 | Changes in public policy and health reform | Reworded | Adds state legislation prohibiting pharmacy licensure for pharmacies affiliated with a PBM, and adds 340B program changes including the resumption and possible expansion of the pilot. |
| 14 | Failure to comply with laws and regulations | Reworded | Absorbs the dropped insurer solvency factor: state guaranty fund assessments for insolvent insurers, HMOs and ACA cooperatives now sit here, without the FY2024 Penn Treaty example of a $231m pretax charge. |
| 15 | Compliance systems and processes | Unchanged | |
| 16 | Litigation and qui tam actions | Unchanged | |
| 17 | Government audits and investigations | Reworded | The named Department of Justice civil investigative demands on patient chart review processes for Medicare Parts C and D risk adjustment submissions are removed. |
| 18 | Vertical integration regulatory risk | Reworded | Rewritten. The expansion into new business areas framing and the Oak Street Health and Signify Health references go; new state legislative activity prohibiting ownership or licensure of a pharmacy affiliated with a PBM comes in. |
| 19 | Medicare and Medicaid regulatory challenges | Reworded | Medicaid financing under the Working Families Tax Cut Act, the May 2025 CMS decision to audit every Medicare Advantage contract every payment year, the 2026 final and 2027 advance rate notices and Oak Street Health rate sensitivity are added; the RADV Audit Rule uncertainty and litigation passage, the Medicaid redetermination passage and the PDP star rating are removed. |
| 20 | Federally funded programs | Reworded | The heading is rewritten from a revenue concentration claim to a funding sensitivity claim, and the sentence that federal programs are a significant and rising share of revenue is deleted. |
| 21 | Drug pricing benchmarks | Reworded | The sentence that Congress may enact some limited form of price negotiation for Medicare is deleted. |
| 22 | Premium rate increases | Reworded | The clause on exclusion from small group public exchanges for a history of unreasonable rate increases is deleted. |
| 23 | Minimum MLR rebates | Unchanged | |
| 24 | Employer laws and union activity | Reworded | Adds proposed changes to the H-1B and other visa programs as a constraint on hiring skilled staff and a driver of employee related costs. |
| 25 | International operations | Reworded | The statement that the international insurance operations were being wound down during 2025 is removed. |
| Mergers and divestitures | |||
| Integration of acquired companies | Dropped | Merged into the acquisitions and divestitures factor. The mergers, acquisitions and divestitures category disappears with it. | |
| Operations | |||
| 26 | Customer expectations | Reworded | The passage on balancing general and administrative cost reduction against customer service is deleted, along with the privacy and security breach example. |
| 27 | Cyberattacks | Reworded | The sentence on large scale breaches at other entities raising the security challenge is deleted; the rest carries over. |
| 28 | Data governance and privacy regulation | Reworded | Condensed by about a quarter. The chain from inadequate disclosure and insecure systems to brand, membership and operating result damage is compressed to a single trust sentence. |
| 29 | Information technology systems and AI | Reworded | Artificial intelligence enters the heading. Absorbs the dropped systems failure factor, so power outages, facility damage, viruses, breaches, cyberattacks and human error now sit here. The legacy system paragraph is deleted. |
| 30 | Product liability and professional liability | Unchanged | |
| 31 | Talent and executive succession | Unchanged | |
| 32 | Distribution, brokers and agents | Reworded | Cut by about two fifths. The whole passage on CMS, congressional and state scrutiny of Medicare broker marketing and on CMS limits to broker compensation is deleted; broker competition from other Medicare carriers is added. |
| 33 | Collaboration across the businesses | Unchanged | |
| 34 | Payment related risks | Unchanged | |
| Information technology systems failure | Dropped | Merged into the information technology and AI factor, whose heading now carries the failure and disruption wording as a second sentence. | |
| Business continuity hazards | Dropped | Merged into the extreme events factor, keeping the crisis management, disaster recovery and insurance adequacy language. | |
| Financial | |||
| 35 | Capital deployment and credit ratings | Reworded | The 2024 downgrade narrative is replaced by the ratings held at 31 December 2025: Moody's Baa3 and P-3 with a stable outlook, S&P BBB and A-2 with a negative outlook, Fitch BBB and F2 with a negative outlook. |
| 36 | Goodwill and intangible asset impairment | Reworded | The carrying amount of goodwill and other intangible assets, $118.6bn at 31 December 2024 against $120.5bn a year earlier, is removed, leaving the factor with no quantified exposure. |
| 37 | Capital market conditions and the investment portfolio | Reworded | The statement that capital and credit markets continue to experience volatility and uncertainty is deleted. |
| Manufacturers and providers | |||
| 38 | Drug market availability and suppliers | Unchanged | |
| 39 | Provider contracting and networks | Unchanged | |
| 40 | Provider and supplier consolidation | Unchanged | |
| Supplier and service provider failure | Dropped | Removed outright. No equivalent language appears anywhere in the FY2025 Item 1A. | |
| Out of network provider services | Dropped | Removed outright. The phrase providers that do not have contracts with us does not appear in the FY2025 Item 1A. |
Table 8.2 Quantified disclosures inside Item 1A, FY2024 10-K against FY2025 10-K
| Disclosure | FY2024 10-K | FY2025 10-K |
|---|---|---|
| Medicare Advantage members in plans rated 4 stars or higher | 88 percent, based on 2024 ratings, for 2025 plans | more than 81 percent of December 2025 membership, for 2026 plans |
| Medicare Advantage members in a 4.5 star plan | not disclosed | more than 63 percent, for 2026 plans |
| Prescription drug plan star rating | 3.5 stars for 2025 | not disclosed |
| Industry Medicare Advantage rate change, latest final notice | 2025 rates, 3.70 percent including a risk score trend of 3.86 percent | 2026 rates, 7.16 percent including a risk score trend of 2.10 percent |
| Industry Medicare Advantage rate change, latest advance notice | 2026 rates, 4.33 percent including a risk score trend of 2.10 percent | 2027 rates, 2.54 percent including a risk score trend of 2.45 percent |
| Premium deficiency reserves cited | about $1.1bn in the third quarter of 2024, Medicare, individual exchange and Medicaid | $448m in the first quarter of 2025, individual exchange, and $471m in the second quarter of 2025, Group Medicare Advantage |
| Goodwill and other intangible assets carrying amount | $118.6bn at 31 December 2024 and $120.5bn at 31 December 2023 | not disclosed |
| Insured products share of Health Care Benefits segment revenue | 94 percent for 2024 | not disclosed |
| Guaranty fund assessment example | $231m pretax, Penn Treaty, first quarter of 2017 | not disclosed |
| Long term debt and commercial paper ratings | Moody's downgrade to Baa3 and P-3 in December 2024, S&P outlook to negative in October 2024, first time Fitch BBB and F2 with a negative outlook | Moody's Baa3 and P-3, stable; S&P BBB and A-2, negative; Fitch BBB and F2, negative, all at 31 December 2025 |
The changes that move the stock
The individual exchange business leaves the risk factors and the company. The Public Exchange competition and profitability factor is deleted, and the term is used 22 times in the FY2024 Item 1A and never in the FY2025 Item 1A. Item 1 of the same filing gives the reason: "The Company exited the states in which Aetna operated on the Public Exchanges effective January 2026." The scale of the exposure retired sits in the reserve factor, which records a premium deficiency reserve of $448m taken in the first quarter of 2025 on that product line. Removing a line that required a nine figure loss reserve within twelve months of its exit takes a volatile drag off Health Care Benefits, takes away the growth option, and removes the disclosure a reader would use to size either.
PBM ownership legislation enters in two places. The vertical integration factor is rewritten around one new sentence: "In addition, there has been some new state legislative activity around prohibiting ownership or licensure of a pharmacy if it is affiliated with a PBM." The same threat is added to the public policy factor as "prohibiting pharmacy licensure for pharmacies affiliated with a PBM". The risk here is structural. Health Services and Pharmacy & Consumer Wellness are built on the PBM sitting next to the retail and specialty pharmacy chain, and a state that bars the combination forces a change in structure. CVS does not quantify how many states have such legislation, does not name them and does not size the affected script volume, so Item 1A flags the risk without letting a reader model it. The FY2025 Item 1A does not use the word transparency at all and names no federal PBM transparency bill, so the disclosure is limited to ownership restrictions, leaving the reporting and pass through regimes moving through Congress unmentioned.
Medicare Advantage rates improved while star ratings fell. The 2026 final notice, disclosed for the first time in this filing, put the expected industry revenue increase at 7.16 percent including a risk score trend of 2.10 percent, against 3.70 percent for 2025, and the 2027 advance notice of 26 January 2026 drops back to 2.54 percent including a 2.45 percent risk score trend, 0.09 percent once the trend is stripped out. Star ratings moved the other way. The FY2024 filing said 88 percent of members were in 2025 plans rated 4 stars or higher. The FY2025 filing says "more than 81% of the Company's Medicare Advantage members were in 2026 Medicare Advantage plans that are rated 4 stars or higher and more than 63% of the Company's Medicare Advantage members were in a 4.5-star plan for 2026". Only plans at 4 stars or higher earn the quality bonus. The two figures are measured on different bases, 2024 ratings against December 2025 membership, so the fall is directional and the exact size cannot be read from the two figures; on the numbers as filed the bonus eligible share dropped by up to 7 points for 2026. The 4.5 star figure is new and cuts the other way, showing more than 63% of members at 4.5 stars, above the four star threshold. The prescription drug plan star rating, 3.5 stars for 2025 in the prior filing, is not disclosed for 2026.

Audit exposure widened from a rule to a programme. The FY2024 filing described the January 2023 RADV Audit Rule, the lack of detail on contract and claim selection, extrapolation of Office of Inspector General audits from payment year 2018 and the litigation over the rule. All of that is deleted, and in its place: "In May 2025, CMS announced it would audit every Medicare Advantage contract each payment year, with an expedited plan to complete audits for payment years 2018 through 2024 by early 2026." Sampling risk becomes certainty of audit across seven payment years at once, and the new factor adds that insufficient CMS rate increases relative to medical cost trend may materially affect Oak Street Health. Item 1A gives no reserve, no exposure range and no expected timing for the audit findings.
Medicaid financing is reset by statute. The new sentence names the Working Families Tax Cut Act of 2025, formerly the One Big Beautiful Bill Act, and states that it "makes changes to Medicaid eligibility rules and financing which will lead to reduced eligibility for Medicaid beneficiaries, particularly expansion populations, and reduced state funding". CVS states the effect as a certainty. The competition factor adds the matching commercial risk, that Medicaid results depend on whether state set rates are actuarially sound. The Medicaid redetermination passage that dominated the FY2024 disclosure is gone, so the membership risk has shifted from post pandemic disenrolment to statutory eligibility and state funding.
Medical cost trend is now evidenced by two reserves. The reserve factor replaces about $1.1bn of premium deficiency reserves taken in the third quarter of 2024 across Medicare, individual exchange and Medicaid with two 2025 charges: $448m in the first quarter on individual exchange and $471m in the second quarter on Group Medicare Advantage, both for anticipated losses on the remainder of the 2025 coverage year. The FY2024 filing stated that no premium deficiency reserve was held at 31 December 2024 and none was set in 2023 or 2022; the FY2025 filing makes no equivalent statement for 31 December 2025, so Item 1A no longer tells a reader whether a deficiency reserve stands at the balance sheet date.
Pharmacy reimbursement pressure is unchanged in substance and narrower in scope. The PBM price compression and spread pricing language carries over word for word, including that marketplace dynamics and regulatory changes have adversely affected the ability to offer plan sponsors pricing that uses a retail differential or spread, "which could adversely affect our future profitability, and we expect these trends to continue". The drug pricing benchmark factor drops one sentence, that Congress may enact some limited form of price negotiation for Medicare. The competition factor adds a new channel threat: "By implementing DTC sales platforms, pharmaceutical companies can advertise, or sell, their own branded drugs directly to patients, bypassing traditional distribution channels and intermediaries, including pharmacies and PBMs." Disintermediation by manufacturers hits both the dispensing margin in Pharmacy & Consumer Wellness and the rebate economics in Health Services, and this is the first year CVS writes it into Item 1A.
A named federal investigation left Item 1A. The government audits factor previously disclosed that CVS had received civil investigative demands from the Civil Division of the Department of Justice over its patient chart review processes for risk adjustment data submissions under Medicare Parts C and D. That sentence is removed. The risk adjustment mechanism is still described as under challenge by the Department of Justice, the Office of Inspector General and CMS, so the category of risk stands. Whether the specific investigation is closed, or simply moved to Item 3 and the legal proceedings note, cannot be determined from Item 1A.
Credit ratings stabilised at the bottom of investment grade. The FY2024 factor narrated the October 2024 S&P outlook change to negative and the December 2024 Moody's downgrade to Baa3 and P-3. The FY2025 factor replaces the narrative with the standing position at 31 December 2025 in Table 8.2. One notch of further downgrade at Moody's takes the long term rating below investment grade, and two of the three agencies still carry a negative outlook.
Opioid and talc exposure is one sentence, unchanged. The product liability factor states that "we are a defendant in hundreds of litigation proceedings relating to opioids and the sale of products containing talc", identical to the prior year, and the litigation and qui tam factor is word for word unchanged. Item 1A carries no case count, no settlement schedule and no accrual for either matter; chapter 5 sets out both.
What was withdrawn and what that costs the reader
Four of the seven dropped factors are merges, and the substance survives in each: insurer solvency became state guaranty fund assessments inside the compliance factor, integration a paragraph inside the acquisitions factor, systems failure the second sentence of the information technology heading, and business continuity the insurance adequacy paragraph inside extreme events. Three do not survive. Public Exchange competition went with the business. Supplier and service provider failure and out of network provider cost were removed with no replacement, and neither the phrase about contractual obligations nor the phrase about providers that do not have contracts with the company appears anywhere in the FY2025 Item 1A.
Five quantified disclosures were withdrawn and not replaced: the $118.6bn carrying amount of goodwill and other intangible assets, which leaves the impairment factor describing the testing method with no figure to test against; the 94 percent Insured share of Health Care Benefits segment revenue; the 3.5 star prescription drug plan rating; the $231m Penn Treaty guaranty fund charge as the worked example of assessment exposure; and the statement of whether a premium deficiency reserve stood at the year end. Climate content halved to 5 mentions from 10, with the physical and transition risk paragraph deleted. Each figure is available elsewhere in the filing or in the financial statements, but Item 1A is a thinner standalone document than it was a year ago.
Two additions widen the cost base. Proposed changes to the H-1B and other visa programs are added to the employer laws factor as a constraint on hiring skilled staff, and changes to United States immigration policy are added to the Health Care Delivery factor, where clinician supply is the binding constraint on opening and staffing centres. Artificial intelligence enters as an operating dependency, appearing in the technology heading and in the body as a source of risk in developing and implementing systems, with no statement about competitors moving faster and no separate AI risk factor.
9 Stock Price, Scenarios & Sensitivity
CVS trades at $97.15, the last trade of 3 September 2026, 14.4 times FY2025 adjusted earnings of $6.75 and 12.1 times the midpoint of the FY2026 guidance range of $7.90 to $8.10; chapter 4 strikes 22.1 times on a stricter core earnings measure that reverses only the impairment and the discrete tax benefit. The stock has risen 119.0% from its December 2024 trough of $44.36 and is 15.9% above where it stood five years ago. The rerating has already priced the first half of the Health Care Benefits margin repair, when the medical benefit ratio fell to 86.0% from 88.6% and segment adjusted operating income rose 65.6% to $5,467m. The open question for the price is whether that ratio holds through a full year and through the 2027 payment year, when a smaller share of Medicare Advantage members sits in plans rated four stars or better.
Three scenarios run to FY2029 from an FY2026 estimated base. The base case implies $117.91 a share, 21.4% above the last trade, or 6.7% a year. The best case implies $174.82 and the worst case $40.59. These are illustrations of a stated set of operating assumptions, not price targets and not a recommendation.
Where the price has been

Table 9.1 Observed valuation, last weekly close of each year over that year's earnings
| Year | Week ended | Closing price | Adjusted earnings a share | Price to adjusted earnings | Reported earnings a share | Price to reported earnings |
|---|---|---|---|---|---|---|
| 2021 | 2021-12-27 | $103.16 | $8.40 | 12.3x | $5.95 | 17.3x |
| 2022 | 2022-12-27 | $93.19 | $8.69 | 10.7x | $3.14 | 29.7x |
| 2023 | 2023-12-26 | $78.96 | $8.74 | 9.0x | $6.47 | 12.2x |
| 2024 | 2024-12-30 | $45.77 | $5.42 | 8.4x | $3.66 | 12.5x |
| 2025 | 2025-12-29 | $80.13 | $6.75 | 11.9x | $1.39 | 57.6x |
The 2021 row is on the basis first published. GAAP diluted EPS for 2021 was later recast to $6.02 under ASU 2018-12 and the 2021 Adjusted EPS of $8.40 was never recast, so the adjusted series is not on one basis across the five years.
The derating and the recovery both track the medical benefit ratio. Revenue rose every year from $292,111m in FY2021 to $402,067m in FY2025, while adjusted earnings a share fell from $8.74 in FY2023 to $5.42 in FY2024 as the benefit ratio jumped 630 basis points to 92.5%, and the multiple compressed at the same time. The scenarios run on adjusted earnings, and the exit multiples are drawn from the adjusted column of Table 9.1.
The drivers the scenarios turn on
Table 9.2 Operating drivers, FY2023 to the six months ended 30 June 2026
| $m unless stated | FY2023 | FY2024 | FY2025 | H1 2025 | H1 2026 |
|---|---|---|---|---|---|
| Health Care Benefits | |||||
| Total revenue | 105,646 | 130,665 | 143,354 | 71,068 | 73,509 |
| Premium revenue | 99,144 | 122,849 | 134,749 | 66,992 | 68,911 |
| Health care costs | 85,504 | 113,659 | 122,949 | 59,377 | 59,271 |
| Medical benefit ratio | 86.2% | 92.5% | 91.2% | 88.6% | 86.0% |
| Adjusted operating income | 5,577 | 307 | 2,939 | 3,301 | 5,467 |
| Medicare Advantage members, thousands | n/a | 4,447 | 4,267 | 4,240 | 4,202 |
| Members in plans rated 4.0 stars or better | n/a | n/a | more than 81% | n/a | n/a |
| Stand alone drug plan members, thousands | n/a | 4,882 | 4,041 | 4,065 | 3,870 |
| Health Services | |||||
| Total revenue | 186,843 | 173,605 | 190,425 | 89,915 | 100,032 |
| Pharmacy claims processed, millions | 2,344.3 | 1,917.6 | 1,900.7 | 933.2 | 937.7 |
| Adjusted operating income | 7,312 | 7,243 | 7,151 | 3,178 | 3,222 |
| Adjusted operating income a claim | $3.12 | $3.78 | $3.76 | $3.41 | $3.44 |
| Pharmacy & Consumer Wellness | |||||
| Total revenue | 116,763 | 124,500 | 139,367 | 65,493 | 65,805 |
| Prescriptions filled, millions | 1,649.1 | 1,715.5 | 1,808.8 | 873.6 | 908.2 |
| Adjusted operating income | 5,963 | 5,774 | 6,040 | 2,651 | 2,672 |
| Adjusted operating income a prescription | $3.62 | $3.37 | $3.34 | $3.03 | $2.94 |
| Group and financing | |||||
| Consolidated revenue | 357,776 | 372,809 | 402,067 | 193,503 | 206,522 |
| Consolidated adjusted operating income | 17,534 | 11,976 | 14,443 | 8,387 | 10,307 |
| Operating income, as reported | 13,743 | 8,516 | 4,660 | n/a | 9,383 |
| Interest expense | 2,658 | 2,958 | 3,119 | n/a | 1,531 |
| Total debt, period end | n/a | 66,270 | 64,570 | n/a | 61,410 |
| Diluted earnings a share, as reported | $6.47 | $3.66 | $1.39 | n/a | $4.61 |
| Adjusted earnings a share | $8.74 | $5.42 | $6.75 | n/a | n/a |
Medicare Advantage membership has fallen 5.5% over the six quarters disclosed, from 4,447 thousand at December 2024 to 4,202 thousand at June 2026, and stand alone drug plan membership 20.7%, from 4,882 thousand to 3,870 thousand. Health Services claim volume fell 18.9% between FY2023 and FY2025 while segment adjusted operating income fell only 2.2%, because income a claim rose from $3.12 to $3.76. Retail pharmacy runs the other way: prescriptions filled rose 9.7% over the same two years while adjusted operating income a prescription fell from $3.62 to $3.34, and to $2.94 in the first half of 2026 against $3.03 a year earlier. In retail, rising volume has come with falling income a prescription.
Three scenarios to FY2029
Table 9.3 Scenario assumptions and outcomes, three years to FY2029
| Best case | Base case | Worst case | |
|---|---|---|---|
| Assumptions, FY2027 to FY2029 | |||
| Health Care Benefits revenue growth a year | 6.0% | 4.0% | 1.5% |
| Medical benefit ratio at FY2029 | 87.0% | 88.0% | 91.5% |
| Health Services revenue growth a year | 6.0% | 4.0% | 1.0% |
| Health Services adjusted operating margin at FY2029 | 3.95% | 3.85% | 3.10% |
| Pharmacy revenue growth a year | 4.5% | 3.0% | 1.0% |
| Pharmacy adjusted operating margin at FY2029 | 4.90% | 4.45% | 3.80% |
| Corporate adjusted operating loss at FY2029 | (2,300) | (2,400) | (2,650) |
| Total debt at FY2029 | 54,000 | 58,000 | 63,000 |
| Average interest rate on total debt | 4.65% | 4.85% | 5.45% |
| Effective tax rate | 25.0% | 25.5% | 26.0% |
| Diluted shares at FY2029, millions | 1,215 | 1,265 | 1,300 |
| Exit multiple on FY2029 adjusted earnings | 12.3x | 10.7x | 8.4x |
| Outcome at FY2029 | |||
| Revenue | 505,342 | 479,096 | 444,352 |
| Revenue growth a year, FY2026 to FY2029 | 5.6% | 3.7% | 1.1% |
| Health Care Benefits adjusted operating income | 9,640 | 7,541 | 1,923 |
| Health Services adjusted operating income | 9,967 | 9,175 | 6,766 |
| Pharmacy adjusted operating income | 7,830 | 6,809 | 5,482 |
| Adjusted operating income | 25,137 | 21,125 | 11,522 |
| Adjusted operating margin | 4.97% | 4.41% | 2.59% |
| Interest expense | 2,511 | 2,813 | 3,434 |
| Adjusted net income | 17,269 | 13,940 | 6,281 |
| Adjusted earnings a share | $14.21 | $11.02 | $4.83 |
| Adjusted earnings growth a year, FY2026 to FY2029 | 21.1% | 11.3% | (15.5%) |
| Implied value a share | $174.82 | $117.91 | $40.59 |
| Against the last trade of $97.15 | 80.0% | 21.4% | (58.2%) |
| Same, a year | 21.6% | 6.7% | (25.2%) |
Every input in the top half of Table 9.3 is a number, so each case can be rebuilt from this chapter alone. The FY2026 starting point is an estimate made here: revenue of $429,400m and adjusted earnings a share of $8.00. Segment revenue and adjusted operating income are rolled forward from the first half of 2026 on FY2025 seasonality, and that roll forward lands 4.0% short of the adjusted operating income the guidance midpoint implies, so segment adjusted operating income carries a calibration factor of 1.040 to reach it. The modelled revenue sits 3.7% above the company's own floor of at least $414,000m, guided on 5 August 2026 alongside adjusted earnings a share of $7.90 to $8.10, against $7.00 to $7.20 issued in December 2025. The implied full year FY2026 medical benefit ratio in that base is 89.2%, against 86.0% in the first half, because the second half carries the Part D cost load; the same gap in FY2025 was 260 basis points.
What the best case needs
The benefit ratio has to hold for a full year. The best case takes the ratio to 87.0% by FY2029, above the 86.0% posted in the first half of 2026 and below the 91.2% posted for FY2025. A full year at 87.0% is a better outcome than any year since FY2023.
Medicare Advantage has to reprice before it regrows. More than 81% of members sat in plans rated 4.0 stars or better on the 2026 ratings, against 88% on the 2025 ratings, and bonus payments follow the rating by one calendar year, so the 2027 payment year carries the lower share. CMS set final 2027 Medicare Advantage rates on 6 April 2026 at an expected average industry revenue increase of 2.48%, excluding risk score trend. That 2.48% sits against a benefit ratio that has run above 91% in two of the last three years. The best case assumes CVS accepts the membership decline from 4,447 thousand to 4,202 thousand as the price of repricing, then grows premiums 6.0% a year on a repaired book.
Health Services has to keep income a claim. Claims processed fell 426.7 million between FY2023 and FY2024 as a large client left, yet segment adjusted operating income fell only $69m, because income a claim rose from $3.12 to $3.78 across that break and held at $3.76 in FY2025. The best case assumes 6.0% revenue growth from drug mix and brand inflation at a 3.95% segment margin, below the 4.2% posted in FY2024.
Retail reimbursement has to stop eroding. Adjusted operating income a prescription has fallen in every period shown, from $3.62 in FY2023 to $2.94 in the first half of 2026, while prescriptions filled rose 4.0% year on year in that half. CVS Pharmacy completed the transition to cost based reimbursement across its commercial, third party discount, Medicare and Medicaid businesses during 2025. The best case assumes that model stops the erosion and returns the segment margin to 4.90%, still below the 5.1% of FY2023.
The debt has to shrink and reprice. Total debt fell from $66,270m at December 2024 to $61,410m at June 2026, yet interest expense rose from $2,958m in FY2024 to $3,119m in FY2025, an average rate of 4.77% on average total debt, as maturities refinanced at higher coupons. Contractual principal of $3,379m matures in 2027 and $5,008m in 2028. The gap between the best case debt path of $54,000m at 4.65% and the worst case of $63,000m at 5.45% is $923m of pretax income in FY2029, or 54 cents a share after tax at the base case tax rate and share count.
Core assumptions and what drives demand
Volume drivers are members and scripts; price drivers are CMS rates, client repricing and retail reimbursement. At 30 June 2026 CVS carried 26,023 thousand medical members, processed 937.7 million pharmacy claims in the half and filled 908.2 million prescriptions, each on a 30 day equivalent basis. Revenue growth in all three scenarios comes from premium rates and drug mix, consistent with the filings: consolidated revenue grew 7.8% in FY2025 while medical membership fell 504 thousand and pharmacy claims fell 0.9%.
The exit multiple is an assumption with no basis in any filing, bounded by the observed history in Table 9.1: 8.4 times adjusted earnings at the FY2024 year end, 12.3 times at the FY2021 year end, median 10.7 times. The worst case uses the observed minimum, the base case the median and the best case the maximum, so no case assumes a multiple CVS has not traded at within the last five years.
Sensitivity
Table 9.4 One way sensitivity on the base case, value a share of $117.91
| Variable moved, one at a time | Base case | Range tested | Low value a share | High value a share | Spread |
|---|---|---|---|---|---|
| Exit multiple on FY2029 adjusted earnings | 10.7x | 9.2x to 12.2x | $101.38 | $134.44 | $33.06 |
| Health Care Benefits medical benefit ratio, FY2029 | 88.0% | 86.5% to 89.5% | $103.13 | $132.69 | $29.56 |
| Health Services adjusted operating margin, FY2029 | 3.85% | 3.50% to 4.20% | $112.66 | $123.17 | $10.51 |
| Pharmacy adjusted operating margin, FY2029 | 4.45% | 4.00% to 4.90% | $113.58 | $122.25 | $8.68 |
| Diluted shares at FY2029 | 1,265 | 1,225 to 1,305 | $114.30 | $121.76 | $7.46 |
| Health Services revenue growth a year | 4.0% | 2.5% to 5.5% | $115.45 | $120.45 | $5.00 |
| Health Care Benefits revenue growth a year | 4.0% | 2.5% to 5.5% | $115.89 | $120.00 | $4.11 |
| Pharmacy revenue growth a year | 3.0% | 1.5% to 4.5% | $116.07 | $119.82 | $3.75 |
| Average interest rate on total debt | 4.85% | 4.35% to 5.35% | $116.09 | $119.74 | $3.65 |
| Effective tax rate | 25.5% | 24.5% to 26.5% | $116.33 | $119.50 | $3.17 |
| Total debt at FY2029 | 58,000 | 53,000 to 63,000 | $116.39 | $119.44 | $3.06 |
Two variables carry the outcome. The exit multiple moves value $33.06 a share across a three turn range, and 150 basis points on the medical benefit ratio moves it $29.56. Everything else combined moves less than either one. Revenue growth barely registers: 300 basis points a year on Health Care Benefits premium growth is worth $4.11, one seventh of what 150 basis points on the benefit ratio is worth.

At an 88.0% benefit ratio the value clears the current price at 9.4 times and above. At 90.0% it takes 11.4 times. At 91.0%, close to the 91.2% CVS reported for FY2025, it takes 12.4 times, the top of the five year observed range, to justify today's price. The base case breaks if the benefit ratio settles back above 89.5%, where the low value of $103.13 in Table 9.4 sits, or if the market prices adjusted earnings below 9.2 times, which it did at both the FY2023 and the FY2024 year end.
What the filings do not say
CVS gives guidance for FY2026 only. No filing carries a revenue, margin, membership or earnings target for FY2027 or beyond, so every figure for FY2027 to FY2029 is an estimate built from the drivers in Table 9.2. CVS discloses no segment adjusted operating income within its guidance, no Medicare Advantage margin and no gross margin a prescription; adjusted operating income a claim and a prescription in Table 9.2 are calculated from disclosed segment income and disclosed volume. The star ratings share is disclosed only as more than 81%, measured on membership at the December before the rating year. The deconsolidation of the Omnicare long term care pharmacies in September 2025 removes that volume from prescriptions filled from the third quarter of 2025, so FY2025 and FY2026 script counts are not on the same basis as FY2023 and FY2024.
Sources
SEC filings retrieved through the SEC-API.io MCP server. CVS Health Corporation, CIK 0000064803.
CVS Health filings
| Document | Period or date | Accession number |
|---|---|---|
| Form 10-K | Year ended 31 December 2025 | 0000064803-26-000010 |
| Form 10-K | Year ended 31 December 2024 | 0000064803-25-000007 |
| Form 10-K | Year ended 31 December 2023 | 0000064803-24-000007 |
| Form 10-Q | Quarter ended 30 June 2026 | 0000064803-26-000098 |
| Form 10-Q | Quarter ended 31 March 2026 | 0000064803-26-000052 |
| Form 10-Q | Quarter ended 30 September 2025 | 0000064803-25-000037 |
| Form 10-Q | Quarter ended 30 June 2025 | 0000064803-25-000024 |
| Form 10-Q | Quarter ended 31 March 2025 | 0000064803-25-000013 |
| Form 10-Q | Quarters of 2024 | 0000064803-24-000016, 0000064803-24-000029, 0000064803-24-000034 |
| Form 8-K, Item 2.02, exhibit 99.1 | 8 February 2023 | 0000064803-23-000008 |
| Form 8-K, Item 2.02, exhibit 99.1 | 12 February 2025 | 0000064803-25-000006 |
| Form 8-K, Item 2.02, exhibit 99.1 | 1 May 2025 | 0000064803-25-000012 |
| Form 8-K, Item 2.02, exhibit 99.1 | 31 July 2025 | 0000064803-25-000023 |
| Form 8-K, Item 8.01, Omnicare Chapter 11 | 22 September 2025 | 0001193125-25-211349 |
| Form 8-K, Item 2.02, exhibit 99.1 | 29 October 2025 | 0000064803-25-000036 |
| Form 8-K, Item 8.01, Chair appointment | 20 November 2025 | 0001193125-25-289805 |
| Form 8-K, Item 7.01, exhibit 99.1, Investor Day | 9 December 2025 | 0000064803-25-000082 |
| Form 8-K, Item 2.02, exhibit 99.1 | 10 February 2026 | 0000064803-26-000009 |
| Form 8-K, Item 5.02, director election | 18 March 2026 | 0000064803-26-000017 |
| Form 8-K, Item 2.02, exhibit 99.1 | 6 May 2026 | 0000064803-26-000051 |
| Form 8-K, Items 5.02 and 5.07, annual meeting | 18 May 2026 | 0000064803-26-000082 |
| Form 8-K, Item 2.02, exhibit 99.1 | 5 August 2026 | 0000064803-26-000097 |
| Form 8-K, Items 5.02, 7.01 and 9.01, board change | 17 August 2026 | 0001193125-26-354096 |
| Form 8-K, Item 5.07, 2025 annual meeting | 20 May 2025 | 0000064803-25-000015 |
| Form S-3ASR, automatic shelf | 22 May 2026 | 0001193125-26-236988 |
| Form DEF 14A | Filed 3 April 2026 | 0001308179-26-000201 |
| Form 4, Fernando Aguirre | Filed 22 May 2026 | 0000064803-26-000084 |
Ownership data comes from the Schedules 13G and 13G/A listed in Table 6.3, from Form 13F-HR filings reporting CUSIP 126650100 for the quarters ended 30 September 2025 to 30 June 2026, and from Forms 3, 4 and 5 filed by CVS insiders. Shares outstanding come from the 10-K and 10-Q cover pages.
Peer filings. Each accession number in Table 4.1 identifies the annual report a peer figure is read from. Cover page share counts come from each issuer's Form 10-Q for the quarter to 30 June 2026: UnitedHealth 0000731766-26-000197, Cigna 0001739940-26-000065, Elevance 0001156039-26-000060, Humana 0000049071-26-000050, Centene 0001071739-26-000153, McKesson 0000927653-26-000234 and Cencora 0001140859-26-000034. The Walgreens delisting is Form 25-NSE 0001354457-25-000854, effective 28 August 2025.
Non filing sources. Sector figures come from the Centers for Medicare and Medicaid Services National Health Expenditure Accounts, 2024 data; from KFF, Medicare Advantage in 2026: Enrollment Update and Key Trends, published 5 June 2026; and from Drug Channels Institute, The Top Pharmacy Benefit Managers of 2025, published 30 March 2026. Earnings call commentary is not an EDGAR document: the calls of 6 May 2026 and 5 August 2026 were read from published transcripts, and every call sourced figure was matched against two independent transcript publications before use. Segment adjusted operating income guidance and the full year medical benefit ratio guide were given on the call and do not appear in the Form 8-K exhibit. Share prices and the price history are market data and carry no named provider; every market price in this document is the last trade recorded on 3 September 2026, and the same price is used for every calculation that needs one.
Disclaimer
This document is not financial advice. It is an analysis of public filings prepared for information only, and it is not an offer, a solicitation or a recommendation to buy, sell or hold any security. The scenarios and sensitivities in chapter 9 are illustrations of a stated set of assumptions, not forecasts and not price targets. Figures are as filed, or derived and identified as such in the text. Readers should consult the primary filings and take their own professional advice before acting.