Insights derived from analysing SEC filings. Independent analysis, not a publication of the SEC.
Figures come from Forms 10-K for FY2021 to FY2025, Forms 10-Q for 2025 and 2026, and Forms 8-K from Jul 2024 to Sep 2026 with their quarterly earnings exhibits 99.1. Other sources are proxy statements of 2025 and 2026, Schedules 13G, Forms 13F and Forms 4 and 144 filed under central index key 50863, and comparable filings of seven peers. The Sources appendix lists accession numbers of the Intel and peer filings used. Market prices are closing prices of 30 September 2026.
Revenue is growing again. Q2 2026 revenue (to 27 Jun 2026) was $16.13bn, up 25%. Data Center and AI revenue was $6.26bn,
up 59%. Q3 2026 guidance is $15.8bn to 16.8bn, up 19% at the midpoint, with a non GAAP gross margin of about 42%. FY2025 revenue was
$52.85bn, against $79.02bn in FY2021.
Intel Products is profitable and Intel Foundry makes a loss. In Q2 2026 Intel Products earned $4.82bn of segment operating income and Intel Foundry lost $2.09bn.
Foundry revenue of $5.77bn was almost all internal; external foundry revenue was $293m. TTM core operating margin was 8.4%.
GAAP results carry large one off items. Q2 2026 net loss was $11.03bn after a $12.53bn loss on shares held in escrow for the US government. The loss grows when the share price rises. Q1 2026 carried a $3.9bn goodwill charge, mostly Mobileye. Non GAAP EPS was $0.42 in Q2 2026.
Intel raised about $36bn of equity in twelve months. The US government ($5.7bn received), SoftBank ($2.0bn) and NVIDIA ($5.0bn) bought shares
at $20.47 to 23.28 in 2025. In Aug 2026 Intel sold 242.1m shares at $95.00, about $23.0bn gross (8-K of 12 Aug 2026). Shares outstanding rose from 4.36bn in Mar 2025
to about 5.29bn. The US government holds up to 433.3m shares and a warrant for 240.5m more at $20.00.
Shares trade at 110x TTM non GAAP EPS. TTM non GAAP EPS was $1.09. At $120.23 the P/E is 79x annualized Q3 2026 guidance ($0.38 a quarter). TTM GAAP EPS was a loss of $2.11.
The price is 3.3x the end 2025 close and 5.7x book value including the Aug 2026 offering.
Scenario values for end FY2029 are $4 (worst), $68 (base) and $164 (best) per share.
Current price is 43x base case and 22x best case FY2029 core EPS. In the sensitivity analysis, core margin and the exit P/E
move value the most.
Views on these results differ. Arguments for a lower valuation cite Foundry losses, the absence of a named external 14A customer in filings,
share dilution, capital spending needs and a PC market expected to decline in 2026 (call). Arguments for a higher valuation cite Data Center and AI growth,
18A output ahead of target (call), the NVIDIA collaboration and US government support.
Intel designs and manufactures processors. Client Computing sells PC processors such as Core Ultra. Data Center and AI sells Xeon server
processors and custom chips. Intel Foundry develops process technology and makes wafers, almost all for Intel Products. All Other includes Mobileye and, until Sep 2025, Altera.
Process technology. Intel 18A entered high volume production at the start of 2026 and 18A-P entered risk production in Jun 2026. In Q2 2026
Intel committed to completing development of Intel 14A. The FY2025 10-K had warned that Intel might pause 14A without a significant external customer.
Portfolio changes. Intel sold 51% of Altera to Silver Lake on 12 Sep 2025 for net consideration of $4.3bn and booked a $5.45bn gain.
It closed the NAND sale to SK hynix in Mar 2025. On 8 Apr 2026 it bought back Apollo's 49% of the Ireland fab entity for $14.2bn.
Customers. The three largest customers were 43% of FY2025 revenue: Dell 19%, Lenovo 12% and HP 12%. Billings to China were 24% of revenue.
People. Headcount fell from 124,100 in Q3 2024 to 82,300 at 27 Jun 2026 after the 2024 and 2025 restructuring plans and the Altera sale.
Table 1.1. Revenue by segment
Segment
FY2023
FY2024
FY2025
TTM
FY2025 y/y
H1 2026 y/y
Client Computing (CCG)
32.31bn
33.35bn
32.23bn
33.33bn
(3.4%)
7.1%
Data Center and AI (DCAI)
15.98bn
16.13bn
16.92bn
20.17bn
4.9%
40.3%
Intel Foundry
18.50bn
17.32bn
17.83bn
19.93bn
2.9%
23.1%
All Other
5.46bn
3.60bn
3.56bn
2.90bn
(1.1%)
(33.4%)
Intersegment eliminations
(18.02)bn
(17.29)bn
(17.68)bn
(19.29)bn
2.3%
17.6%
Total revenue
54.23bn
53.10bn
52.85bn
57.03bn
(0.5%)
16.4%
TTM = Q3 2025 to Q2 2026. FY2023 and FY2024 recast in the FY2025 10-K. Intel Foundry revenue is mainly sales to Intel Products and is removed in eliminations. Earlier years used a different segment structure.
Table 1.2. Segment operating income
$
FY2023
FY2024
FY2025
TTM
Q2 2025
Q2 2026
Client Computing (CCG)
10.13bn
11.59bn
9.32bn
9.76bn
2.05bn
2.34bn
Data Center and AI (DCAI)
945m
1.41bn
3.42bn
6.23bn
633m
2.47bn
Intel Foundry
(7.08)bn
(13.29)bn
(10.32)bn
(9.36)bn
(3.17)bn
(2.09)bn
All Other
1.51bn
(57.0)m
264m
424m
69.0m
230m
Intersegment eliminations
(205)m
(161)m
619m
862m
(8.0)m
254m
Corporate unallocated
(5.20)bn
(11.18)bn
(5.52)bn
(8.00)bn
(2.76)bn
(1.42)bn
Operating income, GAAP
93.0m
(11.68)bn
(2.21)bn
(77.0)m
(3.18)bn
1.80bn
Corporate unallocated holds acquisition related costs, stock compensation, restructuring and other charges, including the Q1 2026 goodwill charge.
Table 1.3. Revenue by billing location
Country
FY2021
FY2022
FY2023
FY2024
FY2025
FY2025 share
United States
14.11bn
16.53bn
13.96bn
12.99bn
15.76bn
29.8%
China
21.14bn
17.13bn
14.85bn
15.53bn
12.69bn
24.0%
Singapore
14.25bn
9.66bn
8.60bn
10.19bn
9.54bn
18.0%
Taiwan
13.46bn
8.29bn
6.87bn
7.80bn
7.67bn
14.5%
Other
16.06bn
11.45bn
9.95bn
6.58bn
7.20bn
13.6%
China includes Hong Kong. 10-Q filings give no revenue by country.
H1 2026 revenue rose 16.4% to $29.71bn. Core operating income, before acquisition costs and restructuring, was $3.13bn,
against a loss of $1.16bn in H1 2025. The GAAP operating loss was $1.34bn and the net loss $14.76bn.
The difference comes from a $3.9bn goodwill charge in Q1 and $13.6bn of losses on escrowed shares in H1.
Table 2.1. Income statement; TTM = Q3 2025 to Q2 2026
$
FY2021
FY2022
FY2023
FY2024
FY2025
TTM
Revenue
79.02bn
63.05bn
54.23bn
53.10bn
52.85bn
57.03bn
Cost of revenue
(35.21)bn
(36.19)bn
(32.52)bn
(35.76)bn
(34.48)bn
(35.02)bn
Gross profit
43.82bn
26.87bn
21.71bn
17.35bn
18.38bn
22.02bn
Research and development
(15.19)bn
(17.53)bn
(16.05)bn
(16.55)bn
(13.77)bn
(13.19)bn
Marketing, general and administrative
(6.54)bn
(7.00)bn
(5.63)bn
(5.51)bn
(4.62)bn
(4.52)bn
Restructuring and other charges
(2.63)bn
(2.0)m
62.0m
(6.97)bn
(2.19)bn
(4.39)bn
Operating income
19.46bn
2.33bn
93.0m
(11.68)bn
(2.21)bn
(77.0)m
Gains on equity investments
2.73bn
4.27bn
40.0m
242m
514m
13.0m
Interest and other, net
(482)m
1.17bn
629m
226m
3.26bn
(9.79)bn
of which interest expense
(597)m
(496)m
(878)m
(1.03)bn
(1.09)bn
(1.15)bn
Income tax
(1.84)bn
249m
913m
(8.02)bn
(1.53)bn
(1.34)bn
Net income attributable to Intel
19.87bn
8.01bn
1.69bn
(18.76)bn
(267)m
(11.29)bn
Diluted EPS, $
4.86
1.94
0.40
(4.38)
(0.06)
(2.11)
Diluted shares, m
4,090
4,123
4,212
4,280
4,530
5,104
Fiscal years end on the last Saturday of December; FY2022 had 53 weeks. FY2024 includes $15.9bn of impairment and restructuring charges and a $9.9bn deferred tax valuation allowance. Other income includes the Altera gain (Q3 2025) and losses on escrowed shares. TTM EPS is the sum of four quarters.
Table 2.2. What changed: FY2025 against FY2024 and H1 2026 against H1 2025
Full year
First half
$
FY2024
FY2025
Change
H1 2025
H1 2026
Change
Revenue
53.10bn
52.85bn
(0.5%)
25.53bn
29.71bn
16.4%
Client Computing
33.35bn
32.23bn
(3.4%)
15.50bn
16.60bn
7.1%
Data Center and AI
16.13bn
16.92bn
4.9%
8.07bn
11.31bn
40.3%
Gross profit
17.35bn
18.38bn
5.9%
8.21bn
11.86bn
44.3%
Research and development
16.55bn
13.77bn
(16.8%)
7.32bn
6.74bn
(7.9%)
Marketing, general and administrative
5.51bn
4.62bn
(16.0%)
2.32bn
2.21bn
(4.7%)
Operating income
(11.68)bn
(2.21)bn
n/a
(3.48)bn
(1.34)bn
n/a
Net income
(18.76)bn
(267)m
n/a
(3.74)bn
(14.76)bn
n/a
Operating cash flow
8.29bn
9.70bn
17.0%
2.86bn
8.10bn
183.0%
Additions to property, plant and equipment
23.94bn
14.65bn
(38.8%)
8.73bn
6.19bn
(29.1%)
Stock based compensation
3.41bn
2.43bn
(28.6%)
1.35bn
1.31bn
(3.0%)
Gross margin
32.7%
34.8%
2.1 pts
32.2%
39.9%
7.7 pts
Core operating margin
(6.9%)
0.9%
7.8 pts
(4.5%)
10.5%
15.1 pts
Change shows n/a where either value is negative. Segment rows use the FY2025 10-K structure. Additions to property, plant and equipment are the investing cash flow line; gross capex in releases adds financed additions.
Table 2.3. Core earnings reconciliation
$
FY2025
TTM
Net income attributable to Intel, GAAP
(267)m
(11.29)bn
Add: company non GAAP adjustments, net of tax
2.20bn
16.76bn
Net income, company non GAAP
1.93bn
5.47bn
Less: stock compensation after tax
(2.14)bn
(2.13)bn
Net income, core
(213)m
3.34bn
Diluted EPS, GAAP, $
(0.06)
(2.11)
Diluted EPS, company non GAAP, $
0.42
1.09
Diluted EPS, core, $
(0.05)
0.65
Company non GAAP net income excludes acquisition costs, stock compensation, restructuring, gains and losses on investments, divestitures and escrowed shares (Ex 99.1 of each quarter). Core earnings deduct stock compensation, taxed at the company non GAAP rate of 12% in 2025 and 11% in 2026. Non GAAP EPS sums four quarters; core EPS uses 5,104m shares.
Table 2.4. Ratio analysis, FY2021 to FY2025 and TTM
Ratio
FY2021
FY2022
FY2023
FY2024
FY2025
TTM
Growth and profitability
Revenue growth
n/a
(20.2%)
(14.0%)
(2.1%)
(0.5%)
7.5%
Gross margin
55.4%
42.6%
40.0%
32.7%
34.8%
38.6%
Operating margin
24.6%
3.7%
0.2%
(22.0%)
(4.2%)
(0.1%)
Core operating margin
29.8%
6.1%
2.7%
(6.9%)
0.9%
8.4%
Net margin
25.1%
12.7%
3.1%
(35.3%)
(0.5%)
(19.8%)
FCF margin
14.2%
(14.9%)
(26.3%)
(29.5%)
(9.4%)
5.0%
ROE
20.8%
8.1%
1.6%
(18.3%)
(0.3%)
(12.2%)
ROA
11.8%
4.6%
0.9%
(9.7%)
(0.1%)
(5.7%)
Cost structure
R&D / revenue
19.2%
27.8%
29.6%
31.2%
26.1%
23.1%
MG&A / revenue
8.3%
11.1%
10.4%
10.4%
8.7%
7.9%
SBC / revenue
2.6%
5.0%
6.0%
6.4%
4.6%
4.2%
Depreciation / revenue
12.6%
17.6%
14.5%
18.7%
20.4%
20.1%
Capex / revenue
23.7%
39.4%
47.5%
45.1%
27.7%
21.2%
Balance sheet and working capital
PP&E / assets
37.6%
44.4%
50.4%
54.9%
49.9%
52.2%
Days sales outstanding
44
24
23
24
27
26
Days inventory
112
133
125
125
123
130
Current ratio
2.10x
1.57x
1.54x
1.33x
2.02x
1.60x
Leverage
Debt / equity
0.40x
0.41x
0.47x
0.50x
0.41x
0.58x
Net debt / EBITDA
0.29x
0.91x
2.61x
4.45x
0.82x
1.28x
Interest coverage
39.5x
7.8x
1.6x
(3.5x)
0.4x
4.2x
Valuation
EV / sales at year end
2.8x
2.0x
4.4x
2.3x
3.9x
11.4x
P/E at year end
11x
14x
126x
n/a
n/a
n/a
Price / book at year end
2.2x
1.1x
2.0x
0.9x
1.6x
5.7x
Core operating margin and EBITDA add back acquisition costs and restructuring. Returns use average equity and assets. Year end valuation uses the December close; TTM uses 30 Sep 2026 with the Aug 2026 offering in shares, cash and book value. Prior TTM: Q3 2024 to Q2 2025.
Table 2.5. Balance sheet, period end
$
FY2021
FY2022
FY2023
FY2024
FY2025
27 Jun 2026
Cash and short term investments
28.41bn
28.34bn
25.03bn
22.06bn
37.42bn
29.73bn
Inventories
10.78bn
13.22bn
11.13bn
12.20bn
11.62bn
12.49bn
Property, plant and equipment
63.25bn
80.86bn
96.65bn
107.92bn
105.41bn
105.74bn
Goodwill
26.96bn
27.59bn
27.59bn
24.69bn
23.91bn
20.47bn
Total assets
168.41bn
182.10bn
191.57bn
196.49bn
211.43bn
202.44bn
Total debt
38.10bn
42.05bn
49.27bn
50.01bn
46.59bn
50.54bn
Net debt
9.69bn
13.71bn
24.23bn
27.95bn
9.17bn
20.81bn
Intel stockholders' equity
95.39bn
101.42bn
105.59bn
99.27bn
114.28bn
87.54bn
Noncontrolling interests
n/a
1.86bn
4.38bn
5.76bn
12.08bn
15.60bn
Shares outstanding, m
4,070
4,137
4,228
4,330
4,994
5,043
27 Jun 2026 is before the Aug 2026 offering. Equity fell in Q2 2026 on the Apollo buyback ($13.5bn) and the escrowed share loss. Revolving facilities of $10.0bn were undrawn.
Table 2.6. Capital raised and major uses, Aug 2025 to Aug 2026
Date
Transaction
Amount
Aug 2025
US government: 274.6m shares issued, 158.7m in escrow, warrant for 240.5m at $20.00
$5.7bn received; up to $8.87bn
Sep 2025
Altera: 51% sold to Silver Lake
$4.3bn net
Sep 2025
SoftBank: 87.0m shares at $23.00
$2.0bn
Dec 2025
NVIDIA: 214.8m shares at $23.28
$5.0bn
Apr 2026
Apollo: Intel bought back 49% of the Ireland fab entity
Intel guided Q3 2026 revenue to $15.8bn to 16.8bn. At the midpoint it guided gross margin to 41.0% GAAP and 42.0% non GAAP, and EPS to
$0.31 GAAP and $0.38 non GAAP. Releases guide one quarter ahead. Capital spending plans come from the call.
Table 3.1. Recent quarters and guidance (earnings releases, Ex 99.1)
Item
Q3 2025
Q4 2025
Q1 2026
Q2 2026
Q3 2026 guide
Revenue
$13.65bn
$13.67bn
$13.58bn
$16.13bn
$15.8bn to 16.8bn
Revenue growth y/y
3%
(4%)
7%
25%
19% at midpoint
Client / Data Center and AI revenue
$8.54bn / 4.12bn
$8.19bn / 4.74bn
$7.73bn / 5.05bn
$8.88bn / 6.26bn
n/a
Intel Foundry operating loss
$2.32bn
$2.51bn
$2.44bn
$2.09bn
n/a
Gross margin, GAAP / non GAAP
38.2% / 40.0%
36.1% / 37.9%
39.4% / 41.0%
40.4% / 41.8%
41.0% / 42.0%
Operating margin, non GAAP
11.2%
8.8%
12.3%
17.2%
n/a
Diluted EPS, GAAP / non GAAP
$0.90 / 0.23
$(0.12) / 0.15
$(0.73) / 0.29
$(2.16) / 0.42
$0.31 / 0.38
Adjusted free cash flow
$0.90bn
$2.22bn
$(2.02)bn
$(8.42)bn
n/a
Sources: 8-K 0000050863-25-000169, 0000050863-26-000009, 0000050863-26-000077 and 0000050863-26-000155. Q2 2026 adjusted free cash flow includes the $14.2bn Apollo buyback.
MD&A, FY2025 10-K. Revenue was $52.85bn, flat on FY2024. Data Center and AI rose 5% and Client Computing fell 3% on the recast basis.
Intel Foundry lost $10.32bn, against $13.29bn in FY2024. Gross capital spending fell to $17.7bn from $25.1bn.
MD&A, Q2 2026 10-Q. Data Center and AI revenue rose 59% and segment operating income reached $2.47bn. Higher cost 18A wafers
reduced product profit by $340m. The liability for escrowed shares was $15.6bn at 27 Jun 2026. Intel names the Iran conflict as a risk to its Israel fab.
Earnings call, 23 Jul 2026 (third party transcript summaries). Management said demand exceeds supply for leading edge logic, wafers, memory and substrates. 18A output was about 25% above target. Management expects the PC market to fall by a low double digit % in 2026. It raised 2026 capital spending to above $20bn, with 2027 higher.
Intel 14A (call). Risk production for internal products is planned for H2 2027 and volume production for 2028.
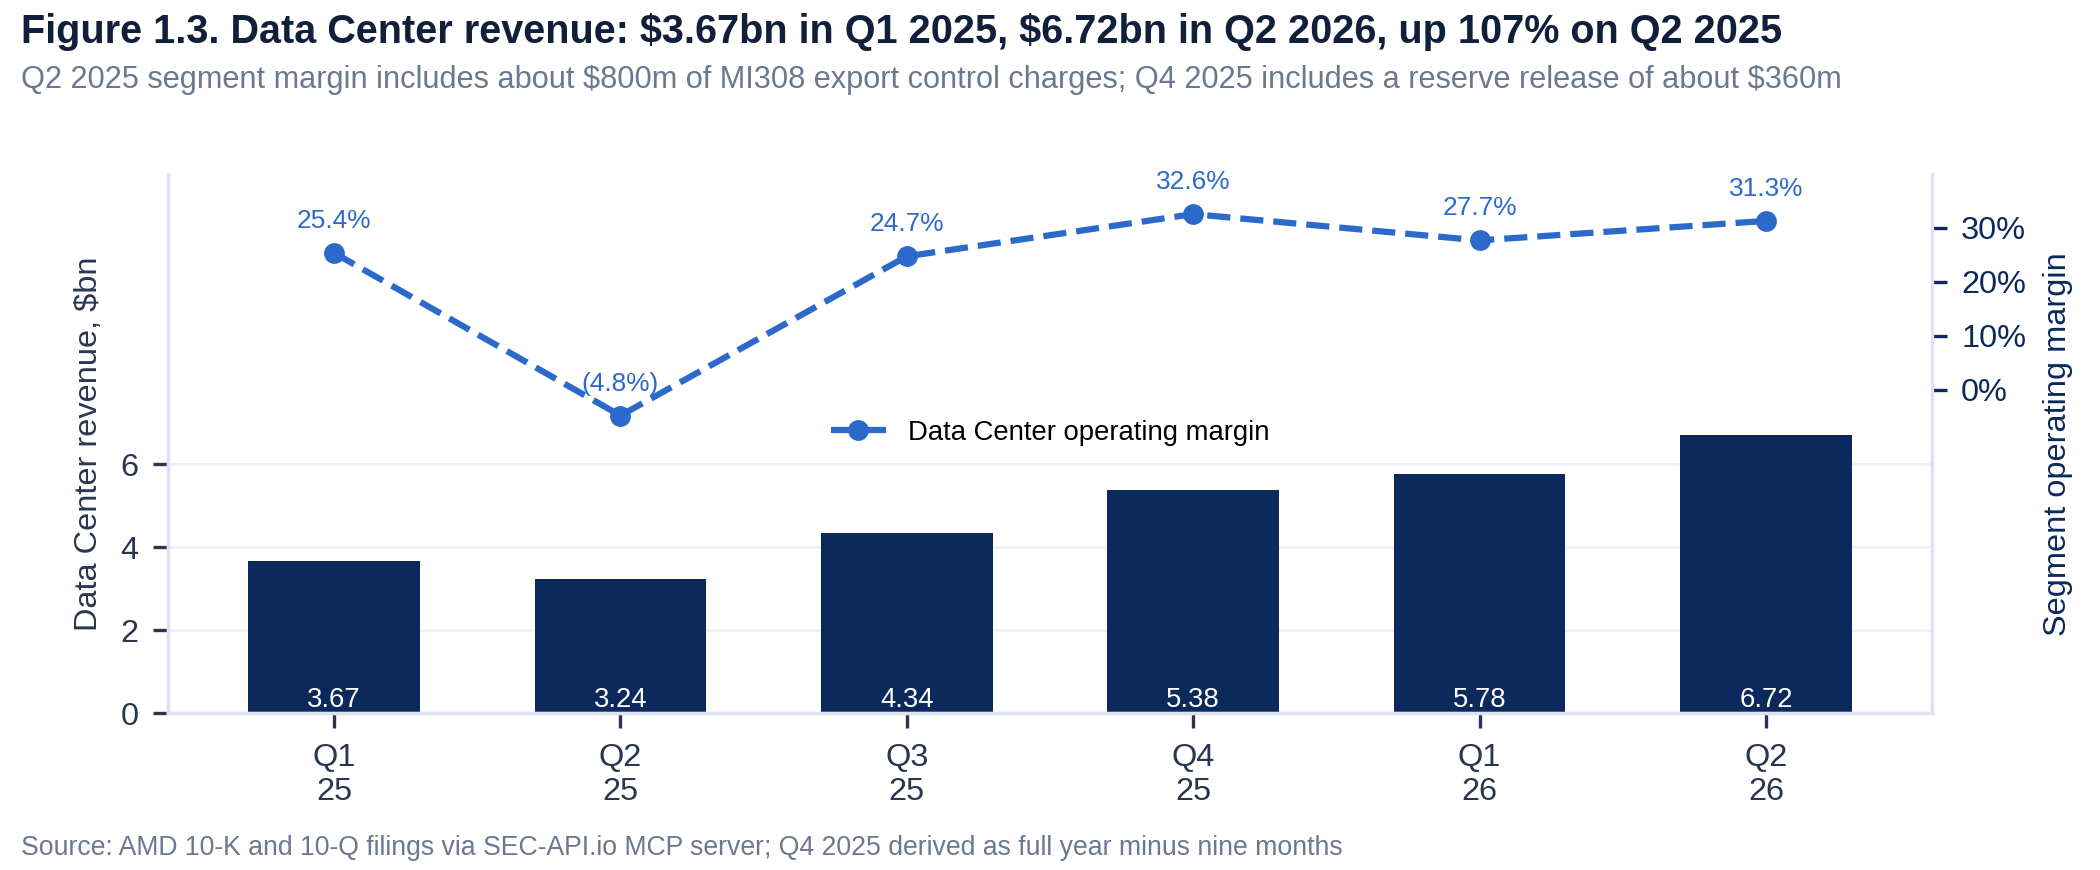
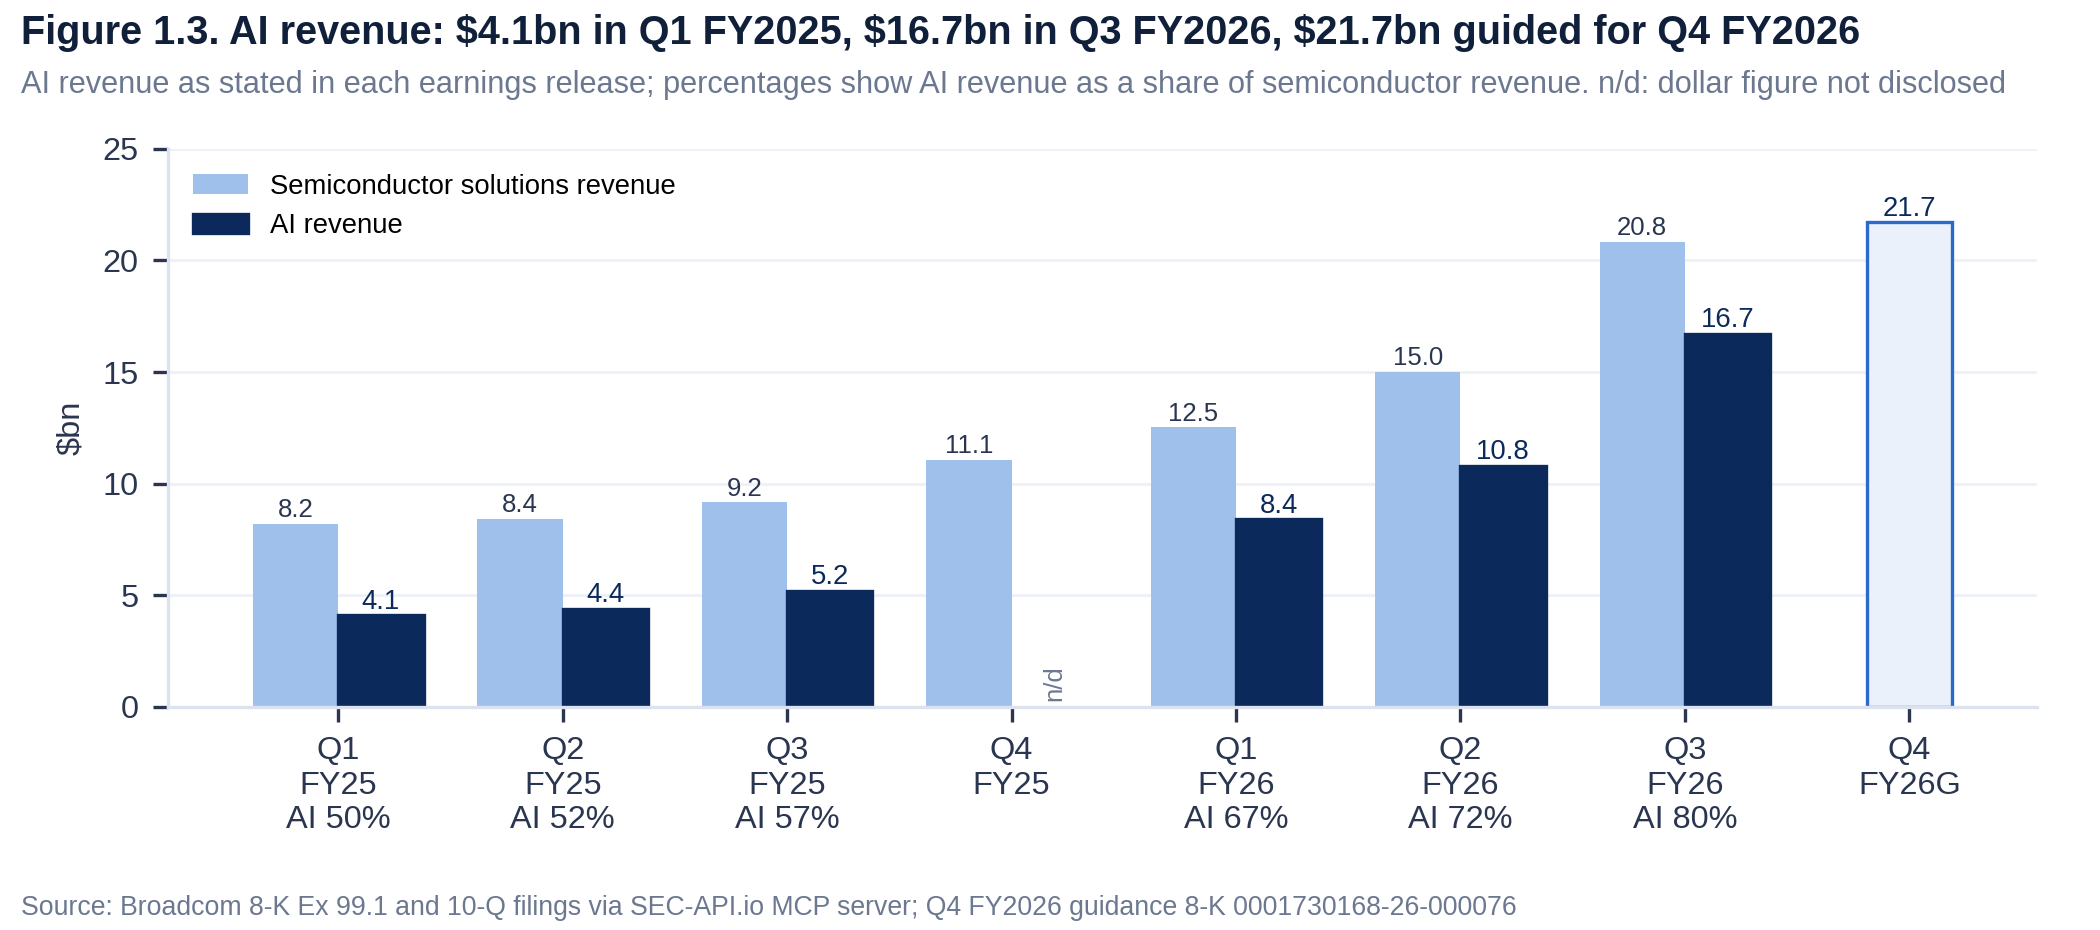
Intel's year to date revenue growth of 16.4% is below Micron (203.0%), NVIDIA (95.8%), Broadcom (55.0%),
AMD (44.1%) and Texas Instruments (20.8%). Its TTM gross margin of 38.6% compares with 53.2% at AMD and 74.7% at NVIDIA. Its capital
spending of 21.2% of TTM revenue compares with 4.1% at AMD and 28.0% at Micron.
x86 processors. Mercury Research reported AMD at 34.5% of server CPU units in Q2 2026, up from 27.3% a year earlier (as reported by The Register). IDC counted 68.2m PCs shipped in Q2 2026, a 4.9% decline from Q2 2025 (trade press).
Foundry. TrendForce: TSMC had 72.5% of Q2 2026 foundry revenue; Intel is outside the top ten. TSMC had FY2025 revenue of $121.4bn, a 59.9% gross margin and $40.6bn capex.
Government support. CHIPS Act funding totals $11.1bn (Aug 2025 press release): $2.2bn of earlier grants, $5.7bn paid for shares in Aug 2025 and $3.2bn under the
Secure Enclave program. The Department of Commerce must vote its shares as the board recommends, with limited exceptions.
Hyperscaler capital spending. Combined 2026 guidance of Microsoft, Amazon, Alphabet and Meta is about $720bn to 745bn (guidance as reported in press; Meta from its release).
Table 4.1. Peer comparison, TTM to the latest 10-Q; market data at 30 Sep 2026
Company
Year end
Revenue
Growth YTD
Gross margin
Operating margin
FCF margin
Capex / revenue
Market cap, $
P/E TTM
Intel
FY Dec
57.03bn
16.4%
38.6%
(0.1%)
5.0%
21.2%
635.5bn
n/a
AMD
FY Dec
41.31bn
44.1%
53.2%
15.7%
20.3%
4.1%
998.7bn
157x
NVIDIA
FY Jan
302.97bn
95.8%
74.7%
65.2%
41.9%
2.4%
5.51tn
29x
Qualcomm
FY Sep
44.07bn
(0.7%)
54.2%
23.2%
23.6%
4.5%
196.6bn
21x
Broadcom
FY Nov
89.10bn
55.0%
68.8%
48.0%
44.2%
1.4%
1.66tn
44x
Texas Instruments
FY Dec
19.45bn
20.8%
58.3%
37.3%
27.5%
17.0%
255.8bn
43x
Micron
FY Aug
90.27bn
203.0%
72.6%
65.6%
29.0%
28.0%
1.20tn
24x
GlobalFoundries
FY Dec
6.94bn
4.5%
27.1%
11.6%
11.5%
16.1%
26.7bn
37x
Growth compares the latest fiscal year to date with the prior year. P/E uses filed TTM diluted EPS; Intel has a TTM loss. Intel market cap includes the Aug 2026 offering. GlobalFoundries uses IFRS. Micron TTM ends May 2026.
From Aug 2025 to Aug 2026 Intel sold shares to the US government, SoftBank, NVIDIA and the public, sold control of Altera, bought back Apollo's
stake in its Ireland fab and committed to Intel 14A. Lip-Bu Tan became CEO on 18 Mar 2025.
Table 5.1. FY2025 10-K items and Q2 2026 10-Q updates
Item
Content
Item 1, Business
Intel Products, Intel Foundry and All Other. 85,100 employees at FY2025 year end, against 108,900 a year earlier. The 10-K states that Intel has few external foundry customers to date and names none.
Item 1A, Risk factors
FY2025 against FY2024: 34 new and 23 reworded paragraphs (own text comparison). Two new risk factors: a possible pause of Intel 14A without a significant external customer, with reliance on TSMC for later nodes; and the US government stake, where the 10-K cites dilution and equity replacing future grants.
Notes, incentives and commitments
Capital related incentives recognized: $6.7bn in FY2025. Capital spending commitments were $12.8bn at FY2025 year end.
Item 9A, Controls
Controls were effective at 27 Dec 2025; Ernst & Young is the auditor.
Q2 2026 10-Q
Item 1A refers back to the 10-K without changes. MD&A states that Intel committed to completing Intel 14A development in Q2 2026.
10-K 0000050863-26-000011; 10-Q 0000050863-26-000157; risk factor comparison against 10-K 0000050863-25-000009.
Table 5.2. Selected Form 8-K events, Jul 2025 to Sep 2026
Filed
Items
Event
12 Aug 2026
7.01, 8.01
Public offering of 242.1m shares at $95.00, about $23.0bn gross
23 Jul 2026
2.02
Q2 2026 results: revenue $16.13bn (+25%); GAAP EPS $(2.16); non GAAP EPS $0.42; Q3 guidance $15.8bn to 16.8bn
15 May 2026
5.07
Annual meeting results: 11 directors elected; say on pay approved; three shareholder proposals rejected
Shareholders elected all eleven directors and ratified the auditor. Say on pay received 86.9% support, up from 72.3% in 2025. Three shareholder proposals received 2.9% to 11.8%. Shares represented were 79.1% of the 5,021m outstanding.
Board. Frank Yeary retired at the meeting and Craig Barratt became independent Chair. Steve Sanghi had the lowest support,
91.3%; Lip-Bu Tan had 99.3%.
Pay. Lip-Bu Tan's reported FY2025 pay was $93.0m, of which $89.2m was stock and option awards, $53.5m of them new hire awards. The new hire
performance shares pay only if the share price rises, with the target payout at twice the starting price. CEO pay ratio was 812 to 1, or 346 to 1 without
one time awards (DEF 14A 0000050863-26-000061).
Table 6.1. Proposals and support (for as % of for plus against)
Proposal
Board view
2026
2025
Outcome
Say on pay
For
86.9%
72.3%
Approved
Ratify Ernst & Young
For
94.0%
91.7%
Approved
Employee stock purchase plan, 133m more shares (2026)
For
99.5%
n/a
Approved
Equity incentive plan amendment
For
84.3%
76.5%
Approved
Report on China exposure (shareholder, 2026)
Against
2.9%
n/a
Rejected
Human rights due diligence report (shareholder, 2026)
Against
10.0%
n/a
Rejected
Separate Chair and CEO roles (shareholder, 2026)
Against
11.8%
n/a
Rejected
Broker non votes: 742.0m in 2026. Proponents in 2026: The Heritage Foundation, Nicholas Collins and John Chevedden. Sources: 8-K 0000050863-26-000118 and 0000050863-25-000084.
Table 6.2. Director elections, support as % of for plus against
Counting escrowed shares, the US government holds up to 433.3m shares (8.4% at 20 Mar 2026, proxy), more than any 13F filer reviewed. About 143m were still in escrow at 27 Jun 2026. NVIDIA holds 214.8m shares and SoftBank 87.0m. Insiders bought $10.25m of stock and sold $7.47m in the
twelve months to Sep 2026. Lip-Bu Tan bought $10.0m of shares at $95.00 on 11 Aug 2026.
Table 6.3. Largest holders, shares m (Form 13F unless stated)
Holder
30 Jun 2026
% of shares
31 Mar 2026
31 Dec 2025
Change since Dec 2025
US government (proxy, 20 Mar 2026, incl. escrow)
433.3
8.4%
n/a
n/a
n/a
BlackRock
426.5
8.5%
n/a
432.2
(1.3%)
Vanguard
374.6
7.4%
367.4
404.5
n/a
State Street
216.8
4.3%
214.3
208.5
4.0%
NVIDIA
214.8
4.3%
214.8
214.8
0.0%
Invesco
157.9
3.1%
154.0
156.8
0.7%
Geode Capital Management
110.3
2.2%
109.5
101.9
8.2%
FMR
94.4
1.9%
57.5
27.3
246.0%
SoftBank Group
87.0
1.7%
87.0
87.0
0.0%
PRIMECAP
75.3
1.5%
75.8
76.1
(1.2%)
Capital Research Global Investors
73.7
1.5%
77.3
26.6
177.0%
% of shares uses 5,044m shares at Jul 2026, before the Aug 2026 offering. n/a: filing not retrieved or not a 13F filer. 13F holders selected from 34 large managers. Vanguard changed filing entities in 2026, so its change is left out. Vanguard Capital Management held 6.52% at 31 Mar 2026 (13G).
Table 6.4. Insider transactions, Oct 2025 to Sep 2026, $m (Form 4)
Insider
Role
Transaction
Amount
Lip-Bu Tan
CEO
Purchase, 11 Aug 2026 at $95.00
10.0
David Zinsner
CFO
Purchase, 26 Jan 2026 at $42.50
0.25
April Miller Boise
Chief Legal Officer until 1 Jun 2026
Sales
(4.99)
Naga Chandrasekaran
EVP, Foundry
Sales
(2.49)
41 Form 4 and 4 Form 3 filings. No sale carried a Rule 10b5-1 flag. Shares withheld for tax on vesting: $14.8m. Forms 144 covered $18.7m of proposed sales.
EV to sales was 3.9x at the Dec 2025 close. It is now 11.4x TTM revenue and 10.4x
model FY2026 revenue of $62.31bn. Market capitalization is $636bn on 5,286m shares, including the Aug 2026 offering.
Closing prices over 52 weeks ranged from $33.62 (20 Nov 2025) to $140.94 (22 Jun 2026).
Table 7.1. Fiscal year end valuation (December close)
Fiscal year
Market cap, $bn
Price, $
Diluted EPS, $
EV / sales
Price / book
FY21
210
51.50
4.86
2.8x
2.2x
FY22
109
26.43
1.94
2.0x
1.1x
FY23
212
50.25
0.40
4.4x
2.0x
FY24
87
20.05
(4.38)
2.3x
0.9x
FY25
184
36.90
(0.06)
3.9x
1.6x
30 Sep 2026
636
120.23
(2.11) TTM
11.4x
5.7x
EV = market cap plus debt and noncontrolling interests less cash and short term investments. At 30 Sep 2026, shares, cash and book value include the Aug 2026 offering at gross proceeds.
Scenarios start from model FY2026 revenue of $62.31bn. FY2029 core EPS is $0.28 (worst),
$2.81 (base) and $5.47 (best), against $0.89 for FY2026 on a core basis. Implied
values per share at end FY2029 are $4, $68 and $164.
Table 8.1. Scenario assumptions, FY2027 to FY2029
Driver
Worst
Base
Best
Revenue growth FY2027 / FY2028 / FY2029
3% / 0% / (3%)
14% / 10% / 8%
25% / 22% / 18%
Core operating margin FY2027 / FY2028 / FY2029
10% / 8% / 6%
16% / 20% / 23%
20% / 27% / 32%
Diluted share count increase a year
1%
1%
1%
Exit P/E on FY2029 core EPS
14x
24x
30x
Common to all
FY2026 base year: revenue $62.3bn, made of H1 actual, the Q3 guidance midpoint of $16.3bn and Q4 held at Q3 (model value). Core operating income $7.3bn (11.8%), with H2 at the Q2 2026 core margin of 12.9%. Noncontrolling interests (about $1.1bn a year per the call) and net interest cost $2.0bn a year; tax rate 11%. Diluted shares of 5,346m in FY2026 include the Aug 2026 offering and exclude the government warrant. Model EPS = (core operating income less $2.0bn) less tax, over diluted shares; Table 2.3 core EPS starts from company non GAAP net income.
Demand. Base case revenue grows 14%, 10% and 8%, against 16.4% in H1 2026. Best case adds external foundry revenue and faster Data Center and AI
growth. Worst case uses 3%, 0% and (3%), as PC demand falls and share losses to AMD and Arm based chips continue.
Margin. Core margin counts stock compensation (4.2% of TTM revenue) and depreciation (20.1%) as costs.
In the base case it rises from 11.8% in FY2026 to 23% in FY2029. FY2021 core margin was 29.8%.
Per share. The share count includes the Aug 2026 offering. It excludes the government warrant, which becomes exercisable only if Intel owns less than 51% of its foundry business.
Excluded. Further share issues, acquisitions, impairments, changes in escrowed share value and changes in government funding.
Escrowed shares. About 143m shares were in escrow at 27 Jun 2026 with a liability of $15.6bn. Each $1 move in the share price changes the liability by about $143m (computed).
Dilution. Net share settlement of the government warrant at $120.23 would add about 201m shares, 3.8% of shares outstanding after the Aug 2026 offering (computed).
Capital spending. TTM gross capital spending was $14.59bn (releases). Management guided 2026 spending above $20bn on the call.
Data. Financial statements from XBRL in the 10-K for FY2021 to FY2025 and 10-Q filings for Q1 2025 to Q2 2026, retrieved through the SEC-API.io
MCP server. Q4 2025 equals full year less the first nine months; quarterly cash flows are derived from year to date statements.
Other sources. Earnings call of 23 Jul 2026 from Intel's prepared remarks and a third party transcript summary. Peer data from peer filings. Market prices: 30 Sep 2026.
Definitions. FCF = operating cash flow less additions to property, plant and equipment. Core operating income = GAAP operating income plus acquisition costs and restructuring.
Scenario model. EPS = (revenue x core margin less $2.0bn) x (1 less 11%) over diluted shares. Implied value = FY2029 EPS x exit P/E, undiscounted.
Disclaimer: for information only, not financial advice. This report is not a recommendation to buy, sell or hold any
security. Figures come from SEC filings retrieved through the SEC-API.io MCP server and from sources named above. Scenario values follow
arithmetically from the stated assumptions. Consult a licensed adviser before investing.