Insights derived from analysing SEC filings. Independent analysis, not a publication of the SEC.
Figures come from Forms 10-K for FY2021 to FY2025, Forms 10-Q for FY2025 and FY2026, and Forms 8-K from Sep 2024 to Sep 2026 with their quarterly earnings exhibits 99.1. Q4 and full year FY2026 figures come from the unaudited earnings release of 30 Sep 2026; the FY2026 10-K was not on file at 6 Oct 2026. Other sources are proxy statements of 2024 and 2025, Schedules 13G, Forms 13F and Forms 4 and 144 filed under central index key 723125, and comparable filings of seven peers. The Sources appendix lists accession numbers. Market prices are closing prices of 5 October 2026.
Revenue more than tripled in one year. Q4 FY2026 revenue (14 weeks to 3 Sep 2026) was $54.23bn, up 379% on Q4 FY2025 and 31% on Q3.
FY2026 revenue was $133.19bn, up 256% from $37.38bn. Q1 FY2027 guidance is $60.0bn to 63.0bn.
Prices drove the growth. In the first nine months of FY2026 DRAM selling prices rose about 140% and NAND prices about 130%, while bit shipments rose about 30%
and in the low 20% range (Q3 FY2026 10-Q). GAAP gross margin was 86.8% in Q4 FY2026, against 44.7% a year earlier and a negative 9.1% in FY2023.
Customers now sign multi year supply agreements. The agreements are take or pay, with fixed prices or price bands, and include cash deposits. Noncurrent customer contract
liabilities were $12.90bn at 3 Sep 2026, against $568m at 28 May 2026. One customer was 17% of FY2025 revenue.
Net cash is $68.27bn. FY2026 operating cash flow was $89.68bn and capital spending $30.71bn. Cash and investments were
$73.45bn and debt $5.18bn at 3 Sep 2026, after $10.04bn of debt repayments. Buybacks were $650m; CHIPS Act agreements restrict them until Dec 2029.
Shares trade at 14.3x FY2026 GAAP EPS of $74.33. At $1,063.96 the P/E is 7.0x annualized Q1 FY2027 guidance ($37.84 a quarter).
The price is 8.9x the August 2025 close, 8.7x book value and 8.5x FY2026 revenue on an enterprise value basis.
Scenario values for end FY2029 are $298 (worst), $1,043 (base) and $2,494 (best) per share.
Current price is 12x base case and 6x best case FY2029 core EPS. In the sensitivity analysis, the exit P/E and FY2029 revenue
move value the most.
Views on these results differ. Arguments for a lower valuation cite the price driven nature of growth, the FY2023 loss, new industry capacity from 2027, capital spending
of about $27bn net in FY2026 and customer concentration. Arguments for a higher valuation cite supply shortages, multi year agreements with price floors,
net cash of $68.27bn and Q1 FY2027 guidance above Q4.
Micron makes DRAM, NAND and NOR memory chips. It sells through four business units. Cloud Memory serves large cloud customers and sells high bandwidth
memory (HBM). Core Data Center serves other data center customers. Mobile and Client serves phones and PCs. Automotive and Embedded serves cars and industry.
Technology. In FY2025 Micron began shipping its 1 gamma DRAM node, its first with EUV lithography, and began volume production of G9 NAND. HBM4 volume production
was planned for calendar 2026 (FY2025 10-K). HBM needs more wafers per bit than standard DRAM.
Customers. About half of revenue came from the top ten customers in each of the last three years. One customer was 17% of FY2025 revenue and 10% of revenue in the first nine months of FY2026.
Cloud Memory and Core Data Center were 61% of FY2026 revenue.
Capacity. Wafer fabs are in Taiwan, Singapore, Japan and the United States. The 10-K states that Micron generally uses all of its capacity. New fabs are under construction in Idaho, New York and Singapore.
Micron bought a fab in Tongluo, Taiwan, from Powerchip for $1.8bn in Mar 2026.
People and brands. Micron had about 53,000 employees at 28 Aug 2025. It announced the exit from its Crucial consumer business on 3 Dec 2025 (company press release).
Table 1.1. Revenue by business unit
Business unit
FY2024
FY2025
FY2026
FY2026 share
FY2026 y/y
Q4 FY2026 y/y
Cloud Memory (CMBU)
3.79bn
13.52bn
43.09bn
32.3%
219%
258%
Core Data Center (CDBU)
4.98bn
7.23bn
37.59bn
28.2%
420%
1,042%
Mobile and Client (MCBU)
11.67bn
11.86bn
36.60bn
27.5%
209%
249%
Automotive and Embedded (AEBU)
4.63bn
4.75bn
15.89bn
11.9%
234%
376%
All Other
37.0m
13.0m
24.0m
0.0%
n/a
n/a
Total revenue
25.11bn
37.38bn
133.19bn
100.0%
256%
379%
Unit structure in place since Q4 FY2025; FY2024 recast in the FY2025 10-K. FY2026 = nine months as filed in the Q3 FY2026 10-Q plus Q4 from the release. Earlier years used a different unit structure.
Table 1.2. Business unit operating income and margin
Operating income
Operating margin
$
FY2024
FY2025
9M FY2026
Margin Q4 FY2025
Margin Q3 FY2026
Margin Q4 FY2026
Cloud Memory (CMBU)
244m
6.13bn
18.80bn
48%
78%
76%
Core Data Center (CDBU)
255m
2.18bn
14.22bn
25%
83%
85%
Mobile and Client (MCBU)
(1.0)m
1.98bn
17.73bn
29%
86%
88%
Automotive and Embedded (AEBU)
432m
557m
5.80bn
20%
75%
79%
All Other and unallocated
374m
(1.08)bn
(961)m
n/a
n/a
n/a
Operating income, GAAP
1.30bn
9.77bn
55.59bn
32%
80%
81%
9M FY2026 = nine months to 28 May 2026 (10-Q). The Q4 FY2026 release gives unit margins as whole percentages and no amounts. Unallocated items are mainly stock compensation. In FY2024 they include $987m of lower costs on inventory written down earlier and a $200m patent gain.
Table 1.3. Revenue by location of customer headquarters
Country
FY2021
FY2022
FY2023
FY2024
FY2025
FY2025 share
United States
12.16bn
16.03bn
7.81bn
13.17bn
24.11bn
64.5%
Taiwan
6.61bn
6.19bn
2.70bn
4.71bn
5.67bn
15.2%
China
5.04bn
4.98bn
2.52bn
4.12bn
3.78bn
10.1%
Japan
1.65bn
1.70bn
987m
840m
895m
2.4%
Other
2.25bn
1.88bn
1.53bn
2.28bn
2.92bn
7.8%
China includes Hong Kong. Other includes Europe and other Asia Pacific. The FY2026 split is due with the FY2026 10-K; 10-Q filings give no revenue by country.
Table 1.4. Revenue by technology
$
FY2023
FY2024
FY2025
9M FY2025
9M FY2026
9M y/y
9M FY2026 share
DRAM
10.98bn
17.60bn
28.58bn
19.59bn
60.91bn
211%
77.1%
NAND
4.21bn
7.23bn
8.50bn
6.25bn
17.68bn
183%
22.4%
Other, mainly NOR
356m
281m
297m
218m
368m
69%
0.5%
Total revenue
15.54bn
25.11bn
37.38bn
26.06bn
78.96bn
203%
100.0%
9M = nine months to late May. The Q4 FY2026 release gives no split. The Q4 call gave DRAM revenue of $39.8bn and NAND revenue of $14.1bn (summaries of prepared remarks and third party transcripts).
FY2026 revenue rose 256% to $133.19bn while cost of goods sold rose 14% to $25.68bn.
Operating income was $99.34bn, against $9.77bn in FY2025, and net income $84.97bn. Revenue exceeded the guidance midpoint in each of the last eight quarters.
FY2026 has 53 weeks.
Table 2.1. Income statement
$
FY2021
FY2022
FY2023
FY2024
FY2025
FY2026
Revenue
27.71bn
30.76bn
15.54bn
25.11bn
37.38bn
133.19bn
Cost of goods sold
(17.28)bn
(16.86)bn
(16.96)bn
(19.50)bn
(22.51)bn
(25.68)bn
Gross margin
10.42bn
13.90bn
(1.42)bn
5.61bn
14.87bn
107.50bn
Research and development
(2.66)bn
(3.12)bn
(3.11)bn
(3.43)bn
(3.80)bn
(5.65)bn
Selling, general and administrative
(894)m
(1.07)bn
(920)m
(1.13)bn
(1.21)bn
(1.95)bn
Other operating items, net
(583)m
(14.0)m
(295)m
250m
(100)m
(567)m
Operating income
6.28bn
9.70bn
(5.75)bn
1.30bn
9.77bn
99.34bn
Interest income
37.0m
96.0m
468m
529m
496m
1.08bn
Interest expense
(183)m
(189)m
(388)m
(562)m
(477)m
(106)m
Other non operating, net
81.0m
(38.0)m
7.0m
(31.0)m
(135)m
(647)m
Income tax
(394)m
(888)m
(177)m
(451)m
(1.12)bn
(14.76)bn
Net income
5.86bn
8.69bn
(5.83)bn
778m
8.54bn
84.97bn
Diluted EPS, $
5.14
7.75
(5.34)
0.70
7.59
74.33
Diluted shares, bn
1.141
1.122
1.093
1.118
1.125
1.143
Fiscal years end on the Thursday closest to 31 August. FY2026 is from the unaudited release of 30 Sep 2026. Other operating items include restructure, impairments and patent license items: a $500m patent license charge in Q4 FY2026. FY2023 cost of goods sold includes $1.83bn of inventory write downs. Other non operating includes $511m of losses on debt prepayments in FY2026.
Table 2.2. What changed: FY2026 against FY2025 and Q4 FY2026 against Q4 FY2025
Full year
Q4
$
FY2025
FY2026
Change
Q4 FY2025
Q4 FY2026
Change
Revenue
37.38bn
133.19bn
256%
11.32bn
54.23bn
379%
Cloud Memory
13.52bn
43.09bn
219%
4.54bn
16.28bn
258%
Core Data Center
7.23bn
37.59bn
420%
1.58bn
18.00bn
1,042%
Gross margin
14.87bn
107.50bn
623%
5.05bn
47.05bn
831%
Research and development
3.80bn
5.65bn
49%
1.05bn
1.91bn
83%
Selling, general and administrative
1.21bn
1.95bn
62%
314m
859m
174%
Operating income
9.77bn
99.34bn
917%
3.65bn
43.75bn
1,097%
Net income
8.54bn
84.97bn
895%
3.20bn
37.70bn
1,078%
Operating cash flow
17.53bn
89.68bn
412%
5.73bn
43.97bn
667%
Expenditures for property, plant and equipment
15.86bn
30.71bn
94%
5.66bn
11.11bn
96%
Stock based compensation
975m
1.28bn
31%
262m
364m
39%
Gross margin, %
39.8%
80.7%
40.9 pts
44.7%
86.8%
42.1 pts
Core operating margin
26.4%
75.0%
48.6 pts
32.6%
81.6%
49.0 pts
Q4 FY2026 has 14 weeks and Q4 FY2025 13 weeks. Q4 FY2025 equals the full year less nine months. Expenditures for property, plant and equipment are before government incentives of $3.32bn in FY2026.
Table 2.3. Core earnings reconciliation
$
FY2025
FY2026
Net income, GAAP
8.54bn
84.97bn
Add: company non GAAP adjustments, net of tax
931m
1.79bn
Net income, company non GAAP
9.47bn
86.76bn
Less: stock compensation after tax
(862)m
(1.09)bn
Net income, core
8.61bn
85.67bn
Diluted EPS, GAAP, $
7.59
74.33
Diluted EPS, company non GAAP, $
8.29
75.52
Diluted EPS, core, $
7.65
74.95
Company non GAAP net income excludes stock compensation, patent license charges, losses on debt prepayments and related tax effects (Ex 99.1). Core earnings deduct stock compensation, taxed at the GAAP rate of 11.6% in FY2025 and 14.8% in FY2026. FY2026 core EPS is within 1% of GAAP EPS.
Table 2.4. Ratio analysis, FY2021 to FY2026
Ratio
FY2021
FY2022
FY2023
FY2024
FY2025
FY2026
Growth and profitability
Revenue growth
29.3%
11.0%
(49.5%)
61.6%
48.9%
256.3%
Gross margin
37.6%
45.2%
(9.1%)
22.4%
39.8%
80.7%
Operating margin
22.7%
31.5%
(37.0%)
5.2%
26.1%
74.6%
Core operating margin
24.8%
31.6%
(35.1%)
4.2%
26.4%
75.0%
Net margin
21.2%
28.2%
(37.5%)
3.1%
22.8%
63.8%
FCF margin
8.8%
10.1%
(39.4%)
0.5%
4.5%
44.3%
ROE
13.3%
18.5%
(12.4%)
1.7%
17.2%
88.3%
ROA
10.0%
13.9%
(8.9%)
1.2%
11.2%
61.0%
Cost structure
R&D / revenue
9.6%
10.1%
20.0%
13.7%
10.2%
4.2%
SG&A / revenue
3.2%
3.5%
5.9%
4.5%
3.2%
1.5%
SBC / revenue
1.4%
1.6%
3.6%
3.3%
2.6%
1.0%
Depreciation / revenue
22.4%
23.1%
49.9%
31.0%
22.3%
7.1%
Capex / revenue
36.2%
39.2%
49.4%
33.4%
42.4%
23.1%
Balance sheet and working capital
PP&E / assets
56.4%
58.2%
59.0%
57.3%
56.3%
32.3%
Days sales outstanding
70
61
57
96
90
99
Days inventory
95
144
181
166
136
147
Current ratio
3.10x
2.89x
4.46x
2.64x
2.52x
3.31x
Leverage
Debt / equity
0.15x
0.14x
0.30x
0.30x
0.27x
0.04x
Net debt / EBITDA
(0.28x)
(0.24x)
1.25x
0.48x
0.14x
(0.62x)
Interest coverage
37.5x
51.4x
n/a
1.9x
20.7x
942.5x
Valuation
EV / sales at year end
2.8x
1.9x
5.1x
4.4x
3.6x
7.6x
P/E at year end
14.3x
7.3x
n/a
137.5x
15.7x
12.9x
Price / book at year end
1.9x
1.2x
1.7x
2.4x
2.5x
7.8x
Core operating margin and EBITDA exclude other operating items. Returns use average equity and assets. Net debt deducts cash and short and long term investments. Year end valuation uses the traded close on the last trading day of August (one market data source) and, for FY2026, the close of 3 Sep 2026 on 1.13bn shares.
Table 2.5. Balance sheet, fiscal year end
$
FY2021
FY2022
FY2023
FY2024
FY2025
FY2026
Cash and investments
10.40bn
10.98bn
10.44bn
9.15bn
11.94bn
73.45bn
Receivables
5.31bn
5.13bn
2.44bn
6.62bn
9.27bn
36.20bn
Inventories
4.49bn
6.66bn
8.39bn
8.88bn
8.36bn
10.37bn
Property, plant and equipment
33.21bn
38.55bn
37.93bn
39.75bn
46.59bn
63.31bn
Total assets
58.85bn
66.28bn
64.25bn
69.42bn
82.80bn
195.89bn
Total debt
6.78bn
6.91bn
13.33bn
13.40bn
14.58bn
5.18bn
Net debt (net cash)
(3.62)bn
(4.07)bn
2.89bn
4.25bn
2.64bn
(68.27)bn
Shareholders equity
43.93bn
49.91bn
44.12bn
45.13bn
54.17bn
138.38bn
Shares outstanding, bn
1.119
1.094
1.098
1.109
1.122
1.129
Cash and investments include long term marketable investments ($30.02bn at 3 Sep 2026). FY2026 shares: 10-Q cover of 17 Jun 2026; Q4 weighted average 1.13bn basic, 1.15bn diluted (release).
Table 2.6. Funding and major uses of cash, FY2026
Period
Item
Amount
FY2026
Customer deposits received under supply agreements
$12.75bn
FY2026
Government incentives received
$3.32bn
FY2026
Debt repaid, including Apr 2026 tender offers for notes due 2031 to 2035
$(10.04)bn
Mar 2026
Tongluo fab bought from Powerchip
$(1.8)bn
FY2026
Purchases of available for sale securities
$(34.87)bn
FY2026
Dividends paid; quarterly dividend raised from $0.115 to 0.15 in Mar 2026
Micron guided Q1 FY2027 revenue to $61.5bn, plus or minus $1.5bn. It guided gross margin to about 85.95% GAAP and 86.25% non GAAP, and EPS to
$37.84 GAAP and $38.15 non GAAP, plus or minus $1.00. Releases guide one quarter ahead. Capital spending plans come from the 10-Q and the call.
Table 3.1. Recent quarters and guidance (earnings releases, Ex 99.1)
Item
Q1 FY2026
Q2 FY2026
Q3 FY2026
Q4 FY2026
Q1 FY2027 guide
Revenue
$13.64bn
$23.86bn
$41.46bn
$54.23bn
$60.0bn to 63.0bn
Revenue growth y/y
57%
196%
346%
379%
351% at midpoint
Guidance midpoint given a quarter earlier
$12.50bn
$18.70bn
$33.50bn
$50.00bn
n/a
DRAM / NAND revenue
$10.81bn / 2.74bn
$18.77bn / 5.00bn
$31.33bn / 9.94bn
n/a
n/a
Gross margin, GAAP / non GAAP
56.0% / 56.8%
74.4% / 74.9%
84.6% / 84.9%
86.8% / 87.0%
85.95% / 86.25%
Operating margin, non GAAP
47.0%
69.0%
81.2%
82.3%
82.9% implied
Diluted EPS, GAAP / non GAAP
$4.60 / 4.78
$12.07 / 12.20
$24.67 / 25.11
$32.87 / 33.42
$37.84 / 38.15
Adjusted free cash flow
$3.91bn
$6.90bn
$18.30bn
$33.20bn
n/a
Sources: 8-K 0000723125-25-000044, 0000723125-26-000004, 0000723125-26-000013 and 0000723125-26-000018. DRAM and NAND revenue from 10-Q filings. Adjusted free cash flow deducts net capital spending.
MD&A, FY2025 10-K. Revenue rose 49%. DRAM sales rose 62% on prices up in the low 40% range; NAND sales rose 18%. Gross margin was 40%, against 22% in FY2024.
MD&A, Q3 FY2026 10-Q. Micron states that AI driven demand for memory and storage is growing faster than industry supply and that it allocates supply among customers.
From Q2 to Q3 FY2026 DRAM prices rose in the low 60% range and NAND prices in the mid 80% range. Micron expects gross margin at the floor prices of its customer agreements to be well above its peak quarterly margin in any past cycle.
Capital spending. The 10-Q guided FY2026 spending to about $27bn net of government incentives; the actual figure was $27.37bn. The call gave about $25bn for H1 FY2027.
Earnings call, 30 Sep 2026 (summaries of prepared remarks and third party transcripts; no SEC filing). Management expects supply in calendar 2027 and 2028 to be tighter than in 2026. It cited 26 customer agreements covering over 35% of revenue through 2030, with $32bn of customer financial commitments and remaining performance obligations of about $150bn. It expects a tax rate of about 15.5% in FY2027.
Capital returns (call). Management plans higher returns from 9 Dec 2026 and a further buyback authorization. $2.16bn of the $10bn authorization remained at 28 May 2026.
Micron's FY2026 revenue growth of 256.3% compares with 175.3% at Sandisk, 95.8% at NVIDIA and 55.0% at Broadcom.
Its gross margin of 80.7% compares with 74.7% at NVIDIA and 71.5% at Sandisk. Its capital
spending of 23.1% of revenue compares with 21.2% at Intel and under 5% at the other six peers.
Memory competitors. The FY2025 10-K names Samsung, SK hynix, Kioxia, Sandisk, CXMT and YMTC. Samsung, SK hynix, Kioxia, CXMT and YMTC file no annual reports with the SEC, so Table 4.1 uses storage and chip companies that do.
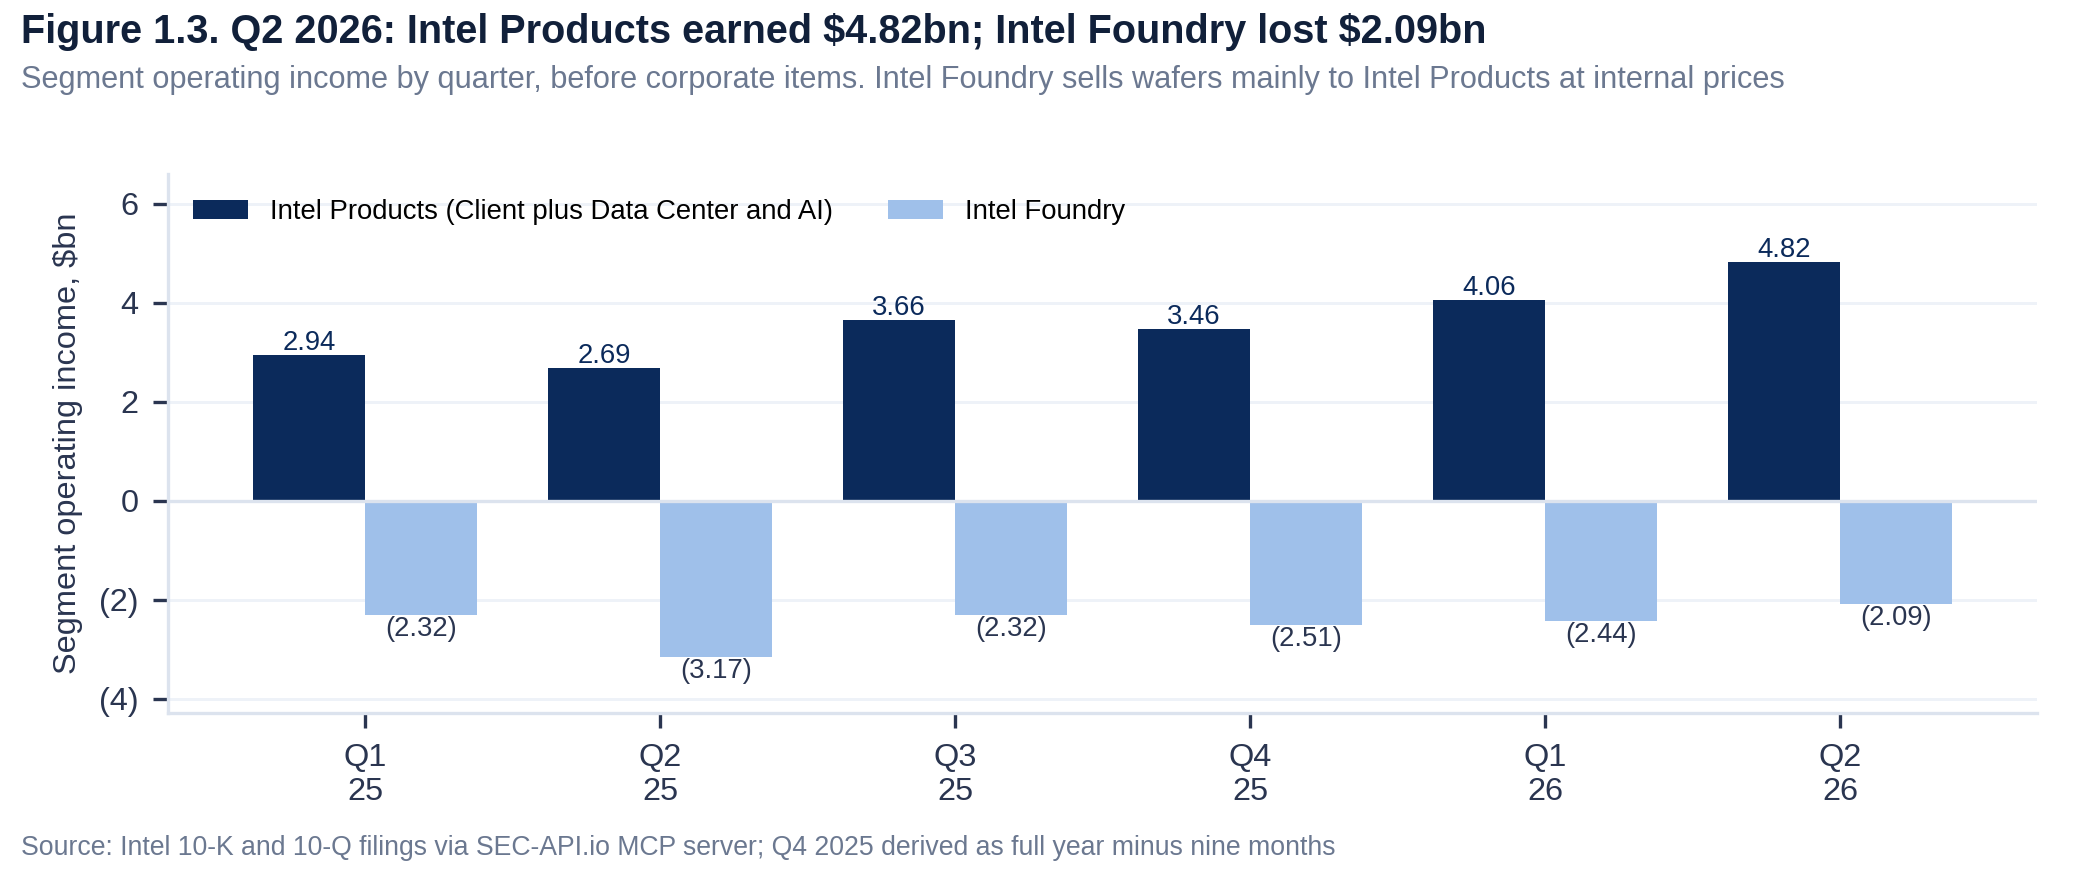
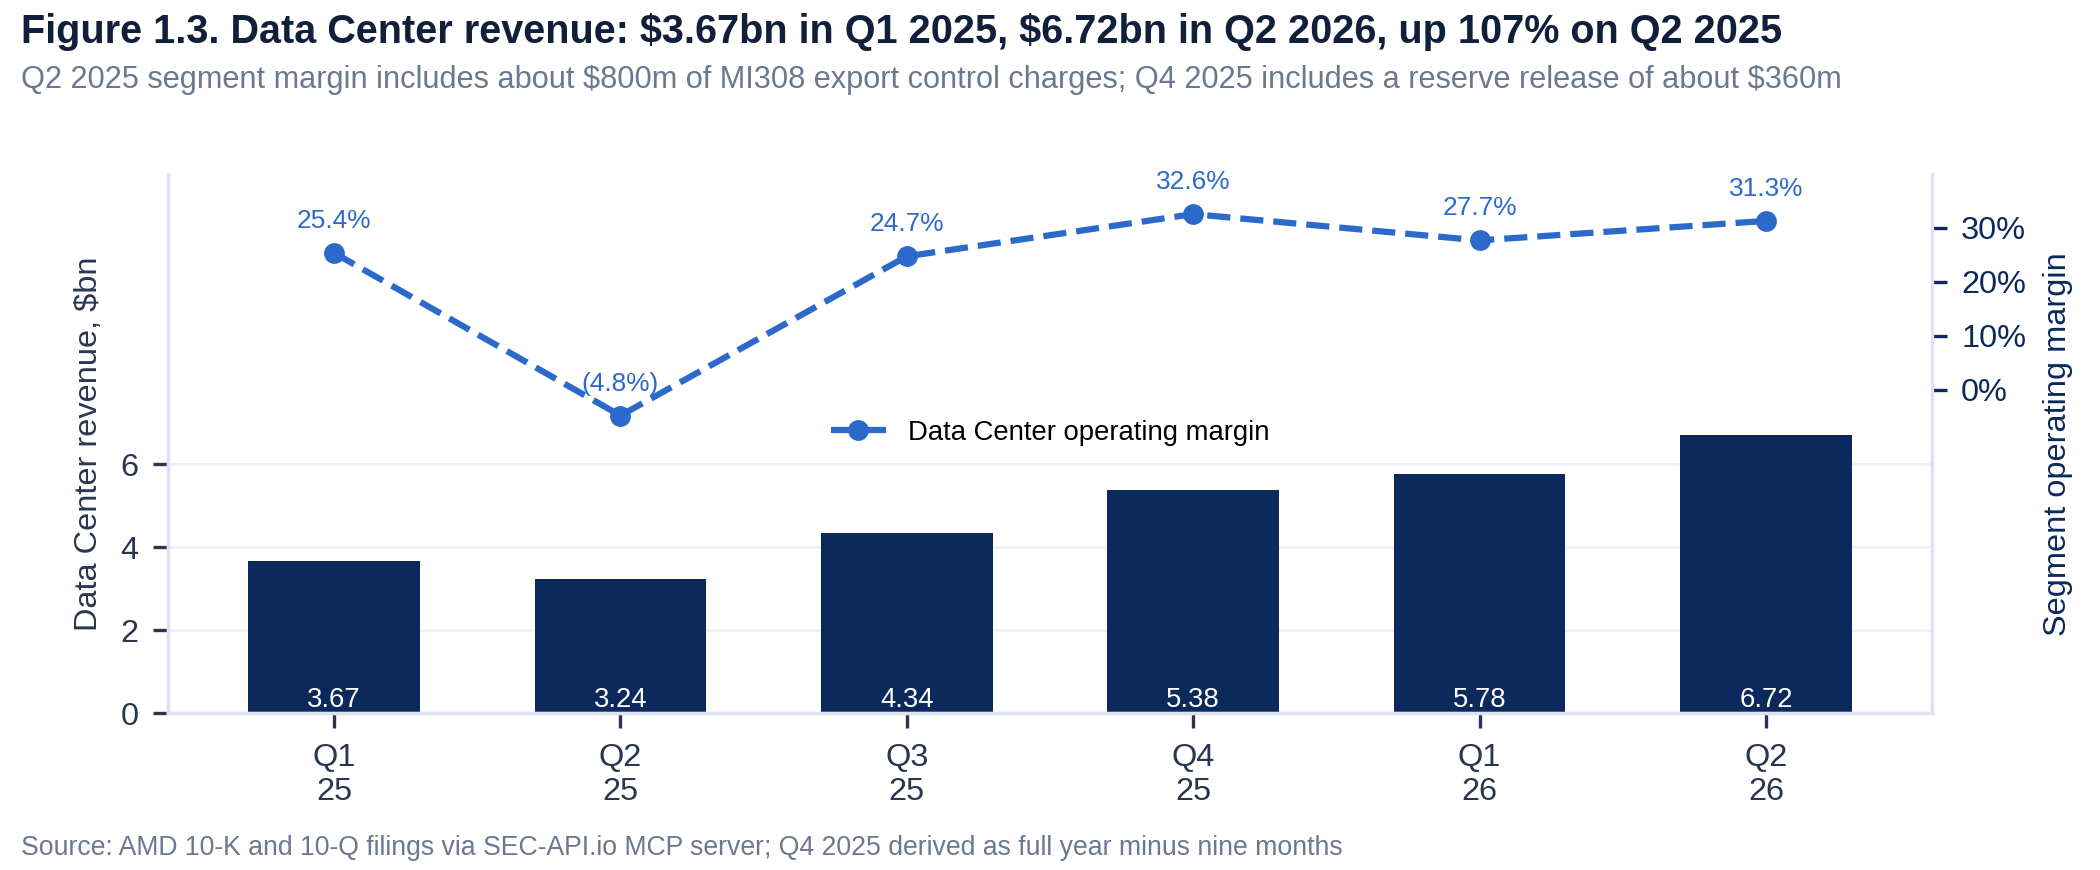
Supply. AMD's Q2 2026 10-Q reports an industry wide memory shortage and higher memory prices. Intel's Q2 2026 10-Q expects shortages of memory and other components to last into 2027.
Storage peers. Sandisk's FY2026 revenue (to 3 Jul 2026) rose 175% to $20.25bn with a 71.5% gross margin. Hard disk drive makers Western Digital and Seagate grew 36% and 34%.
Customer spending. Microsoft's capital spending rose from $64.6bn to $115.9bn in its year to Jun 2026. Alphabet spent $80.6bn in H1 2026, against $39.6bn in H1 2025 (10-K and 10-Q filings).
NVIDIA's Data Center revenue was $277.8bn in the twelve months to 26 Jul 2026.
Table 4.1. Peer comparison, latest twelve months reported; market data at 5 Oct 2026
Company
Year end
Revenue
Growth
Gross margin
Operating margin
FCF margin
Capex / revenue
Market cap, $
P/E
Micron
FY Aug
133.19bn
256.3%
80.7%
74.6%
44.3%
23.1%
1.20tn
14.3x
Sandisk
FY Jun
20.25bn
175.3%
71.5%
61.2%
56.8%
0.9%
249.5bn
23.1x
Western Digital
FY Jun
12.92bn
35.7%
48.9%
34.5%
27.2%
3.2%
159.2bn
18.2x
Seagate
FY Jun
12.20bn
34.1%
45.6%
33.6%
25.5%
4.7%
201.1bn
63.8x
NVIDIA
FY Jan
302.97bn
95.8%
74.7%
65.2%
41.9%
2.4%
5.77tn
30.2x
AMD
FY Dec
41.31bn
44.1%
53.2%
15.7%
20.3%
4.1%
1.03tn
162.0x
Intel
FY Dec
57.03bn
16.4%
38.6%
(0.1%)
5.0%
21.2%
610.5bn
n/a
Broadcom
FY Nov
89.10bn
55.0%
68.8%
48.0%
44.2%
1.4%
1.73tn
46.2x
Micron, Sandisk, Western Digital and Seagate: fiscal year 2026. NVIDIA, AMD, Intel and Broadcom: TTM to the latest 10-Q, with growth for the fiscal year to date. Market capitalization and P/E use closing prices of 5 Oct 2026 (market data) and filed diluted EPS; Intel has a TTM loss. Western Digital EPS includes $6.50bn of unrealized gains on its Sandisk stake. Sandisk makes its wafers in joint ventures with Kioxia, which lowers its capex.
From Oct 2025 to Sep 2026 Micron repaid $10.04bn of debt, signed multi year supply agreements with customers, bought a fab in Taiwan and raised its dividend.
Manish Bhatia and Scott DeBoer became presidents on 26 Aug 2026; Sanjay Mehrotra remains Chairman and CEO. The FY2026 10-K was not on file at 6 Oct 2026.
Table 5.1. FY2025 10-K items and Q3 FY2026 10-Q updates
Item
Content
Item 1, Business
Four business units since Q4 FY2025. DRAM was 76% and NAND 23% of FY2025 revenue. About 53,000 employees. One customer was 17% of revenue.
Item 1A, Risk factors
FY2025 against FY2024: 21 new and 41 reworded paragraphs (own text comparison). New text states that if HBM demand weakens and suppliers move capacity to standard DRAM, DRAM could be oversupplied and prices could fall. The 10-K also describes AI demand as hard to forecast.
Notes, incentives and commitments
Government incentives received: $2.01bn in FY2025 and $3.32bn in FY2026. CHIPS Act grants total up to $6.44bn. The agreements limit buybacks and special dividends for five years from Dec 2024.
Item 9A, Controls
Controls were effective at 28 Aug 2025; PricewaterhouseCoopers is the auditor.
Q3 FY2026 10-Q, Item 1A
8 new and 14 reworded paragraphs against the 10-K. New text covers the customer agreements: price ceilings can limit the benefit of further price rises, and commitments can reduce supply flexibility. It adds that long periods of high prices may lead customers to use less memory.
Q3 FY2026 10-Q, legal
Patent suits by Netlist, YMTC and others cover substantially all products. A $445m Netlist verdict of May 2024 is under appeal.
10-K 0000723125-25-000028; 10-Q 0000723125-26-000015; risk factor comparison against 10-K 0000723125-24-000027.
Table 5.2. Selected Form 8-K events, Dec 2024 to Sep 2026
Shareholders elected all eight directors and ratified the auditor. Say on pay received 95.1% support, up from 84.3% in 2025. A shareholder proposal to let holders of 10% of shares call a special meeting received 43.0%. Shares represented were 81.5% of the 1.13bn outstanding.
Board. Richard Beyer and Mary Pat McCarthy retired at the meeting. Alexis Black Bjorlin joined on 9 Jun 2026, which brings the board to nine. Sanjay Mehrotra is Chairman and CEO and Lynn Dugle is lead independent director.
MaryAnn Wright had the lowest support, 96.2%; Sanjay Mehrotra had 96.3%.
Pay. Sanjay Mehrotra's reported FY2025 pay was $30.9m, of which $25.4m was stock awards. Micron grants no stock options to named executives.
CEO pay ratio was 529 to 1 (proxy).
Table 6.1. Proposals and support (for as % of for plus against)
Proposal
Board view
2026
2025
Outcome
Say on pay
For
95.1%
84.3%
Approved
Ratify PricewaterhouseCoopers
For
93.7%
94.6%
Approved
Charter amendment on officer exculpation (2026)
For
89.7%
n/a
Approved
2025 Equity Incentive Plan (2025)
For
n/a
94.3%
Approved
Special meeting right at 10% of shares (shareholder, 2026)
Against
43.0%
n/a
Rejected
Broker non votes: 103.6m in 2026. The charter amendment needed a majority of shares outstanding and received 64.7%. Proponent of the shareholder proposal: John Chevedden. Sources: 8-K of 21 Jan 2026 and 21 Jan 2025.
Table 6.2. Director elections, support as % of for plus against
BlackRock and Vanguard each held about 9% of shares at 30 Jun 2026. Capital World Investors reduced its holding from 58.2m shares at 31 Dec 2025 to 29.5m at 30 Jun 2026 and reported 3.7% on Schedule 13G/A in May 2026.
Insiders sold $381.0m of stock in the twelve months to Oct 2026 and bought $7.82m.
Table 6.3. Largest holders, shares m (Form 13F)
Holder
30 Jun 2026
% of shares
31 Mar 2026
31 Dec 2025
Change since Dec 2025
BlackRock
104.8
9.3%
n/a
100.7
4.1%
Vanguard
98.3
8.7%
96.2
106.6
(7.8%)
State Street
50.1
4.4%
52.2
52.7
(5.1%)
Invesco
36.3
3.2%
35.7
35.1
3.6%
Capital World Investors
29.5
2.6%
42.1
58.2
(49.4%)
Geode Capital
27.7
2.5%
27.4
26.0
6.6%
FMR
26.7
2.4%
32.1
39.6
(32.5%)
JPMorgan Chase
25.8
2.3%
15.8
13.2
96.4%
PRIMECAP
19.2
1.7%
21.9
24.8
(22.5%)
Morgan Stanley
18.5
1.6%
16.8
16.4
12.6%
% of shares uses 1.13bn shares at 17 Jun 2026. n/a: filing not retrieved. Holders come from 22 large filers. Invesco includes amended filings. Vanguard changed filing entities in 2026.
Table 6.4. Insider transactions, Oct 2025 to Oct 2026, $m (Form 4)
Insider
Role
Transaction
Amount
Sanjay Mehrotra
Chairman and CEO
Sales, 317,500 shares, under a trading plan
(207.1)
April Arnzen
Chief People Officer
Sales, under a trading plan
(61.4)
Sumit Sadana
Chief Business Officer until Aug 2026
Sales
(34.9)
Mark Murphy
CFO
Sales, under a trading plan
(28.4)
Scott DeBoer
Technology and products
Sales, under a trading plan
(18.3)
Manish Bhatia
Operations
Sales
(10.4)
Teyin Mark Liu
Director
Purchases, 13 and 14 Jan 2026 at about $337
7.82
71 Form 4 and 1 Form 3 filings. Trading plan sales follow Rule 10b5-1 flags or footnotes. Shares withheld for tax on vesting: $144.4m. Forms 144 covered $393.1m of proposed sales in 33 notices.
EV to sales was 3.6x at the August 2025 close. It is now 8.5x FY2026 revenue and 4.6x
annualized Q1 FY2027 guidance of $246.00bn. Market capitalization is $1.20tn on 1.13bn shares, of which net cash is $60 per share.
Closing prices over 52 weeks ranged from $181.60 (10 Oct 2025) to $1,213.56 (25 Jun 2026).
Table 7.1. Fiscal year end valuation
Fiscal year
Market cap, $
Price, $
Diluted EPS, $
P/E
EV / sales
Price / book
FY21
82bn
73.70
5.14
14.3x
2.8x
1.9x
FY22
62bn
56.53
7.75
7.3x
1.9x
1.2x
FY23
77bn
69.94
(5.34)
n/a
5.1x
1.7x
FY24
107bn
96.24
0.70
137.5x
4.4x
2.4x
FY25
134bn
119.01
7.59
15.7x
3.6x
2.5x
FY26
1.08tn
958.16
74.33
12.9x
7.6x
7.8x
5 Oct 2026
1.20tn
1,063.96
74.33 FY26
14.3x
8.5x
8.7x
EV = market cap plus debt less cash and short and long term investments. FY2021 to FY2025 prices are traded closes on the last trading day of August, from one market data source; FY2026 is the close of 3 Sep 2026. Market cap on 5 Oct 2026 uses 1.13bn shares outstanding (10-Q cover, 17 Jun 2026); on the 1.15bn diluted shares of Q4 FY2026 it is $1.22tn. P/E is n/a for the FY2023 loss.
Scenarios start from FY2026 revenue of $133.19bn and Q1 FY2027 guidance. FY2029 core EPS is $29.76 (worst),
$86.94 (base) and $178.15 (best), against $74.95 in FY2026. Implied
values per share at end FY2029 are $298, $1,043 and $2,494. All scenario inputs are assumptions of this analysis.
Micron guides one quarter ahead, so revenue and margin paths after Q1 FY2027 have no filed guidance.
Table 8.1. Scenario assumptions, FY2027 to FY2029
Driver
Worst
Base
Best
Revenue FY2027 / FY2028 / FY2029, $bn
213 / 138 / 110
246 / 221 / 188
255 / 275 / 290
Revenue growth FY2027 / FY2028 / FY2029
60% / (35%) / (20%)
85% / (10%) / (15%)
91% / 8% / 5%
Core operating margin FY2027 / FY2028 / FY2029
76% / 50% / 35%
81% / 70% / 60%
82% / 80% / 78%
Diluted share count change a year
0%
(1%)
(2%)
Exit P/E on FY2029 core EPS
10x
12x
14x
Common to all
Starting point: FY2026 revenue $133.2bn and core operating margin 75.0%; Q1 FY2027 guidance of $61.5bn with an implied GAAP operating margin of 82.2%. Assumed: base case FY2027 revenue is four times the Q1 guidance midpoint; worst case is 2% below four times Q4 FY2026 revenue; best case is 1% above four times the top of the Q1 range. Exit P/E of 10x, 12x and 14x is assumed; P/E at fiscal year end was 7.3x to 15.7x in FY2021, FY2022, FY2025 and FY2026. Net interest and other income is held at $2.0bn a year, the annualized Q4 FY2026 level; tax rate 15.5% (call). Diluted shares start at 1.15bn, the guidance basis. Model EPS = (revenue x core margin plus $2.0bn) less tax, over diluted shares.
Table 8.3. Best case drivers: evidence to date and requirement
Factor
Evidence in filings and company materials
Best case requirement
Memory prices
DRAM prices rose about 140% and NAND prices about 130% in nine months of FY2026 (10-Q); Q4 gross margin 86.8%
Prices hold near Q4 FY2026 levels through FY2029
Customer agreements
Take or pay agreements with price floors; deposits of $12.90bn held; over 35% of revenue through 2030 (call)
Agreements are honored and extended; revenue reaches $290bn
Industry supply
Micron and competitors are building fabs; first output from Idaho and Tongluo in mid calendar 2027 (10-Q); management expects tight supply in 2027 and 2028 (call)
New capacity stays below demand growth
Customer spending on AI
Cloud Memory and Core Data Center were 61% of FY2026 revenue; Microsoft capital spending rose 79% and Alphabet H1 spending doubled (filings)
Data center spending keeps growing to FY2029
Margin
Core operating margin 75.0% in FY2026 and 81.6% in Q4; 31.6% in FY2022 and negative in FY2023
Core margin stays at 78% or above
Valuation multiple
P/E 14.3x FY2026 EPS and 7.0x annualized Q1 FY2027 guidance
Demand and price. Base case revenue is $246bn in FY2027, then is assumed to fall 10% and 15% as new capacity lowers prices. Best case holds revenue above the Q1 FY2027 run rate.
Worst case follows the FY2023 pattern, when revenue fell 49%: revenue falls 35% in FY2028 and 20% in FY2029.
Margin. The 10-Q states that a significant portion of manufacturing costs is fixed. FY2026 cost of goods sold rose 14% while revenue rose 256%. Base case core margin is assumed to fall from 81% to 60% as prices fall.
Worst case reaches 35% in FY2029; FY2022 was 31.6% and FY2023 a negative 35.1%.
Per share. Base case reduces the share count 1% a year. Buybacks are limited under the CHIPS Act agreements; management plans higher returns from Dec 2026 (call).
Excluded. Interest on cash built up after FY2026, acquisitions, impairments and legal outcomes. The sum of model EPS for FY2027 to FY2029 is $202, $354 and $506 per share.
Price and volume. A 10% change in FY2026 revenue at unchanged costs equals $13.3bn of operating income, $9.93 of EPS at the FY2026 tax rate (computed).
Capital spending. FY2026 spending was $30.71bn, 23.1% of revenue. The same amount would be 28% of worst case FY2029 revenue (computed).
Cash. Net cash of $68.27bn is $60 per share, 5.7% of market capitalization. Customer deposits of $12.90bn are liabilities to be earned through future supply.
Data. Financial statements from XBRL in the 10-K for FY2021 to FY2025 and 10-Q filings for Q1 FY2025 to Q3 FY2026, retrieved through the SEC-API.io
MCP server. Q4 FY2026 and FY2026 are from the unaudited earnings release (8-K Ex 99.1 of 30 Sep 2026). Q4 FY2025 equals full year less nine months.
Other sources. Earnings call of 30 Sep 2026 from summaries of Micron's prepared remarks and of third party transcripts; call figures are in no SEC filing. Peer data from peer filings. Market prices: 5 Oct 2026.
Definitions. FCF = operating cash flow less expenditures for property, plant and equipment. Core operating income = GAAP operating income before other operating items (restructure, impairments, patent license items); stock compensation stays a cost. Core EPS = company non GAAP net income less stock compensation after tax, over diluted shares. GAAP is close to core.
Scenario model. EPS = (revenue x core margin plus $2.0bn) x (1 less 15.5%) over diluted shares. Implied value = FY2029 EPS x exit P/E, undiscounted.
Table A.1. Annual, quarterly and proxy filings (central index key 723125)
Form
Period or event
Accession number
10-K
FY2021
0000723125-21-000065
10-K
FY2022
0000723125-22-000048
10-K
FY2023
0000723125-23-000054
10-K
FY2024
0000723125-24-000027
10-K
FY2025
0000723125-25-000028
10-Q
Q1 FY2025
0000723125-24-000047
10-Q
Q2 FY2025
0000723125-25-000009
10-Q
Q3 FY2025
0000723125-25-000021
10-Q
Q1 FY2026
0000723125-25-000046
10-Q
Q2 FY2026
0000723125-26-000006
10-Q
Q3 FY2026
0000723125-26-000015
8-K, Ex. 99.1
Q4 FY2026 and FY2026, unaudited
0000723125-26-000018
DEF 14A
Proxy statement for the Jan 2026 meeting
0000723125-25-000038
DEF 14A
Proxy statement for the Jan 2025 meeting
0000723125-24-000039
Table A.2. Forms 8-K
Form
Period or event
Accession number
8-K
30 Sep 2026, items 2.02, 9.01
0000723125-26-000018
8-K
26 Aug 2026, items 5.02, 9.01
0001104659-26-101067
8-K
24 Jun 2026, items 2.02, 9.01
0000723125-26-000013
8-K
9 Jun 2026, items 5.02, 9.01
0001104659-26-071845
8-K
1 Apr 2026, items 8.01, 9.01
0001104659-26-038249
8-K
25 Mar 2026, items 8.01, 9.01
0001104659-26-034174
8-K
18 Mar 2026, items 2.02, 9.01
0000723125-26-000004
8-K
21 Jan 2026, items 5.03, 5.07, 9.01
0001104659-26-005366
8-K
17 Dec 2025, items 2.02, 9.01
0000723125-25-000044
8-K
21 Oct 2025, items 5.02, 9.01
0001104659-25-101237
8-K
23 Sep 2025, items 2.02, 9.01
0000723125-25-000024
8-K
11 Aug 2025, items 7.01, 9.01
0001104659-25-075940
8-K
18 Jul 2025, items 5.03, 9.01
0001104659-25-069019
8-K
25 Jun 2025, items 2.02, 9.01
0000723125-25-000019
8-K
12 Jun 2025, items 8.01, 9.01
0001104659-25-058741
8-K
29 Apr 2025, items 1.01, 2.03, 8.01, 9.01
0001104659-25-041201
8-K
20 Mar 2025, items 2.02, 9.01
0000723125-25-000006
8-K
12 Mar 2025, items 1.01, 1.02, 2.03
0001104659-25-022973
8-K
5 Mar 2025, items 5.02, 9.01
0001104659-25-020878
8-K
21 Jan 2025, items 1.01, 1.02, 2.03, 5.02, 5.07, 9.01
0001104659-25-004879
8-K
16 Jan 2025, items 1.01, 2.03, 8.01, 9.01
0001104659-25-004100
8-K
18 Dec 2024, items 2.02, 9.01
0000723125-24-000046
8-K
10 Dec 2024, items 1.01, 7.01
0001104659-24-127174
8-K
30 Oct 2024, items 5.02, 5.03, 9.01
0001104659-24-112626
8-K
25 Sep 2024, items 2.02, 9.01
0000723125-24-000023
Table A.3. Schedules 13G
Form
Period or event
Accession number
SC 13G/A
Capital World Investors, 2026-05-14
0001422849-26-000099
SC 13G
Vanguard Capital Management, 2026-04-30
0002100119-26-000795
SC 13G/A
The Vanguard Group, 2026-03-27
0000102909-26-001910
SC 13G/A
Capital World Investors, 2026-02-13
0001422849-26-000035
SC 13G
Capital World Investors, 2025-08-13
0001422849-25-000059
Table A.4. Forms 13F
Form
Period or event
Accession number
13F-HR
Blackrock, Inc., period 2026-06-30
0002012383-26-003238
13F-HR
Blackrock, Inc., period 2025-12-31
0002012383-26-000920
13F-HR
Blackrock, Inc., period 2025-09-30
0002012383-25-002949
13F-HR
Vanguard Capital Management Llc, period 2026-06-30
0002100119-26-001527
13F-HR
Vanguard Portfolio Management Llc, period 2026-06-30
0002100121-26-001018
13F-HR/A
Vanguard Capital Management Llc, period 2026-03-31
0002100119-26-001311
13F-HR
Vanguard Portfolio Management Llc, period 2026-03-31
0002100121-26-000861
13F-HR
Vanguard Group Inc, period 2025-12-31
0000102909-26-000031
13F-HR
Vanguard Group Inc, period 2025-09-30
0000102909-25-000353
13F-HR/A
State Street Corp, period 2026-06-30
0000093751-26-000583
13F-HR
State Street Corp, period 2026-03-31
0000093751-26-000315
13F-HR
State Street Corp, period 2025-12-31
0000093751-26-000100
13F-HR
Invesco Ltd., period 2026-06-30
0000914208-26-000343
13F-HR
Invesco Ltd., period 2026-03-31
0000914208-26-000193
13F-HR/A
Invesco Ltd., period 2026-03-31
0000914208-26-000216
13F-HR
Invesco Ltd., period 2025-12-31
0000914208-26-000071
13F-HR/A
Invesco Ltd., period 2025-12-31
0000914208-26-000214
13F-HR
Capital World Investors, period 2026-06-30
0001422849-26-000113
13F-HR
Capital World Investors, period 2026-03-31
0001422849-26-000046
13F-HR
Capital World Investors, period 2025-12-31
0001422849-26-000010
13F-HR
Geode Capital Management, Llc, period 2026-06-30
0001214717-26-000008
13F-HR
Geode Capital Management, Llc, period 2026-03-31
0001214717-26-000006
13F-HR
Geode Capital Management, Llc, period 2025-12-31
0001214717-26-000003
13F-HR
Fmr Llc, period 2026-06-30
0000315066-26-002260
13F-HR
Fmr Llc, period 2026-03-31
0000315066-26-001390
13F-HR
Fmr Llc, period 2025-12-31
0000315066-26-000611
13F-HR
Fmr Llc, period 2025-09-30
0000315066-25-002929
13F-HR
Jpmorgan Chase & Co, period 2026-06-30
0000019617-26-000325
13F-HR/A
Jpmorgan Chase & Co, period 2026-03-31
0000019617-26-000225
13F-HR
Jpmorgan Chase & Co, period 2025-12-31
0000019617-26-000083
13F-HR
Primecap Management Co/Ca/, period 2026-06-30
0000763212-26-000028
13F-HR
Primecap Management Co/Ca/, period 2026-03-31
0000763212-26-000016
13F-HR
Primecap Management Co/Ca/, period 2025-12-31
0000763212-26-000012
13F-HR
Morgan Stanley, period 2026-06-30
0000895421-26-000243
13F-HR
Morgan Stanley, period 2026-03-31
0000895421-26-000183
13F-HR/A
Morgan Stanley, period 2025-12-31
0000895421-26-000187
Forms 3 and 4 with a period of report from Oct 2025 to Oct 2026 (71 accession numbers with reported transactions or holdings):0001201490-25-000007, 0001201490-26-000001, 0001201490-26-000002, 0001201490-26-000003, 0001218363-25-000007, 0001218363-26-000001, 0001218363-26-000002, 0001218363-26-000003, 0001218363-26-000004, 0001224095-25-000004, 0001224095-25-000006, 0001224095-26-000001, 0001224905-25-000006, 0001242654-25-000013, 0001242654-25-000015, 0001242654-25-000016, 0001242654-25-000017, 0001242654-25-000018, 0001242654-25-000019, 0001242654-26-000005, 0001242654-26-000009, 0001242654-26-000010, 0001242654-26-000011, 0001242654-26-000012, 0001242654-26-000013, 0001242654-26-000014, 0001242654-26-000015, 0001311079-25-000005, 0001311079-25-000006, 0001311079-26-000001, 0001311079-26-000002, 0001311079-26-000003, 0001354116-25-000005, 0001453368-25-000004, 0001453368-26-000001, 0001498287-25-000005, 0001498287-25-000006, 0001498287-25-000007, 0001498287-25-000009, 0001565570-25-000005, 0001568238-25-000004, 0001568238-25-000005, 0001593199-25-000005, 0001593199-25-000006, 0001593199-26-000001, 0001593199-26-000002, 0001593199-26-000003, 0001632063-25-000007, 0001632063-25-000011, 0001632063-26-000002, 0001632063-26-000003, 0001652149-25-000005, 0001652149-25-000006, 0001652149-26-000001, 0001652149-26-000002, 0001652149-26-000003, 0001652149-26-000004, 0001652149-26-000005, 0001689498-25-000004, 0001689498-26-000001, 0001790292-25-000005, 0001798757-26-000006, 0001798757-26-000007, 0001798757-26-000008, 0002058769-25-000006, 0002058769-26-000001, 0002058769-26-000002, 0002058769-26-000003, 0002058769-26-000004, 0002058769-26-000005, 0002058781-25-000005.
Table A.5. Peer and customer filings used
Company
Filing
Accession number
Sandisk
FY2026 10-K
0001628280-26-057406
Sandisk
FY2025 10-K
0002023554-25-000034
Western Digital
FY2026 10-K
0001628280-26-057139
Western Digital
FY2025 10-K
0000106040-25-000038
Seagate
FY2026 10-K
0001137789-26-000159
Seagate
FY2025 10-K
0001137789-25-000157
NVIDIA
FY2026 10-K
0001045810-26-000021
NVIDIA
FY2025 10-K
0001045810-25-000023
NVIDIA
Q2 FY2027 10-Q
0001045810-26-000075
AMD
FY2025 10-K
0000002488-26-000018
AMD
FY2025 10-K/A
0000002488-26-000021
AMD
FY2024 10-K
0000002488-25-000012
AMD
Q2 2026 10-Q
0000002488-26-000123
Intel
FY2025 10-K
0000050863-26-000011
Intel
FY2024 10-K
0000050863-25-000009
Intel
Q2 2026 10-Q
0000050863-26-000157
Intel
Q2 2026 8-K EX99
0000050863-26-000155
Intel
AUG 2026 OFFERING 8-K
0001193125-26-346806
Broadcom
FY2025 10-K
0001730168-25-000121
Broadcom
FY2024 10-K
0001730168-24-000139
Broadcom
Q3 FY2026 10-Q
0001730168-26-000080
Broadcom
Q4 FY2025 8-K EX99
0001730168-25-000116
Broadcom
Q1 FY2026 8-K EX99
0001730168-26-000011
Broadcom
Q2 FY2026 8-K EX99
0001730168-26-000051
Broadcom
Q3 FY2026 8-K EX99
0001730168-26-000076
Microsoft
FY2026 10-K
0001193125-26-323660
Alphabet
FY2025 10-K
0001652044-26-000018
Alphabet
Q2 2026 10-Q
0001652044-26-000071
Disclaimer: for information only, not financial advice. This report is not a recommendation to buy, sell or hold any
security. Figures come from SEC filings retrieved through the SEC-API.io MCP server and from sources named above. Scenario values follow
arithmetically from the stated assumptions. Consult a licensed adviser before investing.