Insights derived from analysing SEC filings. Independent analysis, not a publication of the SEC.
Figures come from Forms 10-K for FY2021 to FY2025, Forms 10-Q for FY2025 and FY2026, and Forms 8-K from Oct 2024 to Sep 2026 with their quarterly earnings exhibits 99.1. Other sources are proxy statements of 2025 and 2026, Schedules 13G, Forms 13F, Forms 4 and 144 and a Form S-3 filed under central index key 804328, and comparable filings of nine peers. The Sources appendix lists accession numbers of the filings used. Fiscal years end on the last Sunday of September. Share price is the close of 5 October 2026.
Handset revenue is falling and automotive revenue is growing. Q3 FY2026 revenue (to 28 Jun 2026) was $9.95bn, down 4%.
Handset chip revenue fell 20% to $5.09bn. Automotive rose 61% to $1.59bn and IoT rose 9% to
$1.83bn. Automotive and IoT were 40% of chip revenue, against 30% a year earlier. Q4 FY2026 guidance is $9.7bn to 10.5bn,
down 10% at the midpoint.
Margins fell. Core operating margin was 19.6% in Q3 FY2026, against 28.1% a year earlier and 28.6% in FY2025.
The 10-Q cites higher product costs, lower revenue and higher R&D. The Q3 release cites higher wafer, assembly, test, packaging and memory costs and states that Qualcomm is raising product prices.
Apple and memory supply reduce handset demand. The 10-Q states that Apple uses its own modem in certain smartphones and that this will have a significant negative effect on chip revenue.
It also states that memory supply constraints and price increases reduce demand from several handset makers. Inventory rose to $8.38bn from $6.53bn at FY2025 year end.
Data Center revenue is small today. Nonreportable segments, which hold Data Center, had revenue of $165m and a pre tax loss of $214m in Q3 FY2026.
Qualcomm bought Alphawave for $2.3bn and Modular for about $3.1bn. On 3 Sep 2026 it issued Amazon a warrant for up to 25.0m shares at $161.26. Shares vest as Amazon orders and buys
server chip products, up to $60bn of payments (8-K of 8 Sep 2026).
Shares trade at 15.9x TTM non GAAP EPS. TTM non GAAP EPS was $11.36. Core EPS, which counts stock compensation as a cost, was $8.83, a P/E of 20.5x at
$180.79. TTM GAAP EPS was $8.64. Dividend yield is 2.0%. Qualcomm bought back $6.81bn of stock in nine months, with $20.6bn still authorized at 28 Jun 2026.
Scenario values for end FY2029 are $65 (worst), $182 (base) and $301 (best) per share.
Current price is 34x worst case, 17x base case and 12x best case FY2029 core EPS. In the sensitivity analysis, the exit P/E, non handset revenue and core margin
move value the most.
Views on these results differ. Arguments for a lower valuation cite Apple's move to its own modems, lower handset demand, falling margins, 46% of FY2025 revenue from customers based in
China and license agreements that expire between FY2027 and FY2031. Arguments for a higher valuation cite automotive growth of 38% in nine months, the Amazon collaboration, the company target of
$40bn of non handset revenue by FY2029, a 73% pre tax margin in licensing and buybacks.
Qualcomm designs chips and licenses patents and reports three segments. QCT (Qualcomm CDMA Technologies) is the chip business: it sells Snapdragon processors, modems and radio chips for handsets, cars and IoT devices, a group that includes PCs and industrial equipment.
QTL (Qualcomm Technology Licensing) licenses cellular patents to device makers for a royalty on each device sold. QSI (Qualcomm Strategic Initiatives) holds venture investments. Handsets were 59% of TTM revenue,
automotive and IoT 27% and licensing 13%. Customers based in China were 46% of FY2025 revenue.
Customers. Apple, Samsung and Xiaomi each made up 10% or more of FY2025 revenue (10-K). Two customers were 24% and 20% of nine month FY2026 revenue.
Apple modem transition. Apple buys modems without Qualcomm application processors. The FY2025 10-K states that Apple began using its own modem and will increasingly do so.
On the Q3 FY2026 call, management forecast a fall of about 50% in Apple product revenue from the September quarter to the December quarter of 2026.
Licensing. License agreements with key device makers expire between FY2027 and FY2031 (10-K). QTL revenue has excluded Huawei royalties since Q2 FY2025.
Data center. Data Center is a nonreportable segment. Its revenue rose $182m in nine months, mainly from Alphawave (closed 18 Dec 2025). The 2026 proxy names HUMAIN as first customer for the AI200 and AI250 products.
The Q3 release targets non handset revenue of $40bn by FY2029.
Supply and people. Qualcomm is fabless except for some radio chips; TSMC, Samsung and GlobalFoundries are its main foundries. It had about 52,000 employees in Sep 2025.
Table 1.1. Revenue by QCT stream and segment
Revenue
FY2021
FY2022
FY2023
FY2024
FY2025
TTM
FY2025 y/y
9M FY2026 y/y
TTM share
QCT handsets
20.48bn
28.82bn
22.57bn
24.86bn
27.79bn
25.90bn
11.8%
(9.1%)
58.8%
QCT automotive
1.11bn
1.51bn
1.87bn
2.91bn
3.96bn
5.07bn
36.0%
38.3%
11.5%
QCT IoT
5.43bn
7.35bn
5.94bn
5.42bn
6.62bn
7.05bn
22.0%
9.0%
16.0%
QTL licensing
6.32bn
6.36bn
5.31bn
5.57bn
5.58bn
5.66bn
0.2%
1.9%
12.8%
Nonreportable and unallocated
227m
165m
132m
194m
335m
393m
72.7%
19.7%
0.9%
Total revenue
33.57bn
44.20bn
35.82bn
38.96bn
44.28bn
44.07bn
13.7%
(0.7%)
100.0%
TTM = Q4 FY2025 to Q3 FY2026. FY2021 and FY2022 streams as recast in the FY2023 10-K, without a separate radio frequency line. Nonreportable segments are Data Center and government services.
Table 1.2. Segment earnings before tax (EBT)
$
FY2021
FY2022
FY2023
FY2024
FY2025
TTM
QCT (chips)
7.76bn
12.84bn
7.92bn
9.53bn
11.67bn
10.86bn
QTL (licensing)
4.63bn
4.63bn
3.63bn
4.03bn
4.04bn
4.12bn
QSI (strategic investments)
916m
(279)m
(12.0)m
104m
180m
918m
Reconciling items
(3.03)bn
(2.19)bn
(4.10)bn
(3.32)bn
(3.23)bn
(4.68)bn
Income before tax, GAAP
10.27bn
15.00bn
7.44bn
10.34bn
12.66bn
11.21bn
QCT EBT margin
28.7%
34.1%
26.1%
28.7%
30.4%
28.6%
QTL EBT margin
73.2%
72.8%
68.4%
72.3%
72.4%
72.8%
Segment profit is EBT, the measure Qualcomm reports. Reconciling items hold stock compensation, unallocated R&D, interest expense and nonreportable segments. TTM QSI includes $768m of Q3 FY2026 gains.
Table 1.3. Revenue by customer headquarters
Country
FY2022
FY2023
FY2024
FY2025
FY2025 share
China (including Hong Kong)
18.98bn
13.39bn
17.83bn
20.34bn
45.9%
United States
10.50bn
10.50bn
9.69bn
10.52bn
23.7%
South Korea
9.67bn
8.08bn
8.00bn
9.54bn
21.5%
Other
5.06bn
3.86bn
3.46bn
3.89bn
8.8%
Based on the headquarters of the customer or licensee, as recast in the FY2024 and FY2025 10-K filings. The 10-K notes that devices may be sold in other countries. Revenue by country is disclosed once a year, in the 10-K.
Nine month FY2026 revenue fell 0.7% to $32.80bn. Handset revenue fell 9.1%, automotive rose 38.3% and IoT rose 9.0%.
GAAP operating income fell 22.6% to $7.30bn. Net income rose to $12.38bn from $8.66bn.
The rise came from a $5.7bn tax benefit in Q2 FY2026, which reversed a $5.7bn tax charge booked in Q4 FY2025.
Table 2.1. Income statement; TTM = Q4 FY2025 to Q3 FY2026
$
FY2021
FY2022
FY2023
FY2024
FY2025
TTM
Revenue
33.57bn
44.20bn
35.82bn
38.96bn
44.28bn
44.07bn
Cost of revenues
(14.26)bn
(18.64)bn
(15.87)bn
(17.06)bn
(19.74)bn
(20.17)bn
Gross profit
19.30bn
25.57bn
19.95bn
21.90bn
24.55bn
23.90bn
Research and development
(7.18)bn
(8.19)bn
(8.82)bn
(8.89)bn
(9.04)bn
(9.89)bn
Selling, general and administrative
(2.34)bn
(2.57)bn
(2.48)bn
(2.76)bn
(3.11)bn
(3.65)bn
Other (restructuring and other items)
0
1.06bn
(862)m
(179)m
(39.0)m
(136)m
Operating income
9.79bn
15.86bn
7.79bn
10.07bn
12.36bn
10.22bn
Interest expense
(559)m
(490)m
(694)m
(697)m
(664)m
(689)m
Investment and other income, net
1.04bn
(372)m
349m
962m
972m
1.68bn
Income tax
(1.23)bn
(2.01)bn
(104)m
(226)m
(7.12)bn
(1.95)bn
Net income
9.04bn
12.94bn
7.23bn
10.14bn
5.54bn
9.26bn
Diluted EPS, $
7.87
11.37
6.42
8.97
5.01
8.64
Diluted shares, bn
1.149
1.137
1.126
1.130
1.105
1.069
Fiscal years end on the last Sunday of September; FY2024 had 53 weeks. FY2022 Other is a $1.06bn gain from the reversal of a 2018 European Commission fine. FY2025 tax includes the $5.7bn valuation allowance charge; TTM tax includes both the charge and its release. TTM EPS is the sum of four quarters.
Table 2.2. What changed: FY2025 against FY2024 and 9M FY2026 against 9M FY2025
Full year
Nine months
$
FY2024
FY2025
Change
9M FY2025
9M FY2026
Change
Revenue
38.96bn
44.28bn
13.7%
33.01bn
32.80bn
(0.7%)
QCT handsets
24.86bn
27.79bn
11.8%
20.83bn
18.93bn
(9.1%)
QCT automotive
2.91bn
3.96bn
36.0%
2.90bn
4.02bn
38.3%
QCT IoT
5.42bn
6.62bn
22.0%
4.81bn
5.24bn
9.0%
QTL licensing
5.57bn
5.58bn
0.2%
4.17bn
4.25bn
1.9%
Gross profit
21.90bn
24.55bn
12.1%
18.31bn
17.66bn
(3.5%)
Research and development
8.89bn
9.04bn
1.7%
6.67bn
7.52bn
12.8%
Selling, general and administrative
2.76bn
3.11bn
12.7%
2.20bn
2.74bn
24.5%
Operating income
10.07bn
12.36bn
22.7%
9.44bn
7.30bn
(22.6%)
Net income
10.14bn
5.54bn
(45.4%)
8.66bn
12.38bn
43.0%
Operating cash flow
12.20bn
14.01bn
14.8%
10.02bn
8.41bn
(16.1%)
Free cash flow
11.16bn
12.82bn
14.9%
9.23bn
6.83bn
(26.0%)
Stock based compensation
2.65bn
2.78bn
5.1%
2.12bn
2.58bn
21.7%
Share repurchases
4.12bn
8.79bn
113.3%
6.35bn
6.81bn
7.2%
Dividends paid
3.69bn
3.81bn
3.2%
2.85bn
2.87bn
0.7%
Gross margin
56.2%
55.4%
(0.8) pts
55.5%
53.8%
(1.6) pts
Core operating margin
27.4%
28.6%
1.2 pts
28.9%
24.1%
(4.8) pts
Free cash flow = operating cash flow less capital expenditures. Nine month capital expenditures were $1.58bn, against $785m a year earlier.
Table 2.3. Core earnings reconciliation
$
FY2025
TTM
Operating income, GAAP
12.36bn
10.22bn
Add: QSI, acquisition, restructuring and other items
315m
816m
Operating income, core
12.67bn
11.04bn
Operating margin, core
28.6%
25.0%
Net income, GAAP
5.54bn
9.26bn
Add: company non GAAP adjustments, net of tax
7.76bn
2.97bn
Net income, company non GAAP
13.30bn
12.23bn
Less: stock compensation after tax
(2.17)bn
(2.72)bn
Net income, core
11.13bn
9.52bn
Diluted EPS, GAAP, $
5.01
8.64
Diluted EPS, company non GAAP, $
12.03
11.36
Diluted EPS, core, $
10.07
8.83
Company non GAAP results exclude QSI, stock compensation, acquisition items, restructuring and certain tax items (Ex 99.1 of each quarter). Core earnings deduct stock compensation, using the operating income and net income effects shown in each release. TTM EPS figures sum four quarters.
Table 2.4. Ratio analysis, FY2021 to FY2025 and TTM
Ratio
FY2021
FY2022
FY2023
FY2024
FY2025
TTM
Growth and mix
Revenue growth
n/a
31.7%
(19.0%)
8.8%
13.7%
1.9%
Handset share of QCT revenue
75.8%
76.5%
74.3%
74.9%
72.4%
68.1%
Automotive and IoT share of QCT revenue
24.2%
23.5%
25.7%
25.1%
27.6%
31.9%
Profitability
Gross margin
57.5%
57.8%
55.7%
56.2%
55.4%
54.2%
Operating margin
29.2%
35.9%
21.7%
25.8%
27.9%
23.2%
Core operating margin
30.1%
34.0%
25.1%
27.4%
28.6%
25.0%
Net margin
26.9%
29.3%
20.2%
26.0%
12.5%
21.0%
FCF margin
25.8%
15.5%
27.5%
28.6%
28.9%
23.6%
ROE
90.9%
92.5%
36.5%
42.4%
23.3%
33.8%
ROA
21.9%
28.7%
14.5%
19.1%
10.5%
16.5%
Cost structure
R&D / revenue
21.4%
18.5%
24.6%
22.8%
20.4%
22.4%
SG&A / revenue
7.0%
5.8%
6.9%
7.1%
7.0%
8.3%
SBC / revenue
5.0%
4.7%
6.9%
6.8%
6.3%
7.4%
Capex / revenue
5.6%
5.1%
4.0%
2.7%
2.7%
4.5%
Balance sheet and working capital
Goodwill and intangibles / assets
21.1%
25.3%
23.6%
21.8%
24.9%
27.5%
Days sales outstanding
39
47
32
37
36
39
Days inventory
83
124
148
137
121
152
Current ratio
1.68x
1.75x
2.33x
2.40x
2.82x
2.02x
Leverage and returns
Debt / equity
1.58x
0.86x
0.71x
0.56x
0.70x
0.55x
Net debt / EBITDA
0.29x
0.54x
0.38x
0.11x
0.33x
0.55x
Interest coverage
18.1x
30.6x
12.9x
15.3x
19.1x
16.0x
Shareholder returns / FCF
74%
93%
65%
70%
98%
126%
Valuation
EV / sales at year end
4.4x
3.1x
3.6x
4.9x
4.1x
4.5x
P/E at year end
16.4x
9.9x
17.3x
19.0x
33.2x
20.9x
P/E on core EPS at year end
17.3x
10.1x
16.8x
20.1x
16.5x
20.5x
Returns use average equity and assets. EBITDA = core operating income plus depreciation and amortization. Interest coverage = core operating income over interest expense. Year end valuation uses the close of the last trading day of September; TTM uses 5 Oct 2026 and 1.07bn shares. TTM growth is measured against Q4 FY2024 to Q3 FY2025.
Table 2.5. Balance sheet, period end
$
FY2021
FY2022
FY2023
FY2024
FY2025
28 Jun 2026
Cash and marketable securities
12.41bn
6.38bn
11.32bn
13.30bn
10.16bn
8.30bn
Accounts receivable
3.58bn
5.64bn
3.18bn
3.93bn
4.32bn
4.67bn
Inventories
3.23bn
6.34bn
6.42bn
6.42bn
6.53bn
8.38bn
Goodwill
7.25bn
10.51bn
10.64bn
10.80bn
11.36bn
14.27bn
Total assets
41.24bn
49.01bn
51.04bn
55.15bn
50.14bn
57.37bn
Total debt
15.75bn
15.48bn
15.40bn
14.63bn
14.81bn
15.27bn
Net debt
3.33bn
9.10bn
4.07bn
1.33bn
4.66bn
6.97bn
Stockholders' equity
9.95bn
18.01bn
21.58bn
26.27bn
21.21bn
27.66bn
Shares outstanding, bn
1.125
1.121
1.114
1.113
1.074
1.057
FY2025 cash excludes $2.32bn restricted for the Alphawave purchase. Goodwill rose by $2.2bn on Alphawave. Equity fell in FY2025 on the tax charge and $8.79bn of buybacks. The Modular purchase closed after 28 Jun 2026.
Table 2.6. Note principal by fiscal year of maturity at 28 Jun 2026
Maturity
Principal
FY2027 (notes due May 2027)
2.00bn
FY2028
962m
FY2029
0
FY2030
1.70bn
After FY2030, to 2053
10.45bn
Total note principal
15.11bn
Total debt of $15.27bn also includes $498m of commercial paper. A $4.0bn revolving facility to Aug 2029 is undrawn. Remaining buyback authorization was $20.6bn. Quarterly dividend is $0.92.
Qualcomm guided Q4 FY2026 revenue to $9.7bn to 10.5bn, with QCT at $8.4bn to 9.0bn and QTL at $1.2bn to 1.4bn. It guided EPS to $1.22 to 1.42 GAAP and
$2.05 to 2.25 non GAAP. Releases guide one quarter ahead. Segment margin guidance comes from the call. FY2029 targets come from company releases.
Table 3.1. Recent quarters and guidance (earnings releases, Ex 99.1)
Item
Q4 FY2025
Q1 FY2026
Q2 FY2026
Q3 FY2026
Q4 FY2026 guide
Revenue
$11.27bn
$12.25bn
$10.60bn
$9.95bn
$9.7bn to 10.5bn
Revenue growth y/y
10%
5%
(3%)
(4%)
(10%) at midpoint
QCT handsets
$6.96bn
$7.82bn
$6.02bn
$5.09bn
about $5.2bn (call)
QCT automotive / IoT
$1.05bn / 1.81bn
$1.10bn / 1.69bn
$1.33bn / 1.73bn
$1.59bn / 1.83bn
automotive up about 60% (call)
QTL revenue
$1.41bn
$1.59bn
$1.38bn
$1.28bn
$1.2bn to 1.4bn
EBT margin, QCT / QTL
29% / 72%
31% / 77%
27% / 72%
26% / 69%
23% to 25% / 68% to 72% (call)
Diluted EPS, GAAP / non GAAP
$(2.89) / 3.00
$2.78 / 3.50
$6.88 / 2.65
$1.87 / 2.21
$1.22 to 1.42 / 2.05 to 2.25
Operating cash flow
$4.00bn
$4.97bn
$2.45bn
$0.99bn
n/a
Buybacks and dividends
$3.40bn
$3.60bn
$3.74bn
$2.34bn
n/a
Sources: 8-K 0000804328-25-000084, 0000804328-26-000016, 0000804328-26-000060 and 0000804328-26-000085. Q4 FY2025 GAAP EPS includes the $5.7bn tax charge and Q2 FY2026 GAAP EPS its release. Operating cash flow and buybacks by quarter are derived from year to date cash flow statements.
MD&A, FY2025 10-K. Revenue rose 14% to $44.28bn. Handset revenue rose $2.9bn, of which $2.5bn came from higher revenue per chipset in premium Android devices.
Automotive rose 36% and IoT 22%. A $5.7bn tax charge followed the July 2025 tax act and cut net income to $5.54bn.
MD&A, Q3 FY2026 10-Q. Handset shipments fell as customers cut build plans to reduce inventory after memory supply constraints and price increases. Automotive revenue rose $381m on revenue per unit and $223m on shipments.
R&D rose $381m to $2.61bn, or 26% of revenue. Investment income of $1.01bn included $726m of gains on marketable securities.
Tax. In Q2 FY2026, IRS guidance on the corporate alternative minimum tax led Qualcomm to release the valuation allowance, a $5.7bn benefit.
Earnings call, 29 Jul 2026 (third party transcript). Management said handset revenue from Chinese makers reached its low point in Q3 and forecast double digit sequential growth in Q4. It said the share of new Apple launches
would be materially below its earlier 20% estimate. It forecast Data Center revenue of $5bn in FY2027, with first revenue from two custom chip customers in Q1 FY2027.
Targets. Q3 release (8-K): non handset revenue growth of 24% in FY2026 and more than 60% in FY2027, and $40bn of non handset revenue in FY2029. Investor Day release of 24 Jun 2026 (company release, no 8-K): FY2029 Data Center revenue above $15bn,
automotive $10bn, IoT above $14bn and non GAAP EPS above $18.
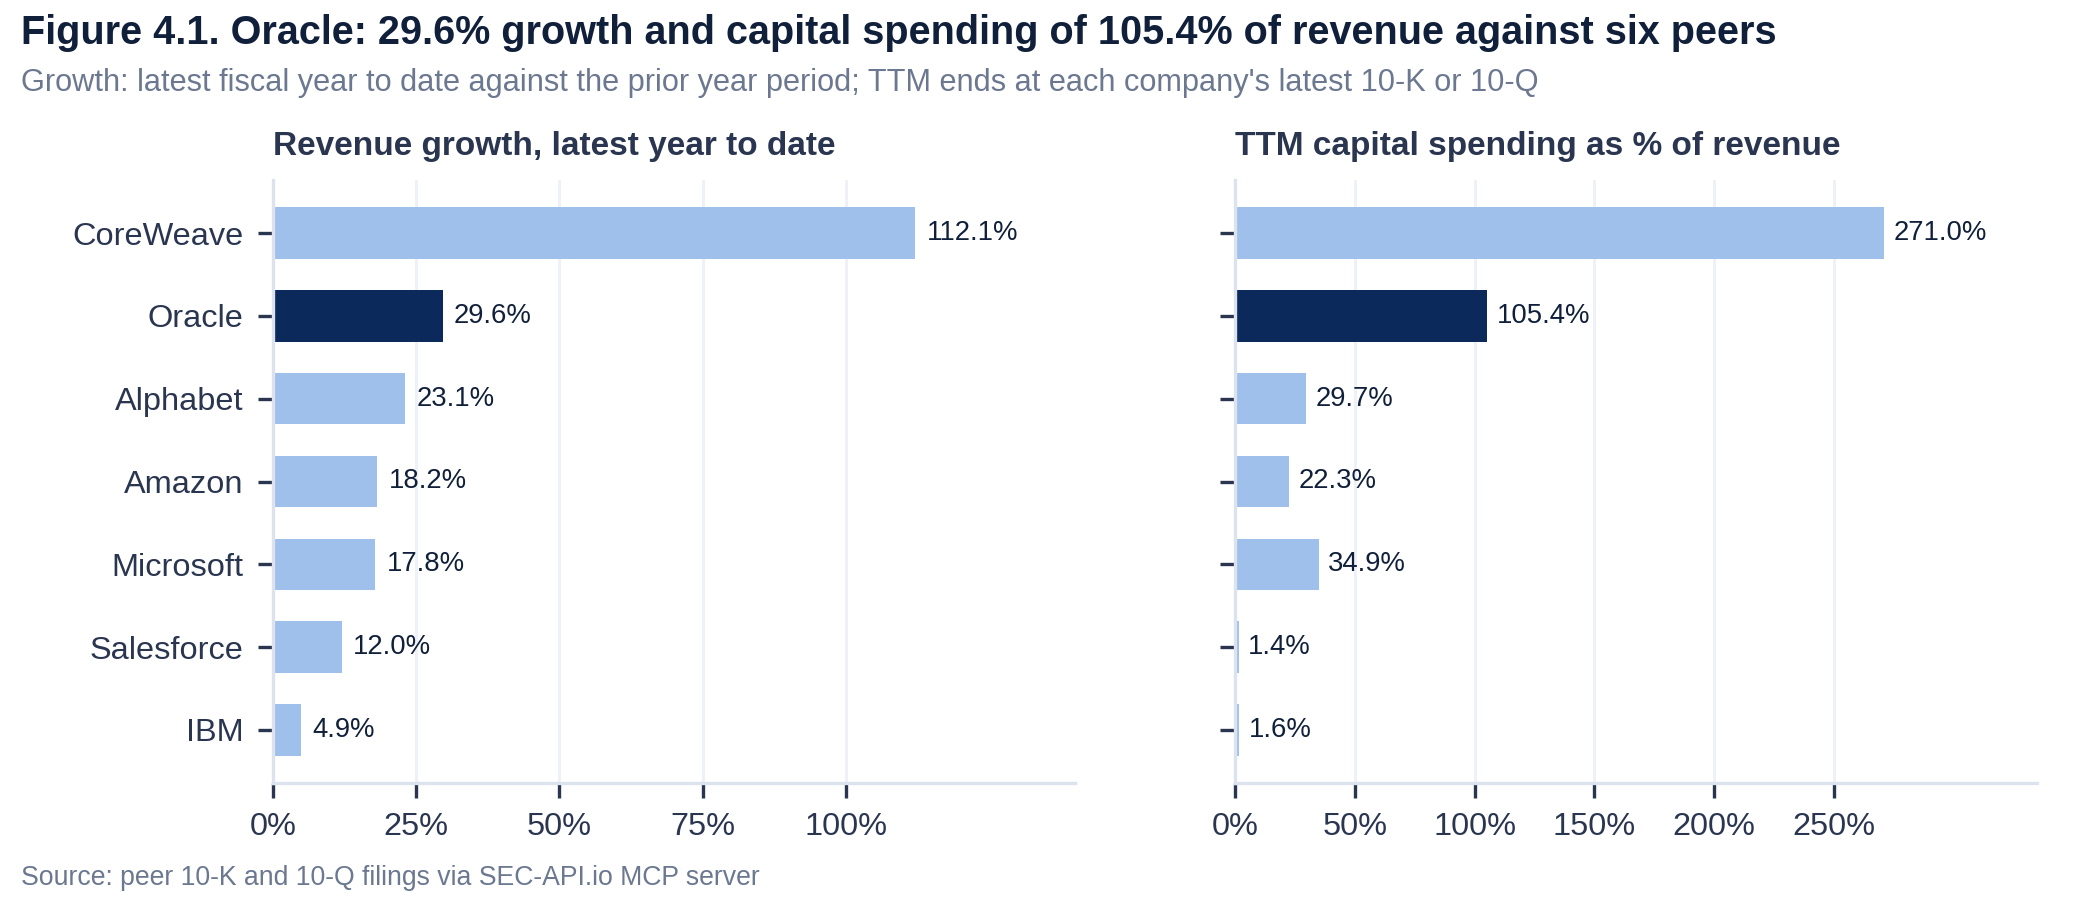
Qualcomm's year to date revenue change of (0.7%) compares with growth of 95.8% at NVIDIA, 55.0% at Broadcom and 44.1% at AMD.
Skyworks (2.4%) and Qorvo (4.2%), which sell radio chips to handset makers, also declined. Qualcomm's TTM gross margin of 54.2% compares with
53.2% at AMD and 68.8% at Broadcom.
AI data center demand. NVIDIA's data center revenue was $164.3bn in its first half to Jul 2026, against $80.2bn a year earlier (10-Q).
Broadcom reported AI revenue of $16.7bn in its quarter to Aug 2026 (8-K). Marvell's data center revenue rose 36.6% in its first half.
Qualcomm's nonreportable segments had $353m of revenue in nine months.
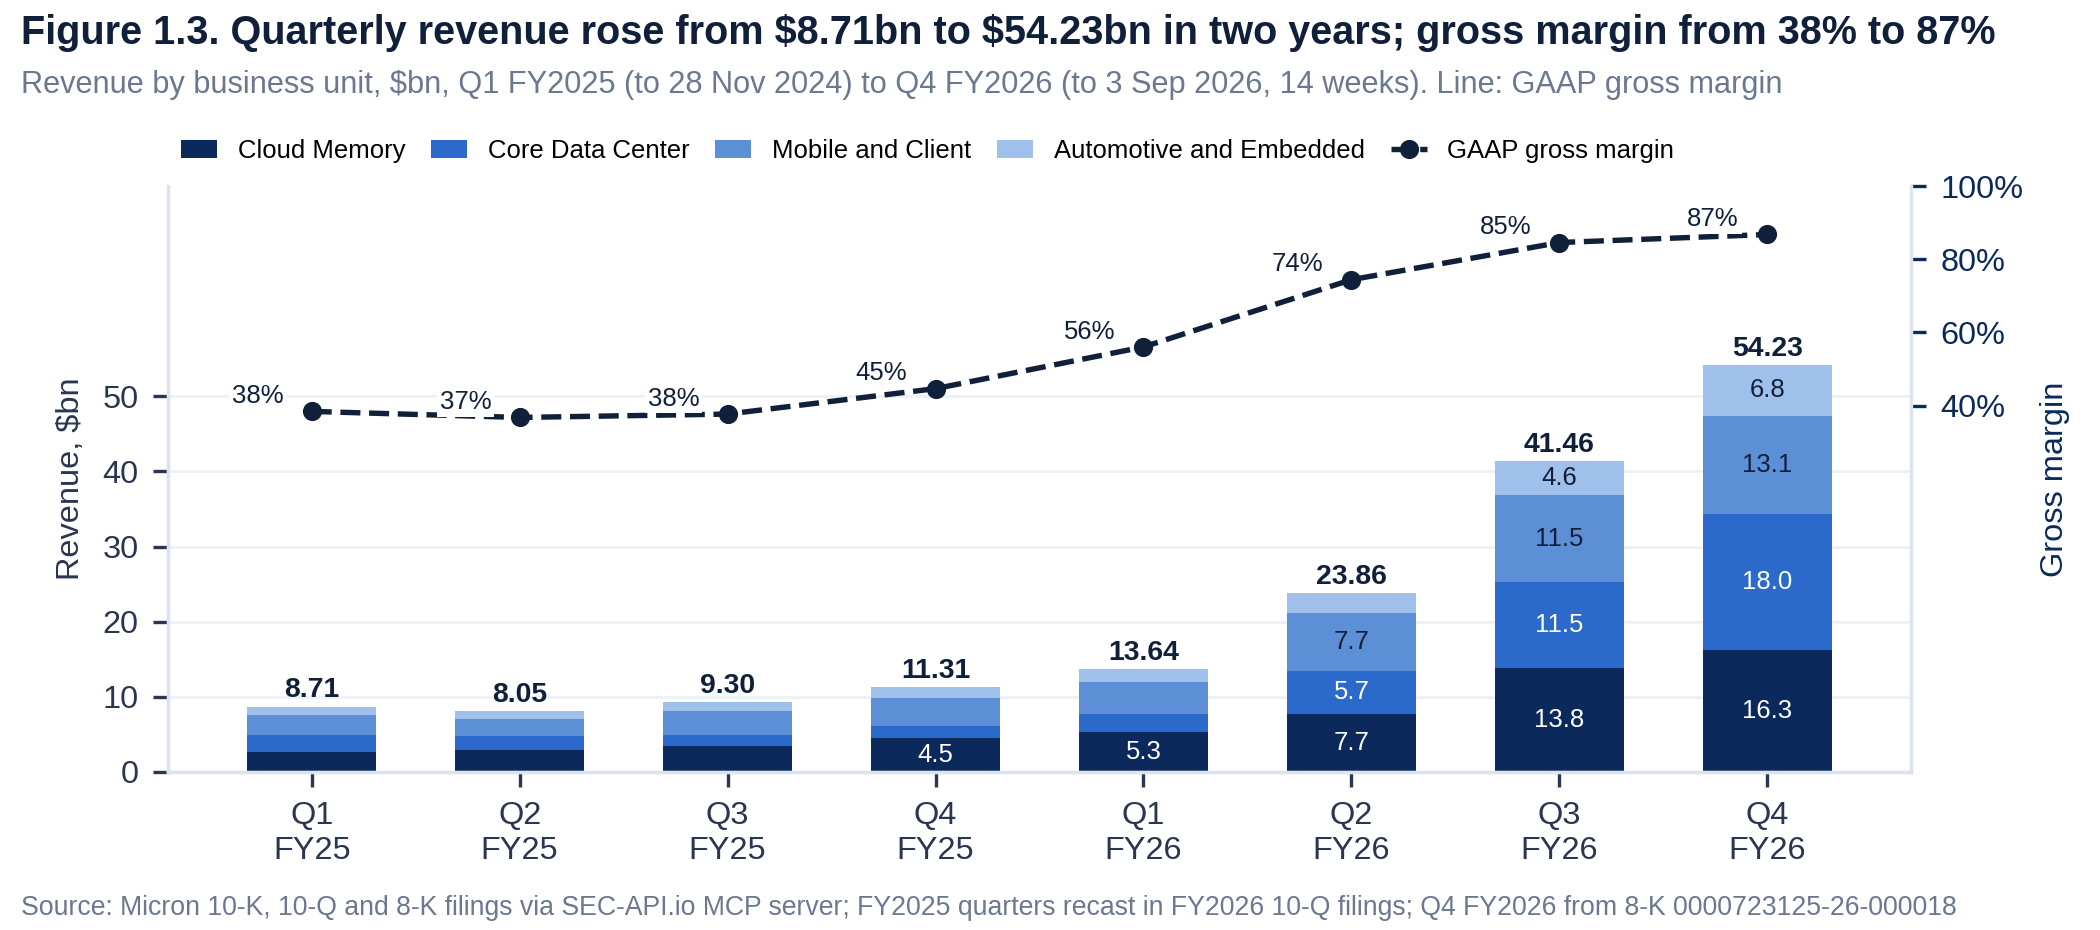
Memory. Micron's revenue for its year to 3 Sep 2026 rose 256% to $133.19bn at an 80.7% GAAP gross margin (8-K). Qualcomm's 10-Q names memory supply and prices as a cause of lower handset demand.
Competitors. The FY2025 10-K names Broadcom, HiSilicon, MediaTek, Mobileye, Nvidia, NXP, Qorvo, Samsung, Skyworks, Texas Instruments and UNISOC. It names Apple, Samsung and Xiaomi as customers that develop their own chips.
Arm. Arm licenses the processor designs used in Snapdragon chips and had revenue of $4.92bn in its year to Mar 2026, up 22.8% (20-F). A court upheld a jury verdict for Qualcomm on 30 Sep 2025 and Arm appealed.
The trial of Qualcomm's own claims against Arm was scheduled to begin on 5 Oct 2026 (10-Q).
Licensing margin. QTL was 13% of TTM revenue at a 73% EBT margin. QCT had a 28.6% EBT margin.
Table 4.1. Peer comparison, TTM to the latest 10-Q; market data at the close of 5 Oct 2026
Company
Year end
Revenue
Growth YTD
Gross margin
Operating margin
FCF margin
R&D / revenue
Market cap, $
P/E TTM
Qualcomm
FY Sep
44.07bn
(0.7%)
54.2%
23.2%
23.6%
22.4%
193.1bn
21x
Broadcom
FY Nov
89.10bn
55.0%
68.8%
48.0%
44.2%
13.3%
1.73tn
46x
NVIDIA
FY Jan
302.97bn
95.8%
74.7%
65.2%
41.9%
7.8%
5.77tn
30x
AMD
FY Dec
41.31bn
44.1%
53.2%
15.7%
20.3%
22.7%
1.03tn
162x
Intel
FY Dec
57.03bn
16.4%
38.6%
(0.1%)
5.0%
23.1%
610.5bn
n/a
Texas Instruments
FY Dec
19.45bn
20.8%
58.3%
37.3%
27.5%
10.7%
269.3bn
45x
Marvell
FY Jan
9.45bn
32.2%
52.2%
16.5%
18.3%
25.8%
237.9bn
90x
Skyworks
FY Sep
4.01bn
(2.4%)
40.7%
7.6%
10.8%
21.1%
12.6bn
44x
Qorvo
FY Mar
3.64bn
(4.2%)
48.2%
13.1%
17.8%
19.7%
10.1bn
27x
Arm
FY Mar
4.92bn
22.8%
97.5%
18.3%
19.9%
56.4%
322.3bn
356x
Growth compares the latest fiscal year to date with the prior year period. P/E uses filed TTM diluted EPS. Arm figures are for its year to Mar 2026 (20-F, US GAAP). Intel has a TTM loss.
In the year to Sep 2026 Qualcomm completed the Alphawave and Modular purchases, issued a warrant to Amazon, booked and reversed a $5.7bn tax charge and approved a $20bn buyback program.
It issued about 29m shares for the two purchases and bought back 42m shares in nine months.
Table 5.1. FY2025 10-K items and later filings
Item
Content
Item 1, Business
Three reportable segments (QCT, QTL, QSI) plus nonreportable Data Center and government services. About 52,000 employees. Purchase obligations were $15.1bn at FY2025 year end, of which $10.5bn was due within twelve months.
Item 1A, Risk factors
FY2025 against FY2024: 3 new and 18 reworded paragraphs (own text comparison). New: tariffs and trade policy, limits on Chinese suppliers, and AI and intellectual property. Reworded: Apple will increasingly use its own modems; Apple, Samsung and Xiaomi named as customers that develop their own chips.
Item 3, Legal proceedings
Arm v. Qualcomm: final judgment for Qualcomm on 30 Sep 2025; Arm appealed. Qualcomm v. Arm: trial scheduled to begin 5 Oct 2026 (Q3 FY2026 10-Q). ParkerVision patent case pending. Qualcomm recorded no accrual for these matters.
Item 9A, Controls
Controls were effective at 28 Sep 2025; PricewaterhouseCoopers is the auditor.
Q3 FY2026 10-Q
Risk factors are unchanged from the 10-K except that the paragraph on the OECD minimum tax was removed. MD&A adds memory supply constraints and a broad rise in input costs. No director or officer adopted or ended a Rule 10b5-1 plan in the quarter.
Form S-3, 2 Oct 2026
Registers resale of up to 25.0m shares issuable under the Amazon warrant. At 28 Sep 2026, 3.75m warrant shares had vested, Amazon had exercised none and 1.07bn shares were outstanding.
Table 5.2. Selected Form 8-K events, Jul 2025 to Sep 2026
Filed
Items
Event
8 Sep 2026
3.02
Warrant issued to an Amazon affiliate for up to 25.0m shares at $161.26, expiring 3 Sep 2036; shares vest with Amazon orders and purchases, up to $60bn of payments; 3.75m shares vested at issue
31 Jul 2026
8.01
Resale registration of 17.8m shares issued for Modular Inc; purchase closed 28 Jul 2026, valued at about $3.1bn
29 Jul 2026
2.02
Q3 FY2026 results: revenue $9.95bn (4% lower); non GAAP EPS $2.21; Q4 guidance $9.7bn to 10.5bn; FY2029 non handset revenue target $40bn
24 Jun 2026
3.02
Agreement of 21 Jun 2026 to acquire Modular Inc for up to 19.2m shares
29 Apr 2026
2.02
Q2 FY2026 results: revenue $10.60bn (3% lower); GAAP EPS $6.88 with a $5.7bn tax benefit; new $20bn buyback authorization
19 Mar 2026
5.07
Annual meeting results: 11 directors elected; say on pay approved; two stockholder proposals rejected
23 Form 8-K filings from Oct 2024 to Sep 2026; the Sources appendix lists all of them with accession numbers. At 6 Oct 2026 the latest Form 8-K is that of 8 Sep 2026 and the latest 10-Q that of 29 Jul 2026.
Shareholders elected all eleven directors and ratified the auditor. Say on pay received 91.8% support, against 89.5% in 2025. A stockholder proposal for a 10% special meeting threshold received
42.2%. Shares represented were 0.91bn of 1.07bn (computed from vote totals).
Board. Neil Smit and Christopher Young left the board at the meeting. Irene Rosenfeld had the lowest support, 92.7%; Cristiano Amon had 99.6%.
In Dec 2025 the board gave holders of 25% of shares the right to call a special meeting.
Pay. Cristiano Amon's reported pay was $29.7m in FY2025, $25.9m in FY2024 and $23.5m in FY2023.
Stock awards were $24.2m of the FY2025 total. CEO pay ratio was 292 to 1.
Table 6.1. Proposals and support (for as % of for plus against)
Proposal
Board view
2026
2025
Outcome
Say on pay
For
91.8%
89.5%
Approved
Ratify PricewaterhouseCoopers
For
92.1%
92.5%
Approved
Long term incentive plan, 24.0m more shares (2025: 22.95m)
For
93.6%
91.7%
Approved
Special meeting right at 10% (stockholder, 2026)
Against
42.2%
n/a
Rejected
Report on China exposure (stockholder, 2026)
Against
3.0%
n/a
Rejected
Protect retirement benefits (stockholder, 2025)
Against
n/a
11.9%
Rejected
Broker non votes: 159.3m in 2026. Proponents: John Chevedden and the Oklahoma Tobacco Settlement Endowment Trust. Sources: Forms 8-K of 19 Mar 2026 and 20 Mar 2025.
Table 6.2. Director elections, support as % of for plus withheld
Vanguard, BlackRock and State Street hold the three largest 13F positions, 23.7% of shares together at 30 Jun 2026.
Insiders sold $47.1m of stock in the twelve months to Sep 2026, all under Rule 10b5-1 plans. Forms 4 report zero open market purchases. Cristiano Amon sold $32.4m.
Table 6.3. Largest institutional holders from Form 13F, shares m
Holder
30 Jun 2026
% of shares
31 Mar 2026
31 Dec 2025
Change since Dec 2025
Vanguard
102.7
9.7%
103.5
114.1
n/a
BlackRock
95.2
9.0%
n/a
100.1
(5.0%)
State Street
52.8
5.0%
52.1
52.9
(0.3%)
Invesco
36.1
3.4%
35.2
36.7
n/a
Geode Capital
29.6
2.8%
29.7
28.9
2.6%
Charles Schwab
22.3
2.1%
30.9
6.6
236.5%
Morgan Stanley
17.1
1.6%
20.0
18.6
(8.1%)
Norges Bank
16.2
1.5%
n/a
15.1
7.0%
T. Rowe Price
12.6
1.2%
7.6
10.8
16.4%
Northern Trust
11.3
1.1%
11.8
12.1
(6.4%)
% of shares uses 1.06bn shares at 28 Jun 2026. n/a: filing not retrieved, or a change in reporting entities (Vanguard, Invesco). Holders selected from 37 large managers; Charles Schwab positions as filed. Schedules 13G: Vanguard Capital Management 7.51% at 31 Mar 2026; State Street 5% at 30 Jun 2026.
Table 6.4. Insider sales, Oct 2025 to Sep 2026, $m (Form 4)
Insider
Role
Sales
Of which 10b5-1
Shares withheld for tax
Cristiano Amon
President and CEO
32.43
32.43
11.51
Akash Palkhiwala
CFO and COO
8.18
8.18
4.31
Alexander Rogers
President, QTL
2.83
2.83
3.35
Heather Ace
Chief HR Officer
1.75
1.75
2.00
Ann Chaplin
General Counsel
1.28
1.28
2.54
Patricia Grech
Chief Accounting Officer
0.58
0.58
0.29
Total, all insiders
47.06
47.06
24.96
77 Form 4 filings. Shares withheld for tax on vesting awards are reported under code F and are separate from sales. Forms 144 covered $50.9m of proposed sales.
P/E on core EPS was 16.5x at FY2025 year end and is 20.5x now. EV is 4.5x TTM revenue and 4.7x
the FY2026 revenue estimate of $42.90bn. Market capitalization is $193bn on 1.07bn shares. TTM free cash flow is 5.4% of market capitalization.
The highest close in 52 weeks was $251.02 on 29 May 2026.
Table 7.1. Fiscal year end valuation (close of the last trading day of September)
Fiscal year
Market cap, $bn
Price, $
Diluted EPS, $
Core EPS, $
EV / sales
P/E on core EPS
FY21
145
128.98
7.87
7.46
4.4x
17.3x
FY22
127
112.98
11.37
11.15
3.1x
10.1x
FY23
124
111.06
6.42
6.63
3.6x
16.8x
FY24
189
170.05
8.97
8.46
4.9x
20.1x
FY25
179
166.36
5.01
10.07
4.1x
16.5x
5 Oct 2026
193
180.79
8.64 TTM
8.83 TTM
4.5x
20.5x
EV = market cap plus debt less cash and marketable securities. FY2025 GAAP EPS includes the $5.7bn tax charge. Year end prices are closes of the last trading day of September, derived from position values in Forms 13F; fiscal years end up to four trading days earlier. 5 Oct 2026 uses the balance sheet of 28 Jun 2026 and shares outstanding at 28 Sep 2026 (Form S-3).
Scenario inputs are assumptions of this analysis, set against filed figures and company targets. The model starts from the FY2026 revenue estimate of $42.90bn. FY2029 core EPS is $5.39 (worst),
$10.72 (base) and $15.06 (best), against an estimate of $7.73 for FY2026. Implied
values per share at end FY2029 are $65, $182 and $301.
Table 8.1. Scenario assumptions, FY2027 to FY2029
Driver
Worst
Base
Best
Non handset revenue FY2027 / FY2028 / FY2029, $bn
15.0 / 16.5 / 18.0
17.5 / 22.0 / 27.0
21.0 / 30.0 / 40.0
Handset revenue growth FY2027 / FY2028 / FY2029
(18%) / (8%) / (5%)
(10%) / (3%) / 0%
(6%) / 0% / 2%
QTL revenue growth a year
(4%)
0%
2%
Core operating margin FY2027 / FY2028 / FY2029
19% / 18% / 17%
22% / 23% / 24%
24% / 25% / 26%
Diluted share count change a year
(1%)
(2%)
(2%)
Exit P/E on FY2029 core EPS
12x
17x
20x
Common to all
FY2026 base year: revenue $42.9bn (nine months actual plus Q4 guidance midpoints): handsets $24.1bn, non handset products $13.2bn and QTL $5.55bn. Q4 handsets of $5.2bn come from the call. Core operating income $9.75bn (22.7%) is an estimate of this analysis: nine months actual plus $1.86bn for Q4. Q4 is derived from the guidance midpoints (non GAAP EPS $2.15, stock compensation effect $0.72 a share) with assumed 1.08bn diluted shares, a 12.5% tax rate and Q3 net interest. Scenario years: net interest and investment income $(0.33)bn a year (Q3 FY2026 non GAAP, annualized); tax rate 13% (Q4 FY2025 release: 13% to 14%); 1.08bn diluted shares at the start, including Modular shares and excluding the Amazon warrant. Non handset products are automotive, IoT, Data Center and other nonreportable revenue.
Demand. Best case follows the company targets for non handset revenue. Base case reaches $27bn in FY2029, about two thirds of the target. Worst case reaches $18bn, with growth of 11% a year from the FY2026 estimate.
Handset revenue falls in FY2027 in every case, by 6% to 18%, as Apple uses more of its own modems.
Margin. Core margin counts stock compensation (7.4% of TTM revenue) as a cost. On the call, management said custom data center chips would lower QCT gross margin by 1.5 to 2 points.
In the base case, core margin rises from 22.7% in FY2026 to 24% in FY2029. FY2025 core margin was 28.6%.
Per share. In the base case, buybacks reduce the share count by 2% a year. The count fell 3.5% in FY2025. Dividends are excluded from implied value.
Excluded. Acquisitions, QSI gains, legal outcomes, changes in export rules and one off tax items.
In Figure 9.1, 13 of 25 combinations of exit P/E and FY2029 core margin give a value at or above today's $180.79. At 11x, the highest value is $148. In Table 9.1, 13 of 25 combinations of non handset revenue and margin reach today's price at 17x.
Table 9.1. Value per share, end FY2029, by non handset revenue path and FY2029 core margin, 17x exit P/E
Margin \ Non handset revenue
60% of base
80% of base
100% of base
120% of base
140% of base
18%
107
121
135
150
164
21%
126
142
159
175
192
24%
145
163
182
201
220
27%
163
184
206
227
248
30%
182
205
229
253
276
Base non handset revenue: $17.5bn, 22.0bn and 27.0bn in FY2027 to FY2029. Shading: values at or above $180.79 in blue.
Amazon warrant. The warrant covers up to 25.0m shares at $161.26, of which 3.75m have vested; the rest vest as Amazon orders and buys. On a cashless exercise Qualcomm issues only shares equal to the gain. At $180.79, the vested part equals 0.4m new shares and the full warrant 2.7m, or 0.25% of shares outstanding. Scenario share counts exclude the warrant. At the best case value of $301, the full warrant equals 11.6m shares, 1.1% of the share count, which lowers that value to about $298 (computed).
Inventory. Inventory was 152 days of TTM cost of revenues at 28 Jun 2026, against 121 days at FY2025 year end.
Rates and debt. Notes of $2.0bn mature in May 2027. Interest rate swaps with a notional amount of $5.0bn convert fixed rate notes to floating rates.
Data. Financial statements from XBRL in the 10-K for FY2021 to FY2025 and 10-Q filings for Q1 FY2025 to Q3 FY2026, retrieved through the SEC-API.io
MCP server. Q4 FY2025 equals full year less the first nine months; quarterly cash flows are derived from year to date statements. FY2026 ended on 27 Sep 2026; its 10-K is pending.
Other sources. Earnings call of 29 Jul 2026 from a third party transcript; Investor Day targets from the company release of 24 Jun 2026. Peer data from peer filings.
Market prices: closes of 5 Oct 2026 for Qualcomm and peers; fiscal year end prices are derived from position values in Forms 13F for the last trading day of September.
Definitions. QCT = Qualcomm CDMA Technologies (chips). QTL = Qualcomm Technology Licensing. QSI = Qualcomm Strategic Initiatives. EBT = earnings before tax. FCF = operating cash flow less capital expenditures. Core operating income = company non GAAP operating income less stock compensation. This equals GAAP operating income before QSI,
acquisition items including acquired intangible amortization, restructuring and other items the company excludes. Core net income = non GAAP net income less stock compensation after tax. Net debt = debt less cash and securities.
Scenario model. EPS = ((handset, non handset and QTL revenue) x core margin less $0.33bn) x (1 less 13%) over diluted shares. Implied value = FY2029 EPS x exit P/E, undiscounted.
Disclaimer: for information only, not financial advice. This report is not a recommendation to buy, sell or hold any
security. Figures come from SEC filings retrieved through the SEC-API.io MCP server and from sources named above. Scenario values follow
arithmetically from the stated assumptions. Consult a licensed adviser before investing.