Financial analysis of Sandisk, August 2026
Sandisk turned a $1.6bn loss into $11.4bn of net income in twelve months without adding a single fab of its own. Almost all of it is price. The filings show what happens next depends on capacity decisions that two of its competitors, and Sandisk itself, committed to in the last sixty days.
Wafer cost barely moved. Net payments to the Kioxia joint venture were $3.6bn in fiscal 2026 against $3.4bn in each of fiscal 2025 and fiscal 2024, while revenue tripled to $20.2bn.
That is the bull case and the bear case in one sentence. Operating leverage this extreme runs backwards just as fast. Gross margin went 16.1% in fiscal 2024, to 30.1% in fiscal 2025, to 71.5% in fiscal 2026, and 84.6% in the fourth quarter alone. At $1,484.98 the stock trades on 20.1× trailing GAAP earnings and roughly 8× the annualised first-quarter fiscal 2027 guide. A single-digit forward multiple on record earnings is the market saying it does not believe these earnings repeat.
Two things make this cycle different from 2018 or 2022, and the bull case rests on both: ten New Business Model contracts covering more than half of fiscal 2027 bits at roughly 80% gross margin, backed by $5.0bn of third-party collateral, with two more signed after year end at an aggregate transaction price of $31.3bn; and supply that grows through node transitions rather than new wafer starts.
The second assumption broke in August. SK hynix listed on Nasdaq on 9 July, raised $26.5bn of primary equity earmarked for fabs, and told the SEC it intends to double wafer capacity within five years. Sandisk and Kioxia announced $31bn of Japanese capacity on 27 August, twenty-two days after Sandisk told investors it grows supply through node transitions rather than wafer additions.
Base case: fiscal 2027 EPS around $176, decaying to about $90 by fiscal 2029 as supply normalises. Cumulative three-year net income of $57bn equals 26% of today's market capitalisation. Bull case $106bn, or 49%. Bear case $26bn, or 12%. The distribution is wide, skewed, and governed almost entirely by NAND contract pricing.
1. What Sandisk sells and how it makes money
Sandisk separated from Western Digital on 21 February 2025 and began trading on Nasdaq on 24 February 2025. Western Digital distributed 116,035,464 shares, or 80.1%, at one-third of a Sandisk share per Western Digital share, retaining 19.9%. Sandisk paid Western Digital a $1.5bn net distribution funded by a $2.0bn Term Loan B. That loan is gone, repaid in full on 4 March 2026 with a $46m extinguishment charge.
The revenue engine
Sandisk is a vertically integrated NAND flash company that owns chip design, intellectual property, back-end assembly and test, firmware and systems engineering. It does not own a wafer fab. Every flash memory wafer it sells comes from Flash Ventures, three joint-venture entities with Kioxia, each 49.9% owned by Sandisk. Kioxia owns and operates eight fabs in Japan, six at Yokkaichi and two at Kitakami; Flash Ventures accounts for about 80% of the capacity in those buildings. Kioxia sells wafers to the ventures at cost; the ventures resell to each partner at cost plus a small markup, roughly 50/50.
Economics of the joint venture
- Sandisk pays variable cost on its own offtake and half of fixed cost regardless of what it takes. That is the operating leverage, in both directions.
- It funds 49.9% to 50.0% of Flash Ventures capital investment when joint-venture operating cash flow falls short.
- Its 49.9% share of joint-venture earnings runs through other income and expense, one quarter in arrears, not through gross profit. Fiscal 2026 equity loss in investees: $160m.
- Sandisk guarantees half of Flash Ventures' Japanese equipment lease obligations. Maximum guarantee exposure at 3 July 2026 was $923m, or ¥149bn. Total variable-interest-entity maximum loss exposure was $2,897m.
- All three joint ventures now co-terminate on 31 December 2034 after the January 2026 extension agreements. Sandisk Technologies additionally pays Kioxia $1.2bn across 2026 to 2029 for manufacturing services and supply availability, amortised into cost of revenue.
Routes to market and mix
- Datacenter, formerly Cloud: enterprise SSDs for hyperscalers, cloud service providers and private cloud. Fastest-growing, highest ASP.
- Edge, formerly Client: OEM and channel SSDs and embedded flash for PC, mobile, gaming, automotive, physical AI and industrial.
- Consumer: retail cards, USB drives and portable SSDs. Brand-led and the most price-elastic.
- International sales were 82% of fiscal 2026 revenue, against 80% in fiscal 2025 and 86% in fiscal 2024. Asia alone was $14.2bn.
- No customer exceeded 10% of revenue in any of the last three years. The top 10 customers were 44% of fiscal 2026 revenue, up from 40%. Concentration is rising through the datacenter shift: three customers were 19%, 12% and 10% of the $4.7bn receivable balance at year end.
- Sales incentives and price protection netted against gross revenue fell to 11% of gross revenue, from 19% in both prior years. That is a direct read on how tight the market is.
- Assembly and test runs in-house at Penang, Malaysia, through contract manufacturers, and through SDSS, 20% Sandisk and 80% JCET.
- Around 8,000 granted patents and 3,000 pending. About 11,100 employees across 33 countries, 74% in Asia-Pacific.
The New Business Model is the structural change. Beginning in fiscal 2026, Sandisk signed multi-year agreements committing it to deliver, and customers to buy, stated volumes. Pricing has fixed and variable components; the near term is more fixed, the out-years more variable. Customer obligations are backed by cash deposits, security deposits and third-party financial guarantees.
At 3 July 2026 contract liabilities were $1,242m, refund liabilities from security deposits $1,500m, and collateral held by third-party financial institutions $5.0bn, representing maximum proceeds on customer default. Ten agreements are signed with eight Datacenter and Edge customers, weighted-average duration above four years, covering more than 50% of fiscal 2027 bits at gross margins management describes as around 80%. Two further agreements signed after year end carry an aggregate transaction price of $31.3bn. This is the mechanism by which Sandisk is attempting to remove cyclicality from a structurally cyclical business.
2. Five-year financial record
Input cost did not move. Net payments to Flash Ventures for wafers and loans were $3.4bn, $3.4bn and $3.6bn across fiscal 2024 to fiscal 2026. Reported cost of revenue was $5,591m, $5,143m and $5,776m. Sandisk's input cost was essentially flat while revenue went from $6.7bn to $20.2bn. Roughly 97% of the $12.3bn of incremental gross profit came from price, not from volume or cost reduction. Management's own decomposition of fourth-quarter sequential growth: one-third volume, two-thirds price.
Figures for fiscal 2022 to fiscal 2024 are carve-out combined statements for the flash business of Western Digital, taken from the Form 10-12B/A of 27 January 2025. Fiscal 2025 and fiscal 2026 are consolidated. Fiscal 2026 was a 53-week year.
| Fiscal year | FY2022 | FY2023 | FY2024 | FY2025 | FY2026 | FY26 y/y |
|---|---|---|---|---|---|---|
| Revenue, net | 9,754 | 6,086 | 6,663 | 7,355 | 20,248 | +175% |
| Datacenter | 1,264 | 500 | 325 | 960 | 5,153 | +437% |
| Edge | 6,038 | 3,637 | 4,069 | 4,127 | 12,160 | +195% |
| Consumer | 2,452 | 1,949 | 2,269 | 2,268 | 2,935 | +29% |
| Cost of revenue | 6,510 | 5,656 | 5,591 | 5,143 | 5,776 | +12% |
| Gross profit | 3,244 | 430 | 1,072 | 2,212 | 14,472 | +554% |
| Gross margin | 33.3% | 7.1% | 16.1% | 30.1% | 71.5% | +4,140bp |
| Research and development | 1,362 | 1,167 | 1,061 | 1,132 | 1,328 | +17% |
| Selling, general and administrative | 666 | 558 | 455 | 573 | 676 | +18% |
| Goodwill impairment | — | 671 | — | 1,830 | — | n/m |
| Operating income (loss) | 1,200 | (2,035) | (468) | (1,377) | 12,389 | n/m |
| Operating margin | 12.3% | (33.4)% | (7.0)% | (18.7)% | 61.2% | n/m |
| Interest and other, net | 34 | 33 | (35) | (102) | 628 | n/m |
| Income tax expense | 170 | 141 | 169 | 162 | 1,584 | — |
| Net income (loss) | 1,064 | (2,143) | (672) | (1,641) | 11,433 | n/m |
| Net margin | 10.9% | (35.2)% | (10.1)% | (22.3)% | 56.5% | n/m |
| Diluted EPS, GAAP | n/a | n/a | (4.63) | (11.32) | 73.76 | n/m |
| Diluted EPS, non-GAAP | n/a | n/a | n/a | 2.99 | 70.88 | +2,270% |
| Total assets | n/d | 13,820 | 13,506 | 12,985 | 22,507 | +73% |
| Total equity | 12,977 | 11,439 | 11,082 | 9,216 | 15,736 | +71% |
| Operating cash flow | n/d | n/d | (309) | 84 | 11,671 | n/m |
| Capital expenditure, own PP&E | n/d | n/d | 166 | 204 | 177 | −13% |
| Net payments to Flash Ventures | n/d | n/d | 3,400 | 3,400 | 3,600 | +6% |
3. Ratio analysis
| Ratio | FY2022 | FY2023 | FY2024 | FY2025 | FY2026 | Read |
|---|---|---|---|---|---|---|
| Profitability | ||||||
| Gross margin | 33.3% | 7.1% | 16.1% | 30.1% | 71.5% | The amplitude of a memory cycle in five prints |
| Operating margin | 12.3% | (33.4)% | (7.0)% | (18.7)% | 61.2% | Operating expenses only 10.2% of revenue |
| Net margin | 10.9% | (35.2)% | (10.1)% | (22.3)% | 56.5% | Aided by an $808m Nanya mark and a 12% tax rate |
| Return on equity, average | n/d | n/m | n/m | n/m | 91.6% | Flattered by the asset-light joint-venture structure |
| Return on assets, average | n/d | n/m | n/m | n/m | 64.4% | The fabs sit off balance sheet at Kioxia |
| Return on invested capital | n/d | n/m | n/m | n/m | ~106% | NOPAT $10.9bn on ~$10.3bn average invested capital |
| R&D as % of revenue | 14.0% | 19.2% | 15.9% | 15.4% | 6.6% | Absolute R&D up 17%; the ratio collapses on revenue |
| Effective tax rate | 13.8% | (7.0)% | (33.6)% | (11.0)% | 12.2% | Malaysia holidays expire 2028–2031; CAMT from FY27 |
| Liquidity and leverage | ||||||
| Current ratio | n/d | n/d | n/d | 3.56× | 2.29× | The fall is NBM deposits and $1.29bn tax payable |
| Quick ratio | n/d | n/d | n/d | 1.79× | 1.70× | Cash $4.76bn plus receivables $4.71bn |
| Total debt | n/d | n/d | n/d | 1,849 | 0 | Term Loan B settled 4 Mar 2026 |
| Debt / equity | n/d | n/d | n/d | 0.20× | 0.00× | $1.5bn revolver undrawn |
| Net cash (debt) | n/d | n/d | n/d | (368) | +6,539 | Includes $1,777m of marketable equity in Nanya |
| Interest cover | 30× | n/m | n/m | n/m | 170× | Q4 interest expense was $2m |
| Flash Ventures guarantees | n/d | n/d | n/d | n/d | 923 | VIE maximum loss exposure $2,897m |
| Working capital and efficiency | ||||||
| Days sales outstanding | n/d | n/d | 48 | 51 | 48 | Improved despite receivables up 4.4× |
| Days inventory | n/d | n/d | 158 | 135 | 178 | WATCH Up 43 days on builds for NBM delivery |
| Days payable | n/d | n/d | (54) | (50) | (64) | Stretched 14 days |
| Cash conversion cycle | n/d | n/d | 152 | 136 | 162 | The longest of the three years disclosed |
| Inventory turns | n/d | n/d | 2.6× | 2.5× | 2.4× | Inventory $2.70bn, up 30% |
| Asset turnover | n/d | n/d | 0.49× | 0.56× | 1.14× | Doubled on price |
| Cash generation and capital return | ||||||
| Operating cash flow / revenue | n/d | n/d | (4.6)% | 1.1% | 57.6% | Q4 alone 79.5% |
| Operating cash flow / net income | n/d | n/d | n/m | n/m | 1.02× | Earnings are cash; there is no accrual gap |
| Free cash flow | n/d | n/d | (475) | (120) | 11,494 | 56.8% free cash flow margin |
| Adjusted free cash flow | n/d | n/d | n/d | 238 | 8,743 | After $2,476m NBM prepayments and $275m Flash Ventures |
| Capex intensity, own PP&E | n/d | n/d | 2.5% | 2.8% | 0.9% | Gross capex including the JV was ~6.3% of Q4 revenue |
| Buybacks | — | — | — | — | 4,524 | 3m shares at about $1,508 average |
The shape of the move
| Quarter | Q1 FY25 | Q2 FY25 | Q3 FY25 | Q4 FY25 | Q1 FY26 | Q2 FY26 | Q3 FY26 | Q4 FY26 | Q1 FY27E |
|---|---|---|---|---|---|---|---|---|---|
| Revenue, $m | 1,883 | 1,876 | 1,695 | 1,901 | 2,308 | 3,025 | 5,950 | 8,965 | 10,300–10,800 |
| Sequential growth | — | −0.4% | −9.6% | +12.2% | +21.4% | +31.1% | +96.7% | +50.7% | +18% |
| Gross margin, GAAP | 38.6% | 32.3% | 22.5% | 26.2% | 29.8% | 50.9% | 78.4% | 84.6% | 83.0–84.9% |
| Operating income, $m | 291 | 195 | (1,881) | 18 | 176 | 1,065 | 4,111 | 7,037 | — |
| Net income, $m | 211 | 104 | (1,933) | (23) | 112 | 803 | 3,615 | 6,903 | — |
| Non-GAAP diluted EPS | 1.81 | 1.23 | (0.30) | 0.29 | 1.22 | 6.20 | 23.41 | 39.25 | 44.00–46.00 |
| Datacenter, $m | 300 | 250 | 197 | 213 | 269 | 440 | 1,467 | 2,977 | — |
| Edge, $m | 1,069 | 1,028 | 927 | 1,103 | 1,387 | 1,678 | 3,663 | 5,432 | — |
| Consumer, $m | 514 | 598 | 571 | 585 | 652 | 907 | 820 | 556 | — |
The third quarter of fiscal 2025 includes the $1,830m goodwill impairment taken after the spin-off, when Sandisk's market capitalisation fell below its carrying value. The first quarter of fiscal 2026 was a 14-week quarter. End markets were renamed from Cloud, Client and Consumer to Datacenter, Edge and Consumer from the first quarter of fiscal 2026; the values are continuous.
Consumer is the leading indicator. Consumer revenue fell 32% sequentially in the fourth quarter and 5% year on year, while Datacenter rose 103% sequentially. Two forces point the same way: Sandisk is reallocating scarce bits to higher-value customers, and consumer demand is being destroyed by price. Management flagged mid-teens percentage unit declines in PCs and smartphones and conceded that the consumer addressable market has itself shrunk. Datacenter exited fiscal 2026 at 38% of bit mix, from roughly 12% a year earlier. For the full year, Consumer volumes fell mid-teens percent on an exabyte basis while revenue per gigabyte rose low-fifties percent. That is a market clearing on rationing, not on demand.
4. Where Sandisk sits in the NAND cycle
Contract pricing, the only variable that matters
| Quarter | 3Q25 | 4Q25 | 1Q26 | 2Q26 | 3Q26E |
|---|---|---|---|---|---|
| Blended NAND contract price | +5–10% | +5–10% | +55–60% | +70–75% | +10–15% |
| Enterprise SSD | — | — | +53–58% | — | — |
| Top-five vendor revenue, $bn | — | ~21.2 | 38.9 | 68.9 | — |
The rate of change has peaked. Sequential price gains went from 5–10% to 55–60% to 70–75% and then to a forecast 10–15%. Direction is still positive; the second derivative turned in the third quarter of 2026. TrendForce puts NAND in a 4–5% supply deficit for 2026 and expects the balance to turn positive in the second half of 2027, with significantly stronger bit supply growth in 2027 from layer migration and new fab ramps. Sandisk disagrees. Chief executive David Goeckeler said on the fourth-quarter call that NAND bits will remain on allocation beyond calendar year 2027. That disagreement is the investment case.
Vendor revenue share
| Vendor | 1Q26 rev, $bn | 1Q26 share | 2Q26 rev, $bn | 2Q26 q/q | 2Q26 share |
|---|---|---|---|---|---|
| Samsung Electronics | 13.51 | 31.6% | 23.06 | +70.7% | 29.3% |
| SK hynix, including Solidigm | 7.53 | 17.6% | 14.27 | +89.5% | ~18.1% |
| Micron Technology | 5.95 | 13.9% | 11.85 | +99.2% | ~15.0% |
| Kioxia | 5.96 | 13.9% | 10.72 | +79.9% | 13.6% |
| Sandisk | 5.95 | 13.9% | 8.965 | +50.7% | ~11.4% |
| YMTC | n/d | 13% rev | n/d | — | 14% bits |
Only the Samsung and Kioxia shares are stated by TrendForce for the second quarter of 2026; the rest are derived from the implied market total. TrendForce's Sandisk figures equal Sandisk's total reported revenue exactly, confirming that all Sandisk revenue is treated as NAND.
Sandisk grew slower than every peer in the second quarter of 2026, and that was deliberate. Its 50.7% against a top-five average of 77.0%. Sandisk had already committed more than half of its bits under fixed-and-variable NBM pricing while Micron, at 99.2%, and SK hynix, at 89.5%, repriced into spot. Sandisk gave up roughly 250 basis points of revenue share in one quarter. That is the explicit trade: cycle upside surrendered for a margin floor around 80% and pre-sold volume. Whether it was a good trade depends entirely on where prices go in 2028.
Peers that file with the SEC
SK hynix listed American depositary shares on Nasdaq on 9 July 2026 under the symbol SKHY, so the four largest listed NAND participants now all file with the SEC. Its figures below are converted from Korean won at the prospectus convenience rate of ₩1,523.5 to the dollar, are prepared under IFRS rather than US GAAP, and its net income includes ₩82.9tn of finance income in the first half of 2026 and is not an operating result. Its operating cash flow and capital expenditure are half-year figures because it does not publish a quarterly cash flow statement.
| Sandisk Q4 FY26 | SK hynix Q2 CY26 | Micron Q3 FY26 | Western Digital Q4 FY26 | Seagate Q4 FY26 | |
|---|---|---|---|---|---|
| Revenue | 8,965 | 52,064 | 41,456 | 3,747 | 3,629 |
| Gross profit | 7,582 | 43,316 | 35,056 | 2,028 | 1,898 |
| Gross margin | 84.6% | 83.2% | 84.6% | 54.1% | 52.3% |
| Operating margin | 78.5% | 76.3% | 80.4% | 41.7% | 43.0% |
| Net income | 6,903 | 61,649 | 28,243 | 3,195 | 1,294 |
| Operating cash flow | 7,126 | 60,218 | 25,388 | 1,389 | 1,305 |
| Capex / revenue | 0.5% | 13.9% | 18.9% | 2.9% | 5.2% |
| Total debt | 0 | 12,200 | 5,722 | 1,052 | 3,565 |
| Debt / equity | 0.00× | 0.07× | 0.06× | 0.12× | 1.65× |
| Net cash (debt) | +6,539 | +5,415 | +24,406 | +527 | (1,861) |
Sandisk's fourth-quarter gross margin matches Micron's and edges SK hynix's, all three about thirty points above the hard-disk makers. It carries the least debt of the four. Its 0.5% capex ratio is an artefact: wafer fab capital sits inside Flash Ventures, off Sandisk's balance sheet. The comparable figure management gave for the fourth quarter is gross capital expenditure of $562m, or 6.3% of revenue, guided to about 6% for fiscal 2027. Micron spends 18.9% of revenue on capex, and SK hynix 13.9%, because both are building capacity they own outright.
NAND like for like, from the filings
SK hynix reports one segment but discloses revenue by product category, so its NAND business can be compared with the whole of Sandisk directly.
| NAND revenue | FY2023 | FY2024 | FY2025 | Q1 CY2026 |
|---|---|---|---|---|
| SK hynix NAND, ₩bn | 9,653 | 19,274 | 20,690 | 11,574 |
| SK hynix NAND, $bn | 6.34 | 12.65 | 13.58 | 7.60 |
| Sandisk total revenue, $bn | 6.09 | 6.66 | 7.36 | 5.95 |
| SK hynix NAND market share, IDC | 19.6% | 21.4% | 20.9% | 18.5% |
Two independent sources agree to within 1%. SK hynix's filed NAND revenue for the first quarter of 2026 of ₩11,574bn converts to $7.60bn. TrendForce put SK hynix group NAND revenue at $7.53bn for the same quarter. The 0.9% gap validates both the TrendForce vendor series used throughout and the won conversion applied here. It also shows that SK hynix's NAND business alone was larger than all of Sandisk until fiscal 2026, and that Sandisk overtook it only in the year prices tripled.
The supply response is now on the record
Every bull case rests on bits staying scarce. In a sixty-day window, the partnerships that own most of the world's NAND capacity committed the capital that ends scarcity, and one of them registered the plan with the SEC.
| Date | Party | Amount | Commitment and first output |
|---|---|---|---|
| 29 Jun 2026 | SK hynix | ~₩80tn (~$52.5bn) | Preliminary plan for a new NAND fab at Cheongju, within a ~₩100tn complex plan. Cleanroom target first half of 2029. Subject to board and government determination. |
| 9 Jul 2026 | SK hynix | $26.5bn | Nasdaq listing at $149.00 per ADS, 177.9m ADSs, 100% primary. Proceeds earmarked for ₩45.5tn of Korean production capex plus ~₩11.9tn of EUV scanners for delivery by December 2027. |
| 22 Jul 2026 | SK hynix | ₩7.09tn (~$4.7bn) | P&T7 Cheongju advanced packaging investment raised and cleanroom opening accelerated. |
| 7 Aug 2026 | SK hynix | ₩19.1tn (~$12.5bn) | M17 Cheongju fab approved, period to April 2031. |
| 7 Aug 2026 | SK hynix | ₩35.2tn (~$23.1bn) | Yongin Y2 fab phases 1 to 6 approved, period to October 2031. |
| 27 Aug 2026 | Kioxia and Sandisk | >$31bn | Yokkaichi and Kitakami plants and related infrastructure through 2032, contingent on Japanese government support. Committed to meaningful, multi-year bit growth. No per-partner split or wafer capacity disclosed. |
Sandisk's own supply argument is contradicted by its own partner. Goeckeler told investors on 5 August that NAND will stay on allocation beyond calendar 2027 and that Sandisk grows supply primarily through nodal transitions rather than wafer additions. Twenty-two days later Sandisk co-announced $31bn of wafer additions. SK hynix raised $26.5bn of primary equity explicitly to build capacity and told the SEC it targets a capital-expenditure-to-sales ratio in the mid-30% range and intends to double wafer production capacity within five years. Node-led supply growth was the reason to believe this cycle was different. It is no longer the industry's plan. First output from the new Cheongju NAND fab is targeted for the first half of 2029, inside the fiscal 2029 column of every scenario below.
Two opposite answers to the same question
| Sandisk | SK hynix | |
|---|---|---|
| Customer contracts | Ten NBMs, weighted-average duration above four years, more than 50% of fiscal 2027 bits pre-sold at about 80% gross margin, $5.0bn of third-party collateral, $31.3bn of further agreements after year end. | None. Quantities and pricing are “typically determined through mutual agreement at the time of purchase.” Customers may reduce, delay or cancel orders at any time. Multi-year contracting exists only on the supplier side. |
| Capacity | Node transitions, no wafer additions, about 6% of revenue in capex, 49.9% of a joint venture it does not control. | Owned fabs, mid-30% capex-to-sales target, a stated plan to double wafer capacity in five years. |
| Q2 CY2026 outcome | NAND revenue up 50.7% sequentially. | NAND revenue up 89.5% sequentially; group revenue up 50.9%. |
| Capital return | $4.5bn repurchased at about $1,508; $15.5bn authorised. | ₩40.0tn (~$26.3bn) buyback for cancellation announced 19 Aug 2026; policy to return more than 50% of cumulative free cash flow across 2025 to 2027. |
| The trade | Gives up cycle upside for a contracted margin floor. Underperformed by roughly 39 points of sequential NAND growth in the strongest quarter on record. | Keeps all cycle upside and all cycle downside. Captured the quarter; carries the full reset. |
Both companies then make the identical argument for why the cycle is tamer than history suggests. Sandisk points to NBM coverage. SK hynix told the SEC that enterprise demand rising from 43.1% of the memory market in 2025 to a projected 51.9% in 2027 provides a more resilient demand base that will mitigate the historical cyclicality of the memory semiconductor market. The same registration statement retains the standard warning that the industry has experienced significant and sometimes prolonged periods of oversupply and weak prices.
Whose market forecast to use
| Source | CY2025 | CY2026 | CY2027 | Status |
|---|---|---|---|---|
| Gartner, filed by SK hynix | $68bn | n/d | $341bn | 424B4 registration statement; CAGR 123.7% |
| Sandisk management estimate | n/d | ~$300bn | ~$500bn | Q4 FY26 earnings call; company estimate, not third-party |
| Implied from TrendForce 2Q26 actual | — | ~$315bn | — | Top-five $68.9bn annualised |
The two forecasts agree on 2026 and diverge by 47% on 2027. Sandisk's $500bn sits far above the Gartner figure a competitor was willing to put in an SEC registration statement, where it carries liability. Gartner's own number implies NAND revenue roughly five times 2025 within two years, itself an extraordinary forecast. Anyone underwriting the bull case is underwriting the gap between these two lines.
5. Critical factors and core assumptions
| Factor | What is happening | Bull case requires | Bear case if it fails |
|---|---|---|---|
| 1. AI datacenter demand | Datacenter revenue up 437% to $5.15bn; 38% of exit bit mix from about 12%. Goeckeler: “AI is fundamentally a memory-centric storage-intensive problem.” | Hyperscaler storage capex compounds through 2027 and 2028 | One quarter of hyperscaler digestion removes the marginal buyer setting price for the whole market |
| 2. Supply discipline | Sandisk grows bits through nodal transitions, mid-teens in fiscal 2027. Suppliers had prioritised DRAM and HBM capex over NAND. That stopped in mid-2026. | Node-led supply growth stays in the mid to high teens and industry capex stays DRAM-weighted | BROKEN The capacity response is committed: SK hynix's ~$52.5bn Cheongju NAND fab, $26.5bn of primary equity raised, a plan to double wafer capacity, and $31bn from Kioxia and Sandisk |
| 3. NBM coverage | Ten agreements, eight customers, more than four years weighted duration, over 50% of fiscal 2027 bits, about 80% gross margin, $5.0bn collateral, $31.3bn signed after year end. | Contracts hold through a downturn and set an earnings floor | Untested in a price collapse. If spot falls far below contract, customers renegotiate or default. Collateral limits loss; it does not preserve revenue. |
| 4. Kioxia relationship | All wafers from Flash Ventures. Extended to 31 December 2034. $1.2bn payable to Kioxia. Guarantees $923m, VIE exposure $2,897m. Kioxia is also a direct competitor at 13.6% share. | Alignment on the BiCS 8 and BiCS 10 ramps and on capacity restraint | Kioxia is a listed company with its own shareholders demanding share. A capacity race between partners would compress margins for both. |
| 5. Technology transitions | BiCS 8 ramped to the majority of fiscal 2026 bit production. BiCS 10 next. High-bandwidth flash: NAND late in 2026, controller and system early to mid 2027. | High-bandwidth flash creates a differentiated product with its own pricing power | It slips or fails to differentiate and Sandisk stays a commodity bit supplier |
| 6. Demand elasticity | Consumer down 32% sequentially. Mid-teens unit declines expected in PC and smartphone. The CFO conceded the consumer addressable market has shrunk. | Datacenter absorbs every bit freed by consumer weakness at higher margin | Demand destruction spreads from Consumer into Edge, which is 60% of fiscal 2026 revenue |
| 7. Capital returns | $4.5bn repurchased at about $1,508 average. $15.5bn remaining. Zero debt. No dividend. | The buyback shrinks the share count into a rising earnings stream | Buying back stock at a cycle peak destroys value. Fiscal 2026 purchases are already above the current price. |
| 8. Tax and trade | Fiscal 2026 effective rate 12%. The corporate alternative minimum tax applies from fiscal 2027. Malaysia holidays expire 2028 to 2031. Section 232 and Section 301 investigations pending. | Exemptions hold and the rate stays near 15% | Losing exemptions raises cost of goods directly. A move from 12% to 21% costs roughly $19 per share at fiscal 2027 base earnings. |
| Assumption | Value used | Source |
|---|---|---|
| Fiscal 2027 starting run-rate | Revenue $10.30–10.80bn, non-GAAP gross margin 83.0–85.0%, non-GAAP EPS $44.00–46.00, about 155m diluted shares | 8-K Exhibit 99.1, 5 Aug 2026 |
| Bit supply growth | Mid-teens percent in fiscal 2027, mid to high teens thereafter, from node transitions | CFO Luis Visoso, Q4 FY26 call |
| Cost per bit | Down 8% a year from BiCS 8 and BiCS 10 migration | Estimate, based on historical NAND node economics |
| Annualised cost of revenue base | $5.53bn, being Q4 FY26 × 4, flexed by bit growth and cost per bit | Q4 FY26 cost of revenue $1,383m |
| Operating expenses | $2.1bn in fiscal 2027, growing with headcount and variable compensation | 8-K guidance of $520–540m per quarter |
| Capital expenditure | About 6% of revenue gross, including Flash Ventures | CFO Visoso, Q4 FY26 call |
| Tax rate | 15%, with the alternative minimum tax floor from fiscal 2027 | 8-K guidance and 10-K Item 7 |
| Share count | 155m in fiscal 2027, declining with the buyback in the base and bull cases | Guidance and the $15.5bn authorisation |
6. Three-year scenarios
BULL Allocation persists past 2027 · ~20%
AI storage demand compounds; datacenter reaches half the NAND market; node-led supply stays mid-teens; the Japanese and Korean capacity programmes land only from 2029 and slip; high-bandwidth flash ships at a premium; NBM variable components reprice upward.
| $bn | FY27 | FY28 | FY29 |
|---|---|---|---|
| Revenue | 47.4 | 55.0 | 60.0 |
| Gross margin | 84% | 82% | 78% |
| Operating income | 37.6 | 42.6 | 44.0 |
| Net income | 32.0 | 36.2 | 37.4 |
| EPS | $206 | $245 | $267 |
Cumulative net income $105.6bn, or 49% of market capitalisation.
BASE Supply normalises in 2H 2027 · ~50%
Fiscal 2027 runs at roughly the first-quarter guide all year. TrendForce is right: bit supply growth accelerates, the balance turns positive in the second half of 2027, ASPs fall about 30% in fiscal 2028 and 20% in fiscal 2029 while bits grow about 18%. NBM coverage cushions the first leg down.
| $bn | FY27 | FY28 | FY29 |
|---|---|---|---|
| Revenue | 41.2 | 34.0 | 32.6 |
| Gross margin | 83% | 66% | 55% |
| Operating income | 32.1 | 20.1 | 15.4 |
| Net income | 27.3 | 17.1 | 13.1 |
| EPS | $176 | $114 | $90 |
Cumulative net income $57.5bn, or 26% of market capitalisation.
BEAR Classic memory bust · ~30%
Demand destruction spreads from Consumer into Edge; hyperscalers digest; YMTC, the Cheongju fab and the Japan programme add bits into a falling market; NBM customers renegotiate or walk and Sandisk claims collateral instead of revenue.
| $bn | FY27 | FY28 | FY29 |
|---|---|---|---|
| Revenue | 33.0 | 20.0 | 16.0 |
| Gross margin | 74% | 42% | 25% |
| Operating income | 22.3 | 6.2 | 1.8 |
| Net income | 19.0 | 5.3 | 1.5 |
| EPS | $122 | $34 | $10 |
Cumulative net income $25.8bn, or 12% of market capitalisation.
Even the bear case returns $25.8bn of cumulative earnings over three years against a $217bn market capitalisation, and Sandisk carries no debt, so solvency is not in the distribution. The question is what multiple to pay for a company whose earnings can move twentyfold between trough and peak. At 20× trailing and about 8× forward, the market is already pricing something close to the base case. The asymmetry favours the bull only if allocation persists past 2027. The weight of evidence moved against that in the eight weeks to 27 August, which is why the bull weighting here is 20% rather than 25% and the bear 30%. Set against that, both companies argue that a rising enterprise mix makes demand more durable than in prior cycles, and neither the Cheongju fab nor the Japan programme produces a wafer before 2029.
7. Sensitivity analysis
Revenue is modelled from the fourth-quarter fiscal 2026 annualised run-rate of $35.86bn, flexed by exabyte growth and blended ASP change. Cost of revenue is the annualised $5.53bn base, flexed by bit growth and an 8% annual cost-per-bit decline. Operating expenses $2.1bn, tax 15%, 155m diluted shares. Bold is the base case.
Fiscal 2027 revenue, $bn
| ASP vs Q4 FY26 | bits +10% | bits +15% | bits +20% |
|---|---|---|---|
| −30% | 27.6 | 28.9 | 30.1 |
| −15% | 33.5 | 35.1 | 36.6 |
| Flat | 39.4 | 41.2 | 43.0 |
| +15% | 45.4 | 47.4 | 49.5 |
| +30% | 51.3 | 53.6 | 55.9 |
Fiscal 2027 non-GAAP EPS
| ASP vs Q4 FY26 | bits +10% | bits +15% | bits +20% |
|---|---|---|---|
| −30% | $109 | $115 | $120 |
| −15% | $142 | $149 | $156 |
| Flat | $174 | $183 | $191 |
| +15% | $207 | $216 | $226 |
| +30% | $239 | $250 | $262 |
Shading runs light to dark with earnings. Every value is printed, so colour carries no information the text does not.
| Variable | Change | Revenue impact | EPS impact | Why |
|---|---|---|---|---|
| Blended ASP | ±10% | ±$4.1bn | ±$23 | Near-zero incremental cost on bits already produced |
| Exabyte shipments | ±5pp | ±$1.8bn | ±$7 | Volume carries wafer cost, so it moves EPS about four times less than price does |
| Gross margin | ±100bp | — | ±$2.3 | On $41.2bn of revenue |
| Operating expenses | ±$200m | — | ∓$1.1 | Opex is 5% of revenue and immaterial |
| Effective tax rate | 12% to 21% | — | −$19 | The alternative minimum tax and Malaysia expiry are directional headwinds |
| Share count | 155m to 145m | — | +$12 | The $15.5bn authorisation buys about 10m shares at the current price |
Price moves earnings more than three times as much as volume does. A 10% move in blended ASP is worth roughly $23 of EPS; a five-point move in bit growth about $7. Any forecast of Sandisk is a forecast of NAND contract prices.
8. Ownership, voting power and insiders
Beneficial ownership
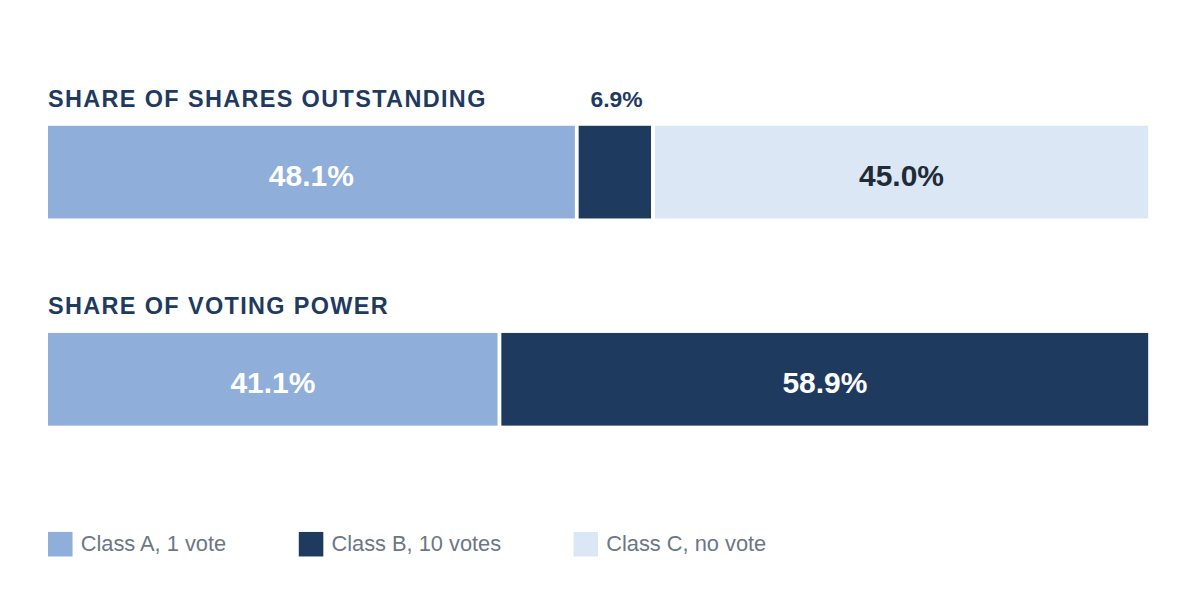
One class of common stock, $0.01 par, one vote per share. 146,404,554 shares outstanding at the ownership date of 5 September 2025, and 146,526,126 at the 22 September 2025 meeting record date. No dual-class structure, no super-voting shares, no controlling holder.
| Holder | Shares | % of class | Basis |
|---|---|---|---|
| FMR LLC (Fidelity) | 20,574,141 | 14.1% | SC 13G/A 12 May 2025, as of 31 Mar 2025 |
| The Vanguard Group | 16,554,878 | 11.3% | SC 13G/A 5 Jun 2025 |
| BlackRock, Inc. | 15,790,988 | 10.8% | SC 13G/A 17 Jul 2025, as of 30 Jun 2025 |
| DnB Asset Management AS | 7,109,285 | 5.8% | SC 13G 12 Aug 2025 |
| Western Digital Corporation | 7,513,019 | 5.1% | Residual spin-off stake, dispositive only |
| All directors and executive officers, 12 people | 310,256 | <1% | CEO Goeckeler 228,566; CFO Visoso 32,550 |
Voting power is entirely institutional and entirely passive. The three index complexes controlled 36.2% at the proxy date. Insiders hold under 1%. There is no blockholder, no activist and no defensive structure other than Delaware charter provisions and the Kioxia change-of-control rights, which the 10-K identifies as capable of deterring an acquisition.
Annual meeting, 18 November 2025
| Proposal | For | Against / withheld | Abstain | Broker non-votes | Approval |
|---|---|---|---|---|---|
| Richard B. Cassidy II | 108,082,365 | 597,249 | 52,602 | 14,476,289 | 99.45% |
| Thomas Caulfield | 108,107,990 | 573,502 | 50,724 | 14,476,289 | 99.47% |
| David V. Goeckeler, Chairman and CEO | 102,617,329 | 6,074,694 | 40,193 | 14,476,289 | 94.41% |
| Devinder Kumar | 108,077,890 | 601,504 | 52,822 | 14,476,289 | 99.45% |
| Necip Sayiner | 107,720,427 | 957,645 | 54,144 | 14,476,289 | 99.12% |
| Ellyn J. Shook | 108,515,989 | 165,287 | 50,940 | 14,476,289 | 99.85% |
| Miyuki Suzuki | 108,377,092 | 312,518 | 42,606 | 14,476,289 | 99.71% |
| Say-on-pay, advisory | 106,849,286 | 1,787,342 | 95,588 | 14,476,289 | 98.27% |
| Ratify KPMG for fiscal 2026 | 122,820,985 | 282,154 | 105,366 | none | 99.69% |
Only one item drew meaningful opposition. Goeckeler received 5.59% against, six to ten times every other nominee, all of whom were below 1%. The likely cause is his combined Chairman and CEO role, a standard proxy-adviser objection where no independent lead-director structure is disclosed in the proxy summary. Say-on-pay passed with 98.27% support, so the opposition was governance-structural rather than compensation-driven. Annual say-on-pay frequency was adopted. Nothing else was cited.
Schedule 13D and 13G history
No Schedule 13D has ever been filed on Sandisk. All 5% activity is passive 13G. Sandisk has not attracted an activist.
| Filer | Trajectory | Latest | Read |
|---|---|---|---|
| FMR LLC (Fidelity) | Mar-25 10.6% → May-25 14.2% → Apr-26 8.7% → Aug-26 5.3% | 5.3% | Built into the spin, sold two-thirds into the rally |
| BlackRock, Inc. | Mar-25 12.1% → Apr-25 9.3% → Jul-25 10.9% → Jan-26 6.0% | 6.0% | Halved |
| The Vanguard Group | Apr-25 9.44% → Jul-25 11.39% → Mar-26 below 5% | <5% | Exit filing; affiliated Vanguard Capital Management filed 7.17% in Apr-26 |
| Western Digital Corp | Apr-25 19.9% → Jul-25 5.2% → May-26 0.7% | 0.7% | Monetised via debt-for-equity exchanges; expects to exit fully by end-2026 |
| DnB Asset Management AS | Aug-25 5.8% → Nov-25 0.7% | 0.7% | Full exit within three months |
| Jane Street Group, LLC | Aug-26 5.0%, new | 5.0% | Market-making and derivatives, not a fundamental holder |
Every long-standing 5% holder sold down during the rally. Fidelity, BlackRock, Vanguard, DnB and Western Digital all cut. The only new 5% filer is a market maker. Set against the 13F filer count below, this is the classic pattern of a stock moving from concentrated active hands into a broad index and momentum base.
Institutional breadth
| Period of report | 13F filers | Change | Context |
|---|---|---|---|
| 31 Mar 2025 | 444 | — | First standalone quarter after the 21 Feb 2025 spin |
| 30 Jun 2025 | 444 | 0 | Flat |
| 30 Sep 2025 | 549 | +23.6% | The rally begins |
| 31 Dec 2025 | 773 | +40.8% | Index inclusions and momentum funds |
| 31 Mar 2026 | 1,216 | +57.3% | |
| 30 Jun 2026 | 1,865 | +53.4% | Up 320% over five quarters |
Materially more funds hold Sandisk than a year ago: 1,865 filers against 444, a 4.2 times increase, rising in every one of the last four quarters. Breadth and conviction moved in opposite directions. Among the largest holders, share counts at BlackRock, down 39%, Fidelity, down 64%, and T. Rowe Price, down 72%, fell year on year while State Street, up 39%, Geode, up 50%, and Norges Bank, up 17%, added. More owners, each holding less, with dollar exposure roughly flat as the price ran. That is a shareholder register that will turn over faster, not slower.
Insider trading, 29 August 2025 to 29 August 2026
| Insider | Title | Shares sold | Value | Average price | Shares held |
|---|---|---|---|---|---|
| Alper Ilkbahar | EVP, CTO | 2,000 | $3,513,153 | $1,756.58 | 48,846 |
| Michael Pokorny | VP, Chief Accounting Officer | 2,446 | $3,488,436 | $1,426.18 | 22,375 |
| Miyuki Suzuki | Director | 3,500 | $2,196,360 | $627.53 | 9,907 |
| Bernard Shek | Chief Legal Officer | 1,800 | $2,991,696 | $1,662.05 | 30,484 |
| Necip Sayiner | Director | 1,850 | $1,118,327 | $604.50 | 2,900 |
| Total | 5 insiders, 10 transactions | 11,596 | $13,307,972 | — | — |
There were 61 Form 4 transactions in the window: 53 tax-withholding events on RSU vesting covering 109,761 shares, 12 grants or vests covering 196,518 shares, 10 open-market sales, four gifts and one derivative exercise. There were no open-market purchases by any officer or director. No Form 144 filings. Goeckeler held 457,788 shares as of 25 August 2026 and Visoso 137,814 as of 21 August, both after net RSU vesting rather than buying.
$13.3m of insider selling against a $217bn market capitalisation is immaterial in size. The signal is the absence on the other side: after a year of record revenue and net income, at prices between $604 and $1,757, not one insider bought a share on the open market. Neither did they sell in size. The reading is neutral to mildly negative, not a signal of distribution.
9. Material events in the last 12 months
All nine 8-K filings between 1 August 2025 and 29 August 2026. Sandisk is a US domestic issuer, so it files 8-K rather than 6-K or 40-F.
| Filed | Items | Event |
|---|---|---|
| 14 Aug 2025 | 2.02, 9.01 | Q4 and fiscal 2025 results. Q4 revenue $1,901m, gross margin 26.2%, operating income $18m, net loss $(23)m. Full year revenue $7,355m and a net loss of $(1,641)m including the $1,830m goodwill impairment. |
| 6 Nov 2025 | 2.02, 9.01 | Q1 fiscal 2026 results. Revenue $2,308m in a 14-week quarter, gross margin 29.8%, net income $112m. The first profitable standalone quarter after the impairment. |
| 20 Nov 2025 | 5.07 | First annual meeting as a public company. All seven directors elected, say-on-pay 98.27%, annual frequency adopted, KPMG ratified at 99.69%. |
| 2 Jan 2026 | 5.02 | Board addition. Alexander Bradley appointed a director effective 30 December 2025. |
| 29 Jan 2026 | 2.02, 9.01 | Q2 fiscal 2026 results. Revenue $3,025m, gross margin 50.9%, net income $803m. The margin inflection quarter. Separately on the same date, and disclosed in the 10-Q rather than by 8-K, Flash Alliance and Flash Partners were extended from December 2029 to December 2034, with all three joint ventures now co-terminating, plus an agreement under which Sandisk pays Kioxia $1.2bn over 2026 to 2029. |
| 25 Mar 2026 | 1.01, 8.01, 9.01 | Nanya Technology investment and DRAM supply deal. Sandisk Technologies subscribed for about 139m Nanya shares for about $1.0bn, roughly 3.9% fully diluted, at a 15% discount to the 30-day average with a three-year Taiwanese lock-up. Concurrently a multi-year arrangement for Nanya to supply DRAM. The first move outside NAND. Marked to $1,777m at year end, an $808m gain. |
| 30 Apr 2026 | 2.02, 8.01, 9.01 | Q3 fiscal 2026 results and the first buyback. Revenue $5,950m, gross margin 78.4%, net income $3,615m. A $6.0bn repurchase programme authorised. Five NBM agreements announced. |
| 14 May 2026 | 8.01, 9.01 | Mini-tender rejection. Sandisk recommended stockholders reject an unsolicited mini-tender by Tutanota LLC for up to 100,000 shares at $1,150.00, less than 0.07% of shares outstanding, conditioned on the market price exceeding the offer price. |
| 5 Aug 2026 | 2.02, 8.01, 9.01 | Q4 and fiscal 2026 results, and a $14bn buyback expansion. Q4 revenue $8,965m, gross margin 84.6%, net income $6,903m, GAAP EPS $43.97. Full year revenue $20,248m and net income $11,433m. Total remaining authorisation $15.5bn. Five further NBMs signed since April, ten in total. First-quarter fiscal 2027 guidance of $10.30–10.80bn revenue and $44.00–46.00 non-GAAP EPS. |
After the last 8-K
| Date | Source | Event |
|---|---|---|
| 17 Aug 2026 | 10-K subsequent events | Two additional NBM agreements with an aggregate transaction price of $31.3bn, signed between 4 July and 17 August 2026. Multi-year volume commitments backed by financial guarantees. The largest forward contracted revenue figure Sandisk has disclosed. |
| 27 Aug 2026 | Company press release | Kioxia and Sandisk to invest over $31bn in Japan through 2032, covering the Yokkaichi and Kitakami plants and related infrastructure, contingent on Japanese government support. No per-partner split, wafer capacity or node detail announced. Not filed on Form 8-K as of 29 August 2026. |
10. Management discussion and commentary
From Item 7 of the 10-K
- Demand: “the rapid growth of AI infrastructure is driving demand for high-performance storage products… The current demand environment has led to pricing shifts that have positively impacted our business… We expect AI-driven demand to persist through calendar year 2027 and beyond.”
- Revenue bridge: Datacenter up 437% on volumes up almost 120% on an exabyte basis and revenue per gigabyte up almost 150%. Edge up 195% on high-single-digit exabyte growth and revenue per gigabyte up almost 180%. Consumer up 29% on mid-teens percent lower exabytes and revenue per gigabyte up low-fifties percent.
- Capex: “we maintained what we believe to be a conservative capital expenditure strategy… For fiscal year 2027, we anticipate increased capital investments as we transition to newer nodes.”
- Working capital: days inventory up 43 days to 178 on inventory builds to meet demand. The cash conversion cycle of 162 days is the longest of the three years shown.
- Tariffs: Section 232 and Section 301 investigations pending. “Currently, the majority of our products sold in the U.S. are exempt from tariffs, but additional tariff increases, or the loss of applicable exemptions, would increase the cost of goods sold.”
- Tax: not subject to the corporate alternative minimum tax in fiscal 2026 but expects to be subject to it in fiscal 2027. Foreign-subsidiary rate changes apply from fiscal 2027 and “can materially impact our effective tax rate and reduce our operating cash flows.”
- Commitments: $11,760m in total, of which Flash Ventures-related $6,559m, with $2,627m due in fiscal 2027, and purchase obligations $4,902m.
- Cash location: $2,879m of $4,762m held outside the United States, up from $692m.
From the earnings calls
| Topic | Speaker | Statement |
|---|---|---|
| Q4 growth mix | Visoso, CFO | Sequential growth was “approximately 1/3 from higher volumes and 2/3 from higher pricing.” |
| NBM economics | Visoso, CFO | “Not to pick a specific number, but we do expect to be around 80%” gross margin on NBM agreements, “with upside when pricing rises.” |
| NBM coverage | Visoso, CFO | Agreements with eight Datacenter and Edge customers, weighted-average duration above four years, covering more than 50% of fiscal 2027 bits. |
| Supply | Goeckeler, CEO | “NAND bits will remain on allocation beyond calendar year 2027.” Supply grows “primarily through nodal transitions rather than wafer additions.” |
| Bit growth | Visoso, CFO | “Mid-teens for fiscal year 2027” sellable bit growth, adjusted for higher inventory supporting long-term agreements. |
| Capex | Visoso, CFO | Q4 “gross capital expenditures totaled $562 million, representing 6.3% of revenue.” Fiscal 2027 spending rises in dollars for the BiCS 8 and BiCS 10 ramps but falls to about 6% of revenue. |
| Bit mix | Goeckeler, CEO | “Datacenter exited fiscal 2026 at 38% of Sandisk's bit mix, up from roughly 12% a year earlier.” |
| Consumer weakness | Goeckeler and Visoso | “Both PCs and smartphones are working through a period of adjustment.” “Prices on the consumer market have also come up, and there has been some impact on the TAM itself.” |
| Cyclicality | Goeckeler, CEO, Q3 | “We are very focused on getting the cyclicality out of this business.” |
| Contract structure | Visoso, CFO, Q3 | “The shorter term within the contract is more fixed; the longer out you go, there is more variable.” |
| Kioxia | Goeckeler, CEO, Q3 | “The conversations with Kioxia are always very robust and ongoing… We have our BiCS 8 transition plan that we have aligned on, and we are executing to it.” |
| High-bandwidth flash | Goeckeler, CEO, Q3 | “We are still on the timeline… of having the NAND late this year, and looking for more of a system with the controller early to mid next year.” |
Sandisk does not file transcripts with the SEC. Quotes are from published transcripts of the two calls and from the 8-K Exhibit 99.1 press releases. Flash Ventures and Kioxia were referred to generically as “our JV partner” on the fourth-quarter call, and fab-level detail was not disclosed.
11. Trends and risks
Trends supporting the business
- AI storage is a distinct demand pool, not a substitute for existing NAND. Datacenter went from 4.9% of revenue in fiscal 2024 to 25.4% in fiscal 2026.
- Contract structure is new: ten agreements, four-year weighted duration, more than half of fiscal 2027 bits, $5.0bn of collateral, $31.3bn of further signings after year end.
- The balance sheet is unlevered with $6.5bn of net cash and a $1.5bn undrawn revolver, so the company can survive any down-cycle without dilution.
- Earnings convert to cash at 1.02 times and adjusted free cash flow was $8.7bn.
- The fab-light structure means Sandisk carries none of the depreciation burden that crushes owner-operators in a trough.
- Sales incentive spend fell from 19% to 11% of gross revenue, showing pricing power rather than channel stuffing.
- The Nanya stake and DRAM supply deal open a second memory market and a possible high-bandwidth-flash path.
Risks, ranked by how much they move the model
- Price reversal. A 10% ASP move is $23 of EPS. TrendForce sees NAND supply turning surplus in the second half of 2027.
- The committed capacity. SK hynix's Cheongju NAND fab and the $31bn Japan programme answer the supply question in Sandisk's favour for 2030 and against it for 2028 and 2029.
- NBM execution. New in the fiscal 2026 risk factors: long-term agreements “expose us to certain execution, financial, and market risks, which could be significant.” Product defects were newly linked to termination of long-term sales agreements.
- Kioxia single-source dependency. All wafers, from a listed competitor, in earthquake-exposed Japan, with $2,897m of maximum exposure.
- Rising customer concentration. Top 10 at 44% of revenue; three customers are 41% of the receivable book.
- Demand destruction. Already visible: Consumer exabytes down mid-teens percent for the year.
- Tax step-up. The alternative minimum tax from fiscal 2027, Malaysia holidays expiring 2028 to 2031.
- Tariffs. Section 232 and 301 investigations pending; exemptions could be withdrawn.
- Buyback at the peak. $4.5bn already spent at about $1,508, above the current price, with $15.5bn still authorised.
- Working capital. Days inventory up 43 and receivables 4.4 times higher. Correct behaviour in an up-cycle, impairment risk in a down-cycle.
- Goodwill. $4,994m carried after the fiscal 2025 write-down of $1,830m. It was impaired once already when the market price fell below carrying value.
The fiscal 2026 risk set moved from separation mechanics toward contract execution. Four risks are new: NBM execution; Flash Ventures guarantee and revolving-credit covenant risk, replacing the fiscal 2025 leverage risk now that the term loan is repaid; share-repurchase risk; and a broadened standalone-company internal-controls risk. Seven spin-off risks were dropped or consolidated, as were the goodwill impairment and public-health-crisis factors. The operating-results risk was rewritten to concede that traditional seasonality is now damped by multi-year agreements and that AI datacenter deployment timing is the new swing factor.
12. Valuation
| Metric | Value | Basis |
|---|---|---|
| Share price | $1,484.98 | 28 Aug 2026 close; 52-week range $50.07 to $2,354.39, so 37% below the high |
| Shares outstanding | 146,419,001 | 10-K cover page, as of 7 Aug 2026 |
| Public float, SEC-filed | $40.5bn | 10-K cover page at 2 Jan 2026, implying about $277 per share, so the stock has risen about 5.4 times since the second-quarter measurement date |
| Market capitalisation | $217.4bn | |
| Enterprise value | $210.9bn | Less $4.76bn of cash and the $1.78bn Nanya stake; no debt |
| P/E, trailing GAAP | 20.1× | Fiscal 2026 diluted EPS $73.76 |
| P/E on annualised Q1 FY27 guide | 8.2× | $45 midpoint times four, or $180 |
| P/E, base case fiscal 2027 | 8.4× | $176 modelled |
| EV / fiscal 2026 revenue | 10.4× | |
| EV / fiscal 2026 operating income | 17.0× | |
| EV / fiscal 2026 adjusted free cash flow | 24.1× | Adjusted free cash flow $8.74bn after NBM prepayments |
| Cumulative three-year earnings / market cap | 12% / 26% / 49% | Bear, base, bull |
The single-digit forward multiple is the argument. Sandisk trades at roughly 8 times the earnings management has already guided for the current quarter. Either the market is wrong and the stock is worth two to three times this price, or the market is right that fiscal 2027 is a peak and the correct denominator is a mid-cycle number somewhere between $40 and $90 of EPS. Filings alone cannot settle that. What they do settle is that the earnings are real cash, the balance sheet is unlevered, more than half of next year's volume is contracted, and the marginal supply decisions that would end the cycle were taken in the eight weeks before this was written.
Sources
All SEC data was retrieved through the sec-api.io API. Sandisk Corporation, CIK 2023554: Form 10-K for fiscal 2026 filed 17 August 2026, accession 0001628280-26-057406; Form 10-K for fiscal 2025; Forms 10-Q for the periods ended 3 October 2025, 2 January 2026 and 3 April 2026; Form 10-12B/A of 27 January 2025; DEF 14A of 7 October 2025; nine Forms 8-K filed between 14 August 2025 and 5 August 2026 with Exhibits 99.1 and 10.1; Schedules 13G and 13G/A; Forms 4; and Form 13F holdings by CUSIP 80004C200.
Peer filings: Micron Technology, CIK 723125, fiscal 2025 10-K and third-quarter fiscal 2026 10-Q; Western Digital, CIK 106040, fiscal 2026 10-K; Seagate, CIK 1137789, fiscal 2026 10-K; SK hynix Inc., CIK 2120882, Nasdaq SKHY, Form 424B4 final prospectus filed 9 July 2026, Form 8-A12B, and 18 Forms 6-K filed between 15 July and 21 August 2026 including the first-half 2026 semi-annual business report.
Industry data: TrendForce quarterly NAND vendor revenue and contract price releases from July 2025 to August 2026; Counterpoint Research NAND market share; IDC market share as filed by SK hynix; Gartner forecasts as filed by SK hynix. Company results: Samsung second-quarter 2026 release, SK hynix second-quarter 2026 results, Kioxia first-quarter fiscal 2026 results. Earnings call quotes from published transcripts of the 30 April 2026 and 5 August 2026 calls. The Kioxia and Sandisk Japan investment press release is dated 27 August 2026.
Limitations
Aggregate 13F share and dollar totals across all filers could not be summed and are not reported; filer counts are reported instead. Samsung does not disclose NAND separately, so its divisional figures include DRAM and are not comparable. SK hynix discloses NAND revenue by product category but reports a single operating segment and no NAND-only profit line, so only its NAND revenue is comparable; its DRAM and NAND split is disclosed through the first quarter of 2026 and not for the second. SK hynix figures are converted from Korean won at the prospectus convenience rate of ₩1,523.5 to the dollar and are IFRS, not US GAAP; its first-half 2026 net income includes ₩82.9tn of finance income and ₩3.98tn of derivative losses and is not an operating result. Solidigm standalone financials are not disclosed. Micron's fiscal calendar is one quarter offset from Sandisk's. Western Digital's and Seagate's quarterly figures are derived as full year minus nine months. The second-quarter 2026 vendor shares for SK hynix, Micron and Sandisk are derived from TrendForce's implied market total rather than stated.
Scenario and sensitivity figures, and the scenario probabilities, are the author's model and judgement, not company guidance beyond the first-quarter fiscal 2027 outlook. The SK hynix Cheongju NAND fab is a preliminary plan subject to board and government determination, and the Kioxia and Sandisk Japan programme is contingent on Japanese government support; neither is a committed wafer start. Figures for fiscal 2022 to fiscal 2024 are carve-out combined statements and, as the company states, may not be indicative of results of operations, financial position and cash flows had Sandisk been a separate, standalone company.
This document is an analysis of public filings. It is not investment advice and it is not a recommendation to buy or sell any security. Sandisk operates in a cyclical industry where past results are a poor guide to future results.