How to Analyze Stocks with AI
Connecting your AI tool to the SEC-API.io database gives it access to 20 million SEC filings updated in real time, instead of the outdated data it was trained on.
Analysing US stocks is straightforward: connect the tool to the database, then ask in plain language. In the background it maps your ticker or topic to more than 500 filing types. Output is tied to the accession number of the filing it came from, so any number can be traced back to its source document.
This blogpost explains how to connect your AI assistant to the SEC-API.io database via a MCP server, and shows you how to analyze a specific stock, earnings reports and financial statements, sectors and insider trades.
On this page:
- How to connect SEC filing data to an AI assistant?
- What do you need?
- How to connect your AI tool with the MCP Server?
- How to analyze stocks using AI?
- How to analyze a specific stock?
- How to analyze an earnings report and financial statements?
- How to analyze a sector and find its winners?
- How to screen for insider and institutional signals?
- Resources and Links
- Connect the data
- Prompts and worked examples
- Underlying data
- FAQ
How to connect SEC filing data to an AI assistant?
What do you need?
- An MCP-capable assistant, for example Claude, ChatGPT, Codex, Gemini
- A SEC-API.io API key: get a free key
- Endpoint: 'https://api.sec-api.io/mcp?apiKey=YOUR_API_KEY'
The SEC-API.io database covers 500 SEC filing types, from 1993 to today, all updated in real time within 300 milliseconds. Nothing to install. Setup takes 2 to 5 minutes.
How to connect your AI tool with the MCP Server?
- Claude: How to Access SEC Financial Data in Claude
- ChatGPT, Codex, Gemini, 40+ other AI Tools: MCP server documentation.
How to analyze stocks using AI?
How to analyze a specific stock?
Ask this:
          1
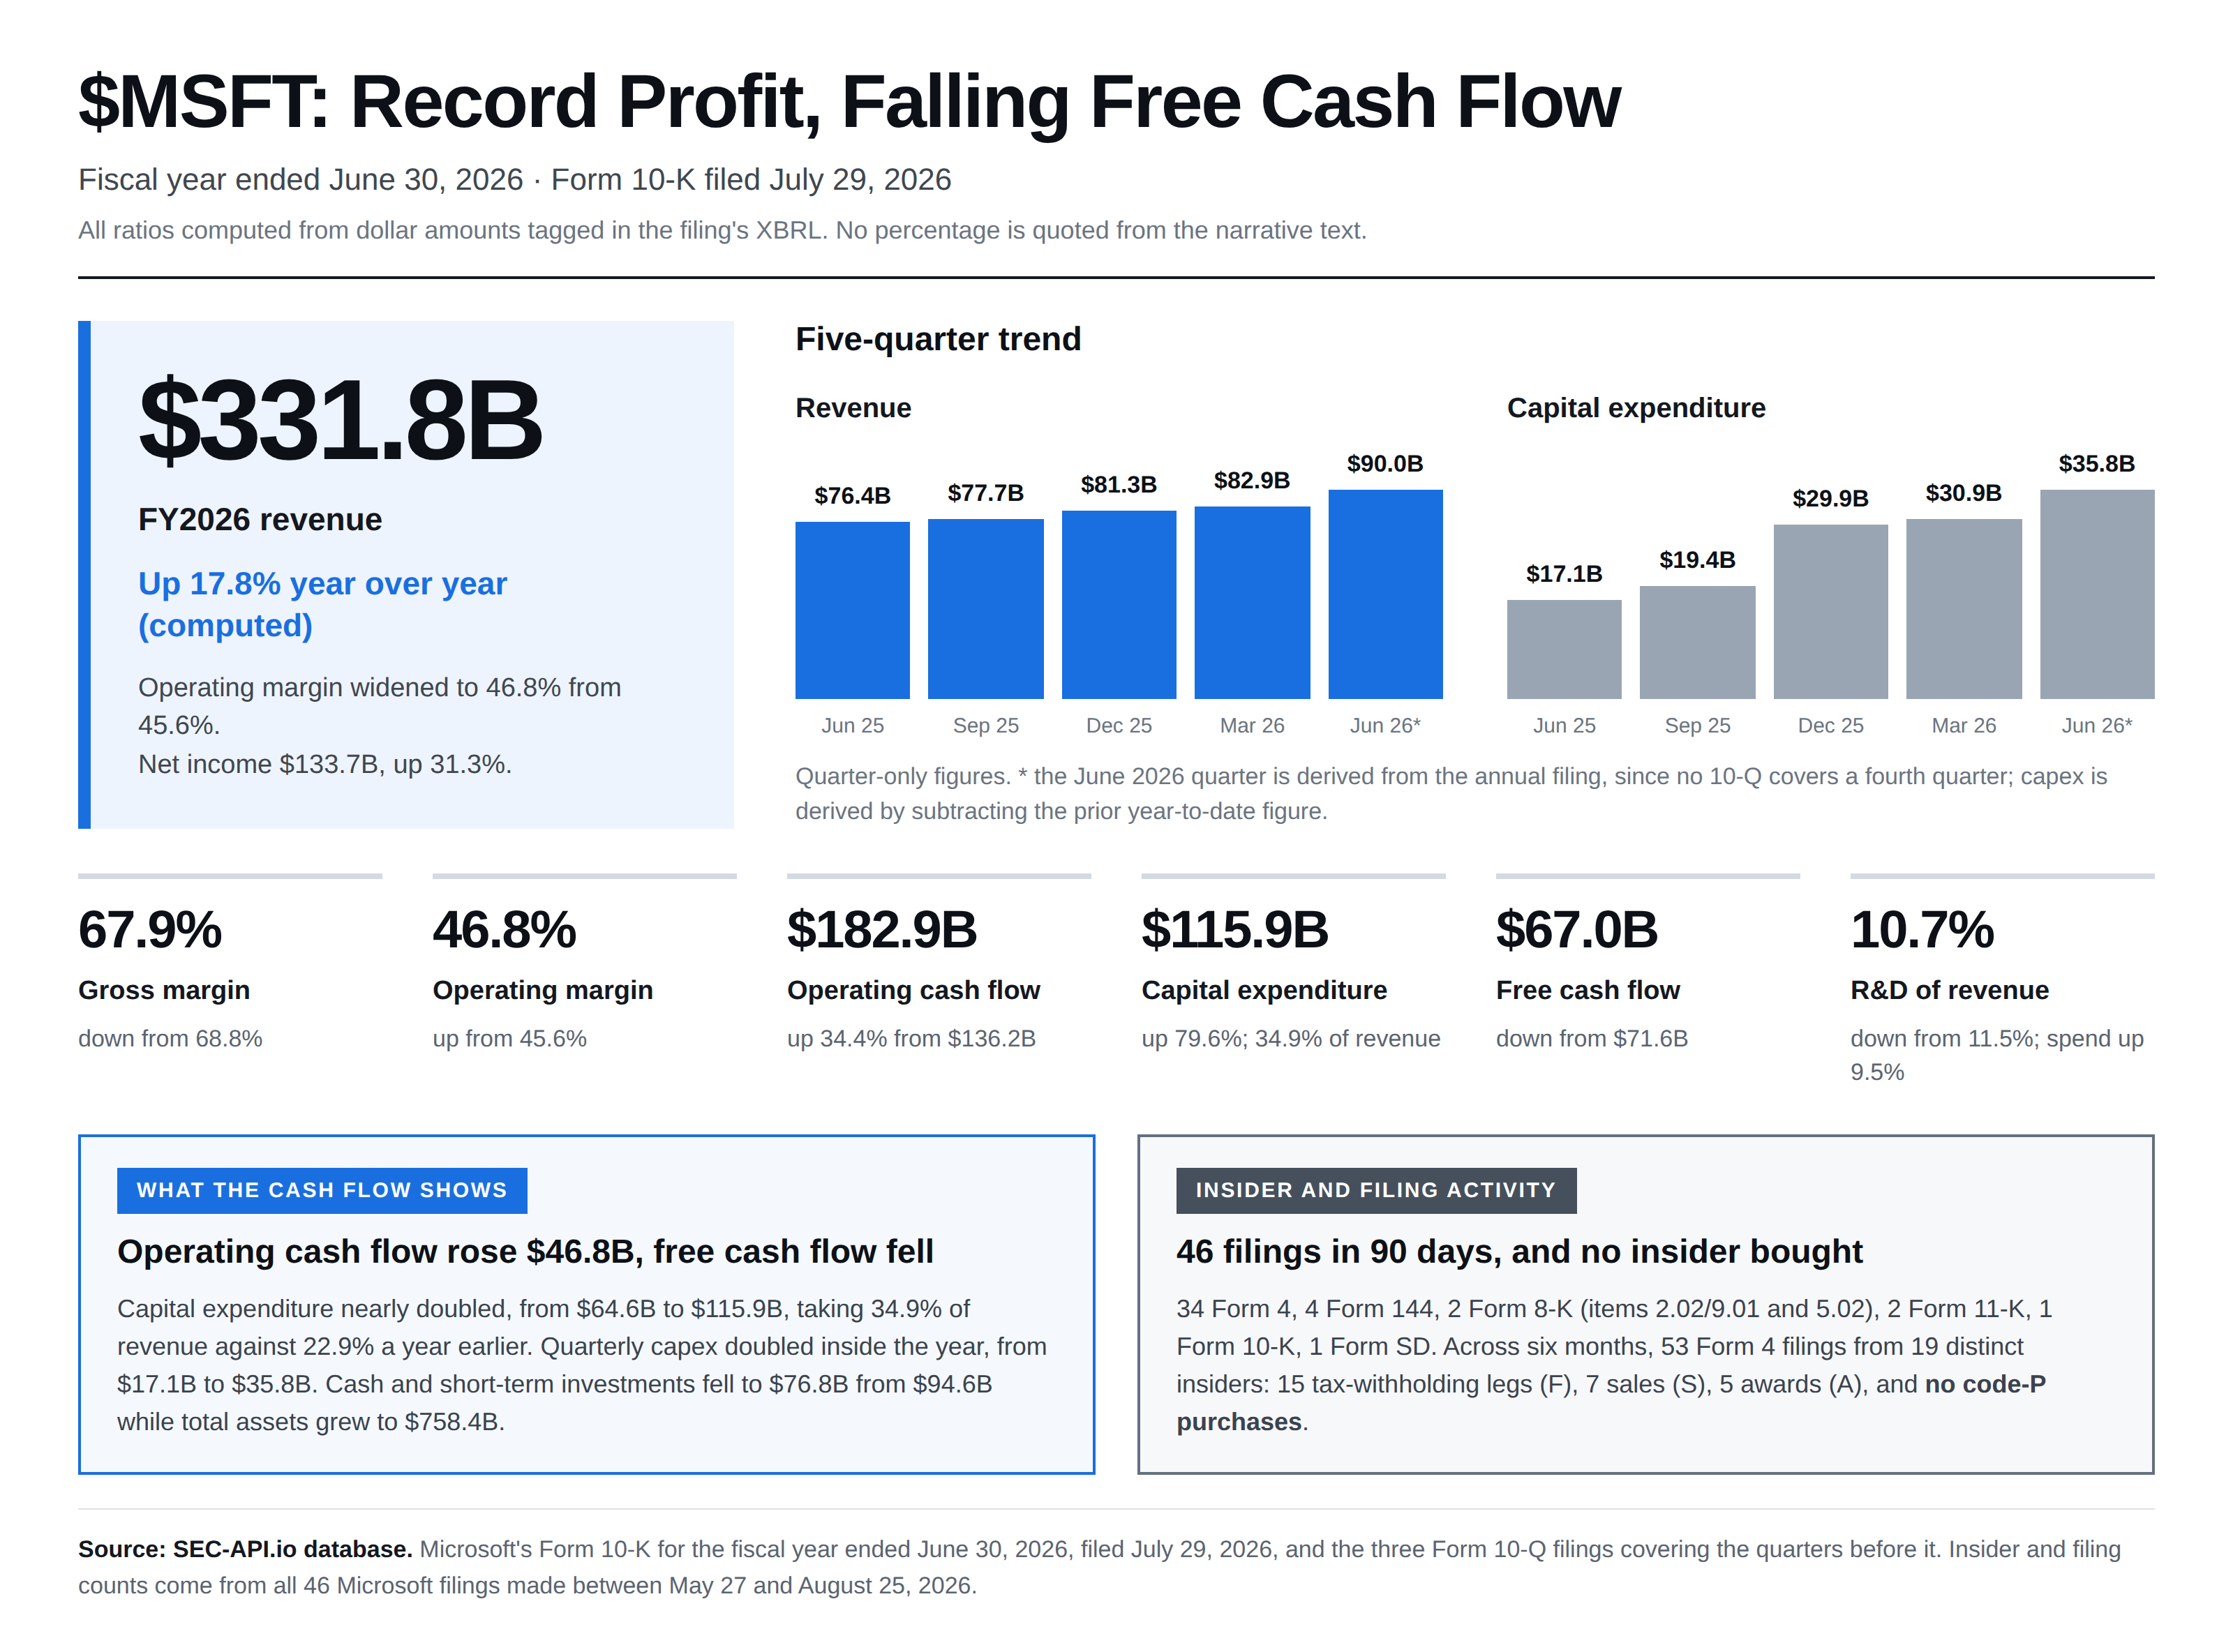
          analyze Microsoft as a stock. Pull the last three years of financials from its 10-K

          2
          filings, compute margins and growth, list what it has filed in the last 90 days,

          3
          and summarize insider trading over the last six months.
You get this:
Output:
- Revenue $331.8B, up 17.8%, with operating margin widening to 46.8% from 45.6%
- Net income $133.7B, up 31.3%; net margin 40.3% against 36.1%
- Operating cash flow $182.9B, up 34.4%, and free cash flow still fell to $67.0B from $71.6B
- Capital expenditure $115.9B, up 79.6%, taking 34.9% of revenue against 22.9% a year earlier
- Quarterly capex more than doubled inside the year: $17.1B, $19.4B, $29.9B, $30.9B, $35.8B
- 46 filings in 90 days; 53 Form 4s from 19 insiders in six months, with zero code-P purchases
Source: Microsoft Form 10-K for the fiscal year ended 2026-06-30, filed 2026-07-29, plus the three Form 10-Q filings covering the quarters before it. Every ratio is computed from tagged XBRL dollar amounts, not quoted from the text.
How to analyze an earnings report and financial statements?
Ask this:
          1
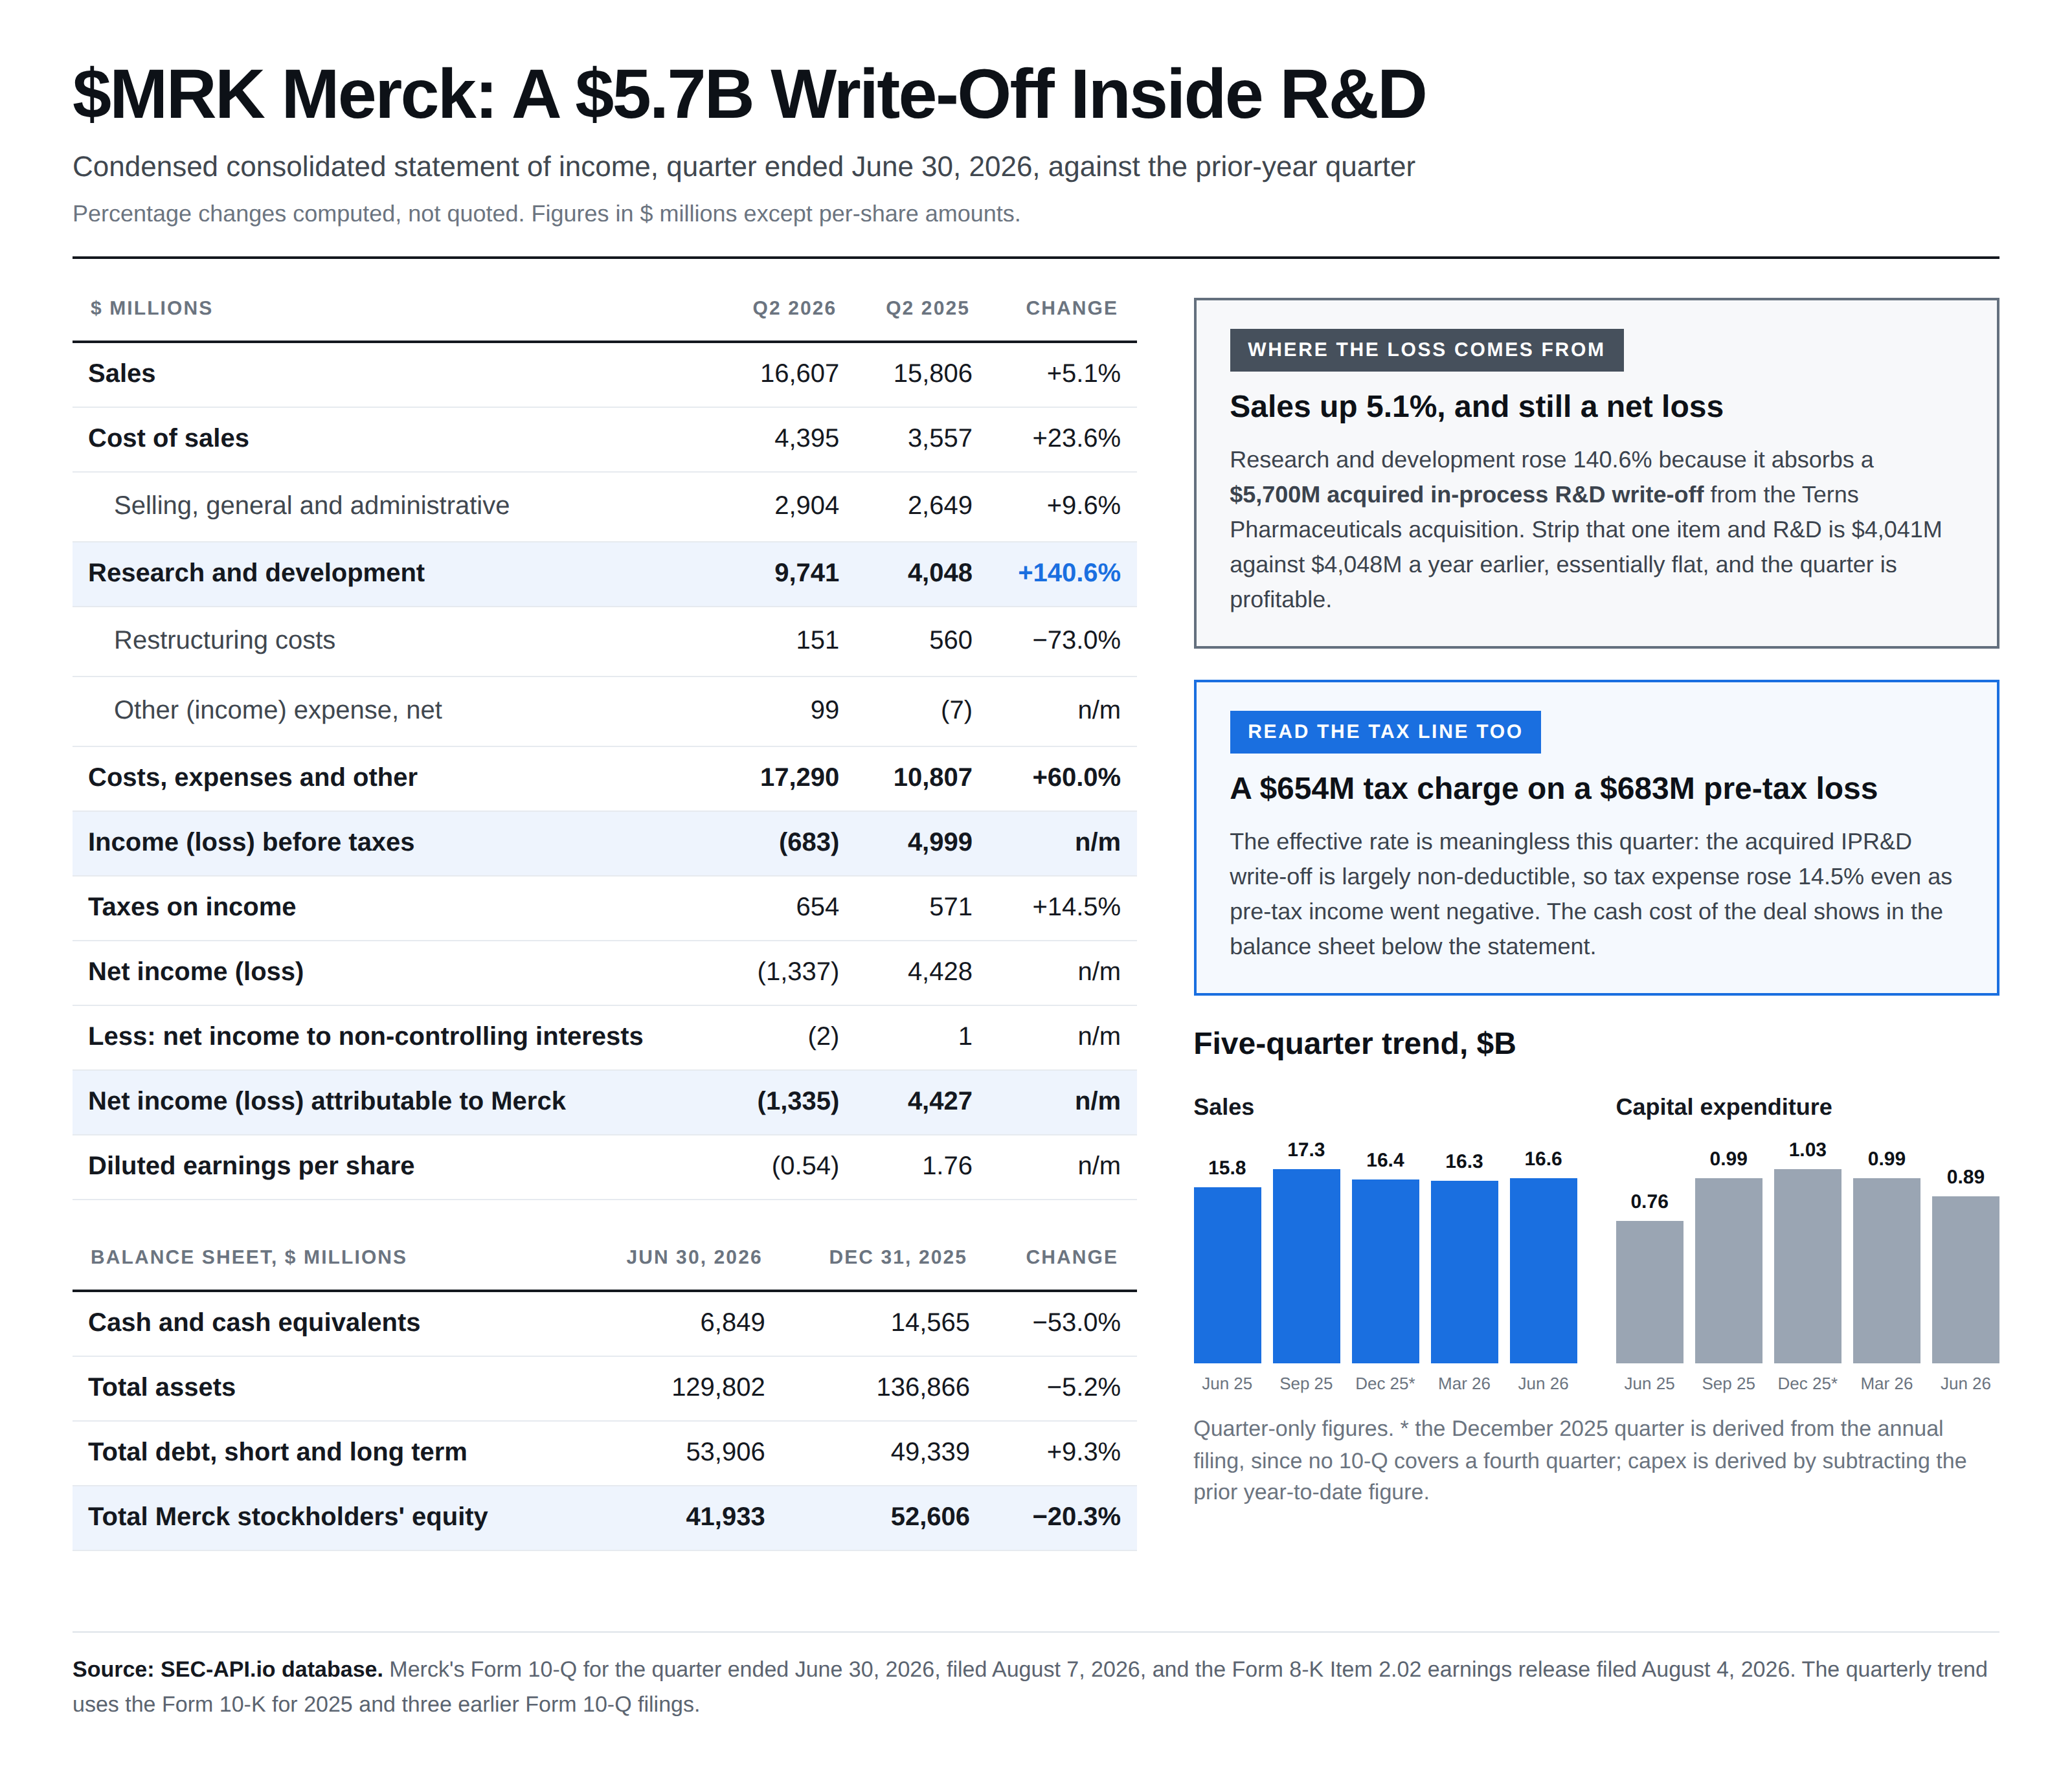
          analyze Merck's most recent quarterly earnings. Pull the income statement from the

          2
          10-Q, compare every line to the prior-year quarter, and tell me where the loss

          3
          actually comes from.
You get this:
Output:
- Sales $16,607M, up 5.1%, and the company still reported a $1,335M net loss
- Research and development rose 140.6% to $9,741M because it absorbs a $5,700M acquired in-process R&D write-off from the Terns Pharmaceuticals acquisition
- Strip that single item and R&D is $4,041M against $4,048M a year earlier, essentially flat, and the quarter is profitable
- Taxes on income $654M on a $683M pre-tax loss, because the write-off is largely non-deductible
- Merck presents no gross profit and no operating income line, only a single costs and expenses block, so margin analysis has to be built from the components
- Quarterly sales held between $15.8B and $17.3B across five quarters; quarterly capex held near $1B
Source: Merck Form 10-Q for the quarter ended 2026-06-30, filed 2026-08-07, and the Form 8-K Item 2.02 earnings release filed 2026-08-04. The quarterly trend uses the Form 10-K for the year ended 2025-12-31 and three earlier Form 10-Q filings.
How to analyze a sector and find its winners?
Ask this:
          1
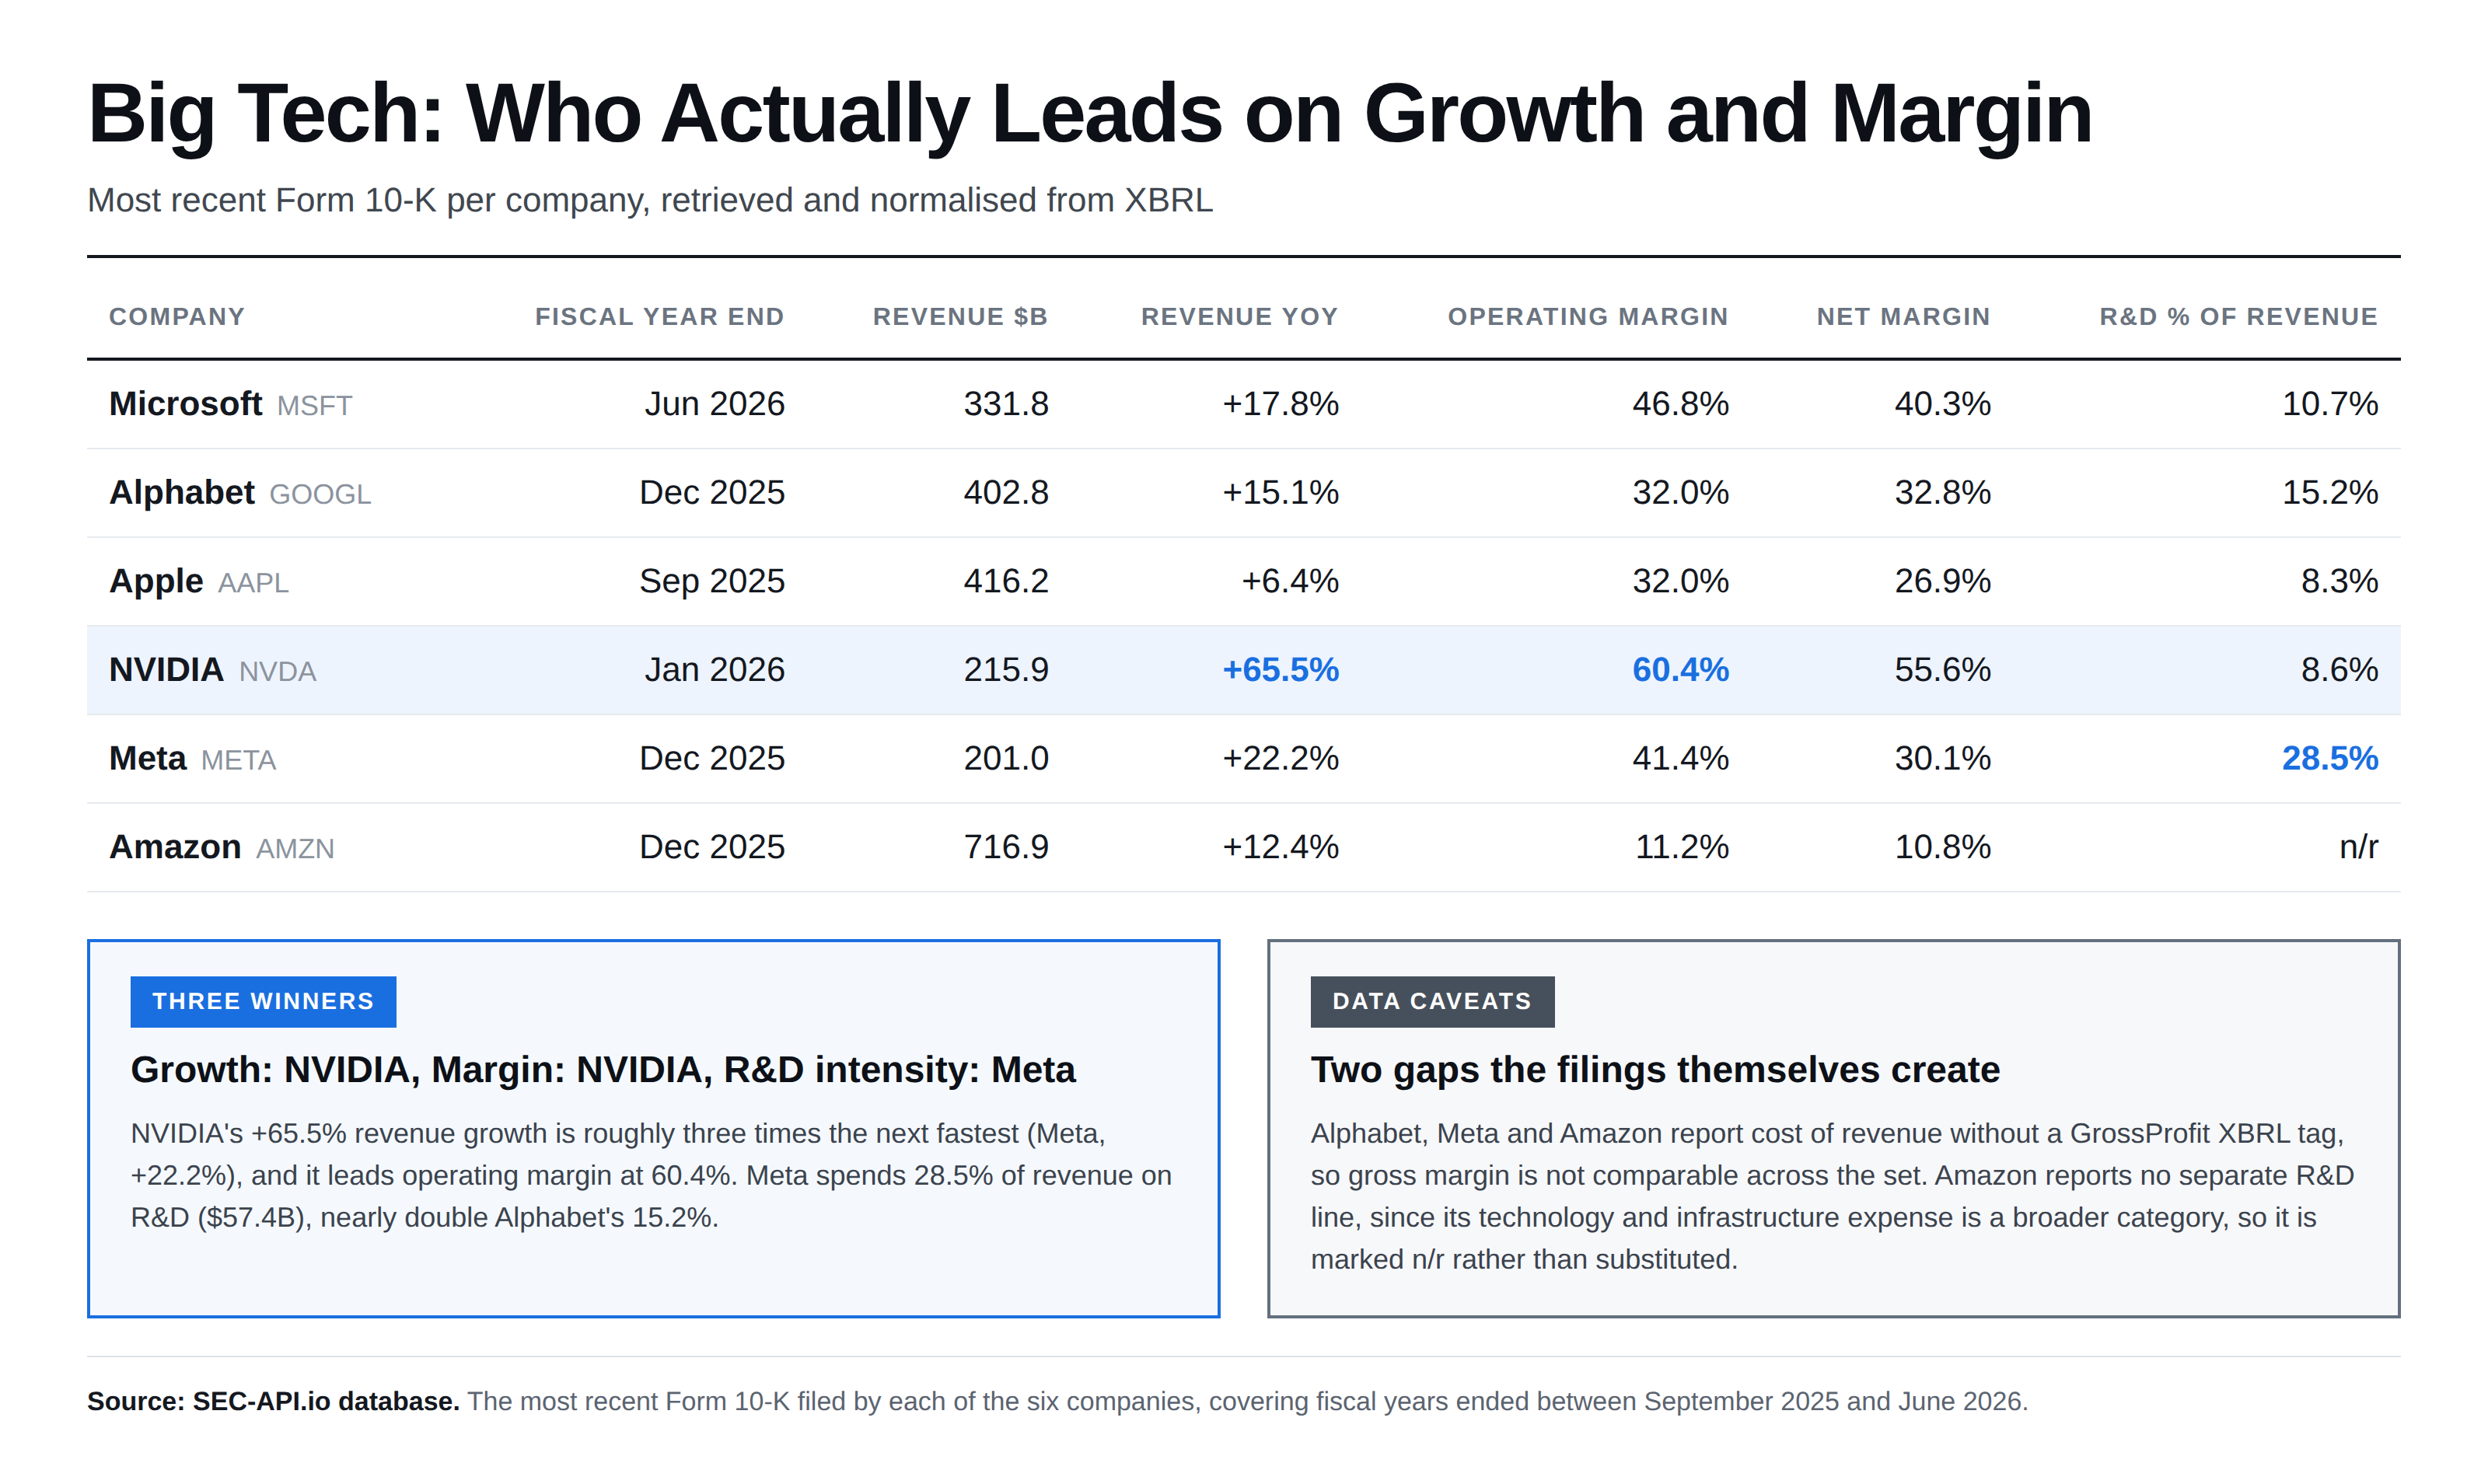
          Compare the most recent 10-K filings of Microsoft, Alphabet, Apple, NVIDIA, Meta and

          2
          Amazon. Build a table of revenue, growth, operating margin, net margin and R&D as a

          3
          percentage of revenue, and tell me who leads on each.
You get this:
Output:
- Growth leader NVIDIA at 65.5%, roughly three times the next fastest (Meta, 22.2%)
- Operating margin leader NVIDIA at 60.4%; Microsoft 46.8%; Amazon 11.2% on $716.9B revenue
- R&D intensity leader Meta at 28.5% of revenue ($57.4B), nearly double Alphabet's 15.2%
- Fiscal years are not aligned: MSFT ends Jun 2026, NVDA Jan 2026, AAPL Sep 2025, the rest Dec 2025
- Alphabet, Meta and Amazon tag no GrossProfit element; Amazon reports no separate R&D line
Source: the most recent Form 10-K filed by each of the six companies, covering fiscal years ended between 2025-09-27 and 2026-06-30.
How to screen for insider and institutional signals?
Ask this:
          1
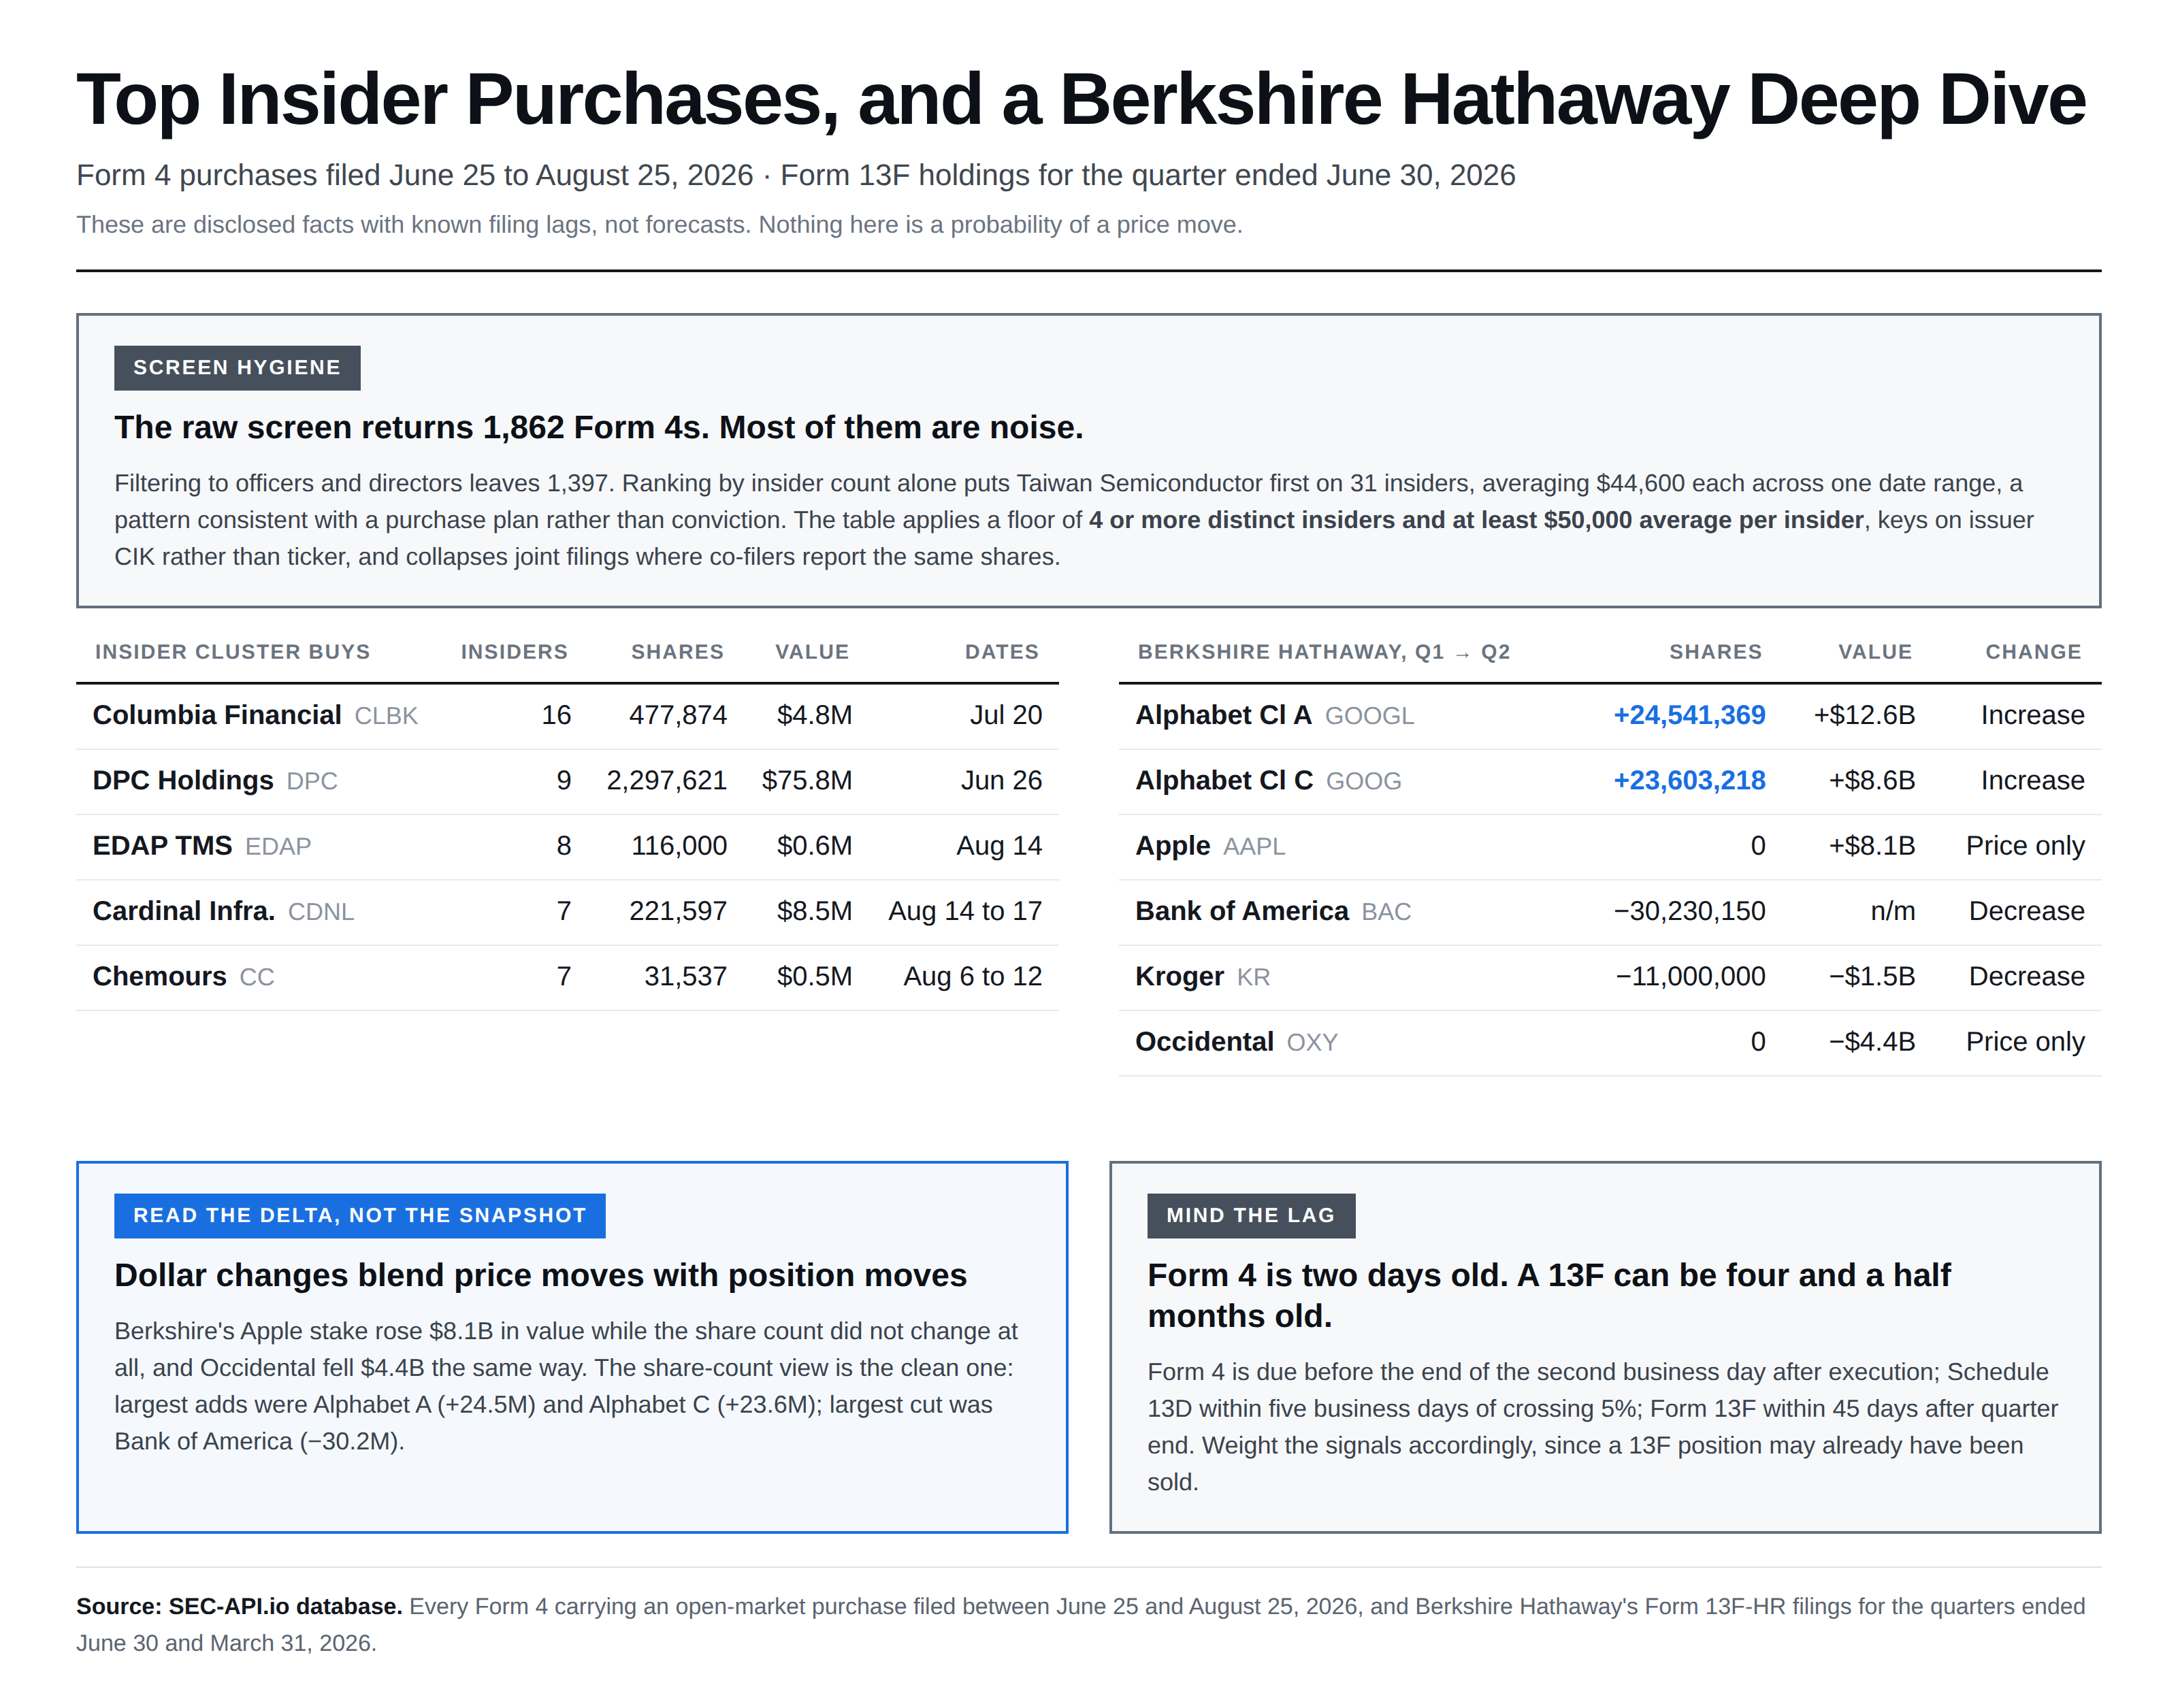
          Screen every Form 4 filed in the last 60 days for open-market purchases and rank

          2
          companies by how many distinct insiders bought. Then pull Berkshire Hathaway's last

          3
          two 13F filings and show me what changed by share count.
You get this:
Output:
- Raw screen: 1,862 Form 4s with a code-P leg in 60 days; 1,397 after restricting to officers and directors
- Unfiltered ranking is noise. Taiwan Semiconductor tops it on 31 insiders averaging $44,600 each on one date range, a purchase-plan pattern
- Filter to 4 or more distinct insiders and at least $50,000 average per insider
- Berkshire Q2 2026: $299.3B across 26 issuers, up from $263.1B; largest adds Alphabet A at 24.5M shares and Alphabet C at 23.6M; largest cut Bank of America at 30.2M
- Apple rose $8.1B in value on zero share change, so read share counts, not dollar deltas
- Key the screen on issuer CIK, not ticker: one issuer's Form 4s carried two different symbols on the same CIK
- Collapse joint Form 4s: co-filers each report the same shares, so one economic actor counts twice
Source: every Form 4 carrying a code-P leg filed 2026-06-25 to 2026-08-25, and Berkshire Hathaway's Form 13F-HR filings for the quarters ended 2026-06-30 and 2026-03-31.
How stale are Insider Trades signals?
| Signal | Form | Deadline | Freshness |
|---|---|---|---|
| Insider transactions | Form 4 | End of the second business day after execution (Rule 16a-3(g)) | Near real-time |
| Control stakes | Schedule 13D | Five business days after crossing 5% (Rule 13d-1) | Days |
| Non-control 5% stakes | Schedule 13G | Five business days (passive); 45 days after quarter end (qualified institutional and exempt), accelerating above 10% (Rule 13d-1) | Days to weeks |
| Institutional holdings | Form 13F | 45 days after quarter end (Rule 13f-1) | Up to 4.5 months stale |
Form 13F covers securities on the SEC's Official List of Section 13(f) Securities. Short positions and written options are excluded, so a 13F is not a portfolio. A position disclosed on the 45-day deadline may be already sold.
Resources and Links
Connect the data
- SEC-API.io MCP server documentation: endpoint, setup, troubleshooting
- How to Access SEC Financial Data in Claude: Tutorial with screenshots
- Get a free API key
Prompts and worked examples
- Financial Analysis Prompt Library: more prompts with its output
- Multi-year financial statements from 10-K filings
- Diff the risk factors between two annual reports
- Rank an industry on revenue, margin, R&D and capex
- Position-by-position delta between a fund's last two 13Fs
- Turn a quarterly earnings release into a one-page graphic
Underlying data
- APIs: list of endpoints reachable through the MCP server
- Datasets: bulk download of datasets
- Data Browser: search filings without writing code
- API documentation: all APIs e.g. Real-Time Stream
FAQ
Can AI analyze stocks accurately? Only when connected to a primary data source. A model answering from training data alone produces figures that are plausible and wrong. Connect it to a filings API and it retrieves and computes rather than recalls. Also, every figure traces to an accession number you can check.
What data do you need to analyze a US stock? Key are financial statements from 10-K and 10-Q filings, risk factors and MD&A from the 10-K, material events from 8-K filings, insider transactions from Forms 3, 4 and 5, institutional ownership from Form 13F, 5% stakes from Schedules 13D and 13G, compensation and governance from DEF 14A. All reachable as tools through the SEC-API.io MCP server.
How do you get the output in the format you want? Specify it. Each step adds detail. Format: "give me an Excel file", or Word, PDF, HTML, Markdown, MDX, text, a chart, an image. Graphic type: "make it a bar chart". Chart detail: "horizontal bar chart of the quarter-over-quarter change, sorted from largest decline to largest increase, on a zero-anchored axis". Visual spec: "content-dense, neutral colors, one typeface, labeled bars". Say nothing and you get prose.
How do you make a working prompt repeatable?
Tell the assistant to save it as a skill. In Claude Code it writes .claude/skills/<name>/SKILL.md, and the workflow is then available by name in every later session, with no re-prompting.
Do you need to know a company's CIK? No. A ticker or company name is enough. The assistant resolves the identifier each dataset is filed under: CIK for companies and their filings, CIK plus accession number for one specific filing, a CRD or SEC file number for investment advisers, CUSIP for positions inside a 13F. Name the identifier yourself only when the company name is ambiguous.
Are insider trades a reliable signal? Form 4 is timely, filed before the end of the second business day after execution (Rule 16a-3(g)). The transaction code matters. Code P captures open-market and private purchases and is the discretionary category. Rule 10b5-1 plan sales and option exercises are less discretionary. Screen on code and on the number of distinct insiders, not on aggregate dollar volume.
Which AI assistants can connect to SEC filing data? Any assistant supporting the Model Context Protocol. For details see SEC-API.io MCP server documentation.
Can the AI produce charts and Excel files, not just text? Yes, if you specify the format. Ask for an Excel file, chart, PDF, HTML or image, and add the chart type and visual specification. Every graphic in this article was produced this way from filing data.
Educational content about accessing and analysing SEC filing data. Not investment advice, legal advice, or a recommendation to buy or sell any security. Last updated: 25 August 2026